chesterrep.openrepository.comchesterrep.openrepository.com/cdr/bitstream/10034/60… · web...
TRANSCRIPT
1
Running head: Sex differences in relationships
Managing Relationship Decay:
Network, Gender and Contextual Effects
Sam B. G. Roberts1 and R. I. M. Dunbar2*
1Department of Psychology, University of Chester, UK
2Department of Experimental Psychology, University of Oxford, UK
*Corresponding author: [email protected]

2
Abstract
Relationships are central to human life strategies and have crucial fitness consequences. Yet,
at the same time, they incur significant maintenance costs that are rarely considered in either
social psychological or evolutionary studies. Although many social psychological studies
have explored their dynamics, these studies have typically focused on a small number of
emotionally intense ties, whereas social networks in fact consist of a large number of ties
which serve a variety of different functions. In this study, we examined how entire active
personal networks changed over 18 months across a major life transition. Family
relationships and friendships differed strikingly in this respect. The decline in friendship
quality was mitigated by increased effort invested in the relationship, but with a striking
gender difference: relationship decline was prevented most by increased contact frequency
(talking together) for females but by doing more activities together in the case of males.
Keywords: Gender differences; relationship maintenance; personal networks; family;
friendship; emotional closeness
3
Social relationships play an especially important role in our social arrangements, and,
both historically in recent evolutionary time and in contemporary traditional and post-
industrial societies, have very significant fitness consequences. The quality of social
relationships that individuals maintain with others is related to psychological wellbeing
(Kawachi & Berkman, 2001; Furukawa et al., 1998) and, in both primates (Silk et al., 2009)
and humans (Holt-Lunstad et al., 2010; Oesch & Dunbar, 2015), there are well-established
links between social relationships, morbidity and mortality. Examining individual differences
in the strategies people use to maintain different types of ties over time, and the cost-benefit
trade-offs between these different types of ties, may provide valuable insight into the adaptive
significance of successfully managing social relationships (Baumeister & Leary, 1995;
Sutcliffe et al., 2012; Nettle et al., 2013).
Understanding why relationships exist (their functions), the costs incurred in
maintaining them (an essential component in the cost/benefit basis of all evolutionary
explanations) and how and why they fail (despite the benefits they provide) is as relevant to
relationships in small scale societies as they are to those in post-industrial societies, since
these are all likely to be underpinned by the same deep psychological mechanisms
irrespective of cultural differences in their surface structure between societies. Longitudinal
studies can disentangle cause and effect more effectively than cross-sectional studies and can
examine how specific life events that involve physical or social separation affect the stability
of relationships over time (Crosnoe, 2000). Such transitions shed light on the costs involved
in maintaining different types of relationship over time and space. Transitions put friendships
under pressure for two reasons. First, once people become separated by geographical
distance, they have to make an active effort to meet up or contact old friends. Second,
moving to a new location provides opportunities to make new friends and these take up time
and energy that would otherwise be devoted to maintaining old friendships.

4
One theoretical model that has frequently been used to understand what happens to
social relationships during periods of transition is the Relationship Investment Model
(Rusbult, 1983) (e.g. Oswald & Clark, 2003; van Duijn et al., 1999). According to this model,
commitment to a relationship is a function of satisfaction with the relationship, plus
investments put into the relationship minus the possible alternatives to the relationship.
Moving away may decrease satisfaction with old relationships due to an increase in the
availability of alternatives (new potentially more attractive friends) and an increase in
maintenance costs (when physically separated).
However, the Relationship Investment Model does not explicitly recognise that there
may be constraints on the number of social relationships that can be maintained at a particular
level of emotional intensity. The notion of constraints on network size has its origins in two
divergent areas of research. It was raised early in the study of social networks (Bernard &
Killworth, 1973; Pool & Kochen, 1978) but the precise nature of these constraints and how
they influence social relationships has not been fully explored in the field of social network
analysis (Roberts, 2010). In contrast, the notion of constraints on the number of social
relationships individuals can maintain is a central feature of the social brain hypothesis
(Dunbar, 1992, 1998). This argues that the key selection pressure driving the evolution of
large brains in both primates and humans is the complexity of managing long-term social
relationships in a stable social group (Dunbar & Shultz, 2007). In primates, relationships are
maintained by grooming a small set of key allies, but the amount of time primates can devote
to grooming is limited by competing demands for time (Dunbar et al., 2009). Because of this,
the proportion of the day available for grooming is limited, and this places an upper limit on
the size of primate groups (Lehmann et al., 2007).
Human relationships also have a tendency to decay over time (Burt, 2000, 2002;
Cummings et al., 2006). To prevent this decay requires time-consuming maintenance
5
behaviours, principally communication and joint activities (Cummings et al., 2006; Oswald &
Clark, 2003). As time is an inelastic resource (Nie, 2001), this need to maintain relationships
places an upper limit on the number of relationships that can be maintained at each level of
emotional intensity (Roberts, 2010; Sutcliffe et al. 2012). Whilst the implications of this time
constraint has been extensively explored in primates (Lehmann et al., 2007), much less is
known about how it acts to limit the number and quality of relationships individuals can
maintain with others in humans (Roberts, 2010; Sutcliffe et al., 2012).
Although there has been a longstanding interest within social psychology on studying
how social relationships change over time (Feld et al., 2007; Suitor et al., 1997), the focus of
this research has been limited almost entirely to very close relationships (parent-offspring,
romantic partner, best friend). Yet we have many more kinds of relationships than just these,
including those with extended kin and with friends of different degree, and these have hardly
ever been studied. It has long been recognised that social networks are far from being
homogenous, but rather consist of a number of different types of ties that vary in emotional
quality. Granovetter (1973) suggested that: “the strength of a tie is a (probably linear)
combination of the amount of time, the emotional intensity, the intimacy (mutual confiding)
and the reciprocal services which characterize the tie” (p. 1361). The well-known dichotomy
of ‘strong’ and ‘weak’ ties was only presented as a “rough, intuitive basis” (p. 1361) for
categorising ties (Granovetter, 1973).
Nonetheless, while this conceptualization of ties this has proved useful in certain
respects – for example the strength of weak ties for areas such as job search (Granovetter,
1983) – this approach typically fails to recognise that the differences between ties of different
strength are not simply linear. Instead, there are qualitative differences in types of ties,
resulting in distinct groupings of ties at similar levels of emotional intensity or contact
6
frequency (Hill & Dunbar, 2003; Zhou et al., 2005; Sutcliffe et al., 2012). In effect, social
networks consist of a series of relationship circles (each in turn split evenly between family
and friends: Dunbar et al., 2014), with each successive circle containing more individuals
than the one inside it, but with relationships of declining emotional quality (Hill & Dunbar,
2003; Zhou et al., 2005; Roberts & Dunbar, 2011; Sutcliffe et al., 2012). These circles bear a
remarkably consistent scaling relationship to each other, with successive circles being ~3
times larger than the one inside it (Zhou et al., 2005), a relationship also noted in the social
structure of other mammals that have multi-level social systems (Hill et al., 2008). The
relevance of this for the nature of friendships, and for the pattern of relationship change over
time, has not as yet been widely appreciated (Sutcliffe et al., 2012).
In addition to the strength of the tie, an important factor in how relationships change
over time is the distinction between family and friends. Hamilton’s rule of kin selection
(Hamilton, 1964) states that behaviour towards others should be influenced by the relative
costs and benefits of the behaviour, weighted by the coefficient of genetic relatedness. In line
with this rule, people are more likely to help kin than friends, and this help is less contingent
on the personal relationship between the two individuals (Espinoza, 1999; Wellman &
Wortely, 1990; Madsen et al., 2007; Curry et al., 2013). In terms of the relationship between
contact frequency and emotional closeness, affinal kin follow exactly the same relationship as
genetic kin rather than resembling friends (Burton-Chellew & Dunbar, 2011), and we here
therefore include genetic and affinal kin in the same category (kin).
In this study, we examined the changes in relationship quality in a group of high
school students making the transition from school to university or work. This transition
represents one of the major life transitions, and thus provides a particularly acute example of
the processes of interest to us. We extend previous research in this area in three key ways.
7
First, we recruited the students whilst they were still at school, so we have information on
their social relationships before they left school, as well as what happened to these
relationships in the year after they left school. In contrast, most previous studies (Berman &
Sperling, 1991; Hays & Oxley, 1986; Kenny, 1987; Oswald & Clark, 2003; Paul & Brier,
2001) only started when the participants were already at university. Retrospective studies of
this kind risk overlooking some changes. Second, previous longitudinal work has focused on
a relatively small number of strong ties (Oswald & Clark, 2003; Wellman et al. 1997); yet
weak ties also have a tendency to decay over time (Milardo & Wellman, 1992; Burt, 2000).
Moreover, decay has typically been studied simply in terms of whether ties are named in the
network at successive time periods (Burt, 2000; Morgan et al. 1996). In this study, we
examined how the emotional quality of ties within the entire active network changed over
time. Third, we explicitly explore the effect of distance on how social relationships change
during this period. Around half the participants stayed in their home town to go to university
or to work, and half went to university elsewhere. Thus, we are able to disentangle whether it
is leaving the home town that causes the relationships to change, or simply the opportunities
provided by a different social environment. In this study, we examine the effect of proximity
on relationships with both friends and relatives.
We define the active network as all relatives plus all unrelated individuals with whom
the participant feels that they have a genuine, personal relationship (Roberts et al., 2009;
Sutcliffe et al., 2012). Thus we are able to explore how relationships with both close and
distant friends, and all family members, change during the transition from school to
university or work. Although our sample size is modest, this should be set against the fact
that we track all these individuals and all their relationships in considerable detail across 18
months. To the best of our knowledge, this is the first time such an extensive personal
network has been studied prospectively during a life transition. Studying the entire active
8
personal network allows for the effects of constraints to be examined more extensively, as
there may be trade-offs between different parts of the social network (for example, old school
friends versus new university friends, close friends versus more distant friends).
We test four hypotheses as to how the ties in the personal network will be affected by
the transition from school to university. First, previous studies have shown that family
relationships appear to be more resilient to the life transitions (e.g. Sullivan & Sullivan, 1980;
Pipp et al. 1985; Kenny, 1987; van Duijn et al., 1999; Burt, 2000), and we test whether this is
so in our sample: we predict that friendships will decay more in terms of a decrease in
emotional closeness than relationships with family members (H1). Second, we examine the
effect of distance on the decay in theses relationships. Distance makes it difficult to maintain
friendships, and also makes visits back to their home town more costly, both in terms of
travel time and money. We thus predict no effect of staying or leaving the home town on the
strength of relationships with family, but that there will be a greater decay in friendships for
leavers than for students that stay in their home town to go to university (H2). Third, we
predict that there will be an effect of relationship strength on the tendency of the relationship
to decay (H3). Thus, we expect relationships in the ‘inner’ layer of the network (i.e., relatives
who are genetically more closely related and friends whom the participant has known for
longer) to be more resistant to decay. Fourth, we predict that participants who add more
friends to the network will show a greater decline in closeness to existing friends, due to the
fact that the time and energy invested into the new friends comes at the expense of time and
energy that has been put into maintaining old friendships (H4). Finally, we predict that
increased interaction with the person concerned is necessary to maintain a relationship after
the transition, otherwise relationship quality will deteriorate (H5).
Methods
9
Participants
Thirty students (15 females; average age = 18.1±0.48SD, range 17-19 years) who were in the
final year of high school were recruited for the study. All the participants lived in the same
large city in England. On average, participants had lived in the city for 189.0±47.2SD months
(~16 years). The city is ethnically diverse, and in keeping with this diversity, 17 of the
participants were White, 11 were of Pakistani origin and 2 were of Black African origin.
Participants were asked to complete detailed questionnaires on their complete active
personal network at the beginning of the study (t1), and then at two further time points: 9
months (t2) and 18 months (t3: end of first calendar year at university, or equivalent). Of the
30 participants who started the study at t1, 29 (96.7%) completed the questionnaire at t2, and
25 (83.3%) did so at t3. 25 participants (12 females; 15 White, 8 Pakistani and 2 Black
African) completed the entire study. On average, they had lived in the city for 186.8±50.7
months (15.5 years). All the analyses in this study were carried out on the 25 participants who
completed the entire study. These 25 participants listed a total of 1,291 network members.
Where appropriate, we follow standard terminology in network science by referring to a
participant as ego and network members as alters.
At month 4 of the study, participants took their final school exams (A-levels) and left
the school. Of the 25 participants who completed all three waves of data collection, six of the
stayed in in the city and worked, not going to university (non-university stayers), eight went
to one of the two universities in the city (university stayers) (all 14 continued to live at home
with their parents) and 11 went to universities elsewhere in England (leavers).
The study was approved by University of Liverpool Ethics Board.
Social Network Questionnaire

10
Participants were first asked to provide demographic information: age, gender, ethnic
origin and length of time living in the city. They were then asked to list all their known and
living relatives, including both genetic and affinal kin. A list of relatives, with descriptions
out to first cousin (e.g. your great-aunt is an aunt of your father or mother) was provided to
help prompt recall of more distant relatives. Both genetic and affinal kin are referred to as
kin. Participants were also asked to list all friends ‘for whom you have contact details and
with whom you consider that you have some kind of personal relationship (friend,
acquaintance, someone you might interact with on a regular basis at school, work or
university)’. This section of the questionnaire had the heading ‘Friends’ and this term is also
used in this paper. The use of this term does not imply anything about the strength of the
relationship between participant and the friend, which is instead measured directly through a
number of relationship quality indices.
To help prompt their memory, the participants were asked to look through any lists of
addresses or phone numbers that they had (e.g. address books, email address book, contacts
list in mobile phone). For kin, participants were asked to provide the following details of the
relationship: i) type of relation (e.g. father, mother, sibling, cousin); ii) genetic relationship
(genetic, step, adoptive, related by marriage); iii) nature of genetic relationship (maternal,
paternal or neither). For friends, participants were asked how long they had known the friend
(in months). For both kin and friends, participants were asked how emotionally close they felt
to the each network member on a scale of 1 (someone you never see or hear from) to 10
(someone with whom you have a deeply-emotional relationship, perhaps someone you might
go to for advice or comfort in times of major emotional trauma or crisis). For genetic kin, the
coefficient of genetic relatedness (r) was calculated for each relative (0.5 for parents and
siblings, 0.25 for grandparents etc.). Affinal kin (in-laws) are by definition not genetically
related to the participant, so their coefficient of genetic relatedness is zero.
11
Participants were then asked two questions designed to distinguish those strong
relationships in the inner core of the personal network from the weaker relationships with
other family and friends. We asked the participants to identify ‘all individuals from whom
you would seek advice, support or help from in times of severe emotional or financial
distress’. We also asked participants to list, in addition to the network members listed in
response to the first question, all individuals ‘whose death you would find personally
devastating’. These two questions have previously been used to establish the ‘support group’
and ‘sympathy group’ layers of the social network respectively (Buys & Larson, 1979;
Dunbar & Spoors, 1995; Binder et al., 2012; Sutcliffe et al., 2012). In this study, the support
group and sympathy group were combined and referred to as the inner layer (equivalent to
Granovetter strong ties). All other alters were defined as the outer layer of the network
(equivalent to Granovetter weak ties).
In examining how ties change over time, an important question that arises is how to
characterise the strength of a particular tie. A factor analysis of different measures of
interpersonal closeness identified two key components: ‘behaving close’ and ‘feeling close’
(Aron et al., 1992). In this study, we include measures for both of these components. In terms
of ‘feeling close’, Marsden and Campbell (1984) examined a range of measures and
concluded that a measure of the emotional intensity of a relationship is the best indicator of
tie strength. Thus, we took emotional closeness, measured on a 1-10 scale, as an indication of
the emotional intensity of the relationship. This measure is simple for the participants to use
when rating a large number of network members and the measure (or a similar one) has been
used in a large number of previous studies by different research groups (e.g. Korchmaros &
Kenny, 2001; Hill & Dunbar, 2003; Cummings et al., 2006; Jeon & Buss, 2007; Roberts et
al., 2009). We also used another well-established measure, the Subjective Closeness Index
12
(Berscheid et al., 1989), but as this correlated strongly with the emotional closeness measure
(r = 0.90, p < 0.001), we report only the latter.
To examine the ‘behaving close’ component, we used two measures – frequency of
contact and number of different activities done together. These were used as indicators of
participants engaging in relationship maintenance behaviours. As in previous studies (Hill &
Dunbar, 2003; Roberts et al., 2009), participants listed how many days ago they last made
contact with each network member, either face-to-face or by other means (e.g. phone, email).
Communication frequency is associated with the strength of a relationship (Mok et al., 2007)
and the probability of receiving support (Kana'Iaupuni et al., 2005). Participants were also
asked how many different types of activities they had done together in the last 12 months at
t1, and the last 6 months at t2 and t3 (as the questionnaires at t2 and t3 were only given six
months apart). The activities listed were sport or physical activity (e.g. football, keep fit,
mountain biking), leisure activity (e.g. shopping, going to cinema, going to see a gig), social
activity (e.g. going to the pub, going round to their flat/house, meeting at a social event),
work activity (e.g. going to classes or lectures, studying together, working together) and
going on holiday (going away for more than one night). Participants indicated with a ‘yes’ or
‘no' whether or not they had participated in each of these activities. The answers were then
summed to give an activity score, which ranged between 0 (no activities) and 5 (all
activities). Relationships in which a greater number of activities are done together tend to be
more emotionally intense (Wellman & Wortely, 1990) and more resistant to decay over time
(Degenne & Lebeaux, 1990).
The Social Network Questionnaire was completed by the participants at month 1 (t1),
month 9 (t2), and month 18 (t3). At t2 and t3, the initials, gender and nature of the family
relationship of all the network members listed at t1 were provided to aid recall and ensure
that participants provided updated information on emotional closeness and location about all
13
the network members listed at t1. At t2 and t3, participants were also requested to provide
information on any new friends they had made since last completing the questionnaire.
Statistical Analysis
To examine how emotional closeness between participants and network members
changed over time, we used hierarchical linear growth modelling, also known as multilevel
modelling. In this study, 1,291 network members were clustered within 25 participants, and
the three time points were clustered within network members. Thus these data points could
not be treated as independent samples in an ordinary least squares regression analysis (Bryk
& Raudenbush, 1992). Multilevel analysis is a modified form of multiple linear regression
designed to deal with data with a hierarchical clustering structure, and has been extensively
used in analysis of personal network data (e.g. Gierveld & Perlman, 2006; van Duijn et al.,
1999; Wellman & Frank, 2001).
For models 1-7, emotional closeness was the dependent variable and we used a three
level model structure. Starting at the lowest level of measurement, Level 1 represents time –
the repeated observations of individual network members at t1, t2 and t3; Level 2 represents
network member characteristics (e.g. alter’s gender, location) and tie characteristics (e.g.
length of time known participant has known that network member); and Level 3 represents
participant characteristics (e.g. ego’s gender, location, size of network). In model 8, change in
emotional closeness was the dependent variable and so a two-level model was used: Level 1
was network member/tie characteristics and Level 2 was participant characteristics. For all
models, we used a linear model structure, as the dependent variable was continuous
(emotional closeness or change in emotional closeness). Using a linear model structure

14
allowed for comparability across the different models in this paper, and with previous
literature (e.g. Cummings et al. 2006).
In models 1-7, the coefficients for the level 2 and level 3 variables represent cross-
sectional associations. Thus, for example, a coefficient for participant gender and emotional
closeness indicates whether, overall, there was a difference between the male and female
participants in their emotional closeness to network members. The interactions with time
represent variables that predict changes in emotional closeness over time. Thus, an
interaction between time and participant gender indicates whether there was an effect of
participant gender on how their emotional closeness with network members changed over the
course of the study. All the variables included in the construction of the models are listed in
Table 2 below.
We followed the guidelines detailed by van Duijn et al. (1999) in guiding our
selection of the models. Thus, we started with an empty model, including only the intercept
and the error term for all levels. This gives an indication of the amount of variance present at
the three levels. We then used a forward selection procedure (Bryk & Raudenbush, 1992)
involving three steps: i) adding fixed explanatory variables (including interaction terms
between them); ii) adding cross-level interaction terms; iii) adding random intercepts, random
slopes and covariance’s between the random slopes. A summary of all models is provided in
Table 1.
INSERT TABLE 1 HERE
In all models, maximum likelihood (ML) estimation was used, rather than restricted
maximum likelihood (REML), as this allows comparison of the deviance of different models
(Tabachnick & Fidell, 2007). We used Schwarz’s Bayesian criterion (BIC) to compare the
goodness of fit of the models, whilst correcting for the number of parameters used (Kuha,
15
2004). The difference in deviance of two models can be used as a test statistic with a χ2
distribution, with the number of different parameters as the degrees of freedom (Hayes,
2006). Based on the BIC criterion, we built the most parsimonious models possible, rather
than including variables even if they did not significantly improve the goodness of fit of the
models. To model the covariance, we used a heterogeneous first-order autoregressive
structure (ARH1), which is particularly appropriate for longitudinal data, as it assumes that
the correlations between repeated measurements are highest at adjacent time points (Field,
2013).
All continuous variables were Z-transformed, to allow for comparability across
variables measured on different scales. Kin and friendship network sizes were grand-mean
centred (Models 2 and 3). This allows the intercept to be interpreted as the average outcome
for each group, rather than using a score of zero which is not meaningful for network size.
Changes in activity score and changes in contact frequency were group mean centred – a
mean score was calculated for each participant, and the individual network members’ scores
were centred around this participant mean (Model 8). This controls for individual differences
in these variables between the participants. An alpha level of 0.05 was used for all statistical
tests. All significance tests were two-tailed, except for the variance parameters. As these are
by definition non-negative, when testing the null hypothesis that the variance of a random
intercept or random slope is zero, the alternative hypothesis is by definition one-sided
(Snijders & Bosker, 1999).
Results
Basic Network Properties at Time 1
16
The descriptives for the main variables are given in Table 2. Mean network size at t1
was 51.68 (SD = 27.58, Mdn = 46) with a range of 19-132. We first tested for normality,
using the Shapiro-Wilk test, which is more accurate than the commonly used Kolmogorov-
Smirnov test (D'Agostino & Belanger, 1990). Both kin (Shapiro-Wilk W30 = 0.86, p = 0.001)
and friendship network size (W30 = 0.90, p = 0.01=0.007) were not normally distributed, so
non-parametric tests were used. We then tested whether network size varied according to
gender and ethnic group. There was no significant difference in the size of the kin network
between white (Mdn = 19), and black/Asian participants (Mdn = 14) (Mann-Whitney U =
65.5, p = 0.66). Although white participants (Mdn = 35) tended to have a larger friendship
network than the Asian or black participants (Mdn = 23), the difference was not formally
statistically significant (U = 99.5, p = 0.06). The difference in the size of the size of the kin
network did not differ significantly between male (Mdn = 12) or female (Mdn = 19)
participants (U = 72.0, p = 0.10). Nor was there a significant difference in the size of the
friendship network between male (Mdn = 29) and female (Mdn = 26) participants (U =
108.50, p = 0.88).
INSERT TABLE 2 HERE
H1: Do friendships decline in emotional intensity over time more than family relationships?
H1 predicted that friendships would decay more than relationships with family. Model
1 tested this by examining the effect of time on emotional closeness levels for family and
friends. The type of relationship had a significant effect on how emotional closeness changed
over time, as indicated by the significant interaction in the model between time and
relationship type (see Table 3 and Fig. 1). There was also a significant random effect of time,
indicating that there was significant variation between the participants in the effect of time on

17
changes in emotional closeness. Separate models were then used to examine how emotional
closeness changed over time for kin and friends. There was a significant increase in
emotional closeness over time for family (b = 0.27, t542.10 = 7.28, p < 0.001) and a significant
decrease in emotional closeness over time for friends (b = -0.62, t786.57 = -15.23, p < 0.001).
Thus, H1 was supported: friendships decayed more than relationships with family between t1
and t3.
INSERT TABLE 3 HERE
INSERT FIGURE 1 HERE
An alternative measure of relationship quality is whether alters moved between
network layers. Compared to kin, friends were significantly more likely to move from the
inner to the outer layer over the course of the study: of 145 kin in the inner layer at t1, 102
(70.3%) were still in the inner layer at t3, whereas only 69 of the 142 friends in the inner
layer at t1 (48.6%) remained in the inner layer at t3 (χ2 = 14.10, df=1, N = 287, p < 0.001).
Thus, there was not just a quantitative decline in emotional closeness for friends over the
course of the study, but also the relationships changed in a qualitative way.
We used separate multilevel models for kin and for friends to examine how these
movements from the inner to the outer layer were associated with changes in emotional
closeness. For simplicity, we report only whether there was a significant effect of time on
emotional closeness from t1 to t3. For network members who stayed in the inner layer from
t1 to t3, there was no significant change in emotional closeness (Fig. 2a). This was the case
both for friends (b = -0.13, t67.05 = -1.32, p = 0.19) and for kin (b = -0.08, t95.69 = -1.47, p =
0.16). Moving to the outer network layer was associated with a significant decline in
emotional closeness for friends (b = -1.22, t76.93 = -7.48, p < 0.001), but not for kin (b = -0.02,
t48.51 = -0.15, p = 0.88). Note that the major movement of network members from the inner to
18
the outer layer of the personal network occurred between t1 and t2, rather than between t2
and t3 (Fig. 2b). Of those network members who were in the outer layer at t1 (340 kin and
627 friends), just 40 (11.8%) kin and 42 (6.7%) friends moved into the inner layer at t3. Thus,
it was significantly less common for network members to move from the outer to the inner
layer of the network, than from the inner to the outer layer (χ2 = 169.79, df=1, N = 1254, p <
0.001).
INSERT FIGURE 2 (a & b) HERE
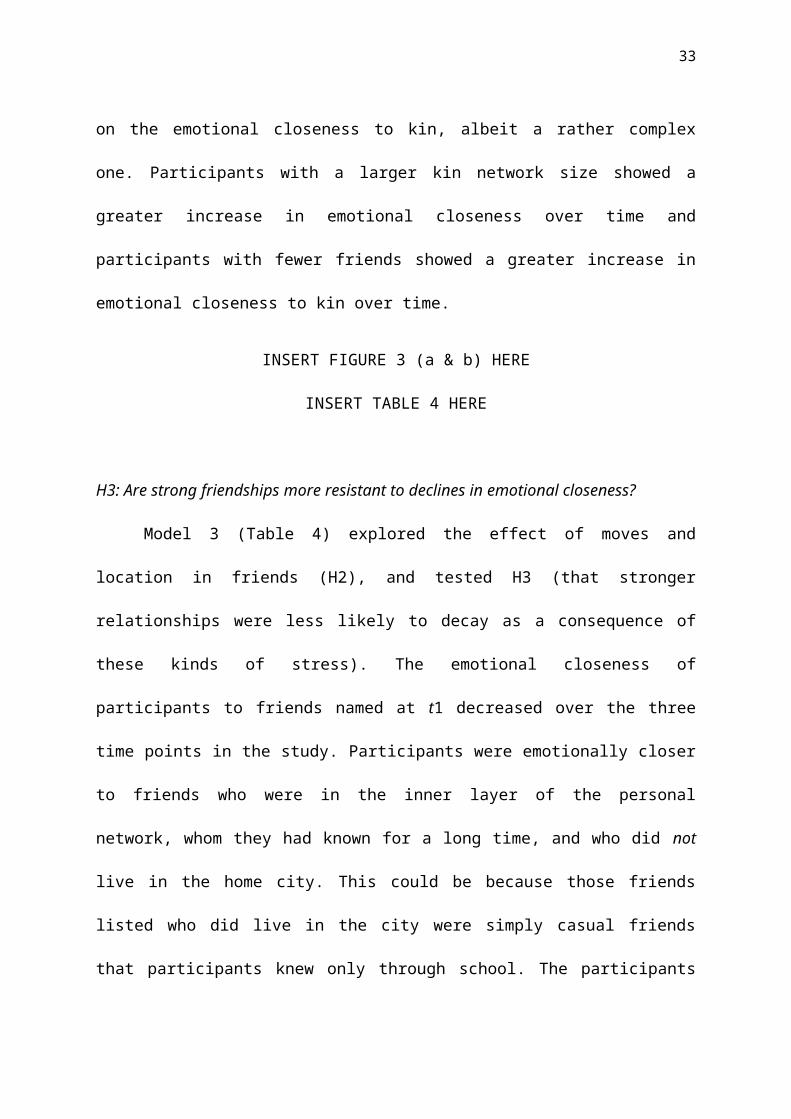
H2: Does emotional closeness to family increase more in those who move further away?
H2 predicted that whether a participant stayed in the home city or moved away would
have an effect on subsequent emotional closeness to friends, but not to kin relations. The
results are presented in Table 4. In Model 2 (kin), time was positively related to emotional
closeness: the emotional closeness of the participants to kin increased over the three time
points in the study. In terms of network member characteristics, participants were
emotionally closer to network members who were more closely genetically related to them
and those who were in the inner network layer. Participants with larger kin networks tended
to have lower emotional closeness to kin, whereas participants with smaller friendship
networks tended to have lower emotional closeness to kin.
There was no significant interaction between time and level of genetic relatedness, so
there was no tendency for the participants to become closer (or less close) to kin who were
more closely related over the course of the study. If anything, kin at the outer layers of the
personal network showed a greater increase in emotional closeness over time than those in
the inner layers. However, time interacted with both the location of the participant and
whether or not they went to University. Leavers, and non-university stayers, showed an
19
increase in emotional closeness over time, whereas university stayers showed a decrease (Fig.
3a). Thus, H2 was not supported: the location of the student did have an effect on the
emotional closeness to kin, albeit a rather complex one. Participants with a larger kin network
size showed a greater increase in emotional closeness over time and participants with fewer
friends showed a greater increase in emotional closeness to kin over time.
INSERT FIGURE 3 (a & b) HERE
INSERT TABLE 4 HERE
H3: Are strong friendships more resistant to declines in emotional closeness?
Model 3 (Table 4) explored the effect of moves and location in friends (H2), and
tested H3 (that stronger relationships were less likely to decay as a consequence of these
kinds of stress). The emotional closeness of participants to friends named at t1 decreased over
the three time points in the study. Participants were emotionally closer to friends who were in
the inner layer of the personal network, whom they had known for a long time, and who did
not live in the home city. This could be because those friends listed who did live in the city
were simply casual friends that participants knew only through school. The participants were
emotionally closer to female friends, as compared to male friends.
In contrast to Model 2, friendship network sizes were not significantly related to
emotional closeness. There was also no significant effect of the amount of time the
participant had been living in the home city on the degree of emotional closeness to friends.
There were only two significant interactions with time. First, participants that went to
university showed a greater drop in emotional closeness to friends than those that did not go
to university. Nonetheless, those that did not go to university still showed a significant drop
in emotional closeness over time (Fig. 3b). Further, there was no significant interaction
20
between leaving or staying in the home city and change in emotional closeness over time.
Thus, H2 was not supported: for those going to university, the location of the university did
not impact on changes in emotional closeness to friends. Second, female participants, as
compared to male participants, showed a greater drop in emotional closeness to friends over
the course of the study.
H3 predicted that stronger relationships will be less likely to decay. However, there
was no significant interaction between time and two important measures of the strength of the
relationship at t1 (whether or not the friend was in the inner layer, and how long the
participant had known the friend). Thus friendships that had lasted a long time, and
friendships that participants defined as being in the inner layer of their personal networks,
were not more resistant to decay in emotional closeness, as compared to more recent
friendships or friendships in the outer layer of the network. There was a significant random
effect of time, indicating that there was significant variation between participants in the effect
of time on changes in emotional closeness to friends.
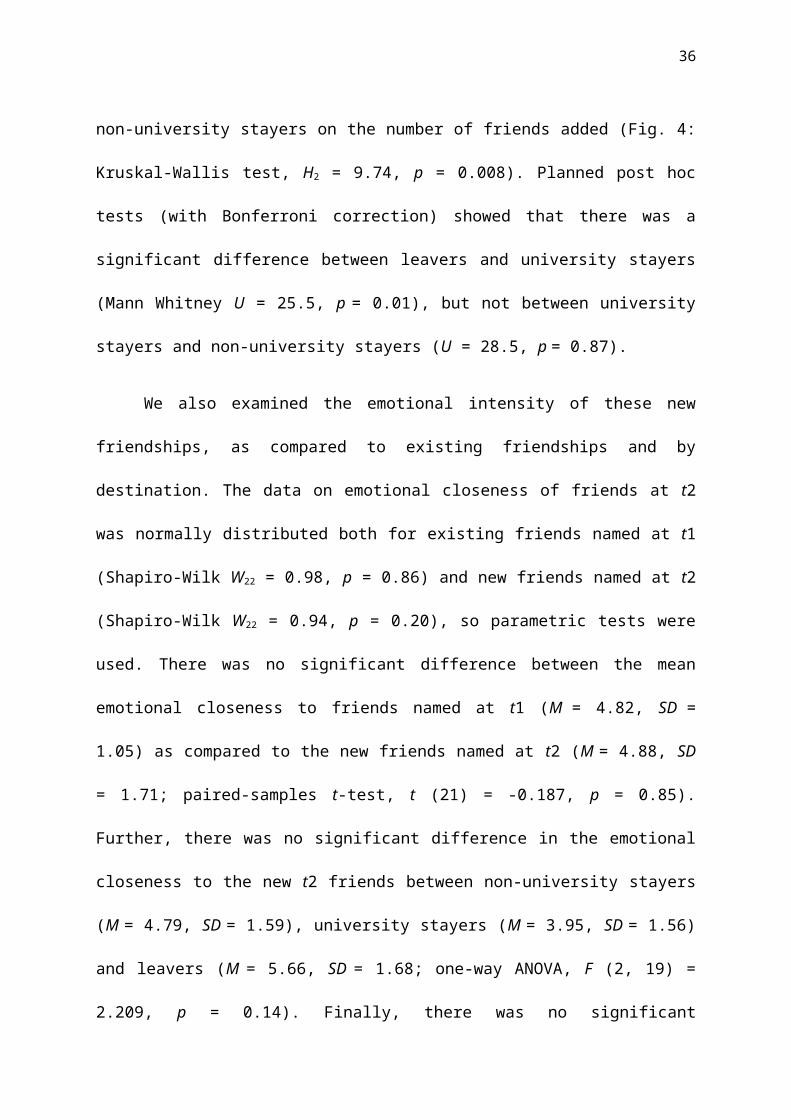
H4: Is the drop in emotional closeness to existing friends at Time t2 greater if more new
friends have been added?
The data on the number of friends added at t2 was not normally distributed (Shapiro-
Wilk W29 = 0.85, p = 0.001), so non-parametric tests were used. Overall there was a
significant difference between leavers, university stayers and non-university stayers on the
number of friends added (Fig. 4: Kruskal-Wallis test, H2 = 9.74, p = 0.008). Planned post hoc
tests (with Bonferroni correction) showed that there was a significant difference between
leavers and university stayers (Mann Whitney U = 25.5, p = 0.01), but not between university
stayers and non-university stayers (U = 28.5, p = 0.87).
21
We also examined the emotional intensity of these new friendships, as compared to
existing friendships and by destination. The data on emotional closeness of friends at t2 was
normally distributed both for existing friends named at t1 (Shapiro-Wilk W22 = 0.98, p = 0.86)
and new friends named at t2 (Shapiro-Wilk W22 = 0.94, p = 0.20), so parametric tests were
used. There was no significant difference between the mean emotional closeness to friends
named at t1 (M = 4.82, SD = 1.05) as compared to the new friends named at t2 (M = 4.88, SD
= 1.71; paired-samples t-test, t (21) = -0.187, p = 0.85). Further, there was no significant
difference in the emotional closeness to the new t2 friends between non-university stayers (M
= 4.79, SD = 1.59), university stayers (M = 3.95, SD = 1.56) and leavers (M = 5.66, SD =
1.68; one-way ANOVA, F (2, 19) = 2.209, p = 0.14). Finally, there was no significant
correlation between the number of friends added at t2 and the emotional closeness of these
new friends (r = -.065, p = 0.77). Thus the new friends added at t2 were no less emotionally
close than existing friends, and participants who added more friends at t2 did not merely add
lots of casual acquaintances, but friends of the same level of emotional intensity as existing
friends.
INSERT FIGURE 4 HERE
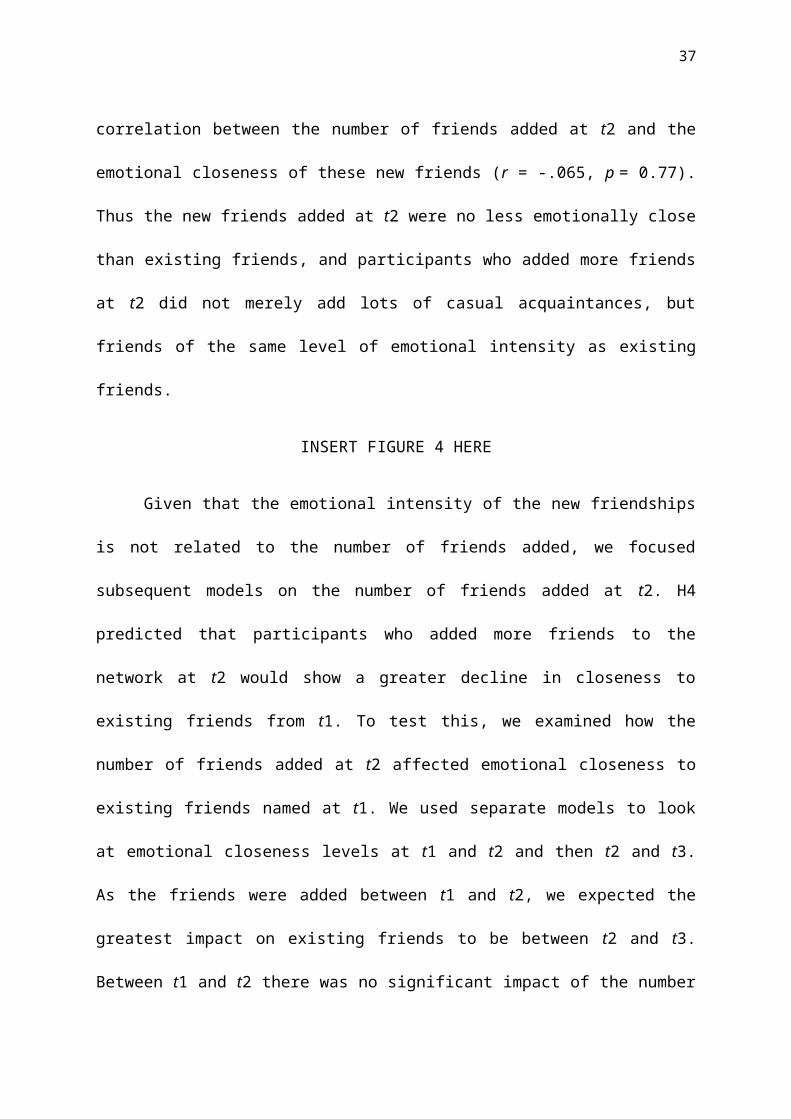
Given that the emotional intensity of the new friendships is not related to the number
of friends added, we focused subsequent models on the number of friends added at t2. H4
predicted that participants who added more friends to the network at t2 would show a greater
decline in closeness to existing friends from t1. To test this, we examined how the number of
friends added at t2 affected emotional closeness to existing friends named at t1. We used
separate models to look at emotional closeness levels at t1 and t2 and then t2 and t3. As the
friends were added between t1 and t2, we expected the greatest impact on existing friends to
be between t2 and t3. Between t1 and t2 there was no significant impact of the number of
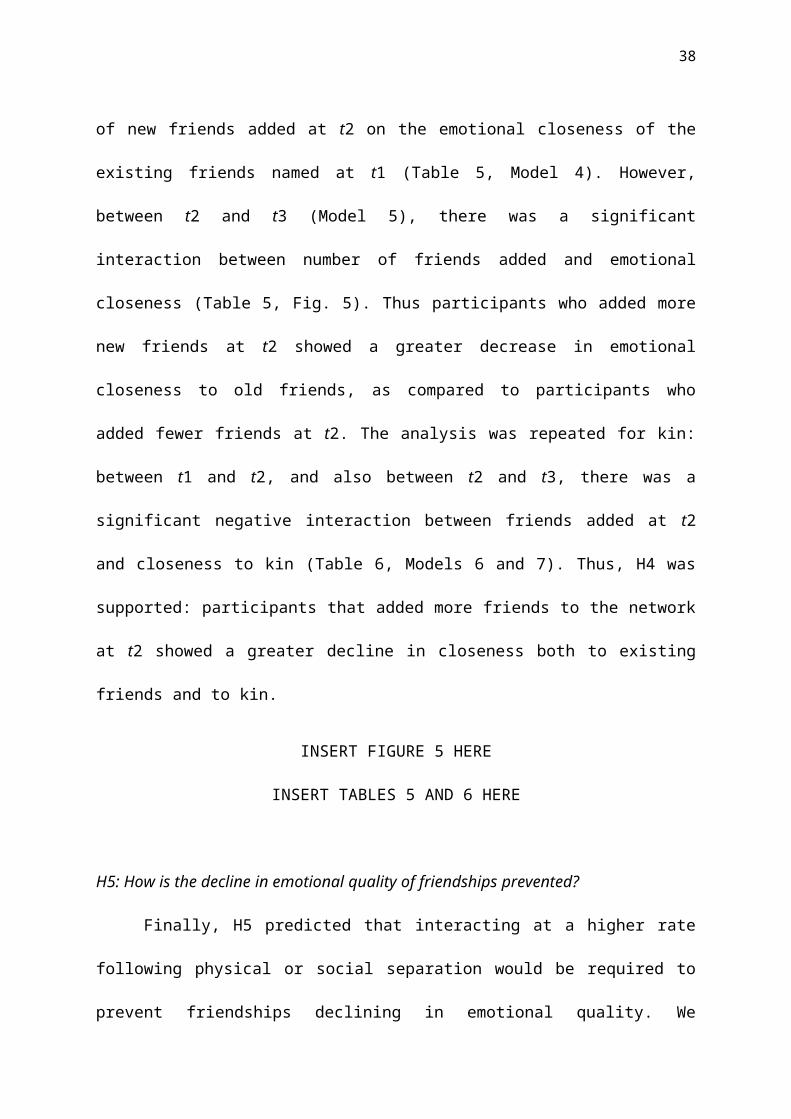
22
new friends added at t2 on the emotional closeness of the existing friends named at t1 (Table
5, Model 4). However, between t2 and t3 (Model 5), there was a significant interaction
between number of friends added and emotional closeness (Table 5, Fig. 5). Thus participants
who added more new friends at t2 showed a greater decrease in emotional closeness to old
friends, as compared to participants who added fewer friends at t2. The analysis was repeated
for kin: between t1 and t2, and also between t2 and t3, there was a significant negative
interaction between friends added at t2 and closeness to kin (Table 6, Models 6 and 7). Thus,
H4 was supported: participants that added more friends to the network at t2 showed a greater
decline in closeness both to existing friends and to kin.
INSERT FIGURE 5 HERE
INSERT TABLES 5 AND 6 HERE
H5: How is the decline in emotional quality of friendships prevented?
Finally, H5 predicted that interacting at a higher rate following physical or social
separation would be required to prevent friendships declining in emotional quality. We
restricted our analysis to friendships, because relationships with family showed no tendency
to decline in quality with time or separation. In Model 8 (Table 7), there were significant
interactions between gender and change in activity score, and gender and change in contact
frequency. For males, increasing the number of activities done together was associated with
an increase in emotional closeness between t1 and t3, whereas in females this effect was
much less pronounced (Fig. 6a). In contrast, changes in contact frequency had a large effect
on emotional closeness for females, but not for males (Fig. 6b). Including the gender of the
network member, and whether or not the participant and network member were the same
gender, did not affect the significance of these interactions, and these variables were not
23
significant in themselves. H5 was thus vindicated, but with the caveat that the relationship
maintenance processes involved showed a striking gender difference.
INSERT FIGURE 6 (a & b) HERE
INSERT TABLE 7 HERE
Discussion
In this study, we tracked the entire active personal network of 25 students over a
period of 18 months as they made the transition from school to university or work. Our aim
was to examine how the emotional closeness of the relationships between participants and the
network members changed over the course of the study. Specifically, we tested five
hypotheses regarding the nature of these changes.
The first hypothesis (H1) was unequivocally supported: there was a significant
increase in emotional closeness to kin over the course of the study, as compared to a
significant decrease in emotional closeness to friends. This result is in line with evolutionary
theory, which predicts clear differences in behaviour towards family members and friends
(Hamilton, 1964; Roberts, 2010) and is consistent with previous studies that have found an
increase in closeness to parents occurring during the transition to university (Kenny, 1987;
Pipp et al., 1985; Sullivan & Sullivan, 1980). In contrast to previous studies, however, this
study demonstrates that the beneficial effect of going away to university applies not just to
close family members, but seemingly to the entire extended family network. In terms of
friends, the decrease in emotional closeness did not occur just with the relatively strong ties
in the inner layer of the personal network, but also occurred in the outer layers of the personal
network (which have likewise not been included in previous studies). Thus even ‘weak’ ties
become weaker over time. This illustrates the fact that weak ties are not static, but they too
24
require a certain level of maintenance if they are not to decay over time (Burt, 2002; Roberts,
2010).
In terms of the effect of distance on changes in emotional closeness, leavers and non-
university stayers showed an increase in emotional closeness over time to kin, whereas
university stayers showed a decrease. One possible reason for this difference could be due to
the fact that university stayers find living at home more irksome than university peers who
are living with other students, and this resentment produces a decrease in closeness to family.
For friends, participants who went to university showed greater decreases in emotional
closeness than those that did not go to university. However, there was no difference in
changes in emotional closeness between students who went to university in the home city and
those who did not. This suggests that it is the mere fact of going to university, rather than
going away to university, that impacts on old friendships. Thus H2 was not supported: there
was an effect of distance on changes in emotional closeness to kin, but no effect of distance
per se for friends.
H3 predicted that stronger relationships will be less prone to decay. We used three
criteria for relationship strength: being in the inner layer of the personal network, genetic
relatedness for kin and time known for friends. H3 was not supported. There was no
interaction between time and genetic relatedness, thus the increase in emotional closeness
over the course of the study was not restricted to close family members. Further, kin in the
outer layers of the personal network actually showed a greater increase in emotional
closeness over time than those in the inner layer. In terms of friendships, even friends whom
participants had known for a long time, and friends who were classified in the inner layers of
the network, were not immune from the decline in emotional closeness during the transition
to university. For friends (but not for kin) these declines in closeness were associated with
moving from the inner layer of close friends to the outer layer of weaker ties. Thus, contrary

25
to early theorising (e.g. Wright, 1984), close friendships are not self-sustaining, but are in fact
just as prone to decay with physical separation and the competition generated by
opportunities to meet new people. H4 predicted that participants who added more new
friends at t2 would show a sharper decrease in the closeness to existing network members.
This hypothesis was supported: between t2 and t3, participants who added more friends
showed decreased closeness both to old friends and to kin. Finally, H5 predicted that
friendships that were invested in more heavily would be more resistant to decay with time
and distance. This too was supported, but with the caveat that the mode of interaction that
worked best differed between the genders: for males, engaging in activities together seemed
to be crucial, whereas talking to each other was critical for females.
This study has three main implications. First, it reinforces the conclusion that kin
relationships are more stable than friendships (Burt, 2000) and are more resistant to changes
in location or circumstance, and it extends this finding to a wider range of ties than is
typically studied. Simply feeling psychologically close to old friends does not prevent these
friendships from declining in closeness over time. As Fig. 6 indicates, preventing a decline in
closeness requires active maintenance in terms of communication (Oswald & Clark, 2003;
Cummings et al. 2006) or doing activities together (Degenne & Lebeaux, 2005). Second, it
provides further support for the notion of constraints on network size, as hypothesised by the
social brain hypothesis (Dunbar, 1998 Roberts et al. 2009; Roberts, 2010; Sutcliffe et al.
2012). As one example of an archetypal life transition, the transition to university is
associated with a decrease in emotional closeness to friends, and this effect is especially
pronounced when a participant added more friends to his/her network at t2. Importantly,
these new friends were as emotionally close as existing friends (see also Saramäki et al.,
2014), and there was no relationship between the number of friends added and the emotional
intensity of these friendships. Given the close relationship between contact frequency and
26
emotional closeness (Hill & Dunbar, 2003; Roberts et al. 2011), this suggests a substantial
time investment in these new friendships. Because time is an inelastic resource (Nie, 2001),
those participants who invested time and energy into making new friends appeared to do so to
the detriment of existing friendships. Third, the effect of distance on social relationships
appears to be more complex than previous studies have suggested. For kin, absence really did
‘make the heart grow fonder’: those that left their home city showed a greater increase in
emotional closeness than those that stayed. For friends, there was no effect of leaving home
per se on the decline in emotional closeness, but rather the effect is driven by the opportunity
to meet new people that a change in circumstances provides. Overall, whilst distance
generally may have a negative effect on closeness of social relationships (van Duijn et al.,
1999; Mok, et al., 2007), the effect of distance does not seem to apply equally to kin
relationships and friendships.
One of the strengths of this study was that we collected information on the
participant’s relationships before they underwent their life transition. Most studies of this
type are retrospective, recruiting students after they have arrived at university: this inevitably
means that much of the change in social relationships associated with the transition to
university has already happened (see Fig. 3b), and as a result previous relationships may be
overlooked. Further, the attrition rate in our study was exceptionally low for a study of this
nature and length. Of the 30 students who started the study, 25 (83%) completed all waves of
data collection. This compares very favourably with the equivalent figures from comparable
longitudinal studies: 79% (Hays & Oxley, 1986), 67% (Paul & Brier, 2001), 55% (Oswald &
Clark, 2003) and 23% (Cummings et al., 2006). High attrition rates on longitudinal studies
can have serious consequences in terms of drawing valid conclusions from the data (Jeličić et
al., 2009).

27
Our study does, nonetheless, have some limitations. First, the sample size is modest.
However, multi-level modelling allowed full use to be made of the data, with the analysis
being carried out at the level of the 1,291 network members (alters) rather than just the 25
participants. Second, no interviews were carried out with the participants. Interviews can
provide valuable help in interpreting the statistical findings in longitudinal studies (see e.g.
Lubbers et al., 2010; Buote et al., 2007). Third, the participants were all around 18 years of
age and thus the extent to which the patterns found in this study would also apply to a broader
age range, and to other life transitions (such as moving to another area, being divorced or
changing jobs), needs further research. Nonetheless, the results reported here are broadly in
line with previous research, which has shown a greater stability in family relationships as
compared to friendships (Milardo et al., 1983; Morgan et al., 1996; Wellman et al., 1997;
Burt, 2000). Thus while this study focused on a particular age group undergoing a particular
transition, we expect the key findings – that even close friendships require active
maintenance, while family relationships are more resistant to decay – to be replicated in
studies of other types of transitions. Finally, participants were asked to recall detailed
information for a large number of network members, and this inevitably raises questions
about the reliability of recall. To counteract this risk, the questionnaire was designed to
encourage accurate recall by providing participants with the details of all network members
named at t1 for the t2 and t3 questionnaires and only asking participants to respond on a
yes/no basis in terms of the different activities done. Nonetheless, detailed diary studies have
shown that these types of social network questionnaires are reliable at capturing relationship
change over time, including changes in contact frequency and changes in network size
(Asendorpf & Wilpers, 1998).
In terms of future work, both the Relationship Investment Model (Rusbult, 1983) and
the notion of constraints on network size deriving from the social brain hypothesis (Dunbar,
28
1998; Roberts et al., 2009) argue that one of the key factors explaining the decline in old
friendships is the time and energy put into forming new friendships (see also Miritello et al.,
2013; Saramäki et al., 2014), which inevitably takes away time and energy that could have
been invested in maintaining old friendships. There is some work in this area (e.g. Milardo et
al.. 1983), but relatively little is known about time budgets as a form of social capital. How
much time do people actually spend socialising, both face-to-face and non-face-to-face? How
is this time divided up across their social network as a whole? How does individual variation
in time spent socialising, and the type of socialising, affect the way relationships with kin and
friends change over time? New forms of digital technology mean that people increasingly
leave a digital trace of their communication and activity (Lazer et al., 2009, Eagle et al.,
2009), and this may enable these questions to be addressed more effectively and in more
detail than is possible when relying on time-consuming questionnaires.
We have not explored the extent to which individual differences in personality might
be related both to the properties of social networks and network change over time. Extraverts
have larger personal networks (Pollet et al., 2011) and are more effective at building up a new
social support network in a new country (Furukawa et al., 1998). Extraverts also participate
in more social activities and have a higher interaction rate with others than introverts (Argyle
& Lu, 1990; Asendorf & Wilpers, 1998), suggesting that they may be more successful at
maintaining friendships over time. This would particularly be the case if extraverts chose to
devote more of their free time to social activities, rather than more solitary pursuits.
Extraverts may also be more likely to leave home for university, and thus have the
opportunity to make new ties. Future work could usefully explore the strategies extraverts use
to manage the trade-off between building up new friendships and maintaining old friendships
during periods of transition, and whether these strategies simply lead to larger personal
networks or also to more emotionally intense ties with network members (Pollet et al., 2011).
29
Acknowledgments
This study was funded by a grant from the UK Engineering & Physical Sciences Research
Council and the Economic and Social Research Council, and by the British Academy
Centenary Research Project “Lucy to Language”. RD is currently supported by a European
Research Council Advanced grant.
30
References
Aron, A., Aron, E. N., & Smollan, D. (1992). Inclusion of Other in the Self Scale and the
structure of interpersonal closeness. Journal of Personality and Social Psychology,
63, 596-612.
Argyle, M., & Lu, L. (1990). The happiness of extroverts. Personality and Individual
Differences, 11, 1011-1017.
Asendorpf, J. B., & Wilpers, S. (1998). Personality effects on social relationships. Journal of
Personality and Social Psychology, 74, 1531-1544.
Baumeister, R. F., & Leary, M. R. (1995). The need to belong: Desire for interpersonal
attachments as a fundamental human motivation. Psychological Bulletin, 117, 497-
529.
Berman, W. H., & Sperling, M. B. (1991). Parental attachment and emotional distress in the
transition to college. Journal of Youth and Adolescence, 20, 427-440.
Bernard, H. R., & Killworth, P. D. (1973). On the social structure of an ocean-going research
vessel and other important things. Social Science Research, 2, 145-184.
Berscheid, E., Snyder, M., & Omoto, A. M. (1989). The Relationship Closeness Inventory:
Assessing the closeness of interpersonal relationships Journal of Personality and
Social Psychology, 57, 792-807.
Binder, J. F, Roberts, S. G. B. & Sutcliffe, A. G. (2012). Closeness, loneliness, support: Core
ties and significant ties in personal networks. Social Networks, 34, 206-214.
Bryk, A. S., & Raudenbush, S. W. (1992). Hierarchical Linear Models. Sage, Newbury Park,
CA.
Buote, V. M., Pancer, S. M., Pratt, M. W., Adams, G., Bimie-Lefcovitch, S., Polivy, J., et al.
(2007). The importance of friends: Friendship and adjustment among 1st-year
university students. Journal of Adolescent Research, 22, 665-689.
31
Burt, R. S. (2000). Decay functions. Social Networks, 22, 1-28.
Burt, R. S. (2002). Bridge decay. Social Networks, 24, 333-363.
Burton-Chellew, M. N., & Dunbar, R. I. M. (2011). Are affines treated as biological kin?
Current Anthropology, 52(5), 741-746.
Buys, C. J., & Larson, K. L. (1979). Human sympathy groups. Psychological Reports, 45,
547-553.
Crosnoe, R. (2000). Friendships in childhood and adolescence: The life course and new
directions. Social Psychology Quarterly, 63, 377-391.
Cummings, J. N., Lee, J. B., & Kraut, R. (2006). Communication technology and friendship
during the transition from high school to college. In: K. Kraut, M. Brynin & S.
Kiesler, (Eds.), Computers, Phones and the Internet: Domesticating Information
Technologies (pp. 265-278). New York: Oxford University Press.
Curry, O., Roberts, S. B. G. & Dunbar, R. I. M. (2013). Altruism in social networks: evidence
for a "kinship premium". British Journal of Psychology, 104, 283-295.
D'Agostino, R. B., & Belanger, A. (1990). A suggestion for using powerful and informative
tests of normality. American Statistician, 44, 316-321.
Degenne, A., & Lebeaux, M. O. (2005). The dynamics of personal networks at the time of
entry into adult life. Social Networks, 27, 337-358.
Dunbar, R. I. M. (1992). Coevolution of neocortical size, group-size and language in humans.
Behavioral and Brain Sciences, 16, 681-694.
Dunbar, R. I. M. (1998). The social brain hypothesis. Evolutionary Anthropology, 6(5), 178-
190.
Dunbar, R. I. M., & Shultz, S. (2007). Evolution in the social brain. Science, 317(5843),
1344-1347.

32
Dunbar, R. I. M., & Spoors, M. (1995). Social networks, support cliques, and kinship. Human
Nature, 6, 273-290.
Dunbar, R. I. M., Korstjens, A. H. & Lehmann, J. (2009). Time as an ecological constraint.
Biological Reviews 84: 413-429.
Dunbar, R. I. M., Lehmann, J., Korstjens, A. J. & Gowlett, J. A. J. (2014) The road to modern
humans: time budgets, fission-fusion sociality, kinship and the division of labour in
hominin evolution. In: R. I M. Dunbar, C. Gamble & J. A. J. Gowlett (eds.) Lucy to
Language: the Benchmark Papers, pp. 333-355. Oxford: Oxford University Press.
Eagle, N., Pentland, A., & Lazer, D. (2009). Inferring friendship network structure by using
mobile phone data. Proceedings of the National Academy of Sciences of the United
States of America, 106(36), 15274-15278.
Espinoza, V. (1999). Social networks among the urban poor: inequality and integration in a
Latin American city. In B. Wellman (Ed.), Networks in the global village (pp. 147-
184). Boulder, Colorado: Westview Press.
Feld, S. L., Suitor, J. J., & Hoegh, J. G. (2007). Describing changes in personal networks over
time. Field Methods, 19, 218-236.
Field, A. (2013). Discovering Statistics Using SPSS (4th ed.). Los Angeles: Sage.
Furukawa, T., Sarason, I. G., & Sarason, B. R. (1998). Social support and adjustment to a
novel social environment. International Journal of Social Psychiatry, 44(1), 56-70.
Gierveld, J. D., & Perlman, D. (2006). Long-standing nonkin relationships of older adults in
the Netherlands and the United States. Research on Aging, 28, 730-748.
Granovetter, M. (1973). The strength of weak ties. American Journal of Sociology, 78, 1360-
1380.
Granovetter, M. (1983). The strength of weak ties: a network theory revisited. Sociological
Theory, 1, 201-233.
33
Hamilton, W. D. (1964). Genetical evolution of social behaviour 1. Journal of Theoretical
Biology, 7, 1-16.
Hayes, A. F. (2006). A primer on multilevel modeling. Human Communication Research, 32,
385-410.
Hays, R. B., & Oxley, D. (1986). Social network development and functioning during a life
transition. Journal of Personality and Social Psychology, 50, 305-313.
Hill, R. A., & Dunbar, R. I. M. (2003). Social network size in humans. Human Nature, 14,
53-72.
Hill, R. A., Bentley, A. & Dunbar, R. I. M. (2008). Network scaling reveals consistent fractal
pattern in hierarchical mammalian societies. Biology Letters, 4, 748-751.
Jeličić, H. Phelps, E. & Lerner, R. A. (2009). Use of missing data methods in longitudinal
studies: The persistence of bad practices in developmental psychology.
Developmental Psychology, 45, 1195-1199.
Jeon, J. & Buss, D. M. (2007). Altruism towards cousins. Proceedings of the Royal Society,
Series B, 274, 1181-1187.
Kana'Iaupuni, S. M., Donato, K. M., Thompson-Colon, T., & Stainback, M. (2005). Counting
on kin: Social networks, social support, and child health status. Social Forces, 83,
1137-1164.
Kawachi, I., & Berkman, L. F. (2001). Social ties and mental health. Journal of Urban
Health, 78, 458-467.
Kenny, M. E. 1987. The extent and function of parental attachment amongst 1st-year college
students. Journal of Youth and Adolescence, 16, 17-29.
Korchmaros, J. D. & Kenny, D. A. 2001. Emotional closeness as a mediator of the effect of
genetic relatedness on altruism. Psychological Science, 12, 262-265.

34
Kuha, J. (2004). AIC and BIC: Comparisons of assumptions and performance. Sociological
Methods & Research, 33, 188-229.
Lazer, D., Pentland, A., Adamic, L., Aral, S., Barabasi, A. L., Brewer, D., . . . Van Alstyne,
M. (2009). Computational Social Science. Science, 323(5915), 721-723.
Lehmann, J., Korstjens, A. H., & Dunbar, R. I. M. (2007). Group size, grooming and social
cohesion in primates. Animal Behaviour, 74, 1617-1629.
Lubbers, M. J., Molina, J. L., Lerner, J., Brandes, U., Avila, J., McCarty, C. (2010).
Longitudinal analysis of personal networks: The case of Argentinean migrants in
Spain. Social Networks, 32, 91-104.
Madsen, E., Tunney, R., Fieldman, G., Plotkin, H. C., Dunbar, R. I. M., Richardson, J. &
McFarland, D. J. (2007). Kinship and altruism: a cross-cultural experimental study.
British Journal of Psychology, 98, 339-359.
Marsden, P. V., & Campbell, K. E. (1984). Measuring tie strength. Social Forces, 63, 482-
501.
Milardo, R. M., Johnson, M. P., & Huston, T. L. (1983). Developing close relationships:
Changing patterns of interaction between pair members and social networks. Journal
of Personality and Social Psychology, 44, 964-976.
Milardo, R. M., & Wellman, B. (1992). The personal is social. Journal of Social and
Personal Relationships, 9, 339-342.
Miritello, G., Moro, E., Lara, R., Martínez-López, R., Belchamber, J., Roberts, S.B.G. &
Dunbar, R.I.M. (2013). Time as a limited resource: communication strategy in mobile
phone networks. Social Networks, 35, 89-95.
Mok, D., Wellman, B., & Basu, R. (2007). Did distance matter before the Internet?
Interpersonal contact and support in the 1970s. Social Networks, 29, 430-461.

35
Morgan, D. L., Neal, M. B., & Carder, P. (1997). The stability of core and peripheral
networks over time. Social Networks, 19, 9-25.
Nettle, D., Gibson, M. A., Lawson, D. W., & Sear, R. (2013). Human behavioral ecology:
current research and future prospects. Behavioral Ecology, 24, 1031-1040.
Nie, N.H. (2001). Socialbility, interpersonal relations, and the Internet: Reconciling
conflicting findings. The American Behavioral Scientist, 45, 420-435.
Oesch, N. & Dunbar, R. I. M. (2015). Influence of kin network on maternal and infant health
and illness. Journal of Pregnancy and Child Health, 00, 000-000.
Oswald, D. L., & Clark, E. M. 2003. Best friends forever?: High school best friendships and
the transition to college. Personal Relationships, 10, 187-196.
Paul, E. L., & Brier, S. 2001. Friendsickness in the transition to college: Precollege predictors
and college adjustment correlates. Journal of Counseling and Development, 79, 77-
89.
Pipp, S., Jennings, S., Shaver, P., Lamborn, S., & Fischer, K. W. 1985. Adolescents’ theories
about the development of their relationships with their parents. Journal of Personality
and Social Psychology, 48, 991-1001.
Pollet, T. V., Roberts, S. G. B., & Dunbar, R. I. M. (2011). Extraverts have larger social
network layers but do not feel emotionally closer to individuals at any layer. Journal
of Individual Differences, 32(3), 161-169.
Pool, I. D., & Kochen, M. (1978). Contacts and Influence. Social Networks, 1, 5-51.
Roberts, S.G.B. 2010. Constraints on social networks. . In: R.I.M. Dunbar, C. Gamble &
J.A.J. Gowlett (eds) Social Brain, Distributed Mind, pp. 117-138. Oxford: Oxford
University Press.
36
Roberts, S. G. B. & Dunbar, R. I. M. (2011). Communication in social networks: Effects of
kinship, network size and emotional closeness. Personal Relationships 18: 439-452.
Roberts, S. G. B., Dunbar, R. I. M., Pollet, T. V., & Kuppens, T. (2009). Exploring variation
in active network size: Constraints and ego characteristics. Social Networks, 31, 138-
146.
Rusbult, C. E. (1983). A longitudinal test of the investment model: The development (and
deterioration) of satisfaction and commitment in heterosexual involvements. Journal
of Personality and Social Psychology, 45, 101-117.
Saramäki, J., Leicht, E., López, E., Roberts, S.B.G., Reed-Tsochas, F. & Dunbar, R.I.M.
(2014). The persistence of social signatures in human communication. Proceedings of
the National Academy of Sciences, USA, 111, 942-947.
Snijders, T. A. B., & Bosker, R. (1999). Multilevel analysis: An introduction to basic and
advanced multilevel modelling. London: Sage.
Suitor, J. J., Wellman, B., & Morgan, D. L. (1997). It's about time: How, why, and when
networks change. Social Networks, 19, 1-7.
Sullivan, K., & Sullivan, A. (1980). Adolescent-parent separation. Developmental
Psychology, 16, 93-99.
Sutcliffe, A.J., Dunbar, R.I.M., Binder, J. & Arrow, H. (2012). Relationships and the social
brain: integrating psychological and evolutionary perspectives. British Journal of
Psychology 103: 149-168.
Tabachnick, B. G., & Fidell, L. S. 2007. Using multivariate statistics. Boston: Pearson/A&B
Van Duijn, M. A. J., van Busschbach, J. T., & Snijders, T. A. B. (1999). Multilevel analysis
of personal networks as dependent variables. Social Networks, 21, 187-209.
37
Wellman, B., & Frank, K. (2001). Network capital in a multilevel world: getting support from
personal communities. In N. Lin, K. S. Cook & R. S. Burt (Eds.), Social capital:
Theory and research (pp. 233-275). New York: Aldine Transaction.
Wellman, B., & Wortley, S. (1990). Different strokes from different folks: Community ties
and social support. American Journal of Sociology, 96, 558-588.
Wellman, B., Wong, R. Y. L., Tindall, D., & Nazer, N. (1997). A decade of network change:
Turnover, persistence and stability in personal communities. Social Networks, 19, 27-
50.
Wright, P. H. (1984). Self-referent motivation and the intrinsic quality of friendship. Journal
of Social and Personal Relationships, 115, 115-130.
Zhou, W. X., Sornette, D., Hill, R. A., & Dunbar, R. I. M. (2005). Discrete hierarchical
organization of social group sizes. Proceedings of the Royal Society B: Biological
Sciences, 272, 439-444.
Acknowledgments
SR and RD were supported by the British Academy Centenary Research Project and the
EPSRC/ESRC Developing Theory for Evolving Socio-Cognitive Systems (TESS) project.
RD’s research is supported by a European Research Council Advanced Grant.
Sam Roberts is Senior Lecturer in Psychology at Chester University. His principal research interests combine theories and methods from evolutionary psychology, social psychology and social network analysis to provide insights into the dynamics of social relationships
Robin Dunbar is Professor of Evolutionary Psychology in the Department of Experimental Psychology, University of Oxford. He is director of the Social and Evolutionary
38
Neuroscience Research Group, which explores the evolutionary, ecological and neuropsychological underpinnings of sociality in primates and humans.
39
Table 1. Summary of all multilevel regression analyses, Models 1-8.
Model number
Dependent variable
Number of levels
Details of levels Random effects
Model 1 Emotional closeness
3 Level 1: Participant characteristicsLevel 2: Network memberLevel 3: Time
Random intercept: Participant, network memberRandom slopes: Time Covariance between slopes and intercepts: First-order autoregressive structure (ARH1)
Model 2 Emotional closeness to kin
3 Level 1: Participant characteristicsLevel 2: Network memberLevel 3: Time
Random intercept: Participant, network memberRandom slopes: TimeCovariance between slopes and intercepts: First-order autoregressive structure (ARH1)
Model 3 Emotional closeness to friends
3 Level 1: Participant characteristicsLevel 2: Network memberLevel 3: Time
Random intercept: Participant, network memberRandom slopes: TimeCovariance between slopes and intercepts: First-order autoregressive structure (ARH1)
Model 4 Emotional closeness to T1 friends at T1 and T2
3 Level 1: Participant characteristicsLevel 2: Network memberLevel 3: Time
Random intercept: Participant, network member
Model 5 Emotional closeness to T1 friends vs T2 and T3
3 Level 1: Participant characteristicsLevel 2: Network memberLevel 3: Time
Random intercept: Participant, network member
Model 6 Emotional closeness to kin at T1 and T2
3 Level 1: Participant characteristicsLevel 2: Network memberLevel 3: Time
Random intercept: Participant, network member
Model 7 Emotional closeness to
3 Level 1: Participant characteristics
Random intercept: Participant, network member
40
kin at T2 and T3
Level 2: Network memberLevel 3: Time
Model 8 Change in emotional closeness (T3 minus T1)
2 Level 1: Participant characteristicsLevel 2: Network member
Random intercept: Participant
41
Table 2. Variables used in multilevel regression models predicting emotional closeness from
network member characteristics, participant characteristics and time in study
Variable Description Mean (SD) Median n
Level 1: Network member /Tie characteristics
Gender 0 = Female; 1 = Male 0.42 (0.49) 0 1,287
Location 0 = Same city as school
1 = Different city from school
0.67 (0.47) 1 1,265
Relationship 0 = Family; 1 = Friend 0.61 (0.49) 1 1,288
Relatedness (r) Genetic relatedness 0.20 (0.16) 0.125 499
Network layer 0 = Inner; 1 = Outer 0.75 (0.43) 1 1
Time known (friends) Length of time known (months) 58.88 (50.53) 36 789
Contact frequency (t1) a Number of days to last contact 28.41 (84.34) 1 789
Contact frequency (t2) a Number of days to last contact 69.31 (109.56) 22.50 694
Contact frequency (t3) a Number of days to last contact 128.78 (153.51) 27 725
Activity score (t1) a Number of different activities 2.00 (1.13) 2 789
Activity score (t2) a Number of different activities 1.25 (1.25) 1 739
Activity score (t3) a Number of different activities 0.97 (1.09) 1 716
Level 2: Participant/Network characteristics
Gender 0 = Female; 1 = Male 0.52 (0.51) 1 25
Ethnic Group 0 = White; 1 = Black or Asian 0.40 (0.50) 0 25
Location 0 = Same city as school
1 = Different city from school
0.96 (0.20) 1 25
Kin network size Size of related network 20.04 (16.17) 13 25
Friend network size Size of unrelated network 31.64 (18.07) 28 25
Time in school city Months lived in school city 186.83 (50.65) 204 25
Participant location at t2 0 = Same city as school
1 = Different city from school
0.56 (0.51) 1 25
University at t2 0 = Not Univ.; 1 = Univ. 0.76 (0.44) 1 25
Notes: All measures are for Time t1 unless stated in the Table. n varies across variables due
to missing data.a Contact frequency and activity score are for friends only, as these were the variables used in
Model 8.
42
Table 3. Model 1: Multilevel regression model predicting emotional closeness from
relationship type and time. Table shows parameter estimates, standard errors and 95%
Confidence Intervals (CI).
Predictors Parameter estimate
Standard error 95% CI
Fixed effects
Intercept 4.68*** 0.13 4.44 4.94
Time 0.27*** 0.05 0.18 0.36
Relationship type 1.20*** 0.16 0.87 1.51
Time x relationship type (kin/friends)
-0.90*** 0.06 -1.01 -0.78
Covariance parameters
Random intercept 5.68*** 0.38 4.97 6.48
Random slopes (time) 0.29 *** 0.06 0.20 0.42
Co-variance between intercept and slope (ARH1)
-0.27*** 0.07 -0.40 -0.13
Note: The covariance between the random intercept and random slopes is modelled
using a first-order autoregressive structure (ARH1).
*** p < 0.001.
43
Table 4. Models 2 and 3: Multilevel regression models predicting emotional closeness from
participant and network member characteristics and time. Table shows parameter estimates
(and standard errors) and 95% Confidence Intervals (CI).
Model Type Model 2: Kin
95% CI Model 3: Friends
95% CI
Fixed effects
Intercept 5.21 *** (0.35)
4.53 5.91 7.32 *** (0.33)
6.68 7.96
Level 1
Time 0.55 *** (0.12)
0.31 0.79 -0.52 *** (0.09)
-0.69 -0.36
Level-2 (network member /tie) variables Genetic relationship (r) 0.93 ***
(0.17)0.59 1.27 n/a
Network layer at T1 -2.38 *** (0.23)
-2.84 -1.94 -2.71 *** (0.15)
-3.01 -2.41
Location NS -0.46 * (0.19)
-0.59 -0.10
Gender NS -0.34 ** (0.13)
-0.59 -0.10
Time known (months) n/a 0.27 *** (0.06)
0.16 0.39
Level3(participant/network) variables
Gender 1.17 *** (0.18)
0.83 1.51 0.50 ** (0.18)
0.15 0.87
Ethnic group 1.42 *** (0.18)
1.08 1.77 0.47 ** (0.14)
0.19 0.76
Mean genetic relationship 0.86 *** (0.07)
0.72 1.00 n/a
Mean time known n/a 0.37 *** (0.09)
0.20 0.54
Kin network size a -0.62 *** (0.15)
-0.91 -0.33 NS
Friendship network size a 1.02 *** (0.12)
0.79 1.26 NS
Length of time lived in school city
NS NS
44
Destination after school (not Uni/Uni)
0.99 *** (0.26)
0.49 1.50 0.78 *** (0.22)
0.36 1.21
Participant location 1.01 *** (0.23)
0.57 1.46 0.46 ** (0.15)
0.16 0.75
Cross-level interactions
Time x relatedness NS n/a
Time x network layer 0.26 ** (0.08)
0.11 0.42 NS
Time x kin network size 0.29 *** (0.04)
0.22 0.36 NS
Time x time known (months)
n/a NS
Time x friendship network size
-0.31 *** (0.04)
-0.39 -0.23 NS
Time x participant gender NS 0.36 *** (0.08)
0.20 0.53
Time x Uni (not Uni/Uni) -0.51 *** (0.09)
-0.69 -0.32 -0.30 ** (0.09)
-0.48 -0.11
Time x destination -0.71 *** (0.08)
-0.87 -0.55 NS
Covariance parameters
Random intercept 2.42*** (0.32)
1.86 3.14 1.68*** (0.40)
1.06 2.67
Random slopes (time) 0.08 (0.05) 0.03 0.26 0.32 ** (0.09)
0.17 0.54
Co-variance between intercept and slope (ARH1)
-0.38 ** (0.13)
-0.61 -0.10 -0.11 (0.21) -0.49 0.29
Notes. NS refers to a variable that was not significant and thus not included in the final
model. n/a refers to a variable that was not applicable to that model. The covariance between
the random intercept and random slopes is modelled using a first-order autoregressive
structure (ARH1).
a Grand mean centred
* p < 0.05. ** p < 0.01. *** p < 0.001.
45
Table 5. Models 4 and 5: Multilevel regression model predicting emotional closeness to T1
friends from number of friends added at T2 and time. Table shows parameter estimates
(and standard errors) and 95% Confidence Intervals (CI).
Predictors Model 4
(T1 to T2)
95% CI Model 5
(T2 to T3)
95% CI
Fixed effects
Intercept 6.15 *** (0.14)
5.87 6.43 5.08 *** (0.21)
4.67 5.50
Time -0.82 *** (0.08)
-0.98 -0.67 -0.31 *** (0.07)
-0.46 -0.16
Friends added at T2 -0.42 ** (0.13)
-0.68 -0.16 0.11 (0.20)† -0.28 0.51
Time x friends added
0.04 (0.07)† -0.11 0.18 -0.22 ** (0.07)
-0.36 -0.08
Covariance parametersRandom intercept 3.89***
(0.26)3.41 4.43 5.48***
(0.33)4.86 6.17
*** p < 0.001. ** < p 0.01. † Not significant
46
Table 6. Models 6 and 7: Multilevel regression model predicting emotional closeness to kin
from number of friends added at T2 and time. Table shows parameter estimates (and
standard errors) and 95% Confidence Intervals (CI).
Predictors Model 6
(T1 to T2)
95% CI Model 7
(T2 to T3)
95% CI
Fixed effects
Intercept 4.29 *** (0.17)
3.96 4.62 5.58 *** (0.19)
5.21 5.95
Time 0.60 *** (0.08)
0.44 0.75 -0.05(0.06) † -0.17 0.06
Friends added at T2 -0.51 ** (0.17)
-0.85 -0.18 0.80 *** (0.19)
0.42 1.18
Time x friends added
0.23 ** (0.08)
0.07 3.89 -0.41 *** (0.06)
-0.53 -0.29
Covariance parametersRandom intercept 6.63***
(0.47)5.77 7.62 6.32***
(0.43)5.54 7.22
. ** p < 0.01. *** p < 0.001 † Not significant
47
Table 7. Model 8: Multilevel regression model predicting change in emotional closeness
(time 3 – time 1) to T1 friends from change in activity score and change in contact frequency.
Table shows parameter estimates (and standard errors) and 95% Confidence Intervals (CI).
Predictors Model 8 95% CI
Fixed effects
Intercept -0.81 (0.35)* -1.55 -0.09
Ego gender 0.25 (0.51) -0.80 1.30
Change in activity scorea 0.38 (0.11)** 0.16 0.59
Change in contact frequencya -0.71 (0.17)***
asdas((0.17)***
-1.03 -0.38
Participant mean change in activity score 0.18 (0.24) -0.31 0.68
Participant mean change in contact
frequency
-0.20 (0.27) -0.76 0.35
Gender x change in activity score 0.35 (0.15)* 0.06 0.64
Gender x change in contact frequency 0.51 (0.25)* 0.03 1.00
Covariance parameters
Random intercept (participants) 1.12 (0.38)** 0.58 2.20a Group mean centred
* p < 0.05. ** p < 0.01. *** p < 0.001
48
Figure Captions
Figure 1. Mean emotional closeness of participants to network members by type of
relationship. Note that family means extended family. Emotional closeness measured on a
scale of 1-10, where 10 is very close.
Figure 2. (a) Mean change in emotional closeness between t1 and t3 by type of relationship
and position of network member in personal network at t3 (inner layer or outer layer). Chart
shows network members who were in inner layer at t1 only. (b) Mean percentage of network
members remaining in inner layer of personal network by time in study. Graph shows
network members who were in inner layer at t1 only.
Figure 3. Mean emotional closeness to (a) kin and (b) friends by participants’ destination
after school and university choice. Emotional closeness measured on a scale of 1-10, where
10 is very close
Figure 4. Number of friends added at t2 by whether participant went away to university
(leavers), stayed in City A and went to university (university stayers), or stayed in City A and
did not go to university (non-university stayers). Box plot shows median and interquartile
range. Whiskers show minimum and maximum values, excluding outliers, which are shown
as circles.
Figure 5. Change in emotional closeness to friends named at t1 based on number of new
friends added at to network at t2. Emotional closeness measured on a scale of 1-10, where 10
49
is very close. Number of friends added median split into low (0-10) and high (12-35) for
plotting only; model based on the continuous variable of number of friends added.
Figure 6. Gender differences in the impact on change in emotional closeness of a friendship
of change in (a) number of different activities performed together and (b) change in contact
frequency face-to-face or by phone. Activity score and contact frequency are split into
dichotomous variables for plotting only; model based on continuous variable change in
activity score.
50
Figure 1.
51
Figure 2 (a)
52
Figure 2 (b)
53
Figure 3 (a)

54
Figure 3 (b)
55
Figure 4
56
Figure 5

57
Figure 6 (a)
58
Figure 6 (b)