images.nature.com · web viewsupplemental figure 4: concordance of stained and unstained cell...
TRANSCRIPT
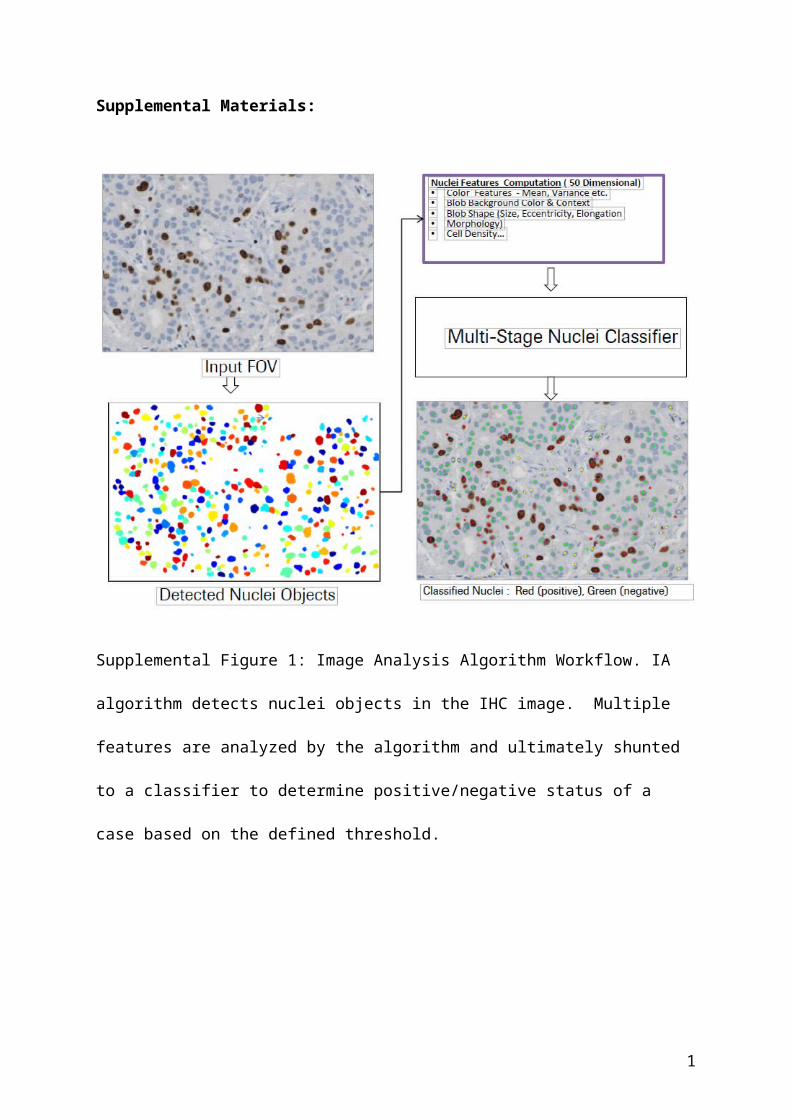
Supplemental Materials:
Supplemental Figure 1: Image Analysis Algorithm Workflow. IA algorithm
detects nuclei objects in the IHC image. Multiple features are analyzed by
the algorithm and ultimately shunted to a classifier to determine
positive/negative status of a case based on the defined threshold.
1

Supplemental Figure 2: Image Analysis User Software Workflow. IHC-
stained slides are scanned and presented in the Virtuoso software.
Pathologist reviews images and selects FOVs for the IA algorithm to
analyze. IA algorithm displays FOV metrics to pathologist to accept or
override score.
2

t ŚŽůĞƐůŝĚĞƐĐŽƌĞ
ǀ ĞƌĂŐŝŶŐ
ZĂƚŝŽŵĞƚƌŝĐ
Supplemental Figure 3: Image analysis strategies using the field-of-view
(FOV) annotation approach. Users can employ averaging and/or
ratiometric approaches to represent the whole slide quantitative average
using FOV annotations. In this example, the whole slide score is 70% with
each FOV methodology attempting to represent that average for IA.
3

Supplemental Figure 4: Concordance of stained and unstained cell counts
per case using whole tumor approach as assessed by regression (left
column) and Bland-Altman (right column) plots.
4

Supplemental Table1: Staining Protocols for ER (SP1) or PR (1E2)
Staining
Procedure
BenchMark XT BenchMark ULTRA
CONFIRM™ anti-ER (SP1)
Rabbit Monoclonal Antibody
Protocol
CONFIRM™ with anti-PR (1E2)
Rabbit Monoclonal Antibody
Protocol
CONFIRM™ with anti-ER (SP1)
Rabbit Monoclonal Antibody
Protocol
CONFIRM™ with anti-PR (1E2)
Rabbit Monoclonal Antibody
Protocol
Baking None None
Deparaffinization Selected Selected
Cell Conditioning Cell Conditioning 1, standard ULTRA CC1, standard
Enzyme None None
Antibody 16 minutes, 37° C 16 minutes, 36°C 16 minutes, 36° C
A/B Block None Selected None Selected Not Applicable
UltraWash Not Applicable Embedded Not Applicable Embedded Not Applicable
Counterstain Hematoxylin II, 4 min Hematoxylin II, 4 min
Post Counterstain Bluing Reagent, 4 min Bluing Reagent, 4 min
Detection ultraViewUniversal
DAB
iVIEWUniversal
DAB
ultraView
UniversalDAB
iVIEWUniversal
DAB
ultraView Universal
DAB
iViewUniversal
DAB
ultraViewUniversal
DAB
iViewUniversal
DAB
A/B - Avidin/Biotin
5

Supplemental Table 2: Staining Protocols for p53 (DO-7) or Ki-67 (30-9)
Staining Procedure BenchMark XT BenchMark ULTRA
CONFIRM™ anti-p53 (DO-7)
Mouse Monoclonal Primary
Antibody Protocol
CONFIRM™ anti-Ki-67 (30-9)
Rabbit Monoclonal Antibody
Protocol
CONFIRM™ anti-p53 (DO-7) Antibody
Mouse Monoclonal Primary Antibody
Protocol
CONFIRM™ anti-Ki-67 (30-9) A
Rabbit Monoclonal Antibody
Protocol
Baking None None
Deparaffinization Selected Selected
Cell Conditioning Cell Conditioning 1, standard Cell Conditioning 1, standard Cell Conditioning 1, standard Cell Conditioning 1, standard
Enzyme None None
Antibody 16 minutes, 37° C 16 minutes, 37° C 32 minutes, 37° C 16 minutes, 37° C
A/B Block Not applicable None Not applicable Selected Not applicable Selected Not applicable Selected
UltraWash Selected Not
applicable
Selected Not
applicable
Selected Not applicable Selected Not applicable
Counterstain Hematoxylin II, 4 min Hematoxylin II, 4 min
Post Counterstain Bluing Reagent, 4 min Bluing Reagent, 4 min
Detection ultraViewUniversal
DAB
iVIEWUniversal
DAB
ultraView
UniversalDAB
iVIEWUniversal
DAB
ultraViewUniversal
DAB
iVIEWUniversal
DAB
ultraViewUniversal
DAB
iVIEWUniversal
DAB
A/B - Avidin/Biotin
6

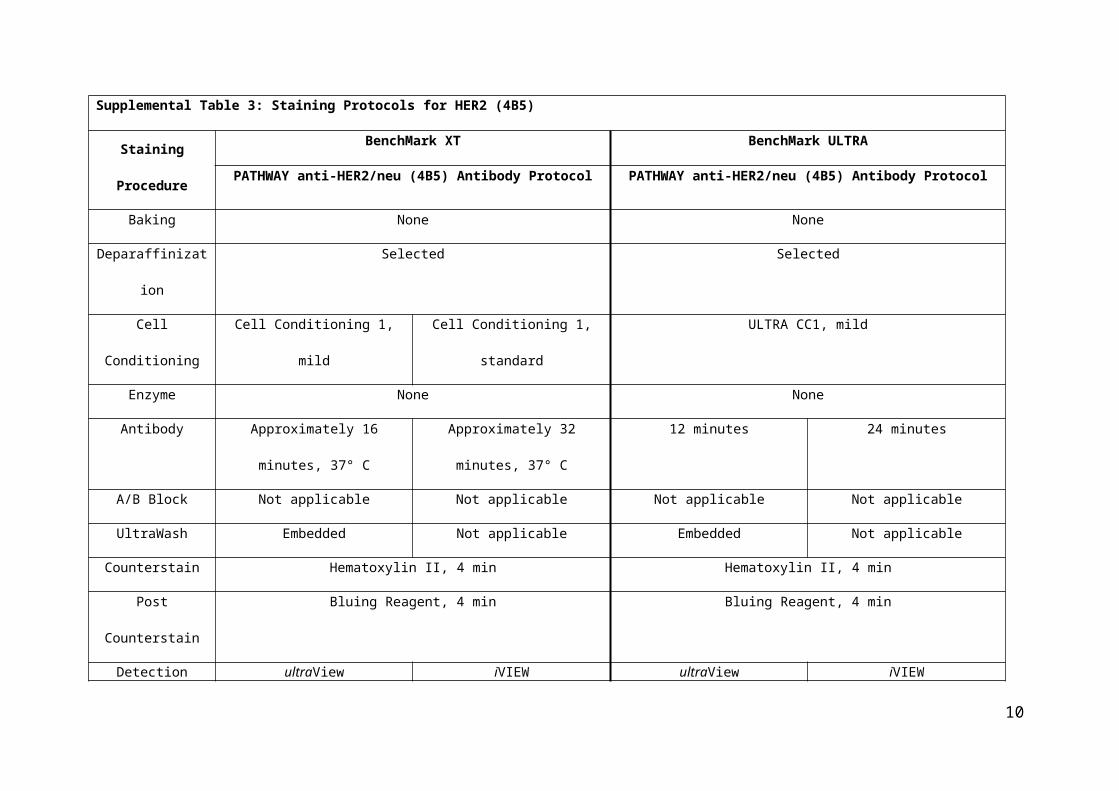
Supplemental Table 3: Staining Protocols for HER2 (4B5)
Staining Procedure BenchMark XT BenchMark ULTRA
PATHWAY anti-HER2/neu (4B5) Antibody Protocol PATHWAY anti-HER2/neu (4B5) Antibody Protocol
Baking None None
Deparaffinization Selected Selected
Cell Conditioning Cell Conditioning 1, mild Cell Conditioning 1, standard ULTRA CC1, mild
Enzyme None None
Antibody Approximately 16 minutes, 37° C Approximately 32 minutes, 37° C 12 minutes 24 minutes
A/B Block Not applicable Not applicable Not applicable Not applicable
UltraWash Embedded Not applicable Embedded Not applicable
Counterstain Hematoxylin II, 4 min Hematoxylin II, 4 min
Post Counterstain Bluing Reagent, 4 min Bluing Reagent, 4 min
Detection ultraViewUniversal DAB
iVIEWUniversal DAB
ultraViewUniversal DAB
iVIEWUniversal DAB
A/B - Avidin/Biotin
7

Supplemental Table 4: Positivity rates between community (C), industry (I), and academic (A) pathologists across biomarkers and manual read (MR), digital read (DR), and field-of-view (FOV) image analysis modalitiesMarker MR (% Positive calls) DR (% Positive calls) IA (% Positive calls) Highest % Positive CallsHER2 C1(51/120=42.5%)
I1(68/120=56.7%)C2(60/120=50%)
C1 (51/120=42.5%) I1(49/120=40.8%)C2(57/120=47.5%)
C1 (42/120=35%) I1(46/120=38.3%)C2(47/120=39.2%)
MR: IndustryDR: CommunityIA: Community
ER C1(56/120=46.7%)A1(62/120=51.7%)A2(61/120=50.8%)
C1(63/120=52.5%)A1(65/120=54.2%)A2(67/120=55.8%)
C1(54/120=45%)A1(55/120=45.8%)A2(57/120=47.5%)
MR: AcademicDR: AcademicIA: Academic
PR C1(62/120=51.7%)A1(64/120=53.3%)A2(63/120=52.5%)
C1(59/120=49.2%)A1(60/120=50%)A2(56/120=46.7%)
C1(55/120=45.8%)A1(62/120=51.7%)A2(55/120=45.8%)
MR: AcademicDR: AcademicIA: Academic
Ki-67 C3(73/120=60.8%)C2(75/120=62.5%)C1(65/120=54.2%)
C3(83/120=69.2%)C2(52/120=43.3%)C1(55/120=45.8%)
C3(78/120=65%)C2(63/120=52.5%)C1(62/120=51.7%)
MR: CommunityDR: CommunityIA: Community
p53 C3(46/120=38.3%)C2(31/120=25.8%)C1(42/120=35%)
C3(38/120=31.7%)C2(37/120=30.8%)C1(43/120=35.8%)
C3(38/120=31.7%)C2(35/120=29.2%)C1(39/120=32.5%)
MR: CommunityDR: CommunityIA: Community
8

Supplemental Statistical Methods
For each biomarker and each method (MR, DR and IA), to assess inter-reader agreement, a 2x2 table was constructed for each reader-pair to
group reads into a (+/+), b (+/-), c (-/+), and d (-/-).
Reader Y
+ -
Reader X
+ a b
- c d
The overall percent agreement (OPA) between 2 readers was calculated as 100*(a+d)/(a+b+c+d), i.e., total number of reads in agreement divided
by total number of reads evaluated by both readers. Two-sided, 95% confidence interval for the OPA was calculated using the Wilson (Score)
method. The overall inter-reader OPA was calculated by taking a weighted average of individual reader-pair's OPAs, the weights were the total
number of reads for each reader-pair. Two-sided, 95% confidence interval for the overall inter-reader OPA was calculated using the percentile
bootstrap method.
9
Concordance analysis between 2 readers was assessed by calculating average positive agreement (APA) and average negative agreement (ANA).
The formulas used, following Cicchetti and Feinstein (1990) were:
APA = 2a/(2a+b+c)*100%
ANA = 2d/(2d+b+c)*100%
All confidence intervals for APA and ANA were 2-sided 95% confidence intervals calculated using the percentile bootstrap method according to
Efron and Tibshirani (1993). All data analyses were conducted using SAS 9.3 (SAS Institute Inc., Cary, North Carolina).
Supplemental Statistical References:
1) CLSI. Quality assurance for design control and implementation of immunohistochemistry assays; approved guideline. Wayne, PA, 2011.
2) Cicchetti DVF, A.R. High agreement but low kappa: II. Resolving the paradoxes. Journal of Clinical Epidemiology 1990;43:551-558.
3) Efron BT, Robert J . An Introduction to the Bootstrap (Chapman & Hall/CRC Monographs on Statistics & Applied Probability):
Chapman and Hall/CRC, 1993.
10