· web viewtarget acres: equals the total state-owned land (sol) measured in acres divided by the...
TRANSCRIPT

Request for Information (RFI) 15-600
Real Property Appraisal Services
Exhibit 1
Definitions
General
Alternate Parcel: An ordered selection made to replace an original sampled parcel that cannot be appraised for at least one of the specific reasons stated in procedures.
Economic unit: A collection of parcels under common ownership or operation, which comprise a single economic entity that, for valuation purposes, is treated as a single parcel.
Land Schedule: A mass valuation tool used to develop land value estimates based on land types and sizes.
Property Class Code: A 3-digit numeric code that categorizes property by use.
Taxable Status Date: The “as of” date for the selections inventory. Typically March 1st of the assessment roll year.
Turnaround report: A report that lists the final land and final total values for a parcel, as well as other data pertinent to its valuation.
Valuation Date: The effective date of the appraisal.
Commercial/Industrial
Investment Set Code: A 2-digit numeric code, used to select a Simple Mortgage Equity (SME) rate component of the cap rate. The other component is the effective tax rate.
USED-AS Code: A 3-character alphanumeric code, used to categorize the dominant use of the commercial site for valuation purposes.
Forestry
$/mbf: Dollars per thousand board feet (International 1/4" Log Rule)
Accessible: Land less than or equal to ¼ mile from an all-weather road.
Base Price: Criteria including 'woods-run' log quality, an uncut stand, accessible within ¼ mile of an all-weather road, and topography that allows easy logging.
D-1: Quality of shoreline and water is good to excellent; shoreline is less than or equal to 600 feet from access road.
Cliff: Quality of shoreline is poor due to excessive steepness.

Code: A volume code indicating whether a species is valued in board feet or in cubic feet (pulpwood); varies by region.
Cut Class Factor: A negative adjustment for stands that have been cut, leaving lower quality timber than is found in stands which are uncut.
D-2: Quality of shoreline and water is good to excellent; shoreline is more than 600 feet from access road or is accessible only by boat.
F-1: Quality of shoreline and water is fair to poor; aquatic vegetation is present adjacent to shore; and the shoreline is less than or equal to 600 feet from access road.
F-2: Quality of shoreline and water is fair to poor; aquatic vegetation is present adjacent to shore; and the shoreline is more than 600 feet from access road or is accessible only by boat.
Logging Difficulty: A negative adjustment is applied to timber that is more difficult to access because of steepness of the terrain and/or where access is otherwise especially difficult:
Easy Logging: 0 to 20% slopeDifficult Logging: 20 - 40% slopeUneconomical Logging: greater than 40% slope
Remote: Land greater than or equal to ¼ mile from an all-weather road.
Stand Condition Adjustment: A correction relating to timber volume, whereby stands with a lesser volume of timber tend to have a reduced value, because timber is more dispersed per acre, making it more costly to remove.
Stumpage Value: The price paid for standing timber (usually $/mbf).
Swamp: Quality of shoreline is poor to the extent that frontage is commonly valued as wasteland and rarely on a front foot basis.
Target Acres: Equals the total State-Owned Land (SOL) measured in acres divided by the number of parcels in each town.

Exhibit 2
Commercial Requirements
Approximately 850 commercial appraisals are required each year, based on the actual average number of appraisals completed during the most current complete four year cycle of survey work. ORPTS will require data collection and review of these selections or economic units. Further, comparable commercial sales will need to be collected as supporting documentation. The sales collected should reflect the best available up to a maximum of 1 sale for every 1 subject, or a maximum of 850 commercial sales.
A wide variety of commercial properties are selected as samples. The property class codes used for selection purposes are predominantly those in the 400, 500 and 600 series and can be found in the Property Type Classification Codes. The commercial properties are categorized into Used-As (USDAS) codes for valuation purposes. The commercial USDAS codes begin with A, B, C, D, E, F, G, H, I, J, K or Z and can be found in Appendix C of the Data Collection - Commercial Manual (pages 160-224 & 268-317). The specific USDAS codes that are considered for commercial properties are listed in Appendix A. Based on the 2012, 2013, 2014, and 2015 Survey Appraisals, the following percentages for major Used-As groups can be estimated:
Retail (D) Apartment (A)Office
(E) Warehouse (F)Restaurant
(C)Lodging
(B) Other36% 20% 10% 9% 5% 3% 17%
The expected number of commercial appraisals for each municipality that is scheduled to be part of the 2017 FVM follows. If any of these municipalities start a reassessment project for 2017 they will drop off the list. Further, municipalities that are not currently on the list because they are planning a 2017 reassessment will be added later on if they withdraw from their planned reassessment. Sales volumes that are listed reflect a five year period for calendar years 2011-2015 and give an idea of what to expect for counts in each municipality. Where sales are lacking, it will be necessary to collect sales from comparable municipalities.
2017 Survey Commercial Workload Estimate by Municipality
Region County Town#
Appraisals # Sales / 5 YearsCentral Chemung Horseheads 8 54Central Chenango Columbus 2 3Central Chenango Sherburne 11 11Central Cortland Cortland 11 70Central Madison Hamilton 11 14Central Madison Lenox (CAP 2) 9 19Central Madison Madison 11 6Central Madison Stockbridge (CAP 2) 1 5Central Onondaga Camillus (CAP 4) 10 13Central Onondaga Clay 15 33Central Onondaga Elbridge (CAP 4) 2 6

Central Onondaga Geddes 8 27Central Onondaga Syracuse 27 257Central Oswego Richland 11 30Central St Lawrence Canton 12 16Central St Lawrence Fowler 5 2Central St Lawrence Oswegatchie 11 17Central Tioga Nichols 7 3North Albany Guilderland 12 34North Albany New Scotland 10 14North Fulton Perth 6 7North Hamilton Inlet 6 7North Herkimer Frankfort 10 5North Herkimer German Flatts 12 26North Montgomery Amsterdam (City) 12 58North Montgomery Amsterdam (Town) 12 22North Montgomery Glen 5 5North Montgomery Palatine 10 6North Montgomery St Johnsville 10 9North Schoharie Richmondville 6 7North Warren Bolton 12 13North Warren Glens Falls 12 86North Warren Lake George 12 46North Warren Warrensburg 12 21North Washington Whitehall 10 13South Delaware Sidney 11 17South Dutchess Amenia 11 7South Greene Cairo 11 9South Greene Catskill 10 46South Greene Coxsackie (CAP 1) 7 15South Greene Greenville 11 6South Greene Hunter 12 23South Greene New Baltimore (CAP 1) 4 1South Orange Blooming Grove 15 11South Orange Chester 13 14South Orange Crawford 12 3South Orange Deerpark 11 10South Orange Goshen 11 22South Orange Middletown 15 77South Orange Monroe 21 20South Orange Montgomery 11 29South Orange New Windsor 18 37South Orange Port Jervis 10 14South Orange Wallkill 16 57South Orange Warwick 15 51South Orange Wawayanda 11 11South Orange Woodbury 13 3West Allegany Andover 4 5West Cattaraugus Allegany (CAP 4) 11 30West Erie Aurora 11 56

West Erie Collins 10 7West Erie Concord 11 19West Erie Elma 10 14West Erie Hamburg 15 104West Erie Newstead 9 8West Erie Orchard Park 11 38West Erie Sardinia 10 12West Erie Tonawanda 32 162West Erie West Seneca 14 113West Monroe Brighton 15 68West Monroe Irondequoit 12 40West Steuben Hornellsville 12 19
An estimated commercial workload for the 2018, 2019, and 2020 Surveys can be found in Appendix B. The likelihood that it will match the actual workload is less certain than it is for the 2017 Survey estimate listed above.
The initial commercial individual parcel selections for the 2017 FVM can be found in Appendix C. These properties will most likely need to be appraised. However, if any of the selections are determined to be non-survey usable during data collection, alternate properties may be chosen in their place.
ORPTS will need the data collected on Commercial Property Record Cards and entered into the Real Property System (RPS) for valuation. ORPTS analysts will produce the valuation documents that include: a cost report, and a market and income report. The data included in these reports will be utilized by the appraiser during review.
Although the report for the cost approach to value is rarely used for commercial appraisals, it can be considered for newly constructed properties or for properties that are unique enough that a market or income approach cannot be completed adequately. Further, components of the cost system can be used to establish contributory value when completing other approaches to value. For example, manually adjusted Replacement Cost New Less Depreciation (RCNLD) values of mobile homes are utilized when completing market and income approaches to values for mobile home parks.
Where a cost approach is utilized, a land value estimate must be manually calculated from scratch as land schedule estimates are typically not provided for commercial selections due to the wide variations of commercial land values by property type. The RCNLD estimates for the structures on the property often require adjustments to the physical depreciation, to reflect each parcel’s unique circumstances. Further, functional and external obsolescence are not considered in the ORPTS cost system, therefore adjustments must be made for these when necessary. The end product includes final land and total cost estimates.
An existing Excel workbook template is utilized during the review phase to complete both income and market approaches to value, and to produce a turnaround document for the processing of the value components as well as for both the final land and final total values.

The income approach portion allows the appraiser to list one (1) to three (3) comparable income properties and make adjustments to their Potential Gross Income (PGI) per unit for: size, overall desirability, overall condition, overall grade, year built, and one user-defined feature. The appraiser reconciles the rents into one factor and after entering a vacancy rate, an expense ratio, and an investment set code that selects the cap rate, a total value for the income approach is computed. Default values for the vacancy rate, expense ratio and investment set codes are provided, as part of the valuation documents, to act as a starting point but are typically adjusted by the appraiser for each appraisal. The effective tax rates are also provided as part of the valuation documentation.
Similar to the income approach portion, the market approach portion allows the appraiser to list one (1) to three (3) comparable sale properties and make adjustments to their Time Adjusted Sale Prices (system-generated) per unit for: size, overall desirability, overall condition, overall grade, year built, and one user-defined feature. The appraiser reconciles the market multipliers into one factor and a total value for the market approach is computed.
The three approaches to value are reconciled on the turn-around document where the appraiser records: the final land and final total values, the approaches to value that were used, and any excess land and/or any additional improvement value, if necessary. The appraisals must summarize the appraiser’s analysis and the rationale for the conclusions made. Copies of all supporting sale(s) documentation are required.

Exhibit 3
Farm Requirements
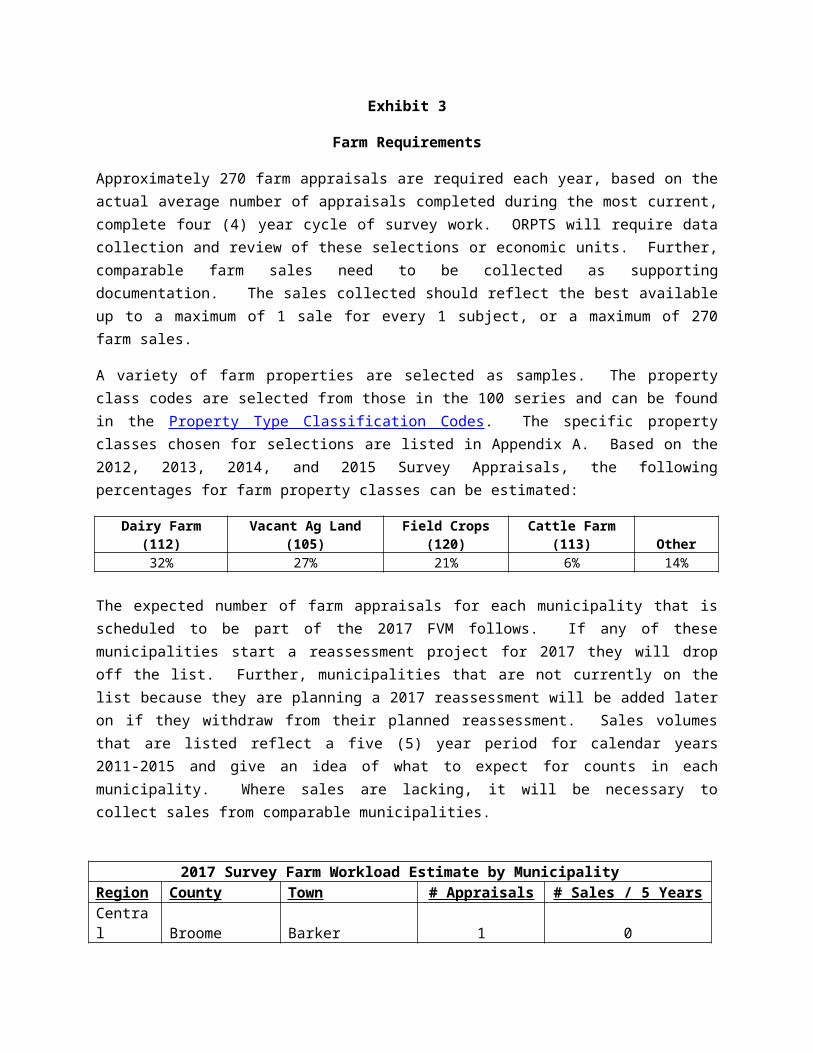
Approximately 270 farm appraisals are required each year, based on the actual average number of appraisals completed during the most current, complete four (4) year cycle of survey work. ORPTS will require data collection and review of these selections or economic units. Further, comparable farm sales need to be collected as supporting documentation. The sales collected should reflect the best available up to a maximum of 1 sale for every 1 subject, or a maximum of 270 farm sales.
A variety of farm properties are selected as samples. The property class codes are selected from those in the 100 series and can be found in the Property Type Classification Codes. The specific property classes chosen for selections are listed in Appendix A. Based on the 2012, 2013, 2014, and 2015 Survey Appraisals, the following percentages for farm property classes can be estimated:
Dairy Farm (112) Vacant Ag Land (105) Field Crops (120) Cattle Farm (113) Other32% 27% 21% 6% 14%
The expected number of farm appraisals for each municipality that is scheduled to be part of the 2017 FVM follows. If any of these municipalities start a reassessment project for 2017 they will drop off the list. Further, municipalities that are not currently on the list because they are planning a 2017 reassessment will be added later on if they withdraw from their planned reassessment. Sales volumes that are listed reflect a five (5) year period for calendar years 2011-2015 and give an idea of what to expect for counts in each municipality. Where sales are lacking, it will be necessary to collect sales from comparable municipalities.
2017 Survey Farm Workload Estimate by MunicipalityRegion County Town # Appraisals # Sales / 5 YearsCentral Broome Barker 1 0Central Broome Colesville 4 2Central Broome Nanticoke 1 1Central Broome Sanford 1 0Central Broome Windsor 3 1Central Cayuga Ira 5 11Central Cayuga Victory 6 0Central Chenango Columbus 1 0Central Chenango Guilford 4 4Central Chenango Lincklaen 5 0Central Chenango New Berlin 3 2Central Chenango Otselic 6 1Central Chenango Pitcher 5 0Central Chenango Sherburne 5 3Central Jefferson Ellisburg 12 5Central Jefferson Lorraine (CAP 1) 3 1Central Jefferson Rodman (CAP 1) 4 3

Central Madison Madison 5 2Central Oneida Steuben 5 2Central Onondaga Fabius (CAP 2) 2 13Central Onondaga Otisco 3 5Central Onondaga Pompey (CAP 2) 5 22Central Oswego Albion 2 0Central St Lawrence Hammond 5 2Central St Lawrence Oswegatchie 8 3Central St Lawrence Pierrepont 1 1Central Tioga Candor 1 1Central Tioga Newark Valley 4 3Central Tioga Tioga 4 0North Fulton Broadalbin 1 0North Fulton Ephratah 4 2North Herkimer Newport 4 4North Herkimer Ohio 1 0North Montgomery Florida 8 5North Montgomery Glen 8 6North Montgomery Palatine 9 32North Montgomery St Johnsville 7 7North Otsego New Lisbon 4 2North Saratoga Stillwater 4 0
North SchoharieEsperance (CAP 1) 3 1
North Schoharie Fulton 3 1North Schoharie Gilboa 3 0North Schoharie Jefferson 2 3North Schoharie Richmondville 2 3North Schoharie Summit 1 0North Washington Argyle 2 3North Washington Hampton 3 0North Washington Whitehall 3 0South Delaware Franklin 1 1South Dutchess Amenia 7 4South Greene Ashland 1 0South Greene Durham 2 3South Orange Greenville 3 1South Orange Minisink 6 2South Orange Mount Hope 3 0West Allegany Almond 3 0West Allegany Andover 3 1West Allegany Angelica 2 0West Allegany Independence 5 2West Cattaraugus Freedom 5 4West Chautauqua Charlotte 2 0West Chautauqua Cherry Creek 3 1West Chautauqua Gerry 2 1West Erie Colden 2 2West Erie Collins 7 9

West Erie Eden 8 8West Erie Marilla 8 9West Erie Sardinia 4 2West Erie Wales 5 2West Steuben Cohocton 6 4West Steuben Greenwood 8 2West Wyoming Bennington 6 7West Yates Jerusalem 5 10
An estimated farm workload for the 2018, 2019, and 2020 Surveys can be found in Appendix D. The likelihood that it will match the actual workload is less certain than it is for the 2017 Survey estimate listed above.
The initial farm land individual parcel selections for the 2017 FVM can be found in Appendix E. These properties will most likely need to be appraised. However alternate properties may be chosen in their place, if any of the selections are determined to be non-survey usable during data collection.
ORPTS will require the data be collected on Residential, Farm and Vacant Land Property Record Cards and be entered into the RPS for valuation. The valuation documents will be completed by ORPTS analysts and include cost and comparable sales. All of these cases will require review, and in most cases, manual adjustments, and a reconciliation of values into final land and final total estimates.
The cost documentation often requires adjustments to the land schedule estimates to reflect each parcel’s unique circumstances that can influence land values. For example, a parcel’s irregular shape or hilly topography would not typically be considered in the land schedule estimate and would require adjustments. The Replacement Cost New Less Depreciation (RCNLD) estimates for the structures on the property often require adjustments to the physical depreciation, again to reflect each parcel’s unique circumstances. Further, functional and external obsolescence are not considered in the ORPTS cost system, therefore adjustments must be made for these when necessary. Final land and total cost estimates need to be produced.
The comparable sales document includes data for the subject and anywhere from 3 to 5 comparable sales depending upon availability. The appraiser is often required to search for comparable sales when the valuation system does not produce the best available sales and manually add them to the documents. The documents require manual adjustments to the sales for various differences they may have from the subject. For example, a sale with 20 acres of tillable land would normally require a positive dollar adjustment when compared to a subject with 30 tillable acres. The adjustments for each sale need to be summed and added to the Time Adjusted Sale Price (system-generated) to produce individual total value estimates. Multiple sale total value estimates need to be reconciled into final land and total value comparable sale estimates.
The cost value estimates and comparable sale value estimates need to be reconciled into an overall land and total value estimate for each parcel and are typically recorded on the
comparable sales documents. The appraisals must summarize the appraiser’s analysis and the rationale for the conclusions made. Copies of all supporting sale documentation are required.

Exhibit 4
Forestry Requirements
Approximately 80 forestry appraisals are required each year, based on the actual average number of selections completed during the most current complete four (4) year cycle of survey work. ORPTS will require data collection and review of these selections or economic units. Further, all available comparable forestry sales need to be collected as supporting documents.
The property class codes are selected from are those in the 900 series and can be found in the Property Type Classification Codes. The specific property classes chosen for selections are listed in Appendix A. Property classes 911 and 912 reflect forest land with a partial taxation exemption under Real Property Tax Laws 480 and 480-a, respectively. Based on the 2012, 2013, 2014, and 2015 Survey Appraisals, the following percentages for forestry property classes can be estimated:
Private Forest (910)
Forest Land RPTLSection 480-a (912)
Private Hunting/Fishing (920)
Forest Land RPTLSection 480 (911)
83% 9% 7% 1%
The expected number of forestry appraisals for each municipality that is scheduled to be part of the 2017 FVM follows. If any of these municipalities start a reassessment project for 2017 they will drop off the list. Further, municipalities that are not currently on the list because they are planning a 2017 reassessment will be added later on if they withdraw from their planned reassessment. Sales volumes that are listed reflect a five (5) year period for calendar years 2011-2015 and give an idea of what to expect for counts in each municipality. Where sales are lacking, it will be necessary to collect sales from comparable municipalities.
2017 Survey Forestry Workload Estimate by MunicipalityRegion County Town # Appraisals # Sales / 5 YearsCentral Chenango Guilford 1 0Central Lewis Lyonsdale 3 5Central St Lawrence Clare 7 2Central St Lawrence Edwards 4 0Central St Lawrence Parishville 2 4North Franklin Santa Clara 1 0North Fulton Caroga 1 0North Herkimer Ohio 3 12North Herkimer Webb 1 0North Washington Fort Ann 1 5North Washington Whitehall 1 0West Steuben Cohocton 1 0
An estimated forestry workload for the 2018, 2019, and 2020 Surveys can be found in Appendix F. The likelihood that the estimate will match the actual workload is less certain than it is for the 2017 Survey estimate listed above.

The initial forestry individual parcel selections for the 2017 FVM can be found in Appendix G. These properties will most likely need to be appraised. However, if any of the selections are determined to be non-survey usable during data collection, alternate properties would be chosen in their place.
ORPTS will require the data collected on Forest Land Appraisal Data Collection Cards (sample on pages 37-38) and entered into the RPS system for valuation. The valuation documents will be completed by ORPTS analysts and include cost only. The cost document will require review, manual adjustments in most cases, and a reconciliation of values into land and final estimates.
A comparable sales approach to value is completed using an existing Excel workbook. The comparable sales are adjusted for differences in bare land value, waterfront value, timber value, and minor improvement value if any. The adjustments for each sale need to be summed and added to the Time Adjusted Sale Price to produce individual total value estimates. Multiple sale total value estimates need to be reconciled into final land and total value comparable sale estimates.
The cost value estimates and comparable sale value estimates need to be reconciled into an overall land and total value estimate for each parcel and are typically recorded on the comparable sales documents. The appraisals must summarize the appraiser’s analysis and the rationale for the conclusions made. Copies of all supporting sale(s) documentation are required.
In addition, ORPTS will require an annual maintenance of three (3) schedules that are utilized in their mass appraisal valuation system. The schedules are: a bare land schedule, a waterfront land schedule, and a schedule of stumpage prices. The details for each of these are as follows:
1.) Bare Land Schedules – schedules used to develop values for land committed to vegetative growth that has no merchantable (marketable) standing timber. Each municipality in the State with forest land is included in the schedule. Currently there are 395 municipalities that meet this criterion. The schedules includes unique values for Accessible ($/acre), Remote ($/acre), and Target Acres (acres/parcel).
2.) Waterfront Land Schedules – schedules used to develop values for forested parcels with waterfront. Each municipality in the State with waterfront forest land is included in the schedule. Currently there are entries for 500 distinct lakes and ponds in the schedule. The schedules includes unique values for D1 ($/acre), D2 ($/acre), F1 ($/acre), F2 ($/acre), Cliff ($/acre), Swamp ($/acre), and Island Trend (multiplicative factor). Cliff, Swamp and Island Trend factors are only included where applicable.
3.) Stumpage Prices Schedules – schedules used to develop values for timber on forestry parcels. Currently there are six schedules used for various geographical areas throughout New York State. Each schedule includes base price values for various tree species and includes both sawlog ($/Mbf) and cordwood ($/Cunit) categories. The schedule also includes factors to adjust the base price values for: slope of land, ease of access, cut and standing timber and density of the timber.

Maintenance of the Bare Land Schedules and Waterfront Land Schedules requires the data collection of vacant land sales and forestry sales, both with and without waterfront on Forest and Lakeshore Sales Data Collection Cards (sample on pages 21-22), with minor improvements collected on Residential, Farm and Vacant Land Property Record Cards. The guidelines for collecting the sales are listed in section one of the forestry manual. The data for these sales are also used for the comparable sale approach mentioned above.
Stumpage Prices Schedules are maintained using the principle and descriptions identified on pages 1-3 of section four (4) in the forestry manual. The values are derived through interviews of people in the wood-using industry, from a semi-annual report produced by NYS Department of Environmental Conservation, and, to a lesser degree, sawmill prices after using a residual method. The stumpage price varies by: species, size of logs, distance from roads, terrain, and distance from sawmills, etc.
Copies of all supporting documentation used in the development of the above schedules are required.

Exhibit 5
Industrial Requirements
Approximately 90 industrial appraisals are required each year, based on the actual average number of selections completed during the most current complete four (4) year cycle of survey work. ORPTS will require data collection and review of these selections or economic units. Further, all available comparable industrial sales and vacant industrial land sales will need to be collected as supporting documents.
A wide variety of industrial properties are selected as samples. The property class codes are predominantly selected from those in the 700 series and can be found in the Property Type Classification Codes. The industrial properties are categorized into Used-As (USDAS) codes for valuation purposes. The industrial USDAS codes begin with K, L, M, Q, and Z and can be found in Appendix C of the Data Collection - Commercial – Public Version Manual (pages 225-259, 266-267, & 275-278). The specific USDAS codes that are considered industrial properties are listed in Appendix A. Based on the 2012, 2013, 2014, and 2015 Survey Appraisals, the following percentages for industrial property classes can be estimated:
Manufacturing (710-715) Oil/Gas Wells (731-733) Mining and Quarrying (720-729) Other83% 13% 1% 3%
The expected number of industrial appraisals for each municipality that is scheduled to be part of the 2017 FVM follows. If any of these municipalities start a reassessment project for 2017 they will drop off the list. Further, municipalities that are not currently on the list because they are planning a 2017 reassessment will be added later on if they withdraw from their planned reassessment. Sales volumes that are listed reflect a five (5) year period for calendar years 2011-2015 and give an idea of what to expect for counts in each municipality. Where sales are lacking, it will be necessary to collect sales from comparable municipalities.
2017 Survey Industrial Workload Estimate by MunicipalityRegion County Town # Appraisals # Sales / 5 YearsCentral Chemung Horseheads 4 1Central Chenango Columbus 2 0Central Chenango Sherburne 1 1Central Cortland Cortland 1 1Central Madison Hamilton 1 1Central Madison Lenox (CAP 2) 1 2Central Madison Lincoln (CAP 2) 1 0Central Madison Madison 1 0Central Onondaga Clay 1 5Central Onondaga Geddes 4 0Central Onondaga Syracuse 1 4Central Oswego Richland 1 1Central St Lawrence Fowler 7 0Central St Lawrence Oswegatchie 1 0

North Albany New Scotland 2 0North Herkimer Frankfort 2 2North Montgomery Glen 1 0North Montgomery Palatine 2 0North Montgomery St Johnsville 2 1North Warren Glens Falls 1 2North Washington Whitehall 2 0South Delaware Sidney 1 2South Dutchess Amenia 1 1South Greene Cairo 1 0South Greene Catskill 2 0South Greene Coxsackie 1 0South Greene Greenville 1 0South Orange Chester 2 3South Orange Deerpark 1 1South Orange Goshen 1 1South Orange Montgomery 1 2South Orange Port Jervis 2 0South Orange Wawayanda 1 0West Allegany Andover 2 0West Cattaraugus Allegany (CAP 4) 1 0West Erie Aurora 1 0West Erie Collins 2 0West Erie Concord 1 2West Erie Elma 2 0West Erie Newstead 3 1West Erie Orchard Park 1 2West Erie Sardinia 1 0West Erie Tonawanda 1 7West Erie West Seneca 1 3
An estimated industrial workload for the 2018, 2019, and 2020 Surveys can be found in Appendix H. The likelihood that the estimate will match the actual workload is less certain than it is for the 2017 Survey estimate listed above.
The initial industrial individual parcel selections for the 2017 FVM can be found in Appendix I. These properties will most likely need to be appraised. However if any of the selections are determined to be non-survey usable during data collection, alternate properties would be chosen in their place.
ORPTS will need the data collected on Commercial Property Record Cards and entered into the Real Property System (RPS) for valuation. ORPTS analysts will produce the valuation documents that include only cost estimates. The cost report includes buildings and structures but does not normally include a land value estimate. In most cases, the Replacement Cost New Less Depreciation (RCNLD) values that are produced require manual adjustments for parcel specific circumstances and typically require adjustments for obsolescence as well.

Industrial selection appraisal reports must summarize the appraiser’s analysis and the rationale for the conclusions made. A narrative report format or one of two templates (a Complex Appraisal Review Form or a Highly Complex Ltd. Summary Appraisal Form) will be required for each appraisal. The appraisals must summarize the appraiser’s analysis and the rationale for the conclusions made. Copies of all supporting sale(s) documentation are also required.

Exhibit 6
Residential Requirements
On average, about 7,000 residential selections are made each survey. However, the vast majority of the selections are not appraised because the value of the residential class of properties can be more economically determined via statistical studies of sales ratios or of Computer Assisted Mass Appraisal (CAMA) ratios, or of both. Residential appraisals are only completed in municipalities that have too few sales for sales ratio studies and that are also lacking adequate inventory to produce CAMA ratio study estimates. In other words, they are areas where the appraisals are difficult to complete due to a lack of available market data and inventories.
Due to the practice of using ratio studies in place of appraisals, the average of 7,000 residential selections is culled to an average of approximately 770 residential appraisals per year. ORPTS will require data collection and review of these appraisals. Further, comparable residential sales need to be collected as supporting documents. The comparable residential sales collected should reflect the best available up to a maximum of 1 sale for every 1 subject, or a maximum of 770 residential sales.
A variety of residential properties are selected as samples. The property class codes are selected from those in the 200 series and can be found in the Property Type Classification Codes. The specific property classes chosen for selections are listed in Appendix A. Based on the 2012, 2013, 2014, and 2015 Survey Appraisals, the following percentages for residential property classes can be estimated:
One Family Year Round (210)
Rural Residence with Acreage (240)
Manufactured Housing (270)
Seasonal Residences (260) Other
59% 12% 12% 11% 6%
The expected number of residential appraisals for each municipality that is scheduled to be part of the 2017 FVM follows. If any of these municipalities start a reassessment project for 2017 they will drop off the list. Further, municipalities that are not currently on the list because they are planning a 2017 reassessment will be added later on if they withdraw from their planned reassessment. Sales volumes that are listed reflect an average per year for calendar years 2011-2015 and give an idea of what to expect for counts in each municipality. Where sales are lacking, it will be necessary to collect sales from comparable municipalities.
2017 Survey Residential Workload Estimate by MunicipalityRegion County Town # Appraisals # Sales/YearCentral Broome Nanticoke 33 5Central Broome Sanford 47 20Central Cayuga Ira 39 17Central Cayuga Victory 36 9Central Chenango Columbus 28 8Central Chenango Lincklaen 23 3Central Chenango Otselic 27 7

Central Chenango Pharsalia 24 3Central Chenango Pitcher 26 5Central Jefferson Lorraine (CAP 1) 17 7Central Jefferson Rodman (CAP 2) 20 7Central Lewis Lyonsdale 26 10Central Oneida Steuben 34 6Central Onondaga Otisco 59 16Central Oswego Albion 36 1Central St Lawrence Clare 10 1Central St Lawrence Edwards 31 2Central St Lawrence Fowler 41 17Central St Lawrence Parishville 40 16Central St Lawrence Pierrepont 48 22North Franklin Santa Clara 36 10North Fulton Bleecker 38 6North Fulton Caroga 57 20North Fulton Ephratah 41 8North Fulton Perth 40 20North Hamilton Inlet 38 9North Montgomery Glen 27 12North Montgomery Palatine 28 20North Montgomery St Johnsville 27 14North Otsego New Lisbon 31 7North Schoharie Fulton 37 11North Schoharie Gilboa 47 15North Schoharie Jefferson 42 12North Schoharie Summit 42 16North Washington Fort Ann 56 33North Washington Hampton 34 4West Allegany Andover 33 11West Chautauqua Charlotte 38 8West Chautauqua Cherry Creek 32 6West Steuben Greenwood 23 6
An estimated residential workload for the 2018, 2019, and 2020 Surveys can be found in Appendix J. The likelihood that the estimate will match the actual workload is less certain than it is for the 2017 Survey estimate listed above.
The initial residential individual parcel selections for the 2017 FVM can be found in Appendix K. These properties will most likely need to be appraised. However, if any of the selections are determined to be non-survey usable during data collection, alternate properties would be chosen in their place.
ORPTS will require the data be collected on Residential, Farm and Vacant Land Property Record Cards and be entered into the RPS for valuation. The valuation documents will be completed by ORPTS analysts and include: cost and comparable sales. All of these cases will

require review, and in most cases manual adjustments, and a reconciliation of values into final land and final total estimates.
The cost documentation often requires adjustments to the land schedule estimates to reflect each parcel’s unique circumstances that can influence land values. For example, a parcel’s irregular shape or hilly topography would not typically be considered in the land schedule estimate and would require adjustments. The Replacement Cost New Less Depreciation (RCNLD) estimates for the structures on the property often require adjustments to the physical depreciation, again, to reflect each parcel’s unique circumstances. Further, functional and external obsolescence are not considered in the ORPTS cost system, therefore adjustments must be made for these when necessary. Final land and total cost estimates need to be produced.
The comparable sales document includes data for the subject and anywhere from three (3) to five (5) comparable sales depending upon availability. The appraiser is often required to search for comparable sales when the valuation system does not produce the best available sales and manually add them to the documents. The documents require manual adjustments to the sales for various differences they may have from the subject. For example a sale with 2.0 baths would normally require a positive dollar adjustment when compared to a subject with 2.5 baths. The adjustments for each sale need to be summed and added to the Time Adjusted Sale Price (system-generated), to produce individual total value estimates. Multiple sale total value estimates need to be reconciled into final land and total value comparable sale estimates.
The cost value estimates and comparable sales value estimates need to be reconciled into an overall land and total value estimate for each parcel and are typically recorded on the comparable sales documents. The appraisals must summarize the appraiser’s analysis and the rationale for the conclusions made. Copies of all supporting sale(s) documentation are required.

Exhibit 7
Utility Requirements
Approximately 150 utility companies are appraised each year and most are economic units that consist of many individual parcels. ORPTS will require data collection and review of these selections or economic units and that have the values allocated at a parcel level. All economic and comparable utility sales data, including the appraiser’s notes and reasoning, also need to be collected and provided as supporting documentation. In addition, the appraisers may be required to obtain sensitive data considered trade secret to the property owners. In such cases, the appraisers will be required to sign non-disclosure agreements for both the owners and ORPTS.
A wide variety of utility properties are selected as samples. The property class codes are selected from those that range between 736 and 885 and can be found in the Property Type Classification Codes. The specific property classes chosen for selections are listed in Appendix A. Based on the 2012, 2013, 2014, and 2015 Survey Appraisals, about 9% of the utility properties are power-generating facilities.
The expected number of utility appraisals for each municipality that is scheduled to be part of the 2017 FVM Survey, part of a blended trend analysis, or scheduled 2017 reassessment project follows. There will most likely be other municipalities added to the list as plans for 2017 reassessments are submitted.
2017 Survey Utility Workload Estimate by MunicipalityRegion County Town # Companies AppendixCentral Chenango Columbus 1 MCentral Cortland Lapeer 1 OCentral Jefferson Theresa 2 OCentral Jefferson Wilna 3 NCentral Lewis Croghan 2 NCentral Lewis Lewis 1 NCentral Lewis Lyonsdale 5 M & NCentral Oneida Lee 1 NCentral Oneida Trenton 1 NCentral Oswego Oswego 2 NCentral Oswego Scriba 1 M & NCentral Oswego Volney 1 OCentral St Lawrence Colton 1 NCentral St Lawrence Edwards 1 M & NCentral St Lawrence Fine 1 NCentral St Lawrence Fowler 4 M & NCentral St Lawrence Parishville 2 M & NCentral St Lawrence Pierrepont 1 M & NNorth Albany New Scotland 2 MNorth Clinton Saranac 1 NNorth Columbia Taghkanic 1 ONorth Essex Chesterfield 1 O

North Fulton Ephratah 2 MNorth Fulton Oppenheim 1 NNorth Fulton Stratford 1 ONorth Herkimer Manheim 2 NNorth Herkimer Russia 1 NNorth Saratoga Malta 1 ONorth Saratoga Moreau 2 NNorth Saratoga Stillwater 2 M & NNorth Schoharie Gilboa 1 M & NNorth Washington Greenwich 1 OSouth Delaware Andes 1 O & NSouth Delaware Colchester 1 NSouth Delaware Deposit 1 NSouth Delaware Roxbury 1 OSouth Delaware Tompkins 1 NSouth Orange Highlands 1 OSouth Putnam Carmel 2 OSouth Putnam Patterson 1 OSouth Suffolk Southampton 1 OSouth Sullivan Lumberland 1 OSouth Sullivan Neversink 1 NSouth Ulster Hurley 1 NSouth Ulster Olive 1 NSouth Ulster Wawarsing 1 NSouth Westchester North Salem 1 OWest Allegany Andover 2 MWest Allegany Angelica 3 MWest Allegany Independance 2 MWest Allegany Willing 1 OWest Cattaraugus Allegany 1 OWest Chautauqua Ellicott 4 OWest Chautauqua Poland 1 NWest Erie Amherst 1 OWest Erie Collins 4 MWest Erie Wales 4 MWest Monroe Mendon 1 OWest Niagara Cambria 1 OWest Niagara Lockport 1 OWest Ontario Canadice 1 OWest Ontario Phelps 1 OWest Ontario West Bloomfield 1 OWest Orleans Barre 1 OWest Steuben Canisteo 1 O & NWest Wyoming Arcade 1 OWest Wyoming Coventry 1 N
An estimated utility workload for the 2018, 2019, and 2020 Surveys can be found in Appendix L. The likelihood that the estimate will match the actual workload is less certain than it is for the

2017 Survey estimate included in the table listed above. Estimating future utility work due to reassessments is not possible at this time.
The initial individual utility selections for the 2017 FVM can be found in Appendix M. The Power Plant selections listed are typically made up of numerous parcels that extend into multiple municipalities and must be valued as economic units. The list only includes those municipalities that were specifically needed for the 2017 FVM and does not include other municipalities that may be related to the hydros. However, the final appraisal must include all parcels related to each plant, regardless of which municipality they are located in. The Non-Power Plant selections listed are the specific parcels chosen for the 2017 FVM, each of these selections may or may not need to be combined with other parcels into economic units for valuation and review; these determinations are made during data collection.
ORPTS maintains a statewide list of utility properties that are considered large facilities which can be found in Appendix N. These properties must be valued each year for a blended trend analysis. They will have a valuation date of 7/1/2016 for this cycle. The parcels flagged with an asterisk are also included on the list for survey selections in Appendix M.
The estimated utility workload for the currently scheduled 2017 revaluations is listed in Appendix O. These appraisals will be considered either advisories or value verifications and will have a valuation date of 7/1/2016. Advisory appraisals of utility properties occur when reassessment municipalities request them, whereas value verification appraisals of utility properties occur when reassessment municipalities do not request advisories.
ORPTS will need data collected in a uniform manner and be entered into the RPS for valuation. The appraiser will produce the cost valuation documents within the RPS and supply these documents to ORPTS as part of their review.
A Reproduction Cost New Less Depreciation cost approach must be used in the valuation of non-generation utility properties as they are considered “specialty property” in New York State. The cost reports include improvements only and land value estimates need to be determined where a land value is required by ORPTS. Selections that reflect improvements only, do not require land value estimates. Further, cost approaches typically require adjustments for obsolescence and require analyses of very detailed operating and financial information provided to the appraiser by the property owner. All factors to the cost approach such as original costs, units of physical property, valuation indices, unit prices, depreciation methods and formulas, etc. must be maintained for every cost approach value.
Non-specialty properties, such as electric generating facilities, are often valued using both income and sales comparison approaches. Currently, an Excel-based valuation model is utilized during the review phase to complete both the income and the sales comparison approaches for non-specialty properties. Income approach components, such as current market price data and expense ratios are derived from various published sources, as well as from data provided by property owners. Current and projected income data are used to produce values and cap rates for the income approaches to value. The final income estimates are based on direct capitalization and total values are recorded in the ORPTS valuation system.

Comparable sales approaches are completed for non-specialty properties when available market data exists.
Individual plant level values for a non-specialty property, within a municipality, may be synthesized from the economic unit values by using the proportion of each plant’s cost approach value estimate to the economic unit’s cost approach value estimate. As the allocated values can be points of contention, complex engineering skills may be required to produce adequate cost approach values for power plants and other complex property types.
Finally, utility appraisal reports must summarize the appraiser’s analysis and the rationale for the conclusions made.

Exhibit 8
Vacant Land Requirements
Approximately 560 vacant land appraisals are required each year, based on the actual average number of appraisals completed during the most current complete four (4) year cycle of survey work. ORPTS will require data collection and review of these selections or economic units. Further, comparable vacant land sales will need to be collected as supporting documentation. The sales collected should reflect the best available up to a maximum of 1 sale for every 1 subject, or a maximum of 560 vacant land sales.
A variety of vacant land properties are selected as samples. The property class codes are selected from are those in the 300 series and can be found in the Property Type Classification Codes. The specific property classes chosen for selections are listed in Appendix A. Based on the 2012, 2013, 2014, and 2015 Survey Appraisals, the following percentages for vacant land property classes can be estimated:
Rural < 10 AC (314)
Residential > 10 AC (322)
Residential Vacant (311)
Residential Vacant w/small improvement (312)
Other Rural Vacant (322) Other
25% 24% 22% 13% 6% 10%
The expected number of vacant land appraisals for each municipality that is scheduled to be part of the 2017 FVM follows. If any of these municipalities start a reassessment project for 2017 they will drop off the list. Further, municipalities that are not currently on the list because they are planning a 2017 reassessment will be added later on if they withdraw from their planned reassessment. Sales volumes that are listed reflect a five (5) year period for calendar years 2011-2015 and give an idea of what to expect for counts in each municipality. Where sales are lacking, it will be necessary to collect sales from comparable municipalities.
2017 Survey Vacant Land Workload Estimate by MunicipalityRegion County Town # Appraisals # Sales / 5 YearsCentral Broome Barker 11 25Central Broome Colesville 11 29Central Broome Nanticoke 11 10Central Broome Sanford 14 30Central Broome Windsor 12 35Central Cayuga Ira 7 31Central Cayuga Victory 6 15Central Chenango Columbus 11 47Central Chenango Guilford 7 24Central Chenango Lincklaen 7 21Central Chenango New Berlin 9 15Central Chenango Otselic 6 15Central Chenango Pharsalia 12 19Central Chenango Pitcher 7 39Central Chenango Sherburne 7 15Central Jefferson Ellisburg 3 29

Central Jefferson Lorraine (CAP 1) 4 12Central Jefferson Rodman (CAP 1) 1 10Central Lewis Lyonsdale 9 16Central Madison Madison 7 22Central Oneida Steuben 7 14Central Onondaga Fabius (CAP 2) 4 14Central Onondaga Otisco 9 31Central Onondaga Pompey (CAP 2) 4 67Central Oswego Albion 10 3Central St Lawrence Clare 6 1Central St Lawrence Edwards 8 1Central St Lawrence Hammond 7 37Central St Lawrence Oswegatchie 4 34Central St Lawrence Parishville 10 13Central St Lawrence Pierrepont 11 16Central Tioga Candor 14 41Central Tioga Newark Valley 8 29Central Tioga Tioga 8 20North Franklin Santa Clara 11 14North Fulton Bleecker 12 17North Fulton Broadalbin 11 37North Fulton Caroga 14 16North Fulton Ephratah 8 10North Herkimer Newport 8 29North Herkimer Ohio 12 37North Herkimer Webb 14 62North Montgomery Florida 4 33North Montgomery Glen 4 17North Montgomery Palatine 3 33North Montgomery St Johnsville 5 6North Otsego New Lisbon 8 29North Saratoga Stillwater 26 78North Schoharie Esperance (CAP 1) 4 16North Schoharie Fulton 9 27North Schoharie Gilboa 9 50North Schoharie Jefferson 10 42North Schoharie Richmondville 10 16North Schoharie Schoharie (CAP 1) 5 24North Schoharie Summit 11 31North Washington Argyle 10 39North Washington Fort Ann 14 58North Washington Hampton 9 23North Washington Whitehall 8 36South Delaware Franklin 14 37South Dutchess Amenia 5 13South Greene Ashland 11 20South Greene Durham 10 34South Orange Greenville 9 21South Orange Minisink 6 7

South Orange Mount Hope 9 19South Orange Port Jervis 5 4South Orange Tuxedo 12 10West Allegany Almond 9 23West Allegany Andover 9 21West Allegany Angelica 10 33West Allegany Independence 7 9West Cattaraugus Freedom 7 23West Chautauqua Charlotte 10 12West Chautauqua Cherry Creek 9 6West Chautauqua Gerry 10 9West Erie Colden 10 32West Erie Collins 5 18West Erie Eden 4 52West Erie Marilla 4 39West Erie Sardinia 8 21West Erie Tonawanda 3 20West Erie Wales 7 18West Steuben Cohocton 5 19West Steuben Greenwood 4 16West Wyoming Bennington 6 29West Yates Jerusalem 10 69
An estimated vacant land workload for the 2018, 2019 and 2020 Surveys can be found in Appendix O. The likelihood that it will match the actual workload is less certain than it is for the 2017 Survey estimate listed above.
The initial vacant land individual parcel selections for the 2017 FVM can be found in Appendix P. These properties will most likely need to be appraised. However if any of the selections are determined to be non-survey usable during data collection, alternate properties would be chosen in their place.
ORPTS will require the data be collected on Residential, Farm and Vacant Land Property Record Cards and be entered into the RPS for valuation. The valuation documents will be completed by ORPTS analysts and include cost and comparable sales. These will require review, manual adjustments in most cases, and a reconciliation of values into final land and final total estimates.
The cost documentation often requires adjustments to the land schedule estimates to reflect the unique circumstances that can influence each parcel’s land values. For example, a parcel’s irregular shape or hilly topography would not typically be considered in the land schedule estimate and would require adjustments. Vacant land parcels can include improvements such as barns, garages, pools, etc., but most do not. When improvements are included, the Replacement Cost New Less Depreciation (RCNLD) estimates for the structures on the property often require adjustments to the physical depreciation, to reflect each parcel’s unique circumstances. Further, functional and external obsolescence are not considered in the ORPTS

cost system, therefore adjustments must be made for these when necessary. Final land and total cost estimates need to be produced.
The comparable sales document includes data for the subject and anywhere from three (3) to five (5) comparable sales depending upon availability. The appraiser is often required to search for comparable sales when the valuation system does not produce the best available sales and manually add them to the documents. The documents require manual adjustments to the sales for various differences they may have from the subject. For example, a sale with no utilities available would normally require a positive dollar adjustment when compared to a subject that has gas and electric available. The adjustments for each sale need to be summed and added to the Time Adjusted Sale Price (system-generated) to produce individual total value estimates. The total value estimates for each comparable sale needs to be reconciled into final land and total value comparable sales estimates.
The cost value estimates and comparable sales value estimates need to be reconciled into an overall land and total value estimate for each parcel and are typically recorded on the comparable sales documents. The appraisals must summarize the appraiser’s analysis and the rationale for the conclusions made. Copies of all supporting sale(s) documentation are required.