education.curent.utk.edu€¦ · web viewthese lessons are focused on the importance of...
TRANSCRIPT

Title ndash Analyzing Correlations Climate Change Impacts and Renewable SolutionsBy ndash Laura RobertsPrimary Subject ndash MathematicsPre-AlgebraGrade Level ndash 8
Description
These lessons are focused on the importance of engineering based on climate trends and the need to focus on energy The first lesson introduces correlations and the math concepts continue on to linear fittrend lines To make a relevant assessment students will analyze trends in engineering Their final activity is a hands-on application relating to solar energy Students will collect data and determine correlationwhether or not there is a linear representation
Why should our students learn about renewable energy and energy conservation
Climate is arguable the most important global issue for this generation of students
GoalsObjectives
Students will be able to identify current trends in carbon emissions and their global implications
Students will analyze trends in data related to climate changeengineering trends
Students will be able to explain the importance of lowering emissionsinvesting in engineering
Students will collect data to build scatter plots modeling solar power
Students will analyze impacts of climate change on specific populations
Tennessee 8th Grade Math Standards Addressed
F4 Construct a function to model a linear relationship between two quantities Determine the rate of change and initial value of the function from a description of a relationship or from two (x y) values including reading these from a table or from a graph Interpret the rate of change and initial value of a linear function in terms of the situation it models and in terms of its graph or a table of values
SP1 Construct and interpret scatter plots for bivariate measurement data to investigate patterns of association between two quantities Describe patterns such as clustering outliers positive or negative association linear association and nonlinear association
SP2 Know that straight lines are widely used to model relationships between two quantitative variables For scatter plots that suggest a linear association informally fit a straight line and informally assess the model fit by judging the closeness of the data points to the line
SP3 Use the equation of a linear model to solve problems in the context of bivariate measurement data interpreting the slope and intercept For example in a linear model for a biology experiment interpret a slope of 15 cmhr as meaning that an additional hour of sunlight each day is associated with an additional 15 cm in mature plant height
SP4 Understand that patterns of association can also be seen in bivariate categorical data by displaying frequencies and relative frequencies in a two-way table Construct and interpret a two-way table summarizing data on two categorical variables collected from the same subjects Use relative frequencies calculated for rows or columns to describe possible association between the two variables For example collect data from students in your class on whether or not they have a curfew on school nights and whether or not they have assigned chores at home Is there evidence that those who have a curfew also tend to have choresLesson 1
MaterialsResources (30 students)
350org ldquoDo the Mathrdquo video httpswwwyoutubecomwatchv=KuCGVwJIRd0 Smartboard to Display video
Step-by-Step Procedure
Hook Why is Energy a Global Problem Introduce students to 9 of the top ten global problems (have them written on board) Ask
them why these are problemshow we can use energy to solve these problems The nine problems are Water Food Environment Poverty Terrorism amp War Disease Education Democracy and population Maybe include a quote for each
Ask students what they think the 10th global problem is (energy) Get student opinions on why energy might be a global problem
Introduce student to 3 numbers 2 565 2795 Have them guess what they might represent Show clips from ldquoDo the Mathrdquo First 2degC and 565 (565 billion gigatons of carbon is the max
we have agreed to let into the atmosphere) Re-visit objective (scatter plotcorrelation) without the students knowing what the current amount of carbon is we have emitted
Provide direct instruction on constructing scatter plotsdetermining correlation Have students create a scatter plot for data concerning tons of carbon ppm in the atmosphere
Data ftpaftpcmdlnoaagovproductstrendsco2co2_annmean_mlotxt
Once students see the carbon in the atmosphere they can make guesses as to how many tons have been released
Show clip concluding the 565 and showing the last number Students will see that we are expected to hit 565 gigatons of carbon in the next 15 years and there are 2795 billion gigatons of carbon currently in reserves
Homework Create scatter plotsdetermine correlation for major effects of climate change (temperature arctic ice and sea levels)Source
Data for Lesson 1
wwwclimatenasagovhttpdatagissnasagovgistemptabledata_v3GLBTs+dSSTtxt
httpnsidcorgarcticseaicenewshttpnsidcorgdatamasie
httpclimatenasagovvital-signssea-levelhttpclimatenasagovsysteminternal_resourcesdetailsoriginal121_Global_Sea_Level_Data_Filetxt
Lesson 2 Creating Trend Lines and Analyzing Climate Change Impacts for Specific Populations
Objectives Students will create trend lines to interpret data
Introduction The teacher will have an informal discussion of the trends the students found from their homework Which had positivewhich had negative
The teacher picks one graphhelliprising sea levels-What do you think the change will be in 2019-How did you get your answer -Why would we want to predict future numbers
bullThe objective of trend lines can now be introduced and the teacher draws a trend line through the sea level data Not much direct instruction is included here since the students still need to be hooked Potential questions to ask the students are
-What does this line show-How does it help us-What do you think could be some implications of rising sea levelsbull
Hook Video This video is a trailer for a documentary about the president of the Republic of the Maldives which is a nation identified as being high-risk in regard to climate change httptheislandpresidentcomwp-video-lightbox[iframes]0
Now the students can receive more detailed direct instruction regarding trend lines and part of this instruction will involve creating a trend line for the Maldives sea level rises
Students can work with a partner or individually to create trend lines for the scatter plots they completed for homework
Homework Students will analyze data sets for different populations to see the different effects of climate change The selected populationsissues are as follows
-Tanzania TemperaturesCoffee Production-Southern Africa TemperaturesMaize Production (soil moisture)-New York Temp IncreasePrecipitation Increase
bullThe homework will also ask the students to respond to the following quote by suggesting some possible solutions to the climate change problem This will help prepare them for the final lesson
ldquoCreativity is not just for artistshellipits for engineers trying to solve a problem its for parents who want their children to see the world in more than one wayrdquo - Twyla Tharp
httpwwwbrainyquotecomquoteskeywordsengineershtmlbwwyXSbVuAqIWBUA99
The following are some higher order thinking questions that can also be included in the studentsrsquo homework assignment
-How does this data affect the populations of the respective countries How do you think they are responding to the data-Who should be the most concerned out of all the populations Least concerned Why
-Do you think we are affected by the trends in different citiescountries Explain your reasoning
Data for Lesson 2
Mӧrner Nils-Axel ldquoThe Maldives A Measure of Sea Level Changes and Sea Level Ethicsrdquo Paleogeophysics and Geodynamics Rӧsundavӓgen 17 13336 Saltsjobaden Sweden httpwwwgooglecomurlsa=tamprct=jampq=ampesrc=sampsource=webampcd=3ampved=0CC8QFjACampurl=http3A2F2Fmywebwwuedu2Fdbunny2Fpdfs2FCh7Elsevierpdfampei=5QWIVYjiK8WoyATGyLzACQampusg=AFQjCNF69gdW4uqnTlv3QOvXaNdWCmiXOAampsig2=CbwIuZiWVUahTJoMeiyXbw
Tanzania Mean Temperature
Tanzania Arabica Production Trends
Craparo ACW et al ldquoCoffea arabica yields decline in Tanzania due to climate change Global implicationsrdquo Agricultural and Forest Meteorology Volume 207 15 July 2015 pp 1-10 httpwwwsciencedirectcomsciencearticlepiiS0168192315000830
New York Mean Temperature Change and Precipitation Chang
New York City Panel on Climate Change 2013 ldquoClimate Risk Information 2013 Observations Climate Change Projections and Mapsrdquo CRosenzweig and W Solecki (Editors) NPCC2 Prepared for use by the City of New York Special Initiative on Rebuilding and Resiliancy New York New York httpwwwnycgovhtmlplanyc2030downloadspdfnpcc_climate_risk_information_2013_reportpdf
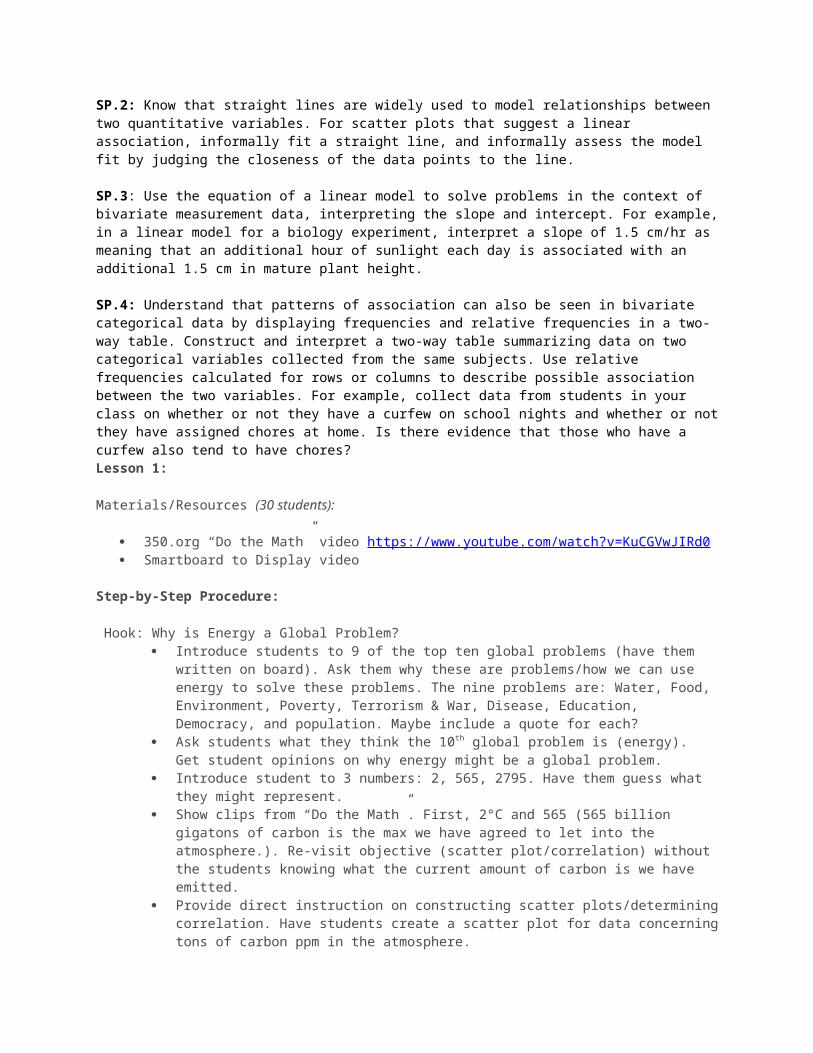
South Africa Temperature Change
Hudson DA and RG Jones 2002 Regional climate model simulations of present day and future climates of Southern Africa Technical note 39 Bracknell UK Hadley Centrehttpwwwscieloorgzascielophppid=S1816-79502012000400001ampscript=sci_arttext
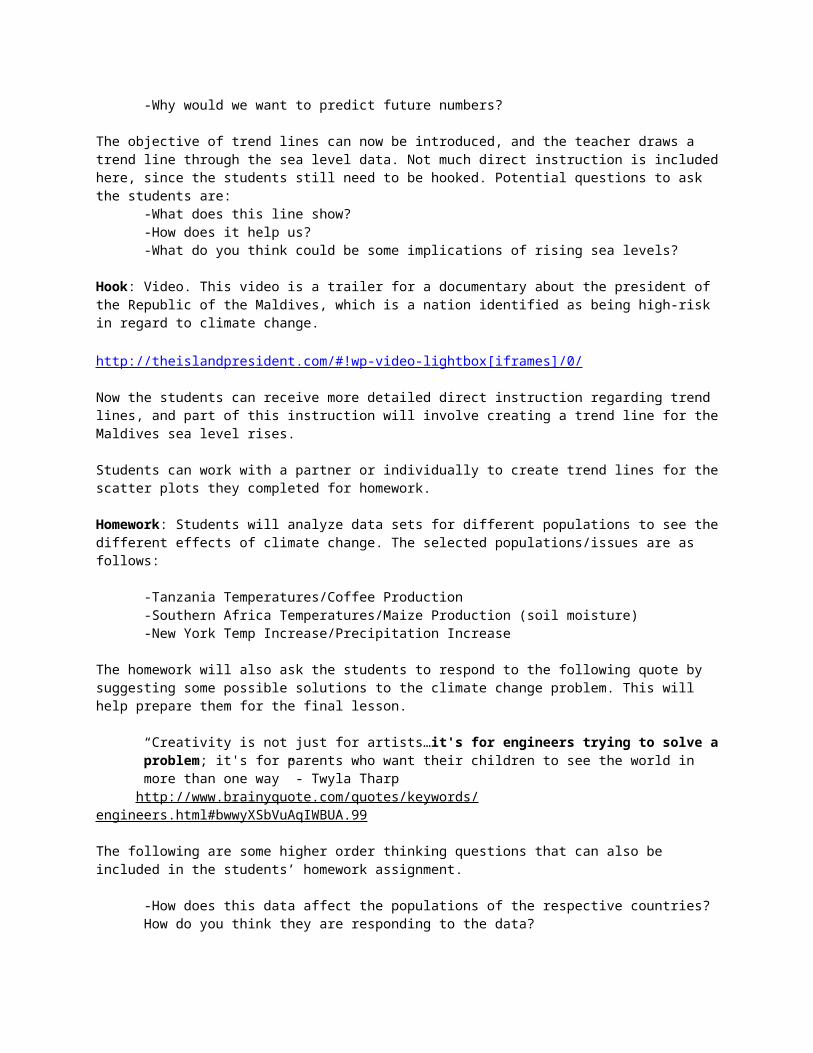
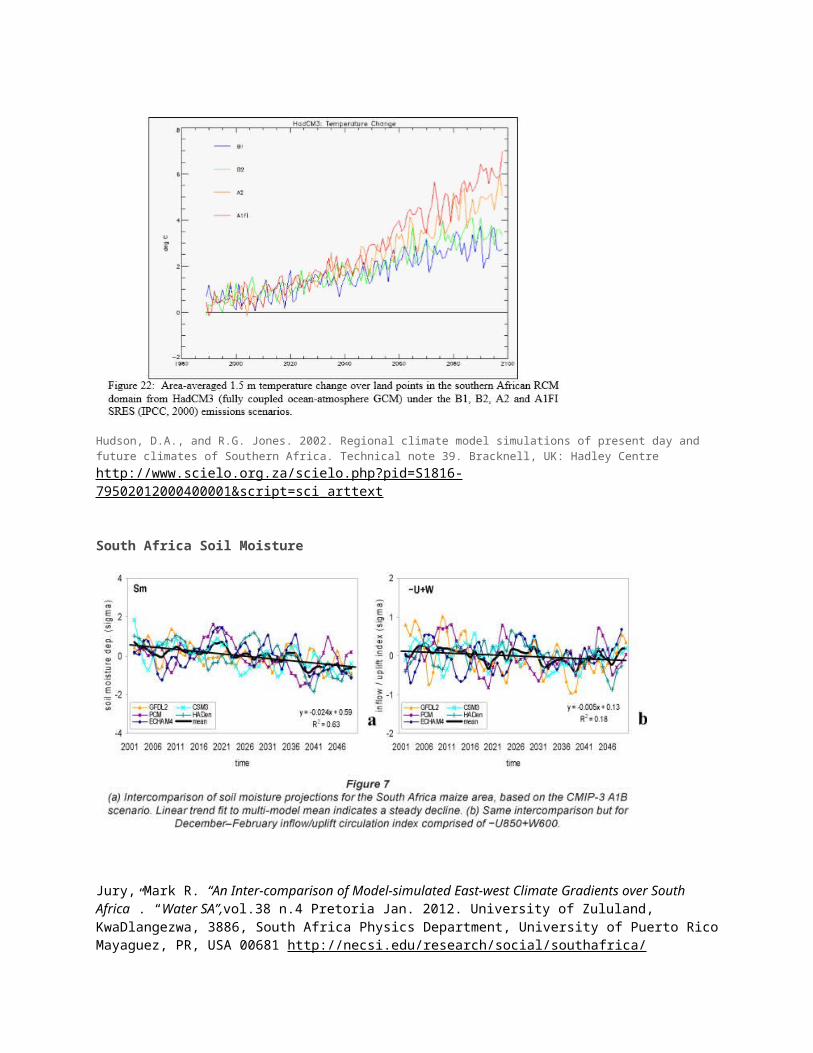
South Africa Soil Moisture
Jury Mark R ldquoAn Inter-comparison of Model-simulated East-west Climate Gradients over South Africardquo ldquoWater SArdquovol38 n4 Pretoria Jan 2012 University of Zululand KwaDlangezwa 3886 South Africa Physics Department University of Puerto Rico Mayaguez PR USA 00681 httpnecsieduresearchsocialsouthafrica
Other Useful Links
httpwwwclimatehotmaporgglobal-warming-locationsrepublic-of-maldiveshtml
https3amazonawscommmc-beta-productionassets11709maldivesjpg
httpnewsnationalgeographiccom201502150213-tuvalu-sopoaga-kench-kiribati-maldives-cyclone-marshall-islands
httpwwwsciencedirectcomsciencearticlepiiS0168192315000830
httpwwwreuterscomarticle20150518us-climate-change-tanzania-idUSKBN0O30TS20150518
httpthinkprogressorgclimate201504303652671study-tanzania-coffee-climate-change
httpnewsnationalgeographiccomnews201405140531-coffee-rust-columbia-brazil-cost-problems
httpwwwbloombergcomnewsarticles2015-02-26south-africa-s-withering-corn-crop-threatens-region-s-food-costs
httpwwwbusinessinsidercomnew-york-city-global-warming-risk-2015-2op=1
httpwwwnewrepubliccomarticle116887does-climate-change-cause-extreme-weather-i-said-no-and-was-attacked
Lesson 3 Hands on Solar
Objectives
1) Students will collect and analyze data modeling solar power throughout a simulated day
2) Students will attempt to maximize power output of solar panel and document their datadetermine their effectiveness
Materials Needed (8 of each if students are grouped by four)
-Lamp-Solar Panel-Multi-Meter-Chair (or something that provides a moveable fixed height)-Alligator Clips-Tape-Tape Measurer
Students will be introduced to the lesson with an informal discussion regarding the trends they found from the homework assignment They will then be hooked with a video showing a non-profitrsquos efforts to provide solar panels for schools without electricity in underdeveloped nations
httpswwwyoutubecomwatchv=6lpw8uc2vao
Students will then be introduced to their task for the day They will be collecting data regarding voltage provided by solar power by simulating a day Before starting students are asked to predict whether the data will model a linear function
Potential group assignmentsTeam LeaderRecorderMulti-meter ManagerChair Coordinator
Students will measure and mark tape according to certain hours of the day (8 9 10 11 12 1 2 3 4)Alligator clips connect the solar panel to the multi-meter and the solar panel stays in a fixed place (1200)The chair is moved along designated times stopping at each marked spot on the tape to record data
bullThe data should model a quadratic function since as the lamp moves closer to the solar panel the more voltage is produced
Once students determine their correlation is not linear they must work as a team on the following taskYou cannot lift the solar panel completely off the ground or move it outside itrsquos designated box How can we maximize the solar energy Experiment
Sample Data Sets 1st is leaving solar panel flat the second involves adjusting the angle of the solar panel
ldquoTimerdquo 8 9 10 11 12 1 2 3 4
Voltage 848
926
1024
1357
1549
139
111 93
837
ldquoTimerdquo 8 9 10 11 12 1 2 3 4
Voltage 879 95 109 139 156 14 115 96 89
Follow-up Questions-Which hours would you expect to see the most difference in voltage Why Of your data which hours saw the most difference in voltage -Could this data ever represent a perfect line Why or why not-Do you think solar panelsrsquo angles change throughout the day What would the advantage be Disadvantage
Exit Slip Will the total amount of voltage collected throughout the day have a correlation If so will it be weak or strong Is it possible for this to be a perfect line Provide explanations for all your answers
Homework Students will create a scatterplot comparing time and total voltage They will then determine correlation and draw a trend line if possible
Assessment
To keep the assessment relevant to the unit students will analyze trends in engineering by plotting data assessing correlation and drawing trend lines
Introduce the assessment with the following quote
ldquoI hope climate science becomes the big thing And then what I want is electrical engineers to solve the worlds energy problems energy distribution problems I want mechanical engineers to make better transportation systems I want chemical engineers to develop better solar panels and so onrdquo-Bill Nye
Students will then analyze the following trends by creating scatter plots determining correlation and drawing trend lines
bull1) Trends in engineering degrees (electrical mechanical chemical)
2) Women in as a percentage of workers in science and engineering careers (specifically engineers)
3) Graduate enrollment in engineering by citizenshiprace and ethnicity
Data for Assessment
Trends in engineering degrees (electrical mechanical chemical)
httpwwwnsfgovnsbseiedTooldataengineering-01html
Women in Engineering Graduate Enrollment Demographics
httpwwwnsfgovnsbseiedTooldataworkforce-07html
httpwwwnsfgovstatisticsseind04c2fig02-06htm
Potential Project-Based Learning or Co-Curricular Opportunities
-Debate importance of renewable energy (address the fact that climate change is in fact a debate a current weakness of these lesson plans)
-Analyze more biodiversity data to coincide closer with science standards-Students choose diminishing species (plant or animal) and create a research project
bull-Have students come up with ideas to conserve energyreduce waste They can collect the data and determine their success (eg negative correlation for timeweight of trash-steeper slope is better)
-Connect to political events (ex Current Alaska pipeline debate)-Students can write a persuasive letter or create a video taking a side and providing evidence to back up their argument
-Convince high school students to enter engineering
-This can either be accomplished with a persuasive letter or have students present to an actual audience of high-school students If presenting students can be themselves or be assigned the role of a citizen of one of the populations they learned about when creating trend lines
MaterialsResources (30 students)
350org ldquoDo the Mathrdquo video httpswwwyoutubecomwatchv=KuCGVwJIRd0 Smartboard to Display video
Step-by-Step Procedure
Hook Why is Energy a Global Problem Introduce students to 9 of the top ten global problems (have them written on board) Ask
them why these are problemshow we can use energy to solve these problems The nine problems are Water Food Environment Poverty Terrorism amp War Disease Education Democracy and population Maybe include a quote for each
Ask students what they think the 10th global problem is (energy) Get student opinions on why energy might be a global problem
Introduce student to 3 numbers 2 565 2795 Have them guess what they might represent Show clips from ldquoDo the Mathrdquo First 2degC and 565 (565 billion gigatons of carbon is the max
we have agreed to let into the atmosphere) Re-visit objective (scatter plotcorrelation) without the students knowing what the current amount of carbon is we have emitted
Provide direct instruction on constructing scatter plotsdetermining correlation Have students create a scatter plot for data concerning tons of carbon ppm in the atmosphere
Data ftpaftpcmdlnoaagovproductstrendsco2co2_annmean_mlotxt
Once students see the carbon in the atmosphere they can make guesses as to how many tons have been released
Show clip concluding the 565 and showing the last number Students will see that we are expected to hit 565 gigatons of carbon in the next 15 years and there are 2795 billion gigatons of carbon currently in reserves
Homework Create scatter plotsdetermine correlation for major effects of climate change (temperature arctic ice and sea levels)Source
Data for Lesson 1
wwwclimatenasagovhttpdatagissnasagovgistemptabledata_v3GLBTs+dSSTtxt
httpnsidcorgarcticseaicenewshttpnsidcorgdatamasie
httpclimatenasagovvital-signssea-levelhttpclimatenasagovsysteminternal_resourcesdetailsoriginal121_Global_Sea_Level_Data_Filetxt
Lesson 2 Creating Trend Lines and Analyzing Climate Change Impacts for Specific Populations
Objectives Students will create trend lines to interpret data
Introduction The teacher will have an informal discussion of the trends the students found from their homework Which had positivewhich had negative
The teacher picks one graphhelliprising sea levels-What do you think the change will be in 2019-How did you get your answer -Why would we want to predict future numbers
bullThe objective of trend lines can now be introduced and the teacher draws a trend line through the sea level data Not much direct instruction is included here since the students still need to be hooked Potential questions to ask the students are
-What does this line show-How does it help us-What do you think could be some implications of rising sea levelsbull
Hook Video This video is a trailer for a documentary about the president of the Republic of the Maldives which is a nation identified as being high-risk in regard to climate change httptheislandpresidentcomwp-video-lightbox[iframes]0
Now the students can receive more detailed direct instruction regarding trend lines and part of this instruction will involve creating a trend line for the Maldives sea level rises
Students can work with a partner or individually to create trend lines for the scatter plots they completed for homework
Homework Students will analyze data sets for different populations to see the different effects of climate change The selected populationsissues are as follows
-Tanzania TemperaturesCoffee Production-Southern Africa TemperaturesMaize Production (soil moisture)-New York Temp IncreasePrecipitation Increase
bullThe homework will also ask the students to respond to the following quote by suggesting some possible solutions to the climate change problem This will help prepare them for the final lesson
ldquoCreativity is not just for artistshellipits for engineers trying to solve a problem its for parents who want their children to see the world in more than one wayrdquo - Twyla Tharp
httpwwwbrainyquotecomquoteskeywordsengineershtmlbwwyXSbVuAqIWBUA99
The following are some higher order thinking questions that can also be included in the studentsrsquo homework assignment
-How does this data affect the populations of the respective countries How do you think they are responding to the data-Who should be the most concerned out of all the populations Least concerned Why
-Do you think we are affected by the trends in different citiescountries Explain your reasoning
Data for Lesson 2
Mӧrner Nils-Axel ldquoThe Maldives A Measure of Sea Level Changes and Sea Level Ethicsrdquo Paleogeophysics and Geodynamics Rӧsundavӓgen 17 13336 Saltsjobaden Sweden httpwwwgooglecomurlsa=tamprct=jampq=ampesrc=sampsource=webampcd=3ampved=0CC8QFjACampurl=http3A2F2Fmywebwwuedu2Fdbunny2Fpdfs2FCh7Elsevierpdfampei=5QWIVYjiK8WoyATGyLzACQampusg=AFQjCNF69gdW4uqnTlv3QOvXaNdWCmiXOAampsig2=CbwIuZiWVUahTJoMeiyXbw
Tanzania Mean Temperature
Tanzania Arabica Production Trends
Craparo ACW et al ldquoCoffea arabica yields decline in Tanzania due to climate change Global implicationsrdquo Agricultural and Forest Meteorology Volume 207 15 July 2015 pp 1-10 httpwwwsciencedirectcomsciencearticlepiiS0168192315000830
New York Mean Temperature Change and Precipitation Chang
New York City Panel on Climate Change 2013 ldquoClimate Risk Information 2013 Observations Climate Change Projections and Mapsrdquo CRosenzweig and W Solecki (Editors) NPCC2 Prepared for use by the City of New York Special Initiative on Rebuilding and Resiliancy New York New York httpwwwnycgovhtmlplanyc2030downloadspdfnpcc_climate_risk_information_2013_reportpdf
South Africa Temperature Change
Hudson DA and RG Jones 2002 Regional climate model simulations of present day and future climates of Southern Africa Technical note 39 Bracknell UK Hadley Centrehttpwwwscieloorgzascielophppid=S1816-79502012000400001ampscript=sci_arttext
South Africa Soil Moisture
Jury Mark R ldquoAn Inter-comparison of Model-simulated East-west Climate Gradients over South Africardquo ldquoWater SArdquovol38 n4 Pretoria Jan 2012 University of Zululand KwaDlangezwa 3886 South Africa Physics Department University of Puerto Rico Mayaguez PR USA 00681 httpnecsieduresearchsocialsouthafrica
Other Useful Links
httpwwwclimatehotmaporgglobal-warming-locationsrepublic-of-maldiveshtml
https3amazonawscommmc-beta-productionassets11709maldivesjpg
httpnewsnationalgeographiccom201502150213-tuvalu-sopoaga-kench-kiribati-maldives-cyclone-marshall-islands
httpwwwsciencedirectcomsciencearticlepiiS0168192315000830
httpwwwreuterscomarticle20150518us-climate-change-tanzania-idUSKBN0O30TS20150518
httpthinkprogressorgclimate201504303652671study-tanzania-coffee-climate-change
httpnewsnationalgeographiccomnews201405140531-coffee-rust-columbia-brazil-cost-problems
httpwwwbloombergcomnewsarticles2015-02-26south-africa-s-withering-corn-crop-threatens-region-s-food-costs
httpwwwbusinessinsidercomnew-york-city-global-warming-risk-2015-2op=1
httpwwwnewrepubliccomarticle116887does-climate-change-cause-extreme-weather-i-said-no-and-was-attacked
Lesson 3 Hands on Solar
Objectives
1) Students will collect and analyze data modeling solar power throughout a simulated day
2) Students will attempt to maximize power output of solar panel and document their datadetermine their effectiveness
Materials Needed (8 of each if students are grouped by four)
-Lamp-Solar Panel-Multi-Meter-Chair (or something that provides a moveable fixed height)-Alligator Clips-Tape-Tape Measurer
Students will be introduced to the lesson with an informal discussion regarding the trends they found from the homework assignment They will then be hooked with a video showing a non-profitrsquos efforts to provide solar panels for schools without electricity in underdeveloped nations
httpswwwyoutubecomwatchv=6lpw8uc2vao
Students will then be introduced to their task for the day They will be collecting data regarding voltage provided by solar power by simulating a day Before starting students are asked to predict whether the data will model a linear function
Potential group assignmentsTeam LeaderRecorderMulti-meter ManagerChair Coordinator
Students will measure and mark tape according to certain hours of the day (8 9 10 11 12 1 2 3 4)Alligator clips connect the solar panel to the multi-meter and the solar panel stays in a fixed place (1200)The chair is moved along designated times stopping at each marked spot on the tape to record data
bullThe data should model a quadratic function since as the lamp moves closer to the solar panel the more voltage is produced
Once students determine their correlation is not linear they must work as a team on the following taskYou cannot lift the solar panel completely off the ground or move it outside itrsquos designated box How can we maximize the solar energy Experiment
Sample Data Sets 1st is leaving solar panel flat the second involves adjusting the angle of the solar panel
ldquoTimerdquo 8 9 10 11 12 1 2 3 4
Voltage 848
926
1024
1357
1549
139
111 93
837
ldquoTimerdquo 8 9 10 11 12 1 2 3 4
Voltage 879 95 109 139 156 14 115 96 89
Follow-up Questions-Which hours would you expect to see the most difference in voltage Why Of your data which hours saw the most difference in voltage -Could this data ever represent a perfect line Why or why not-Do you think solar panelsrsquo angles change throughout the day What would the advantage be Disadvantage
Exit Slip Will the total amount of voltage collected throughout the day have a correlation If so will it be weak or strong Is it possible for this to be a perfect line Provide explanations for all your answers
Homework Students will create a scatterplot comparing time and total voltage They will then determine correlation and draw a trend line if possible
Assessment
To keep the assessment relevant to the unit students will analyze trends in engineering by plotting data assessing correlation and drawing trend lines
Introduce the assessment with the following quote
ldquoI hope climate science becomes the big thing And then what I want is electrical engineers to solve the worlds energy problems energy distribution problems I want mechanical engineers to make better transportation systems I want chemical engineers to develop better solar panels and so onrdquo-Bill Nye
Students will then analyze the following trends by creating scatter plots determining correlation and drawing trend lines
bull1) Trends in engineering degrees (electrical mechanical chemical)
2) Women in as a percentage of workers in science and engineering careers (specifically engineers)
3) Graduate enrollment in engineering by citizenshiprace and ethnicity
Data for Assessment
Trends in engineering degrees (electrical mechanical chemical)
httpwwwnsfgovnsbseiedTooldataengineering-01html
Women in Engineering Graduate Enrollment Demographics
httpwwwnsfgovnsbseiedTooldataworkforce-07html
httpwwwnsfgovstatisticsseind04c2fig02-06htm
Potential Project-Based Learning or Co-Curricular Opportunities
-Debate importance of renewable energy (address the fact that climate change is in fact a debate a current weakness of these lesson plans)
-Analyze more biodiversity data to coincide closer with science standards-Students choose diminishing species (plant or animal) and create a research project
bull-Have students come up with ideas to conserve energyreduce waste They can collect the data and determine their success (eg negative correlation for timeweight of trash-steeper slope is better)
-Connect to political events (ex Current Alaska pipeline debate)-Students can write a persuasive letter or create a video taking a side and providing evidence to back up their argument
-Convince high school students to enter engineering
-This can either be accomplished with a persuasive letter or have students present to an actual audience of high-school students If presenting students can be themselves or be assigned the role of a citizen of one of the populations they learned about when creating trend lines

-This can either be accomplished with a persuasive letter or have students present to an actual audience of high-school students If presenting students can be themselves or be assigned the role of a citizen of one of the populations they learned about when creating trend lines