· web viewwrite your own word problem that must be solved using ratios and proportions. create...
TRANSCRIPT

1
Formative Assessments Proportional Reasoning Cluster
Assessment One
Cluster & Content StandardsWhat content standards can be addressed by this formative assessment?Ratio and Proportional Reasoning
NC. 7. RP. 2 Recognize and represent proportional relationships between quantities. 1. Understand that a proportion is a relationship of equality between ratios.
Represent proportional relationships using tables and graphs.
Recognize whether ratios are in a proportional relationship using tables and graphs.
Mathematical Practice StandardsWhat practice standards can be addressed by this formative assessment?
MP1 Make sense of problems and persevere in solving them.
MP2 Reason abstractly and quantitatively.
MP3 Construct viable arguments and critique the reasoning of others.
MP4 Model with mathematics.
MP7 Look for and make use of structure.
Learning Targets What learning targets will be assessed?Unit RatesRecognizing and representing proportional relationships
Timing: During Instruction
Seventh Grade Provided by NC2ML and Tools for Teachers Last Modified 2018
2
ASSESSMENT ONE
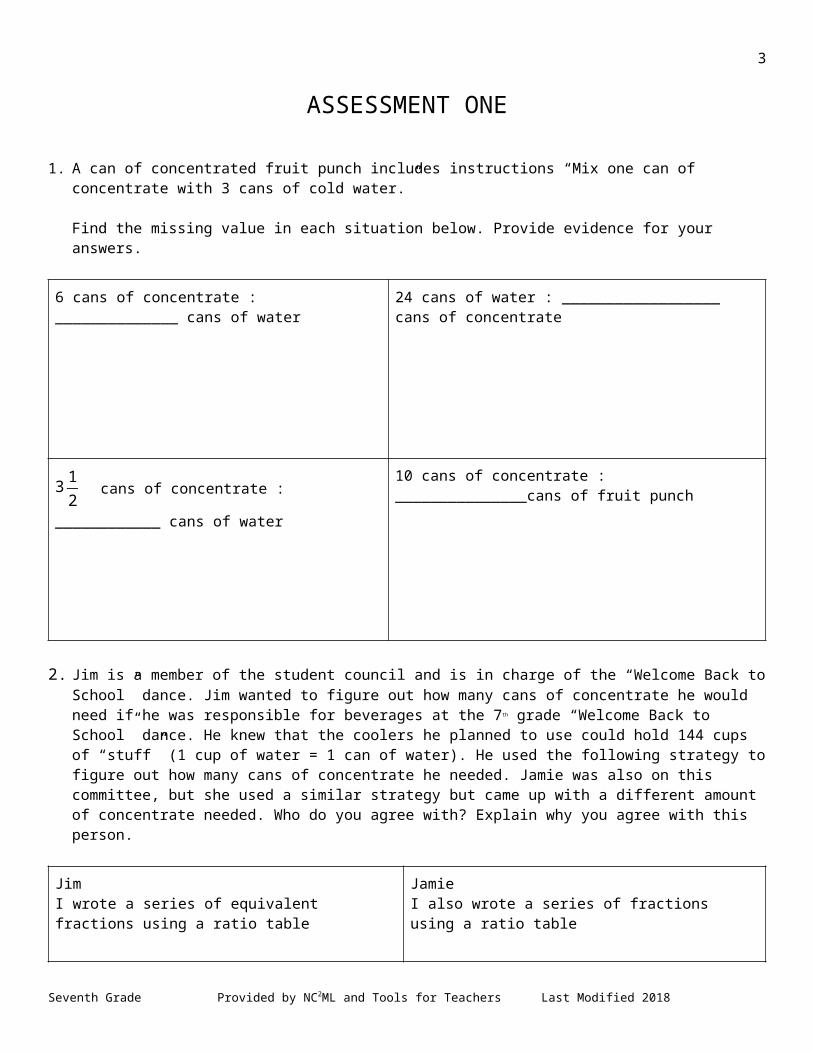
1. A can of concentrated fruit punch includes instructions “Mix one can of concentrate with 3 cans of cold water.”
Find the missing value in each situation below. Provide evidence for your answers.
6 cans of concentrate : ______________ cans of water
24 cans of water : __________________ cans of concentrate
3 12 cans of concentrate : ____________ cans of
water
10 cans of concentrate : _______________cans of fruit punch
2. Jim is a member of the student council and is in charge of the “Welcome Back to School” dance. Jim wanted to figure out how many cans of concentrate he would need if he was responsible for beverages at the 7th grade “Welcome Back to School” dance. He knew that the coolers he planned to use could hold 144 cups of “stuff” (1 cup of water = 1 can of water). He used the following strategy to figure out how many cans of concentrate he needed. Jamie was also on this committee, but she used a similar strategy but came up with a different amount of concentrate needed. Who do you agree with? Explain why you agree with this person.
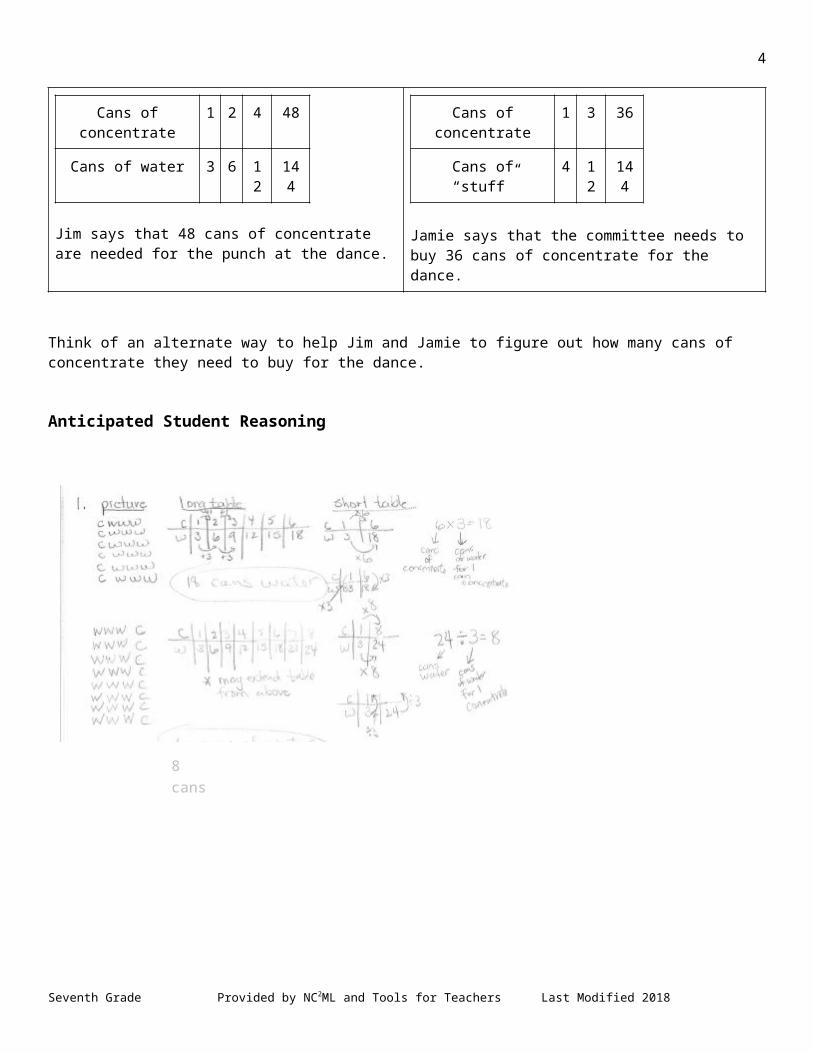
JimI wrote a series of equivalent fractions using a ratio table
Cans of concentrate
1 2 4 48
Cans of water 3 6 12
144
Jim says that 48 cans of concentrate are needed for the punch at the dance.
JamieI also wrote a series of fractions using a ratio table
Cans of concentrate
1 3 36
Cans of “stuff” 4 12
144
Jamie says that the committee needs to buy 36 cans of concentrate for the dance.
Seventh Grade Provided by NC2ML and Tools for Teachers Last Modified 2018
3
Think of an alternate way to help Jim and Jamie to figure out how many cans of concentrate they need to buy for the dance.
Anticipated Student Reasoning
Seventh Grade Provided by NC2ML and Tools for Teachers Last Modified 2018
8 cans
4
Seventh Grade Provided by NC2ML and Tools for Teachers Last Modified 2018

5
Formative Assessments Proportional Reasoning Cluster
Assessment Two
Cluster & Content StandardsWhat content standards can be addressed by this formative assessment?Ratios and Proportional Reasoning
NC. 7. RP.1 Compute unit rates associated with ratios of fractions to solve real-world and mathematical problems.
NC. 7. RP. 2 Recognize and represent proportional relationships between quantities. 1. Understand that a proportion is a relationship of equality between ratios.
Represent proportional relationships using tables and graphs. Recognize whether ratios are in a proportional relationship
using tables and graphs. Compare two different proportional relationships using tables,
graphs, equations, and verbal descriptions. o Identify the unit rate (constant of proportionality) within
two quantities in a proportional relationship using tables, graphs, equations, and verbal descriptions.
o Create equations and graphs to represent proportional relationships.
o Use a graphical representation of a proportional relationship in context to:
Explain the meaning of any point (x, y). Explain the meaning of (0, 0) and why it is included. Understand that the y-coordinate of the ordered pair (1, r)
corresponds to the unit rate and explain its meaning.
Mathematical Practice StandardsWhat practice standards can be addressed by this formative assessment?
MP2 Reason abstractly and quantitatively.
MP3 Construct viable arguments and critique the reasoning of others.
MP4 Model with mathematics.
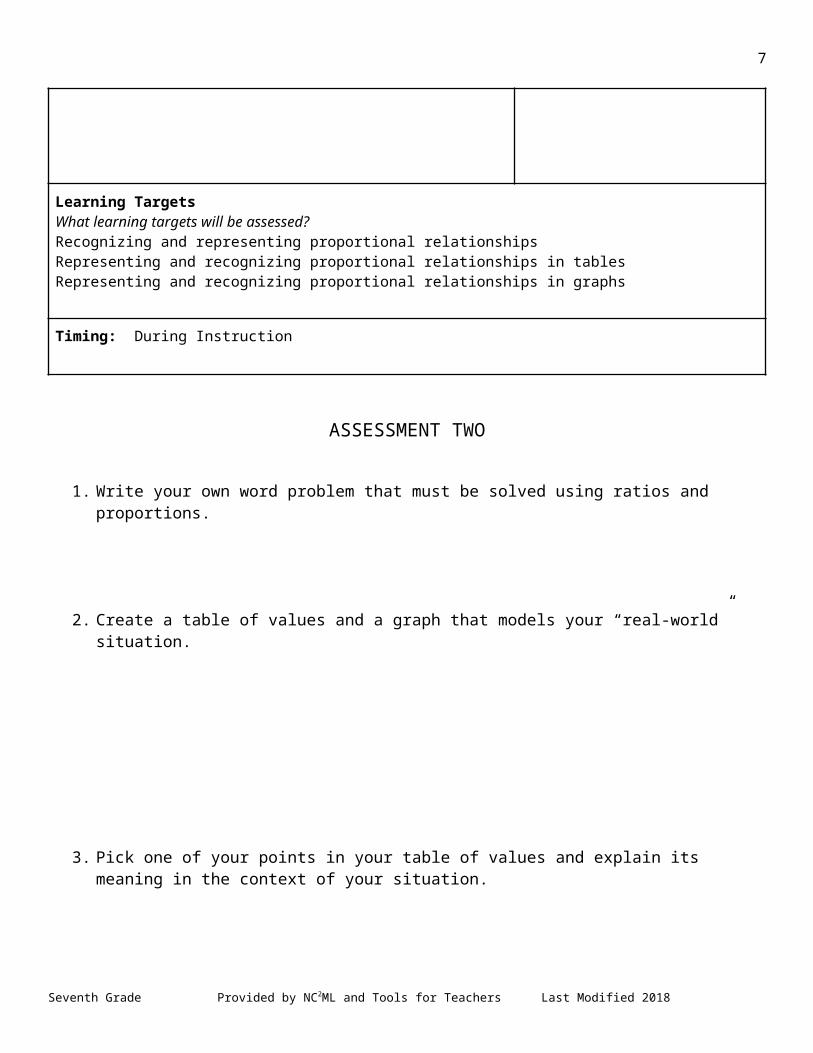
Learning Targets What learning targets will be assessed?Recognizing and representing proportional relationshipsRepresenting and recognizing proportional relationships in tablesRepresenting and recognizing proportional relationships in graphs
Timing: During Instruction
Seventh Grade Provided by NC2ML and Tools for Teachers Last Modified 2018

6
ASSESSMENT TWO
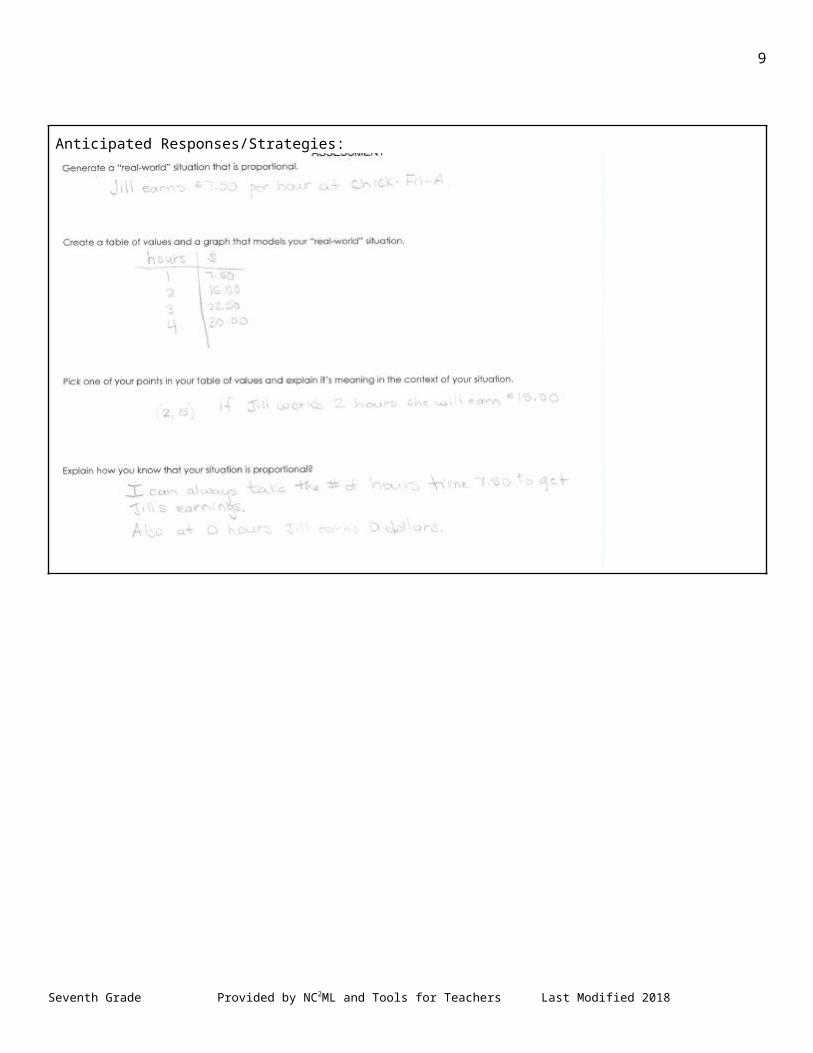
1. Write your own word problem that must be solved using ratios and proportions.
2. Create a table of values and a graph that models your “real-world” situation.
3. Pick one of your points in your table of values and explain its meaning in the context of your situation.
4. Explain how you know that your situation is proportional?
Seventh Grade Provided by NC2ML and Tools for Teachers Last Modified 2018
7
Anticipated Responses/Strategies:
Seventh Grade Provided by NC2ML and Tools for Teachers Last Modified 2018
8
Formative AssessmentsProportional Reasoning Cluster
Assessment Three
Cluster & Content StandardsWhat content standards can be addressed by this formative assessment?Ratios and Proportional ReasoningNC. 7. RP.1 Compute unit rates associated with ratios of fractions to solve real-world and mathematical problems.
NC. 7. RP. 2 Recognize and represent proportional relationships between quantities. 1. Understand that a proportion is a relationship of equality between ratios.
Represent proportional relationships using tables and graphs.
Recognize whether ratios are in a proportional relationship using tables and graphs.
Compare two different proportional relationships using tables, graphs, equations, and verbal descriptions.
o Identify the unit rate (constant of proportionality) within two quantities in a proportional relationship using tables, graphs, equations, and verbal descriptions.
o Create equations and graphs to represent proportional relationships.
o Use a graphical representation of a proportional relationship in context to:
Explain the meaning of any point (x, y). Explain the meaning of (0, 0) and why it is included. Understand that the y-coordinate of the ordered pair (1, r)
corresponds to the unit rate and explain its meaning.
Mathematical Practice StandardsWhat practice standards can be addressed by this formative assessment?
MP1 Make sense of problems and persevere in solving them.
MP2 Reason abstractly and quantitatively.
MP3 Construct viable arguments and critique the reasoning of others.
MP4 Model with mathematics.
MP6 Attend to precision.
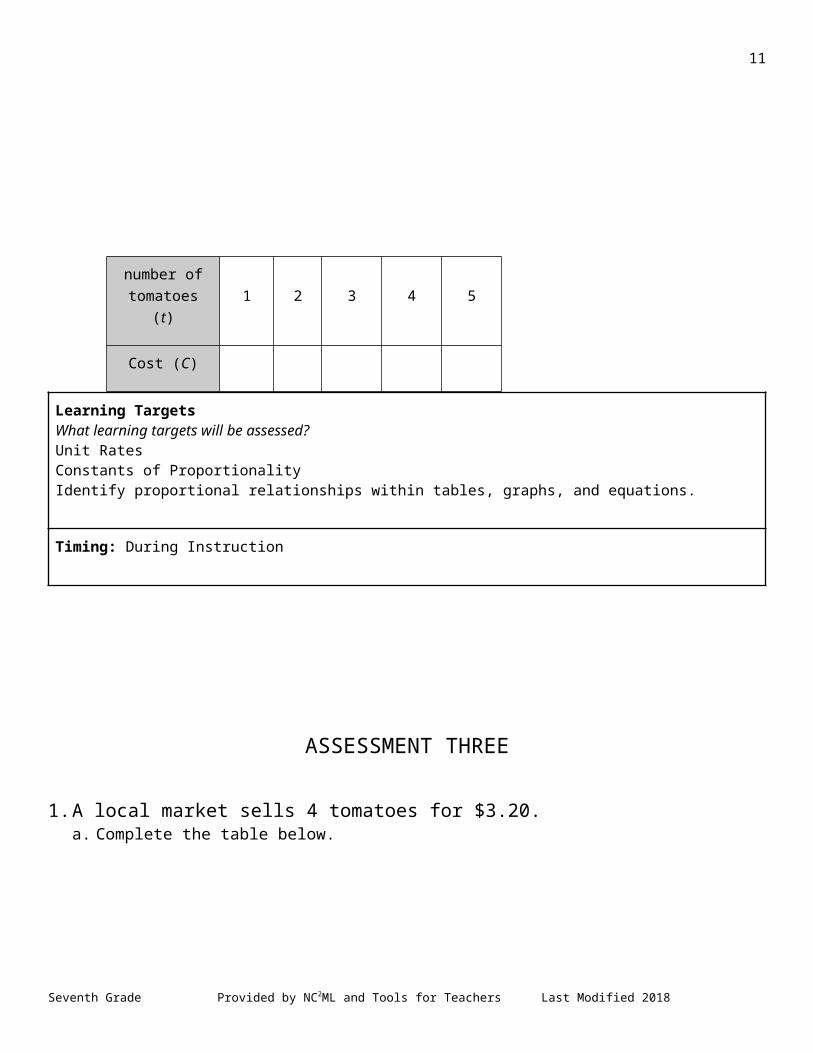
Learning Targets What learning targets will be assessed?Unit RatesConstants of ProportionalityIdentify proportional relationships within tables, graphs, and equations.
Timing: During Instruction
Seventh Grade Provided by NC2ML and Tools for Teachers Last Modified 2018
9
ASSESSMENT THREE
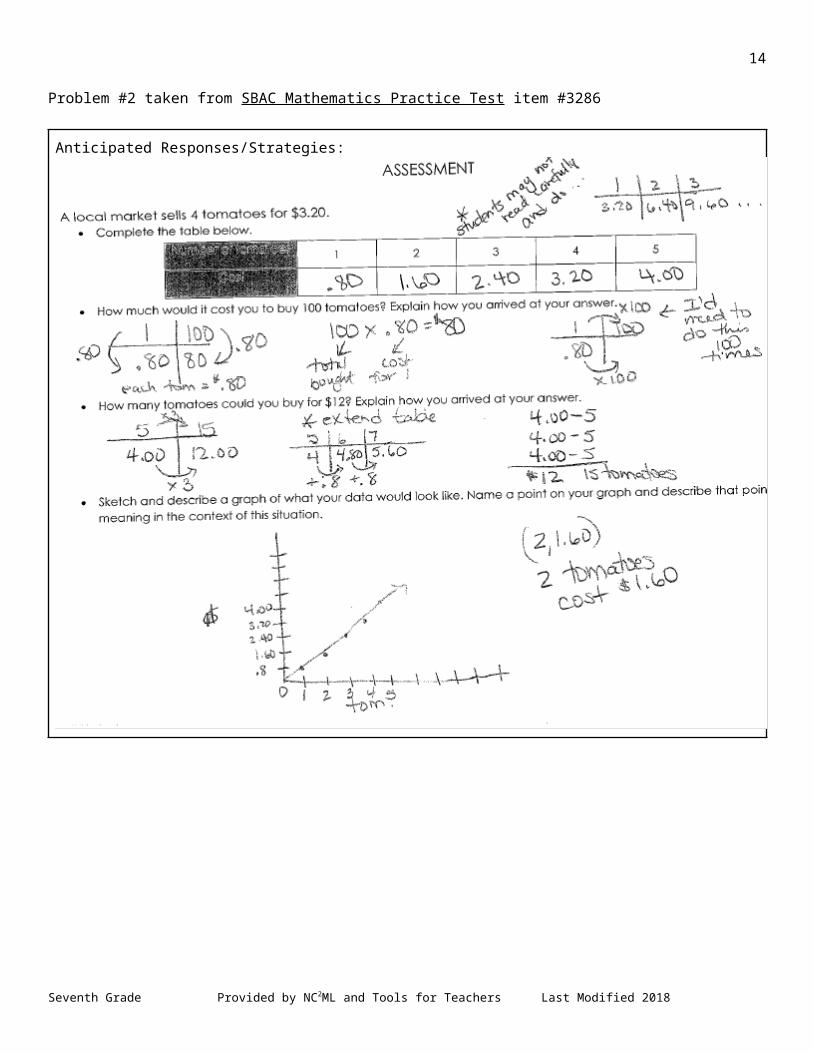
1. A local market sells 4 tomatoes for $3.20.a. Complete the table below.
b. How much would it cost you to buy 100 tomatoes? Explain how you arrived at your answer.
c. How many tomatoes could you buy for $12? Explain how you arrived at your answer.
d. Sketch and describe a graph of what your data would look like. Name a point on your graph and describe that points meaning in the context of this situation.
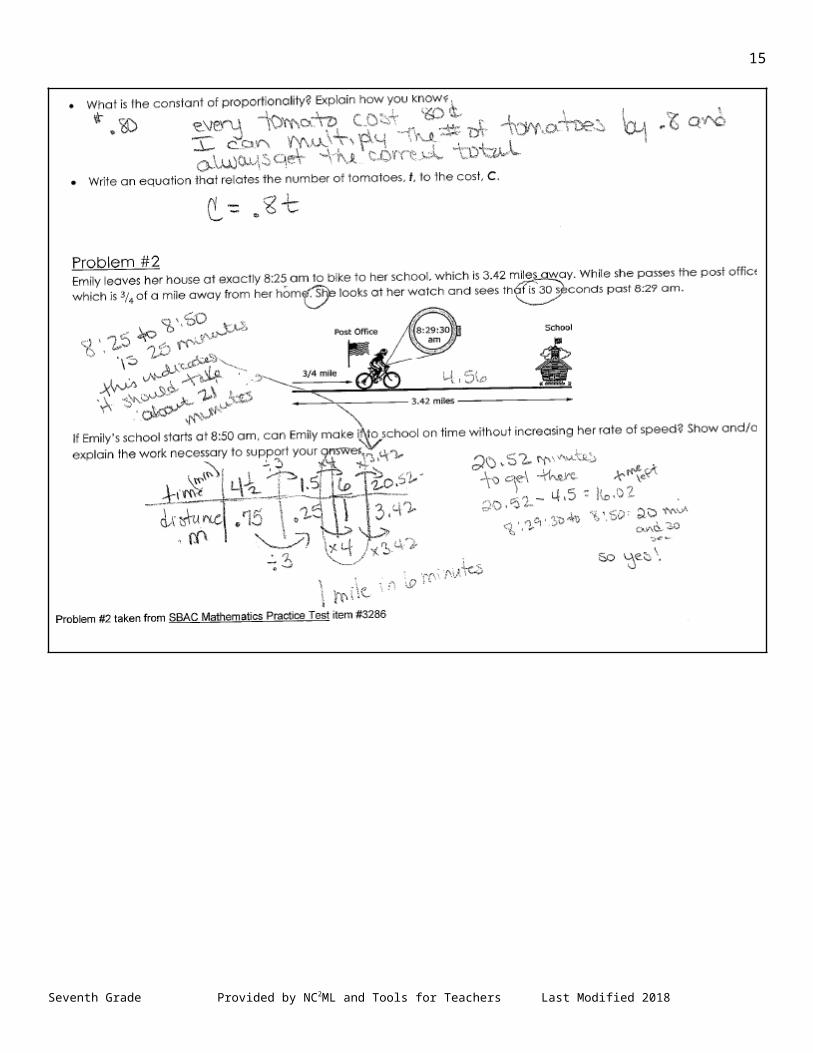
e. What is the constant of proportionality? Explain how you know?
f. Write an equation that relates the number of tomatoes, t, to the cost, C.
Seventh Grade Provided by NC2ML and Tools for Teachers Last Modified 2018
number of tomatoes (t)
1 2 3 4 5
Cost (C)

10
Problem #2Emily leaves her house at exactly 8:25 am to bike to her school, which is 3.42 miles away. While she passes the post office, which is 34 of a mile away from her home, she looks at her watch and sees it is 30 seconds past 8:29 am.
If Emily’s school starts at 8:50 am, can Emily make it to school on time without increasing her rate of speed? Show and/or explain the work necessary to support your answer.
Seventh Grade Provided by NC2ML and Tools for Teachers Last Modified 2018
11
Problem #2 taken from SBAC Mathematics Practice Test item #3286
Anticipated Responses/Strategies:
Seventh Grade Provided by NC2ML and Tools for Teachers Last Modified 2018

12
Seventh Grade Provided by NC2ML and Tools for Teachers Last Modified 2018

13
Formative Assessments Proportional Reasoning Cluster
Assessment Four
Cluster & Content StandardsWhat content standards can be addressed by this formative assessment?Ratios and Proportional ReasoningNC. 7. RP.1 Compute unit rates associated with ratios of fractions to solve real-world and mathematical problems.
NC. 7. RP. 2 Recognize and represent proportional relationships between quantities. 1. Understand that a proportion is a relationship of equality between ratios.
Represent proportional relationships using tables and graphs.
Recognize whether ratios are in a proportional relationship using tables and graphs.
Compare two different proportional relationships using tables, graphs, equations, and verbal descriptions.
o Identify the unit rate (constant of proportionality) within two quantities in a proportional relationship using tables, graphs, equations, and verbal descriptions.
o Create equations and graphs to represent proportional relationships.
o Use a graphical representation of a proportional relationship in context to:
Explain the meaning of any point (x, y). Explain the meaning of (0, 0) and why it is included. Understand that the y-coordinate of the ordered pair (1, r)
corresponds to the unit rate and explain its meaning.
Mathematical Practice StandardsWhat practice standards can be addressed by this formative assessment?
MP1 Make sense of problems and persevere in solving them.
MP2 Reason abstractly and quantitatively.
MP3 Construct viable arguments and critique the reasoning of others.
MP4 Model with mathematics.
MP6 Attend to Precision
MP7 Look for and make use of structure.
Learning Targets What learning targets will be assessed?Unit Rates Proportional relationships in tables, graphs, and equations
Timing: During Instruction
Seventh Grade Provided by NC2ML and Tools for Teachers Last Modified 2018
14
Assessment Four
Jimmy, Elvis, and Ricky all have after-school jobs at a local-fast food restaurant. They each have the money they earned last week.
1. Who makes more money for working 8 hours? Explain or show your work.
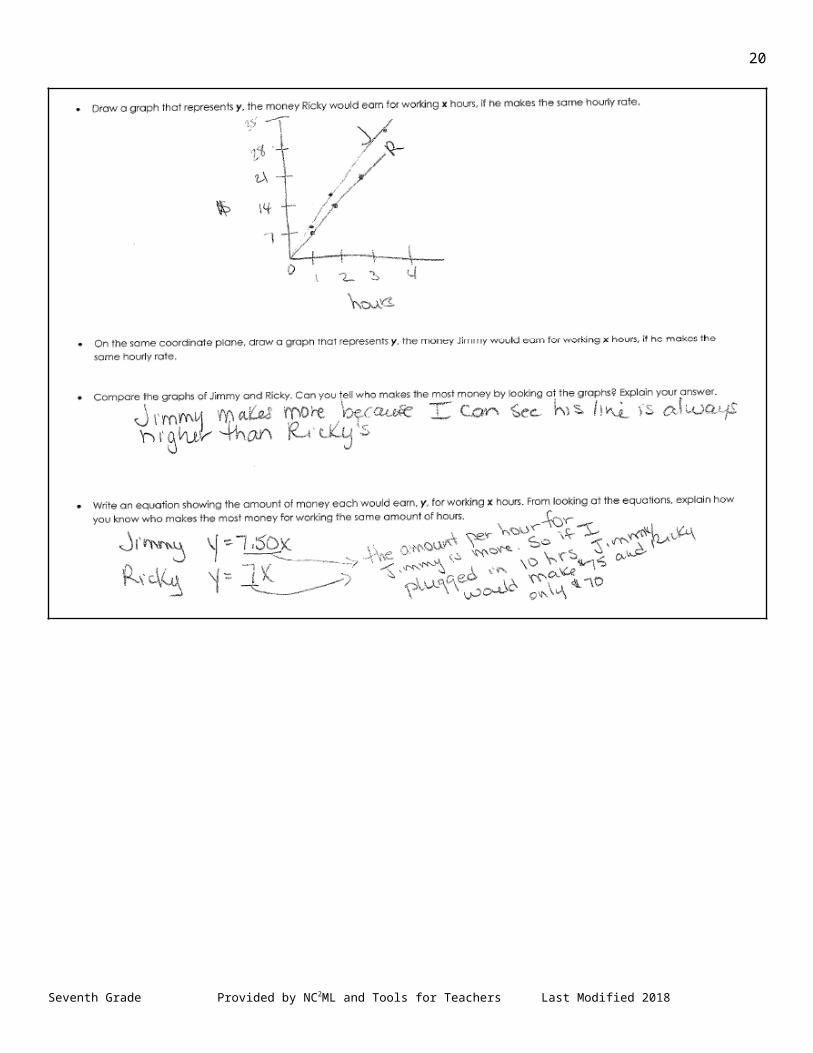
2. Draw a graph that represents the money (y) Ricky would earn for working x hours. On the same axes, draw a graph that represents the money Jimmy would earn for working x hours. Compare the graphs of Jimmy and Ricky. Can you tell who makes the most money JUST by looking at the graphs? Explain your answer.
3. Write an equation showing the amount of money EACH PERSON would earn, y, for working x hours. From looking at the equations, explain how you know who makes the most money for working the same amount of hours.
Seventh Grade Provided by NC2ML and Tools for Teachers Last Modified 2018
Ricky makes $7 per hour.
15
Anticipated Responses/Strategies:
Seventh Grade Provided by NC2ML and Tools for Teachers Last Modified 2018

16
Seventh Grade Provided by NC2ML and Tools for Teachers Last Modified 2018

17
Formative Assessments Proportional Reasoning Cluster
Assessment Five
Cluster & Content StandardsWhat content standards can be addressed by this formative assessment?Ratios and Proportional Reasoning
NC.7.RP.3 Use scale factors and unit rates in proportional relationships to solve ratio and percent problems.
Mathematical Practice StandardsWhat practice standards can be addressed by this formative assessment?
MP2 Reason abstractly and quantitatively.
MP3 Construct viable arguments and critique the reasoning of others.
MP4 Model with mathematics.
MP6 Attend to precision.
Learning Targets What learning targets will be assessed?Unit RatesPercents (discounts, sales tax, and commission)
Timing: During Instruction
Seventh Grade Provided by NC2ML and Tools for Teachers Last Modified 2018
18
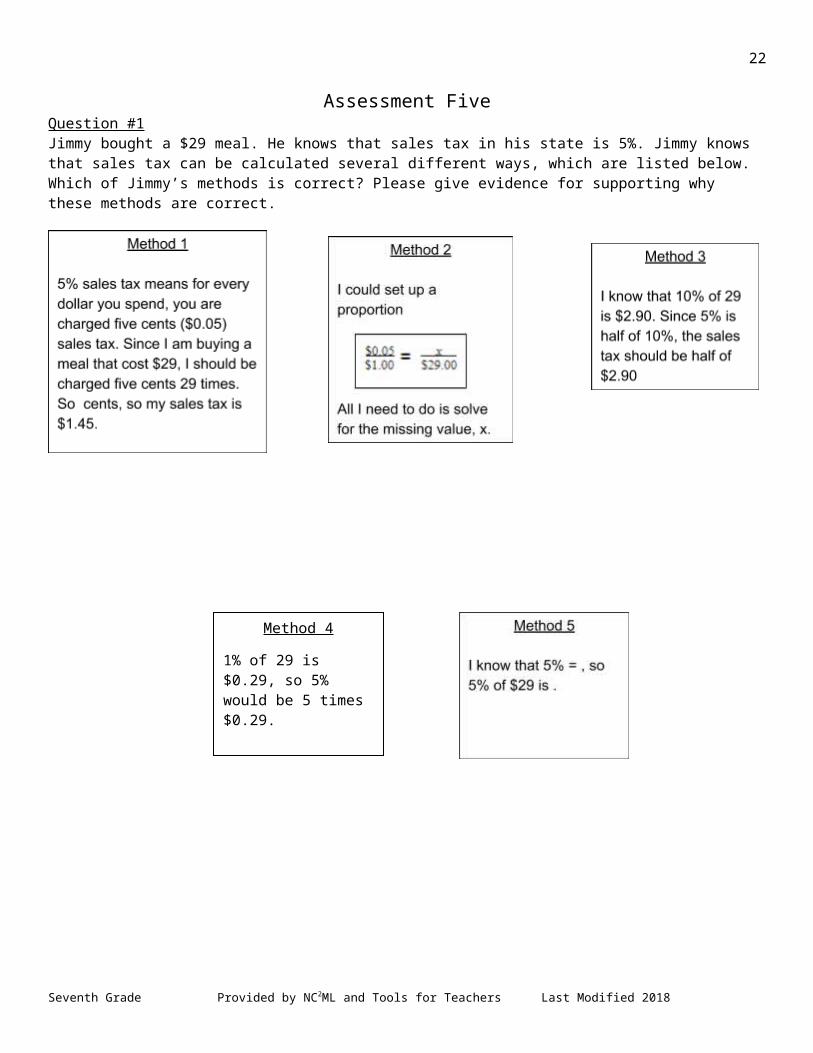
Assessment FiveQuestion #1Jimmy bought a $29 meal. He knows that sales tax in his state is 5%. Jimmy knows that sales tax can be calculated several different ways, which are listed below. Which of Jimmy’s methods is correct? Please give evidence for supporting why these methods are correct.
Of the correct methods, which one makes the most sense to you? Explain your choice.
Seventh Grade Provided by NC2ML and Tools for Teachers Last Modified 2018
Method 4
1% of 29 is $0.29, so 5% would be 5 times $0.29.

19
Seventh Grade Provided by NC2ML and Tools for Teachers Last Modified 2018
20
Question #2 Jimmy purchased three video games for his X-box. The video games all cost the same amount. He paid 8% sales tax. He could see on receipt that $9.36 was added to his purchase. What was the cost of 1 video game, not including tax? Show your work below.
Question #3Alfonso went to Sam’s Famous Appliance Store and purchased a refrigerator and a stove. The sales price of the refrigerator was 40% off the original price and the sales price of the stove was 20% off the original price.
Which statement must be true to conclude that Alfonso received a 30% discount on the refrigerator and stove together? Explain why the statement is correct.
Problem #2 taken from SBAC Mathematics Practice Test item #3635
Seventh Grade Provided by NC2ML and Tools for Teachers Last Modified 2018

21
Anticipated Responses/Strategies:
Seventh Grade Provided by NC2ML and Tools for Teachers Last Modified 2018
22
Seventh Grade Provided by NC2ML and Tools for Teachers Last Modified 2018

23
Seventh Grade Provided by NC2ML and Tools for Teachers Last Modified 2018