0 v 23-( ..45 6./+7'8&9&/ · la in the us venture ecosystem snapshot of la msa’s...
TRANSCRIPT

2017
Venture Ecosystem Fact ook:
Los Angeles

Credits & Contact
PitchBook Data, Inc.
JOHN GABBERT Founder, CEO
ADLEY BOWDEN Vice President,
Market Development & Analysis
ContentGARRETT JAMES BLACK Senior Analyst
KORY HOANG Data Analyst
JENNIFER SAM Senior Graphic Designer
Contact PitchBook pitchbook.com
RESEARCH
EDITORIAL
SALES
COPYRIGHT © 2017 by PitchBook Data, Inc. All rights reserved. No part of this publication may be reproduced in any form or by any means—graphic, electronic, or mechanical, including photocopying, recording, taping, and information storage and retrieval systems—without the express written permission of PitchBook Data, Inc. Contents are based on information from sources believed to be reliable, but accuracy and completeness cannot be guaranteed. Nothing herein should be construed as any past, current or future recommendation to buy or sell any security or an offer to sell, or a solicitation of an offer to buy any security. This material does not purport to contain all of the information that a prospective investor may wish to consider and is not to be relied upon as such or used in substitution for the exercise of independent judgment.
Introduction 3
LA in the US Venture Ecosystem 4
Economy 5
Investment Activity 6-10
Exits & Fundraising 11-12
League Tables 13
The PitchBook PlatformThe data in this report comes from the PitchBook Platform–our
data software for VC, PE and M&A. Contact [email protected]
to request a free trial.
Contents
2 PITCHBOOK 2017 VENTURE ECOSYSTEM FACTBOOK: LOS ANGELES
A sizable, burgeoning VC ecosystemIntroduction
When it comes to analyzing trends in venture investment, thinking in terms
of an ecosystem is one of the more powerful approaches, as much within
venture capital is not quite as quantifiable as one would like. Moreover, framing
an investment ecosystem as an overlapping, interlocking system of cycles is
especially illuminating when it comes to analysis of VC within a specific region,
given the interplay between general business cycles, fund investing lifecycles,
policy mandates and more. When zeroing in on one of those metropolitan areas,
the location-specific historical trend in the supply of startups jockeying for and
garnering VC investment becomes a more critical component for analysis. The
metro-specific growth over the past several years also matters considerably.
On top of that, it’s important to highlight how metro-specific venture activity
is necessarily limited by the speed of the spread of viable information within a
given network, plus the size of the nodes in a venture network, i.e. the size of
capital sources. Likewise, livability and interconnectivity within a metro matter,
ranging from metrics such as ease of doing business, to tax rates, to typical
rents, to sprawl. The purpose of this report series is to place PitchBook venture
data within a broader context on a more geography-specific basis, the better
to illustrate potential use cases for analysis. It’s critical to note that within that
broader context one must take timing into account. The growth percentage over
time is an important indicator of a venture ecosystem’s overall health, and there
is always more to any existing ecosystem than can be rendered in a dataset.
We welcome your feedback and questions—reach out to us at reports@
pitchbook.com. I’d like to thank Okapi Venture Capital, Upfront Ventures and the
National Venture Capital Association, among others, all of whom assisted in the
production of this report.
GARRETT JAMES BLACK
Senior Analyst
Look up a company.
And its cap table.
And its investors.
And its EBITDA
multiples.
And its board
members.
In seconds.
The PitchBook Platform
has the data you need
to close your next deal.
Learn more at
pitchbook.com
3 PITCHBOOK 2017 VENTURE ECOSYSTEM FACTBOOK: LOS ANGELES
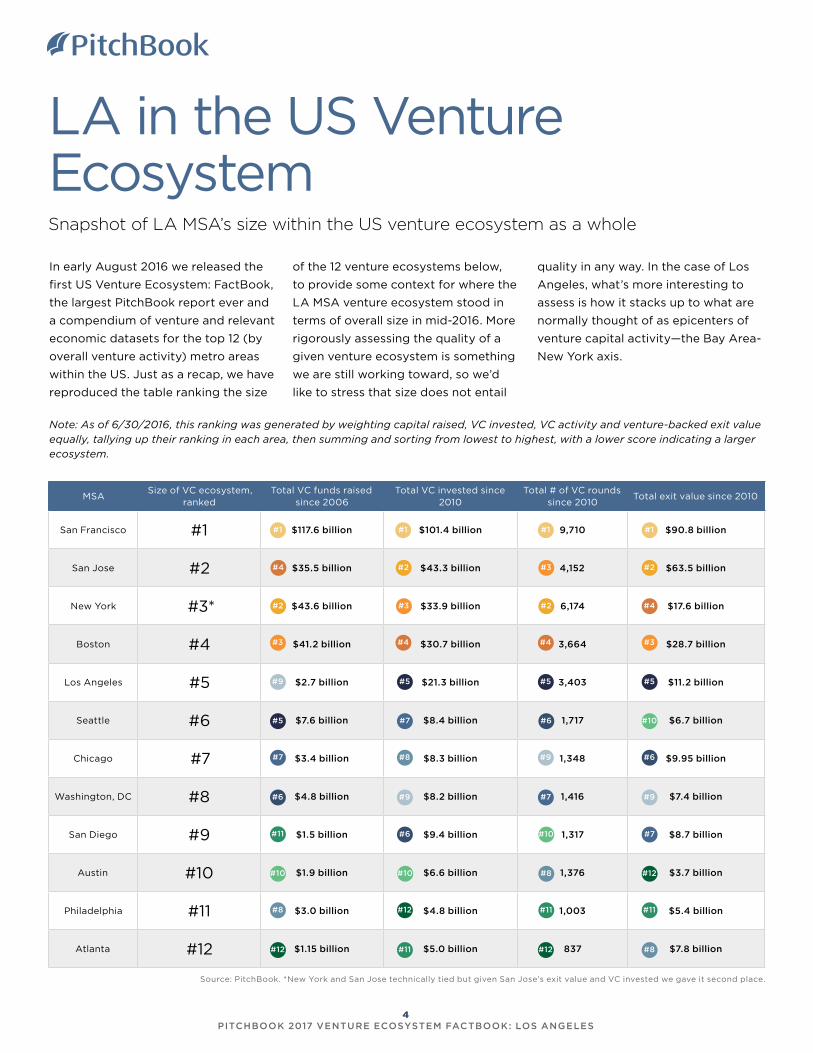
LA in the US Venture EcosystemSnapshot of LA MSA’s size within the US venture ecosystem as a whole
In early August 2016 we released the
first US Venture Ecosystem: FactBook,
the largest PitchBook report ever and
a compendium of venture and relevant
economic datasets for the top 12 (by
overall venture activity) metro areas
within the US. Just as a recap, we have
reproduced the table ranking the size
Source: PitchBook. *New York and San Jose technically tied but given San Jose’s exit value and VC invested we gave it second place.
Note: As of 6/30/2016, this ranking was generated by weighting capital raised, VC invested, VC activity and venture-backed exit value equally, tallying up their ranking in each area, then summing and sorting from lowest to highest, with a lower score indicating a larger ecosystem.
MSASize of VC ecosystem,
rankedTotal VC funds raised
since 2006Total VC invested since
2010Total # of VC rounds
since 2010Total exit value since 2010
San Francisco #1 $117.6 billion $101.4 billion 9,710 $90.8 billion
San Jose #2 $35.5 billion $43.3 billion 4,152 $63.5 billion
New York #3* $43.6 billion $33.9 billion 6,174 $17.6 billion
Boston #4 $41.2 billion $30.7 billion 3,664 $28.7 billion
Los Angeles #5 $2.7 billion $21.3 billion 3,403 $11.2 billion
Seattle #6 $7.6 billion $8.4 billion 1,717 $6.7 billion
Chicago #7 $3.4 billion $8.3 billion 1,348 $9.95 billion
Washington, DC #8 $4.8 billion $8.2 billion 1,416 $7.4 billion
San Diego #9 $1.5 billion $9.4 billion 1,317 $8.7 billion
Austin #10 $1.9 billion $6.6 billion 1,376 $3.7 billion
Philadelphia #11 $3.0 billion $4.8 billion 1,003 $5.4 billion
Atlanta #12 $1.15 billion $5.0 billion 837 $7.8 billion
#1
#2
#1
#3
#4
#5
#6
#7
#8
#9
#10
#11
#12
#1 #1
#2
#2 #2#4
#3
#5
#6
#7
#8
#9
#10
#11
#12
#3
#4
#5
#7
#8
#6
#9
#10
#11
#12
#4
#3
#5
#6
#7
#10
#9
#12
#11
#8
of the 12 venture ecosystems below,
to provide some context for where the
LA MSA venture ecosystem stood in
terms of overall size in mid-2016. More
rigorously assessing the quality of a
given venture ecosystem is something
we are still working toward, so we’d
like to stress that size does not entail
quality in any way. In the case of Los
Angeles, what’s more interesting to
assess is how it stacks up to what are
normally thought of as epicenters of
venture capital activity—the Bay Area-
New York axis.
4 PITCHBOOK 2017 VENTURE ECOSYSTEM FACTBOOK: LOS ANGELES
A relatively healthy economyLA’s current economic condition & recent trends
When assessing how the health of the
local economy impacts the venture
ecosystem, some primary factors
to look at are tax burdens, relative
wages, rental rates and the supply of
talent. Taking those inputs in reverse
order, the LA MSA enjoys the supply
pipelines of graduates from multiple
universities that thereby supports
the incidence of entrepreneurship.
Moreover, LA’s cultural diversity and
welcoming climate enhance livability.
However, sunshine and taco trucks
aren’t enough to outweigh not being
able to afford a place to live.
Luckily, even though rental rates
and median home prices seem set
on increasing in Los Angeles on the
whole—and consumer prices are
also rising in general—new home
construction rates also are growing,
as are wage rates and employment
growth. As always, different data
sources’ narratives diverge, with
Apartment List divulging that Los
Angeles city rents were up 5.2% in
2016 relative to 2015. That dovetails
neatly with UCLA declaring LA the
least affordable rental market in the
nation in 2014. On the whole, taking
more recent data into account, living
accommodations appear expensive
yet not preposterous, especially
given efforts to expand the supply of
affordable housing.
The Los Angeles County Economic
Development Corporation’s forecast
for 2017 and 2018 was for stable,
albeit slower, growth for the state as
a whole, with the LA county seeing
LA metropolitan statistical area (MSA)Select
statistics
Labor force, January 2017 6.65 million
Labor force growth, Jan. ‘16-Jan. ‘17 .01%
Employment growth, Jan. ‘16-Jan. ‘17 1.4%
Unemployment growth, Jan. ‘16-Jan.’17 -9.2%
Average hourly wage, all occupations, May 2015 $25.96
Year-over-year percentage change in pay, 4Q 2016 2.3%
Approximate range of change in annual fair market rents, 1-4 bedrooms 3.4%-3.7%
Consumer price index annual increase for LA MSA, February 2017 2.7%
Forecasted nominal per capital personal income, Los Angeles County, 2017 $57,168
Combined number of jobs in two fastest-growing industries (healthcare & social assistance, administrative & support services) forecasted over next
two years, LA County, 2017-201854,200
Growth ranking among US metropolitan areas, 2010-2015 52
Forecasted annual percent change in real GDP for Los Angeles County, 2017 2.5%
Forecasted population growth rate in Los Angeles County, 2017 0.6%
Annual percent change in real GDP for Los Angeles County, 2016 2.2%
Forecasted YoY increase in residential permits, Los Angeles County, 2017 15.96%
Forecasted YoY increase in median home price in Los Angeles County, 2017 7.4%
Sources: US Bureau of Labor Statistics, CA HUD FY 2017 Fair Market Rents, PayScale, Brookings
Institution, Los Angeles County Economic Development Corporation
4.9% growth in per capita income in
particular. Tax burdens remain fairly
onerous, by and large, although that
is on more of a statewide basis than
anything especially related to the LA
MSA. Regulatory burdens are also
heavy.
All in all, accordingly, the economic
forecast as it directly would affect
entrepreneurship and venture funding
remains fairly promising, with only
potentially higher costs discouraging
those looking to bootstrap or run
lean. Positive spillover effects from
overall growth and rising wages—
even if slower than in past—will
counterbalance to a significant degree,
however.
5 PITCHBOOK 2017 VENTURE ECOSYSTEM FACTBOOK: LOS ANGELES

LA MSA venture activity
Source: PitchBook. *As of 3/31/2017
s s s s s s
volume declines
LA MSA venture activity
Where is LA in the cycle?An overview of LA’s venture investment activity
Key factors induce the prolongation
of the VC investment cycle
nationwide, including LA
Observers of the US venture industry
have noted that by and large,
transaction volume began to slip
several quarters ago, even as capital
invested stayed robust if not at record
aggregate highs. As much of the
national decline is attributable to angel
& seed financing volume diminishing,
the ongoing health in overall VC
invested, not to mention venture
fundraising, has suggested a cautious
pullback primarily centered at earlier
stages. Multiple factors are behind that
overarching trend, key among which
have been: the fluctuating participation
of nontraditional large investors in
venture, the shakeup of traditional
funding models at the earliest stage,
and artificial prolongation of market
cycles via abnormal monetary policies
that render private equity in general
more alluring.
$1,7
55
$2,2
11
$2,1
13
$1,3
86
$1,9
18
$2,4
01
$2,7
99
$2,3
69
$3,8
05
$4,9
78
$5,4
78
$990
186242 276 250
310
397
501566
681 705
543
109
2006 2007 2008 2009 2010 2011 2012 2013 2014 2015 2016 2017*
Deal Value ($M)
# of Deals Closed
0
20
40
60
80
100
120
140
160
180
200
$0.0
$500.0
$1,000.0
$1,500.0
$2,000.0
$2,500.0
$3,000.0
$3,500.0
1Q 2Q 3Q 4Q 1Q 2Q 3Q 4Q 1Q 2Q 3Q 4Q 1Q 2Q 3Q 4Q 1Q 2Q 3Q 4Q 1Q 2Q 3Q 4Q 1Q 2Q 3Q 4Q 1Q
2010 2011 2012 2013 2014 2015 2016 ‘17
Deal Value ($M) # of Deals Closed
Source: PitchBook
6 PITCHBOOK 2017 VENTURE ECOSYSTEM FACTBOOK: LOS ANGELES
s s s s s
First-time financings of LA MSA-based startups
Deal sizes maintain at an elevated level
Median venture financing size ($M) in LA MSA
Valuations at the late stage slide once more
Median venture financing post-valuation ($M) in LA MSA
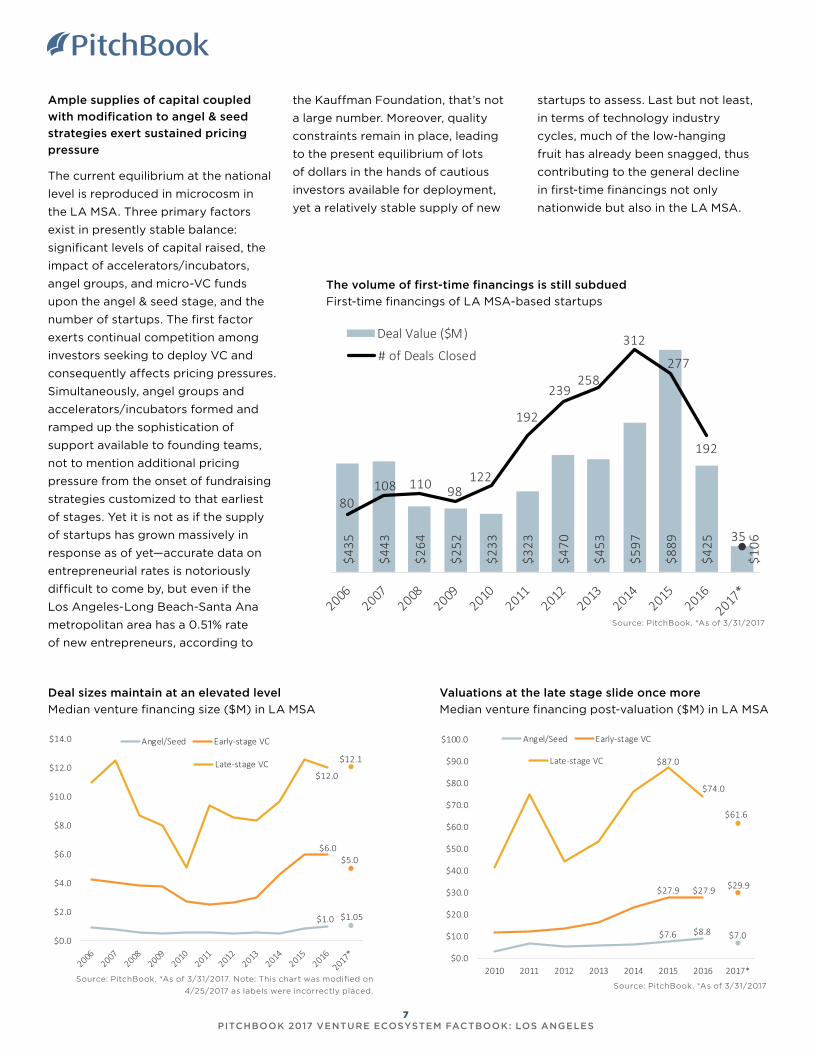
Ample supplies of capital coupled
s
strategies exert sustained pricing
pressure
The current equilibrium at the national
level is reproduced in microcosm in
the LA MSA. Three primary factors
exist in presently stable balance:
significant levels of capital raised, the
impact of accelerators/incubators,
angel groups, and micro-VC funds
upon the angel & seed stage, and the
number of startups. The first factor
exerts continual competition among
investors seeking to deploy VC and
consequently affects pricing pressures.
Simultaneously, angel groups and
accelerators/incubators formed and
ramped up the sophistication of
support available to founding teams,
not to mention additional pricing
pressure from the onset of fundraising
strategies customized to that earliest
of stages. Yet it is not as if the supply
of startups has grown massively in
response as of yet—accurate data on
entrepreneurial rates is notoriously
difficult to come by, but even if the
Los Angeles-Long Beach-Santa Ana
metropolitan area has a 0.51% rate
of new entrepreneurs, according to
the Kauffman Foundation, that’s not
a large number. Moreover, quality
constraints remain in place, leading
to the present equilibrium of lots
of dollars in the hands of cautious
investors available for deployment,
yet a relatively stable supply of new
startups to assess. Last but not least,
in terms of technology industry
cycles, much of the low-hanging
fruit has already been snagged, thus
contributing to the general decline
in first-time financings not only
nationwide but also in the LA MSA.
$435
$443
$264
$252
$233
$323
$470
$453
$597
$889
$425
$106
80108 110 98
122
192
239258
312
277
192
35
Deal Value ($M)
# of Deals Closed
$1.0 $1.05
$6.0$5.0
$12.0
$12.1
$0.0
$2.0
$4.0
$6.0
$8.0
$10.0
$12.0
$14.0 Angel/Seed Early-stage VC
Late-stage VC
Source: PitchBook. *As of 3/31/2017
Source: PitchBook. *As of 3/31/2017. Note: This chart was modified on
4/25/2017 as labels were incorrectly placed.
$7.6 $8.8 $7.0
$27.9 $27.9 $29.9
$87.0
$74.0
$61.6
$0.0
$10.0
$20.0
$30.0
$40.0
$50.0
$60.0
$70.0
$80.0
$90.0
$100.0
2010 2011 2012 2013 2014 2015 2016 2017*
Angel/Seed Early-stage VC
Late-stage VC
Source: PitchBook. *As of 3/31/2017
7 PITCHBOOK 2017 VENTURE ECOSYSTEM FACTBOOK: LOS ANGELES
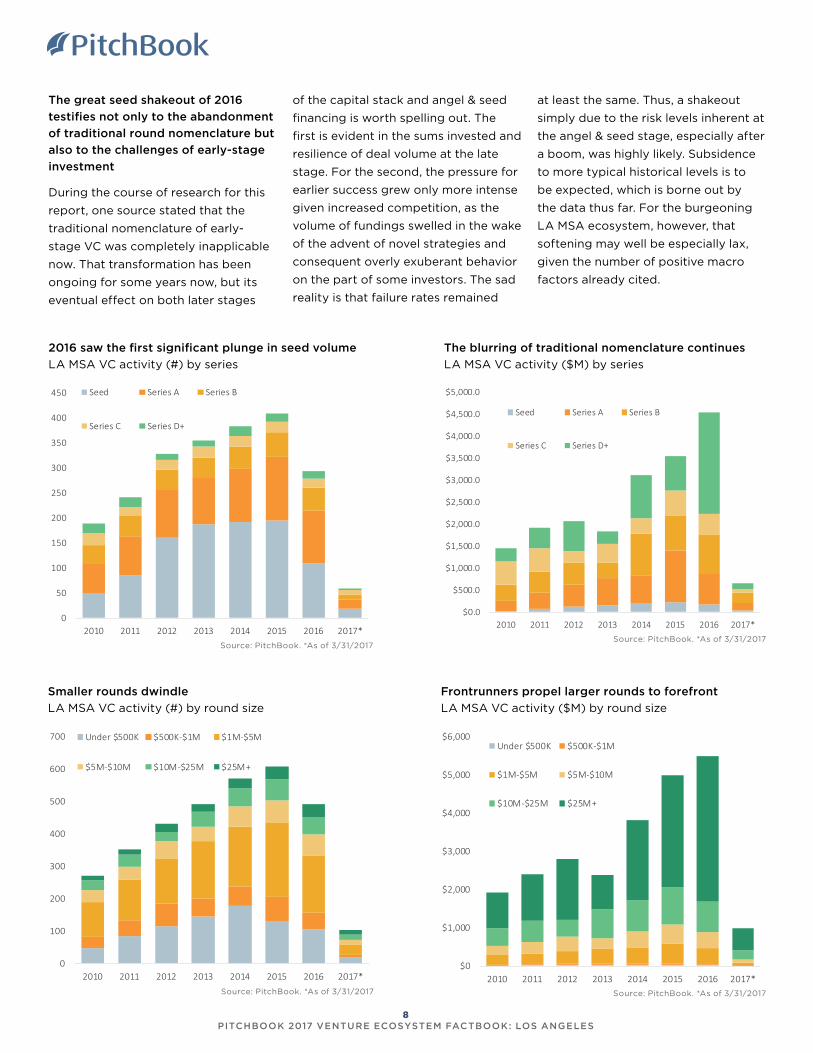
Smaller rounds dwindle
LA MSA VC activity (#) by round size
Frontrunners propel larger rounds to forefront
LA MSA VC activity ($M) by round size
s s s s
LA MSA VC activity (#) by series
The blurring of traditional nomenclature continues
LA MSA VC activity ($M) by series
The great seed shakeout of 2016
s s
of traditional round nomenclature but
also to the challenges of early-stage
investment
During the course of research for this
report, one source stated that the
traditional nomenclature of early-
stage VC was completely inapplicable
now. That transformation has been
ongoing for some years now, but its
eventual effect on both later stages
of the capital stack and angel & seed
financing is worth spelling out. The
first is evident in the sums invested and
resilience of deal volume at the late
stage. For the second, the pressure for
earlier success grew only more intense
given increased competition, as the
volume of fundings swelled in the wake
of the advent of novel strategies and
consequent overly exuberant behavior
on the part of some investors. The sad
reality is that failure rates remained
at least the same. Thus, a shakeout
simply due to the risk levels inherent at
the angel & seed stage, especially after
a boom, was highly likely. Subsidence
to more typical historical levels is to
be expected, which is borne out by
the data thus far. For the burgeoning
LA MSA ecosystem, however, that
softening may well be especially lax,
given the number of positive macro
factors already cited.
$0.0
$500.0
$1,000.0
$1,500.0
$2,000.0
$2,500.0
$3,000.0
$3,500.0
$4,000.0
$4,500.0
$5,000.0
2010 2011 2012 2013 2014 2015 2016 2017*
Seed Series A Series B
Series C Series D+
0
50
100
150
200
250
300
350
400
450
2010 2011 2012 2013 2014 2015 2016 2017*
Seed Series A Series B
Series C Series D+
Source: PitchBook. *As of 3/31/2017Source: PitchBook. *As of 3/31/2017
$0
$1,000
$2,000
$3,000
$4,000
$5,000
$6,000
2010 2011 2012 2013 2014 2015 2016 2017*
Under $500K $500K-$1M
$1M-$5M $5M-$10M
$10M-$25M $25M+
Source: PitchBook. *As of 3/31/2017
0
100
200
300
400
500
600
700
2010 2011 2012 2013 2014 2015 2016 2017*
Under $500K $500K-$1M $1M-$5M
$5M-$10M $10M-$25M $25M+
Source: PitchBook. *As of 3/31/2017
8 PITCHBOOK 2017 VENTURE ECOSYSTEM FACTBOOK: LOS ANGELES
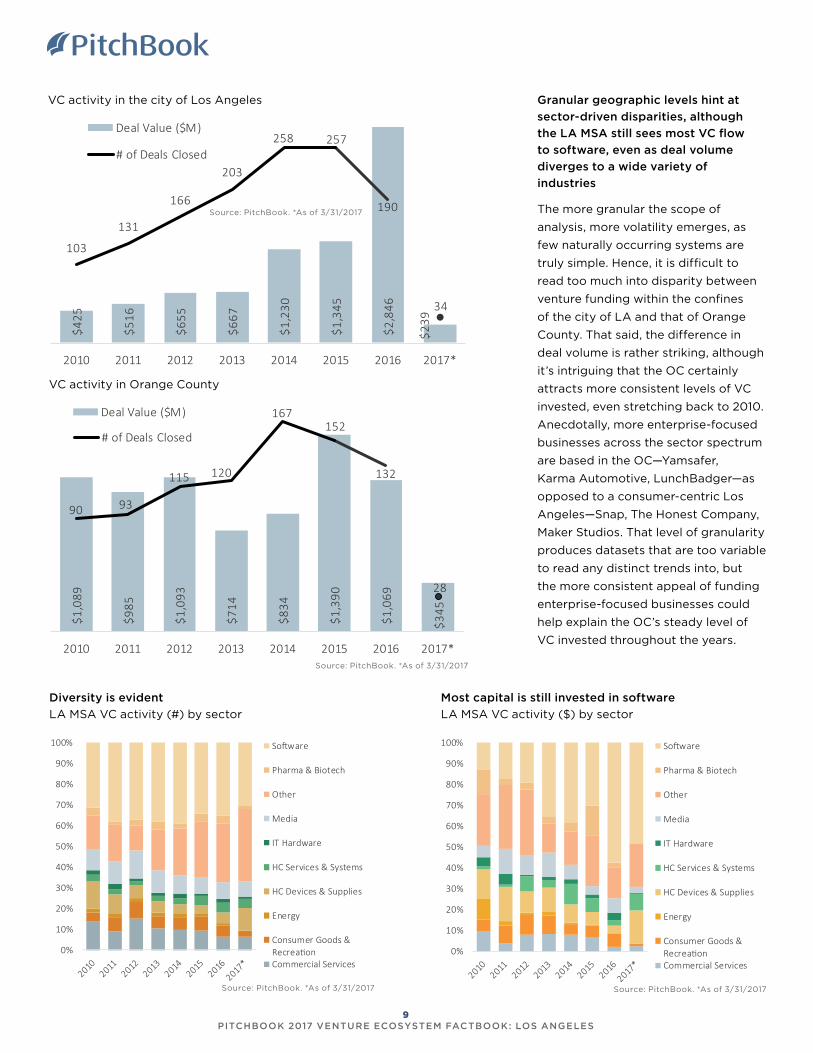
VC activity in the city of Los Angeles
VC activity in Orange County
Granular geographic levels hint at
sector-driven disparities, although
s s s s
to software, even as deal volume
diverges to a wide variety of
industries
The more granular the scope of
analysis, more volatility emerges, as
few naturally occurring systems are
truly simple. Hence, it is difficult to
read too much into disparity between
venture funding within the confines
of the city of LA and that of Orange
County. That said, the difference in
deal volume is rather striking, although
it’s intriguing that the OC certainly
attracts more consistent levels of VC
invested, even stretching back to 2010.
Anecdotally, more enterprise-focused
businesses across the sector spectrum
are based in the OC—Yamsafer,
Karma Automotive, LunchBadger—as
opposed to a consumer-centric Los
Angeles—Snap, The Honest Company,
Maker Studios. That level of granularity
produces datasets that are too variable
to read any distinct trends into, but
the more consistent appeal of funding
enterprise-focused businesses could
help explain the OC’s steady level of
VC invested throughout the years.
Diversity is evident
LA MSA VC activity (#) by sector
Most capital is still invested in software
LA MSA VC activity ($) by sector
$425
$516
$655
$667
$1,2
30
$1,3
45
$2,8
46
$239
103
131
166
203
258 257
190
34
2010 2011 2012 2013 2014 2015 2016 2017*
Deal Value ($M)
# of Deals Closed
Source: PitchBook. *As of 3/31/2017
$1,0
89
$985
$1,0
93
$714
$834
$1,3
90
$1,0
69
$345
90 93
115 120
167152
132
28
2010 2011 2012 2013 2014 2015 2016 2017*
Deal Value ($M)
# of Deals Closed
Source: PitchBook. *As of 3/31/2017
0%
10%
20%
30%
40%
50%
60%
70%
80%
90%
100% So�ware
Pharma & Biotech
Other
Media
IT Hardware
HC Services & Systems
HC Devices & Supplies
Energy
Consumer Goods &Recrea�onCommercial Services
Source: PitchBook. *As of 3/31/2017
0%
10%
20%
30%
40%
50%
60%
70%
80%
90%
100% So�ware
Pharma & Biotech
Other
Media
IT Hardware
HC Services & Systems
HC Devices & Supplies
Energy
Consumer Goods &Recrea�onCommercial Services
Source: PitchBook. *As of 3/31/2017
9 PITCHBOOK 2017 VENTURE ECOSYSTEM FACTBOOK: LOS ANGELES

Investment in LA MSA-based companies by investors
HQ’d outside LA MSA
Investment (#) by size in LA MSA-based companies by
investors HQ’ed outside LA MSA
Investment (#) by size in LA MSA-based companies by
investors HQ’ed outside California
Silicon Valley drives massive
proportion of all LA MSA VC activity,
s s
active
Proximity to Silicon Valley, relatively
speaking, has its perks. VC invested
by firms outside of LA MSA soared
to a new high in 2016, borne by
Snap’s $1.8 billion round, while 1Q
2017 turned in a healthy $688 million.
More interestingly, however, is the
still-substantial rate of financing by
investors that aren’t headquartered
within the state at all. Understandably,
overall volume has lowered in tandem
with national trends over the past few
years, but last year alone 342 rounds
for a cumulative $1.3 billion occurred
in LA MSA at the behest of outside
investors, whether they were from
Seattle or New York. Understandably,
outside activity has skewed more
toward larger rounds as of late; risk
profiles have grown more stringent
and, moreover, typically larger and
more established businesses attract
outside investment in the first place.
LA MSA is hardly alone in the trend
of more firms sourcing abroad even
if they don’t end up closing that
many more deals as a result. Recent
examples include Chicago-based
Pritzker Group Venture Capital, which
is ramping up its presence in LA.
$1,1
77
$1,4
27
$1,4
42
$1,0
01
$1,4
24
$1,6
36
$2,0
96
$1,6
05
$2,5
89
$3,6
72
$4,1
59
$688
134167
208 196
239
303327
414
498 494
430
84
2006 2007 2008 2009 2010 2011 2012 2013 2014 2015 2016 2017*
Deal Value ($M)
# of Deals Closed
Source: PitchBook
*As of 3/31/2017
Investment in LA MSA-based companies by investors
HQ’d outside California
$700
$711
$1,4
72
$878
$1,3
11
$2,0
30
$1,3
30
$419
184
224255
329
403385
342
70
2010 2011 2012 2013 2014 2015 2016 2017*
Deal Value ($M)
# of Deals Closed
0%
10%
20%
30%
40%
50%
60%
70%
80%
90%
100%
2010 2011 2012 2013 2014 2015 2016 2017*
Under $500K $500K-$1M $1M-$5M
$5M-$10M $10M-$25M $25M+
Source: PitchBook. *As of 3/31/2017
Source: PitchBook. *As of 3/31/2017
Source: PitchBook. *As of 3/31/2017
0%
10%
20%
30%
40%
50%
60%
70%
80%
90%
100%
2010 2011 2012 2013 2014 2015 2016 2017*
Under $500K $500K-$1M $1M-$5M
$5M-$10M $10M-$25M $25M+Source: PitchBook. *As of 3/31/2017
10 PITCHBOOK 2017 VENTURE ECOSYSTEM FACTBOOK: LOS ANGELES

Healthy positioningDatasets of venture-backed exits and local venture fundraising in LA
s s s
Venture-backed exits of LA MSA-based companies
Snap’s IPO skews 1Q results
Venture-backed exits ($M) by type of LA MSA-based
companies
s s
Venture-backed exits (#) by type of LA MSA-based
companies
Investing cycle positioned to support
steady exit volume in the coming year
Skewed by Snap’s IPO, LA exit
value could still end up comparing
favorably to prior yearly totals should
the momentum of exit volume hold
throughout the year. Assessing
historical exit volumes in tandem with
AUM (on the following page) it’s clear
that portfolios have been refilling for
some time and consequently VCs and
founders may begin looking to exit
sooner rather than later, while the M&A
climate is still fair and IPO avenues
appear open. The former remains as
important as ever to LA VCs, relative
to the latter, judging by the historical
preponderance of M&A in VC-backed
exit tallies.
$1,6
32
$1,5
50
$267
$1,7
56
$1,2
46
$1,6
54
$2,0
19
$1,2
86
$2,8
78
$1,3
48
$4,1
74
$3,5
26
31 2932 32 35 35
49
44
73
48
40
12
2006 2007 2008 2009 2010 2011 2012 2013 2014 2015 2016 2017*
Exit Value ($M)
# of Deals Closed
Source: PitchBook. *As of 3/31/2017
0%
10%
20%
30%
40%
50%
60%
70%
80%
90%
100%
2010 2011 2012 2013 2014 2015 2016 2017*Acquisi�on Buyout IPO
0%
10%
20%
30%
40%
50%
60%
70%
80%
90%
100%
2010 2011 2012 2013 2014 2015 2016 2017*Acquisi�on Buyout IPO
Source: PitchBook. *As of 3/31/2017 Source: PitchBook. *As of 3/31/2017
11 PITCHBOOK 2017 VENTURE ECOSYSTEM FACTBOOK: LOS ANGELES

Total AUM has bounced back since lowering in a
s s s s
VC AUM in LA MSA
A fair proportion of large exits over the years
Venture-backed exits of LA MSA-based companies (#)
by size
Growing interest in the LA startup ecosystem is evident
LA MSA venture fundraising
youthful funds point to solid capital
base for the future
Between 2014 and 2016, inclusive,
41 domestic venture funds were
closed on just over $1.5 billion in
commitments. Although fundraising
momentum heading into 2017 in terms
of volume and value is mildly slower,
that level of relatively recent capital
collection indicates a healthy capital
base for future funding efforts within
the LA ecosystem. Such success is
explained in part by the prevalence
of generously sized VC-backed exits
over the past few years, although the
growing reputation of the LA startup
ecosystem hasn’t hurt. One last note of
import: The slow increase in local VC
AUM is useful as an indicator of where
we stand in the current cycle, with the
steady ramp-up since 2013 paired with
lowering deal volume speaking to the
VC investment cycle entering later
innings.
$263
$215
$306
$275
$18
$56
$123
$223
$620
$346
$588
$126
6
3
6
32
4
78
15
13 13
3
2006 2007 2008 2009 2010 2011 2012 2013 2014 2015 2016 2017*
Capital Raised ($B) # of Funds Closed
Source: PitchBook. *As of 3/31/2017
0%
10%
20%
30%
40%
50%
60%
70%
80%
90%
100%
2010 2011 2012 2013 2014 2015 2016 2017*
Under $25M $25M-$50M $50M-$100M $100M-$500M
$3.7$3.8
$3.5 $3.6$3.4
$3.0$2.9
$2.5
$2.9
$3.5$3.7
$0.0
$0.5
$1.0
$1.5
$2.0
$2.5
$3.0
$3.5
$4.0
2006 2007 2008 2009 2010 2011 2012 2013 2014 2015 2016
Total AUM ($B)
Source: PitchBook. *As of 3/31/2017 Source: PitchBook
12 PITCHBOOK 2017 VENTURE ECOSYSTEM FACTBOOK: LOS ANGELES
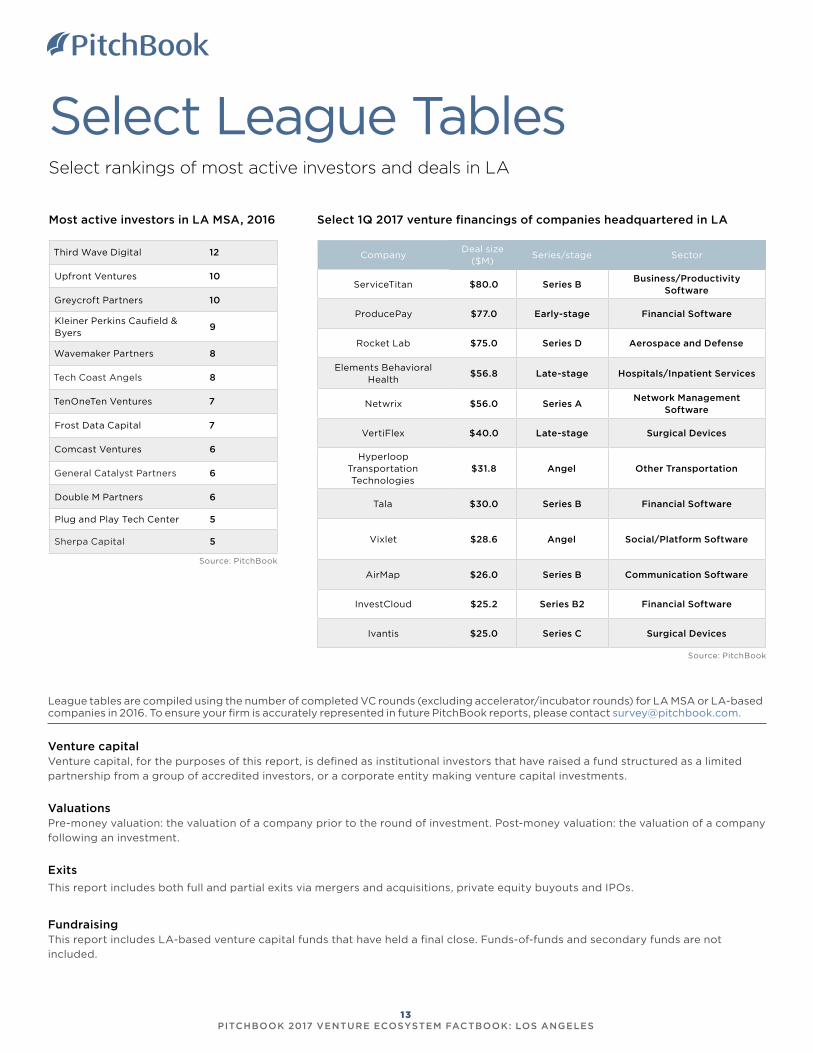
Third Wave Digital 12
Upfront Ventures 10
Greycroft Partners 10
Kleiner Perkins Caufield & Byers
9
Wavemaker Partners 8
Tech Coast Angels 8
TenOneTen Ventures 7
Frost Data Capital 7
Comcast Ventures 6
General Catalyst Partners 6
Double M Partners 6
Plug and Play Tech Center 5
Sherpa Capital 5
Most active investors in LA MSA, 2016
Venture capitalVenture capital, for the purposes of this report, is defined as institutional investors that have raised a fund structured as a limited
partnership from a group of accredited investors, or a corporate entity making venture capital investments.
ValuationsPre-money valuation: the valuation of a company prior to the round of investment. Post-money valuation: the valuation of a company
following an investment.
Exits
This report includes both full and partial exits via mergers and acquisitions, private equity buyouts and IPOs.
FundraisingThis report includes LA-based venture capital funds that have held a final close. Funds-of-funds and secondary funds are not
included.
League tables are compiled using the number of completed VC rounds (excluding accelerator/incubator rounds) for LA MSA or LA-based companies in 2016. To ensure your firm is accurately represented in future PitchBook reports, please contact [email protected].
Source: PitchBook
CompanyDeal size
($M)Series/stage Sector
ServiceTitan $80.0 Series BBusiness/Productivity
Software
ProducePay $77.0 Early-stage Financial Software
Rocket Lab $75.0 Series D Aerospace and Defense
Elements Behavioral Health
$56.8 Late-stage Hospitals/Inpatient Services
Netwrix $56.0 Series ANetwork Management
Software
VertiFlex $40.0 Late-stage Surgical Devices
Hyperloop Transportation Technologies
$31.8 Angel Other Transportation
Tala $30.0 Series B Financial Software
Vixlet $28.6 Angel Social/Platform Software
AirMap $26.0 Series B Communication Software
InvestCloud $25.2 Series B2 Financial Software
Ivantis $25.0 Series C Surgical Devices
Source: PitchBook
Select League TablesSelect rankings of most active investors and deals in LA
s s
13 PITCHBOOK 2017 VENTURE ECOSYSTEM FACTBOOK: LOS ANGELES
See how the PitchBook Platform can
s
next deal.
We do
EBITDA multiples,private comps,valuations,market trends,growth metrics.
You build a better portfolio.