00 uganda - oecd 3.pdf · 00 aid effectiveness 2011: progress in implementing the paris declaration...
TRANSCRIPT

00
1Aid EffEctivEnEss 2011: ProgrEss in imPlEmEnting thE PAris dEclArAtion – volumE ii country chAPtErs
UGANDA
introduction
ugAndA is a low-income country with a gross national income (GNI) of USD 460 per capita in 2009 which has grown at an average rate of 5% per annum since 2005 (WDI, 2011). Uganda has a population of approximately 32 million, 29% of whom (9 million people) lived under the 1.25 dollar-a-day income poverty line in 2009 (WDI, 2011). Net official development assistance (ODA) to Uganda in 2009 totalled USD 1.7 billion (OECD, 2011). Since 2005, net ODA has averaged 13% of GNI (WDI, 2011). The top five donors contrib-uted 64% of Uganda’s core ODA in 2010 (OECD, forthcoming). n
summAry of ProgrEssProgrEss on thE PAris dEclArAtion indicAtors depends on improvements by both donors and partner governments. Since the 2005 baseline year, Uganda has made progress towards achieving many of the Paris Declaration targets. In 2010, out of 13 indicators with applicable targets, six were met. An operational development strategy is in place, meeting the 2010 target. On alignment, targets for four indicators have been met, however the use of country PFM systems has regressed since 2005 and 2007. There has been a decline in the predictability of aid since 2005. All harmonisation indicators are below target, although the target for joint analytic work is close to being met. Uganda has registered a setback in its results-oriented framework since 2005/07, but a mutual accountability mechanism was put in place in 2010.
About thE survEy
This chapter assesses progress against the quantitative indicators provided by the Survey on Monitoring the Paris Declaration, drawing on data provided by the government and donors, the OECD and the World Bank. In addition to this, it draws on qualitative evi-dence submitted to the OECD by the national government which incorporates feedback from donors and other stakeholders. Stakeholders note that it is possible that in places defi-nitions and concepts were interpreted differently by survey respondents in 2011 compared with previous years. A degree of caution should be taken when analysing the trends shown by some of the indicators.
The 2011 Survey responses cover over 15 donors and 94% of Uganda’s core ODA. Uganda participated in the previous 2006 and 2008 surveys. n

2 Aid EffEctivEnEss 2011: ProgrEss in imPlEmEnting thE PAris dEclArAtion – volumE ii country chAPtErs
ugAndA
tAblE 2: learning from success and challenges
tAblE 1: baselines and targets for 2010
INDICATORS 2005 REFERENCE 2007 2010 ACTUAL 2010 TARGET
1 Operational development strategies B B B ‘B’ or ‘A’
2a Reliable public financial management (PFM) systems 4.0 4.0 3.5 4.5
2b Reliable procurement systems Not available B Not available No Target
3 Aid flows are aligned on national priorities 79% 98% 96% 90%
4 Strengthen capacity by co‑ordinated support 42% 58% 76% 50%
5a Use of country PFM systems 60% 57% 66% 73%
5b Use of country procurement systems 54% 37% 43% No Target
6 Strengthen capacity by avoiding parallel PIUs 54 55 15 18
7 Aid is more predictable 84% 74% 74% 92%
8 Aid is untied 93% 90% 95% More than 93%
9 Use of common arrangements or procedures 50% 66% 49% 66%
10a Joint missions 17% 21% 24% 40%
10b Joint country analytic work 40% 54% 56% 66%
11 Results‑oriented frameworks B B C ‘B’ or ‘A’
12 Mutual accountability N N Y Y
ACHIEVEMENT or CHALLENGE LESSON or PRIORITY ACTION
Ownership Achievement: Uganda has a long-term national development strategy (NDS), formulation of which included the private sector, local government structures and civil society. The strategy serves as a reference point for planning and budgeting of activities.
Lesson: Despite the lack of an explicit institutionalised process of participation of stakeholders such as civil society and the private sector, there are various general instruments (policy guidelines, rules and regulations, institutions and legislation) in place for stakeholder participation in planning and NDP processes.
Alignment Achievement: The co-ordination of technical co-operation with national priorities and strategies has been improved by a considerable margin.Challenge: Declining use of programme-based approaches among donors.
Lesson: Through a new partnership policy, the government is communicating clear guidance on the management of technical co-operation. The NDS also identifies sectors where human capacity constraints hinder sector development.
Harmonisation Priority action: Increase the proportion of aid being channelled “off-budget” and “off-plan”. Promote the increased use of budget support modalities.
Managing for results
Challenge: The effectiveness of Uganda‘s results-based monitoring framework has decreased since previous surveys.
Priority action: Mechanisms for monitoring and managing for results need to be clarified to ensure quality, reliability, accuracy, timeliness, and usefulness of data.
Mutual accountability
Achievement: A mutual accountability mechanism is in place.
Lesson: The NDS currently outlines several priority areas and strategies to improve the effectiveness of development assistance. Additionally donor-government forums, such as the Joint Budget Support Framework (JBSF), foster dialogue and mutual accountability.

3Aid EffEctivEnEss 2011: ProgrEss in imPlEmEnting thE PAris dEclArAtion – volumE ii country chAPtErs
ugAndA
oWnErshiPAid is most EffEctivE when it supports a country-owned approach to development. It is less effective when aid policies and approaches are driven by donors. In the context of the Paris Declaration, ownership concerns a country’s ability to carry out two, inter-linked activities: exercise effective leadership over its development policies and strategies; and co-ordinate the efforts of various development actors working in the country.
Indicator 1 assesses the operational value of a country’s development strategy. In particular, it looks at the exist-ence of an authoritative country-wide development policy (i.e. a unified strategic framework), the extent to which priorities are established, and whether these policies are costed and linked with the budget. All of these features are important to harness domestic resources for development, and to provide a basis for the alignment of aid to development priorities. Each country has provided evidence against these criteria, and this has been translated into a score by the World Bank using the same methodology as in the 2006 and 2008 surveys. A five-point scale runs from A (highest score) to E (lowest score). The Paris Declaration targets 75% of partner countries achieving a score of A or B by 2010.
In the 2006, 2008 and 2011 surveys, Uganda received a B rating. Uganda has a national development strat-egy (NDS) - the “National Development Plan, 2010/11-2014/15” - which is linked to a long-term vision, Vision 2025. The NDS is linked with sector strategies, although how strongly is unclear and work is being done to ensure closer linkage and alignment. Policy makers and line ministries use the NDS as a reference point to focus planning and budgeting of activities. The NDS incorporates prioritised targets to be imple-mented by the medium-term expenditure framework (MTEF) and also integrates all of the MDG indicators, as well as several cross-cutting themes. The NDS is costed and is linked to the budget via a medium-term fiscal framework (MTFF). Uganda’s MTEF is designed to reflect the sector strategies (in line with the NDS) in the budget process. There is a performance orientation in the budget process which allows for assessments of past performance to influence future planning and budgeting
The objectives of the sector strategies are aligned to deliver the NDS’s priorities, and work is being done to make the precise mechanisms and linkages clearer. The NDS has targets which are prioritised on an annual basis and reflected in the MTEF. Although all of the MDGs are incorporated into the strategy, it does not appear that they have been adequately tailored to Uganda’s context. Cross-cutting issues, such as the environ-ment and gender, are integrated and mainstreamed in the strategy. The involvement and influence of donors in the plan’s formulation was perceived to be generally low, however there was a high degree of involvement of the private sector, local government structures, civil society and non-governmental organisations (NGOs) in the formulation of the National Development Plan. Parliament endorsed the National Development Plan, as required by an act. n
AlignmEntAid thAt is donor drivEn And frAgmEntEd is less effective. For aid to be effective, it must make use of national development strategies and use and help strengthen capacity in national systems, such as those for procurement and public financial management. The Paris Declaration envisions donors basing their support fully on partner countries’ aims and objectives. Indicators 2 through 8 of the Paris Declaration assess several different dimen-sions of alignment.
In 2010, Uganda met four alignment indicators with applicable targets: alignment of aid flows to national priorities; strengthened capacity through co-ordinated support; proliferation of parallel PIUs and; proportion of untied aid). The use of PFM systems has improved slightly, although the target went unmet, however the reliability of PFM systems received a lower score than in previous assessments. The predictability of aid also declined from previous levels.
INDICATOR 1 do countries have operational development strategies?

4 Aid EffEctivEnEss 2011: ProgrEss in imPlEmEnting thE PAris dEclArAtion – volumE ii country chAPtErs
ugAndA
Indicator 2 covers two aspects of country systems: public financial management (PFM) and procurement. Do these systems either adhere to good practices or are there plans for reform? If countries have reliable systems, donors are encouraged to use them for the delivery and management of aid. This helps to align aid more closely with national development strategies and enhances aid effectiveness.
Indicator 2a of the Paris Declaration assesses whether PFM systems meet broadly accepted good practices or whether credible reform programmes are in place. The assessment is based on the World Bank’s Country Policy and Institutional Analysis (CPIA) score for the quality of PFM systems, which uses a scale running from 1 (very weak) to 6 (very strong).
To score highly, a country needs to perform well against all three of the following criteria: a comprehensive and credible budget linked to policy priorities; an effective financial management system to ensure that the budget is implemented as intended in a controlled and predictable way; and timely and accurate accounting and fiscal reporting, including timely and audited public accounts with effective arrangements for follow up. Meeting the global 2010 target requires half of partner countries to move up at least one measure (i.e. 0.5 points) between 2005 and 2010.
The rating of Uganda’s PFM systems has regressed to 3.5 since 2005 and 2007 when it was at 4.0, and it thus falls further short of the 2010 target of 4.5, despite the initiation of a number of PFM reforms. Limited human resource and institutional capacity constitute the main challenge affecting effective implementation of Uganda’s PFM. Key reforms already undertaken include the introduction of Commitment Control Systems for budget execution, the Integrated Financial Management System (IFMS) for budgetary and financial man-agement, a fiscal decentralisation strategy, non-tax revenue management, electronic fund transfer, pay-roll management,1 audit and oversight, results-oriented management and several budgetary reforms. At the sub-national level, the Integrated Financial Management System (IFMS) has been rolled out to some local gov-ernment authorities (although less than 20%). It is a mandatory requirement the IFMS is used by accounting officers wherever the system is fully operational. The Office of the Auditor General had undertaken a number of PFM diagnostic exercises which indicate a likelihood of achieving the 4.5 target in the next five years.
Indicator 2b was first measured in 2008 by 17 countries. The process is one of self-assessment, using the Methodology for the Assessment of National Procurement Systems developed by the OECD-DAC Task Force on Procurement. The methodology includes baseline indicators to compare a country’s systems to internationally-accepted good practice, as well as a new set of indicators. These indicators assess overall per-formance of the system, compliance with national legislation and standards and whether there is a reform programme in place to promote improved practices. The results are expressed as grades on a four-point scale running from A (the highest) to D (the lowest). The 2010 target is for a third of partner countries to move up at least one measure (i.e. from D to C, C to B or B to A) although not all countries will perform an assessment.
The reliability of Uganda’s procurement systems was not rated in 2010. However, stakeholders at the country level note that the implementation of the legal framework on Public Procurement and Disposal Act of 2003 has been slow.2 The Public Procurement and Disposal of Public Assets Authority is the body charged with regulating public procurement. As part of the efforts to improve and strengthen its procurement systems, the government has embarked on a number of initiatives. These include introducing the Anti-Corruption Act of 2009, setting up an Anti-Corruption Court, and planning a review of the Public Procurement and Disposal of Public Assets. Challenges, however, remain in ensuring adequate human and institutional capacity in procurement.
INDICATOR 2 building reliable country systems
INDICATOR 2a how reliable are country public financial management systems?
INDICATOR 2b how reliable are country procurement systems?

5Aid EffEctivEnEss 2011: ProgrEss in imPlEmEnting thE PAris dEclArAtion – volumE ii country chAPtErs
ugAndA
Comprehensive and transparent reporting on aid, and its use, helps ensure that donors align aid flows with national development priorities. When aid directed to the government sector is fully and accurately reflected in the national budget it indicates that aid programmes are well connected with country policies and pro-cesses. This also allows partner country authorities to present accurate and comprehensive budget reports to their parliaments and citizens.
As a proxy for alignment, indicator 3 measures the percentage of aid disbursed by donors for the government sector that is included in the annual budget for the same fiscal year. The indicator reflects two components: the degree to which aid is aligned with government priorities, and the extent to which aid is captured in gov-ernment’s budget preparation process. Budget estimates can be higher or lower than disbursements by donors and are treated similarly for the purpose of measuring indicator 3 despite the different causes.
The 2010 target is to halve the proportion of aid flows that are not currently reported on government budgets, with at least 85% of aid reflected in the budget.
The 2010 target is to halve the proportion of aid flows that are not currently reported in government budgets with at least 85% of aid reported in budget documents. The 2011 Survey indicates that 96% of aid to the gov-ernment sector in Uganda was accurately estimated in the budget in 2010, exceeding the 2010 target even if this is a slight decrease from 2007. Among major donors to Uganda, the World Bank is the highest performer in this regard with all its aid accurately estimated on budget, followed by the EU Institutions at 94%. The African Development Bank scored significantly lower at 46%. Discrepancies between donor disbursements and government estimates of aid can partly be accounted for by delayed or cancelled donor budget support disbursements due to slow project implementation; delays caused by procurement; government failure to
INDICATOR 3 Aligning aid flows on national priorities
Government’s budget
estimates of aid flows in 2010
Aid disbursed by donors for government
sector in 2010
2005 2007 2010 * Total aid disbursed through
other donors
(USD m) (USD m) (for reference) (for reference) (%) (USD m)a b c = a / b c = b /a
African Dev. Bank 191 89 48% 80% 46% 0Austria 6 8 33% 86% 78% 0Belgium 26 16 54% 37% 62% 3Denmark 60 54 95% 87% 90% 0EU Institutions 140 132 46% 67% 94% 0France 2 0 68% ‑‑ 0% 0GAVI Alliance 23 10 ‑‑ ‑‑ 43% 0Germany 25 53 98% ‑‑ 47% 0Global Fund 90 98 81% 78% 92% 0Ireland 35 31 99% 82% 88% 0Italy ‑‑ ‑‑ 36% 75% ‑‑ 0Japan 15 70 70% 40% 21% 10Korea ‑‑ 1 ‑‑ ‑‑ 1Netherlands 35 43 39% 39% 82% 0Norway 22 25 74% 96% 87% 1Sweden 27 34 70% 64% 79% 0United Kingdom 64 51 85% 69% 79% 28United Nations 35 40 30% 16% 85% 1United States ‑‑ 6 ‑‑ ‑‑ 1World Bank 336 337 84% 93% 100% 0Average donor ratio 65% 67% 69%Total 1 132 1 088 79% 98% 96% 44
* Ratio is c = a / b except where government’s budget estimates are greater than disbursements (c = b /a).
tAblE 3: Are government budget estimates comprehensive and realistic?

6 Aid EffEctivEnEss 2011: ProgrEss in imPlEmEnting thE PAris dEclArAtion – volumE ii country chAPtErs
ugAndA
undertake agreed actions or meet agreed performance indicators; avoidance of budget execution procedures to process payments; a lack of adequate information sharing between government and donors; and discrepan-cies between the fiscal years of donors and the GOU.
However, many of these reasons for discrepancies do not reflect a lack of alignment with national priori-ties. More broadly, two issues present particular challenges. Firstly, on the government side, misalignment to national priorities is a reflection of weak or non-existent sector strategies in some sectors, and government needs to elaborate clear sector strategies. Secondly, the issue of ‘off-plan’ project support provided by donors directly to recipient NGOs or project implementers provides a challenge for alignment. These funds are not disbursed to the government sector and therefore are not captured by the quantitative assessment of indica-tor 3, but nevertheless have a large impact on any assessment of ‘alignment’.
Government and donors are working together to improve the disclosure of information. The Ministry of Finance, Planning and Economic Development (MFPED) receives information on past disbursements and future projections from the donors on a regular basis. This information is provided through the Donor Economists Group (DEG) which, in consultation with MFPED, agrees on standard definitions and report-ing formats for aid data information disclosure.
For many countries, aid is a vital source of revenue and resources. Being able to predict aid disbursements – both in terms of how much aid will be delivered and when – is important to enable countries to manage public finances and undertake realistic planning for development. The Paris Declaration calls on donors to provide reliable, indicative commitments of aid over a multi-year framework, and to disburse aid in a timely and predictable manner according to agreed schedules.
Indicator 7 examines the in-year predictability of aid for the government sector by measuring the proportion of planned disbursements (as reported by donors) that are recorded by governments in their accounting system as having been disbursed. Indicator 7 therefore assesses two aspects of predictability. The first is the ability of donors to disburse aid according to schedule. The second is the ability of government to record disbursements for the government sector as received in its accounting system. Indicator 7 is designed to encourage progress in relation to both, with the aim of halving the proportion of aid not disbursed (and not captured in the gov-ernment’s accounting system) within the fiscal year for which it was scheduled by 2010. The ultimate goal is to improve not only the predictability of disbursements, but also the accuracy with which they are recorded in government systems – an important element to support ownership, accountability and transparency.
The predictability of aid declined from 84% in 2005 to 74% in 2007, and then remained constant at 74% in 2010. This means that Uganda missed its target of 92% by 18% in 2011. Of the major donors to Uganda, the EU Institutions and World Bank registered approximately 90%, while the African Development Bank and the United Nations scored significantly lower at 52% and 28% respectively. Reasons for discrepancies between disbursed aid reported by donors and that recorded in public accounts include: lack of records for disbursements made by donors paid directly to service providers which do not make use of government budget execution procedures; donor disbursement schedules and fiscal years which do not correspond to the government budget or fiscal year; delays in projects fulfilling the reporting requirements as set out in financ-ing agreements. However, substantial progress has notably been made by donors in providing multi-year com-mitments which have resulted in an increase in ‘medium-term’ (two-three year) predictability.
In order to address shortcomings in the current IT systems for capturing aid inflows to the government budget, the government’s Integrated Financial Management System (IFMS) has recently been upgraded to implement a Donor Financed Projects solution, which will handle multi-currency reporting, and will therefore begin capturing donor disbursements. In addition, to ensure various aid reporting needs are met, the Ministry of Finance, Planning and Economic Development (MFPED) is in the process of procuring an updated aid infor-mation management system to improve aid data capture.
INDICATOR 7 Providing more predictable aid

7Aid EffEctivEnEss 2011: ProgrEss in imPlEmEnting thE PAris dEclArAtion – volumE ii country chAPtErs
ugAndA
Capacity constraints present significant challenges to development and poverty reduction efforts and their sustainability. These relate both to aid management capacities (the ability of the government to capture, co-ordinate and utilise aid flows more effectively) and also to broader capacities for the design and implemen-tation of policies and service delivery.
Under the Paris Declaration donors committed to providing technical co-operation that is coordinated with partner country strategies and programmes. This approach aims to strengthen capacities while also respond-ing to the needs of partner countries. Successful capacity development is led by the partner country.
Indicator 4 focuses on the extent to which donor technical co-operation (an important input into capacity development) is country-led and well co-ordinated. It captures the extent to which technical co-operation is aligned with objectives articulated by country authorities, whether country authorities have control over this assistance, and whether arrangements are in place to co-ordinate support provided by different donors. The Paris Declaration target is for 50% of technical co-operation flows to be implemented through co-ordinated programmes that are consistent with national development strategies by 2010.
In 2010, the proportion of co-ordinated technical co-operation showed a steady increase from previous surveys to 76%, exceeding the 50% target for 2010. Several donors also showed marked improvement in their provision of co-ordinated technical co-operation. Of the major donors in Uganda, the World Bank and Japan co-ordinated all their technical assistance, followed by Germany (93%), and the United States (72%), while the United Nations and EU Institutions scored significantly lower at approximately 35%.
Disbursements recorded by government
in 2010
Aid scheduled by
donors for disbursement
in 2010
2005 2007 2010 * For reference: Aid disbursed by donors for government
sector in 2010
For reference: % of scheduled aid
disbursements reported as disbursed by donors
in 2010 **(USD m) (USD m) (for reference) (for reference) (%) (USD m) (%)
a b c = a / b c = b / a d e = d / b e = b / dAfrican Dev. Bank 98 190 25% 89% 52% 110 58%Austria 8 8 91% 65% 96% 9 89%Belgium 11 17 22% 35% 63% 18 95%Denmark 22 42 96% 54% 53% 41 97%EU Institutions 122 133 85% 53% 92% 107 80%France 1 0 68% ‑‑ 0% 0 ‑‑GAVI Alliance ‑‑ 17 0% ‑‑ 10 56%Germany 1 48 63% 62% 1% 37 77%Global Fund 51 61 96% 78% 84% 57 94%Ireland 32 31 91% 90% 95% 26 85%Italy ‑‑ ‑‑ 38% 29% ‑‑ ‑‑ ‑‑Japan 77 50 55% 30% 65% 50 100%Korea ‑‑ 1 ‑‑ ‑‑ 1 100%Netherlands 25 36 68% 43% 70% 32 88%Norway 22 42 91% 94% 54% 37 89%Sweden 22 30 81% 53% 74% 27 91%United Kingdom 54 80 86% 68% 67% 109 74%United Nations 19 67 57% 20% 28% 42 63%United States ‑‑ 0 ‑‑ 6 0%World Bank 339 373 77% 81% 91% 332 89%Average donor ratio 66% 59% 62% 79%Total 906 1 226 84% 74% 74% 1 051 86%
* Ratio is c=a/b except where disbursements recorded by government are greater than aid scheduled for disbursement (c=b/a). ** Ratio is e=d/b except where disbursements recorded by donors are greater than aid scheduled for disbursement (e=b/d).
tAblE 4: Are disbursements on schedule and recorded by government?
INDICATOR 4 co-ordinating support to strengthen capacity

8 Aid EffEctivEnEss 2011: ProgrEss in imPlEmEnting thE PAris dEclArAtion – volumE ii country chAPtErs
ugAndA
Through a new partnership policy, the government is communicating clear guidance on the management of technical co-operation - which should be government managed, have a clear mechanism for skill transfer, and draw upon experts from Uganda and other regional countries where possible. The NDS identifies sectors where human capacity constraints hinder sector development. It also outlines government strategies and interventions to address capacity constraints in each sector. These strategies are further elaborated in the rel-evant sector strategies which provide clear guidance on government interventions to improve capacity. Sector working groups (SWGs), functional in many sectors, provide a forum for sectors to communicate capacity constraints to donors and ensure that technical assistance provided is aligned with - and complementary to - government capacity building efforts. Despite the government’s efforts, some sector strategies do not provide clear guidance to donors as to where the capacity constraints are most pressing, making it difficult for donors to align with government capacity building efforts and address the most binding constraints.
Donor use of a partner country’s established institutions and systems increases aid effectiveness by strength-ening the government’s long-term capacity to develop, implement and account for its policies to both its citi-zens and its parliament. The Paris Declaration commits donors to increase their use of country systems that are of sufficient quality, and to work with partner countries to strengthen systems that are currently weak. Indicator 5 is directly linked to indicator 2 on the quality of public financial management (PFM) and pro-curement systems.
Indicator 5a measures the extent to which donors use partner country PFM systems when providing funding for the government sector. It measures the volume of aid that uses partner country PFM systems (budget execution, financial reporting and auditing) as a proportion of total aid disbursed for the government sector. The 2010 target is set relative to indicator 2a on the quality of PFM systems. For partner countries with a score of 5 or above on indicator 2a scale the target is for a two-thirds reduction in the proportion of aid to the public sector not using the partner country’s PFM systems. For partner countries with a score between 3.5 and 4.5 on indicator 2a, the target is a one-third reduction in the proportion of aid to the public sector not using partner country’s PFM systems. There is no target for countries scoring less than 3.5.
Co‑ordinated technical co‑operation
Total technical co‑operation
2005 2007 2010
(USD m) (USD m) (for reference) (for reference) (%)a b c = a / b
African Dev. Bank 0 1 100% 100% 0%Austria 0 1 18% 22% 41%Belgium 4 7 18% 75% 65%Denmark 3 3 0% 100% 100%EU Institutions 2 7 44% 100% 37%France 0 0 0% ‑‑ ‑‑GAVI Alliance 0 0 ‑‑ ‑‑ ‑‑Germany 23 25 23% 88% 93%Global Fund 0 0 ‑‑ ‑‑ ‑‑Ireland 3 3 0% 100% 100%Italy ‑‑ ‑‑ 69% 15% ‑‑Japan 14 14 100% 82% 100%Korea 1 1 ‑‑ ‑‑ 86%Netherlands 0 0 ‑‑ ‑‑ ‑‑Norway 0 0 100% 12% ‑‑Sweden 1 1 61% 97% 100%United Kingdom 5 5 12% ‑‑ 84%United Nations 6 18 98% 55% 32%United States 16 23 0% ‑‑ 72%World Bank 15 15 94% 87% 100%Total 95 125 42% 58% 76%
tAblE 5: how much technical co-operation is co-ordinated with country programmes?
INDICATOR 5 using country systems
INDICATOR 5a use of country public financial management systems

9Aid EffEctivEnEss 2011: ProgrEss in imPlEmEnting thE PAris dEclArAtion – volumE ii country chAPtErs
ugAndA
There has been a notable improvement in overall usage of Uganda’s PFM systems from a score of 57% in 2008 to 66% in 2011, although this remains below the 73% target. The 9% increase was mainly driven by increased use of government audit and government financial reporting systems (which rose by 12% and 5% increase over this period respectively). There was little improvement in the use of budget execution procedures - only a 1% increase - over the same period. Due to its synergy with other dimensions of the PFM system, it is the increased use of country budget execution procedures which is likely to have the greatest impact in terms of strengthened PFM systems.
Among major donors to Uganda in this regard, the United Kingdom scores highest at 90%, followed by the World Bank (the government sector’s largest donor) at 76%, and the African Development Bank and the Global Fund at 67%. Other donors such as Ireland, Denmark and the Netherlands also score well. The United Nations, Japan, United States, and the EU Institutions however score significantly lower. Donors pro-viding general budget support made extensive use of Uganda’s country systems. Reasons for circumventing country PFM systems include a perceived inadequacy and weak capacity of country systems among donors, frequent incidents of fraud, and non-conclusion of corruption cases. The government is seeking to gain the donors’ confidence by reforming the legal and regulatory framework while a PFM donor group has been established to strengthen reforms in line with government and donor preferences.
Indicator 5b follows a similar graduated target to indicator 5a which is set relative to indicator 2b on the quality of procurement systems. For partner countries with a procurement score of ‘A’, a two-thirds reduction in the proportion of aid for the public sector not using the country’s procurement systems and for partner countries with a procurement score of ‘B’ to reduce the gap by one-third.
The 2011 Survey reports that Uganda recorded a slight improvement in the use of country procurement systems from 37% in 2007 to 43% in 2010 – although this is an overall setback from 2005. No target has
Aid disbursed by
donors for government
sector
Public financial management ProcurementBudget
executionFinancial reporting
Auditing 2005 2007 2010 Proc. systems
2005 2007 2010
(USD m) (USD m) (USD m) (USD m) (for reference) (for reference) (%) (USD m) (for reference) (for reference) (%)a b c d avg(b,c,d)/a e e / a
African Dev. Bank 110 0 110 110 0% 48% 67% 10 0% 22% 9%Austria 9 9 9 9 60% 74% 100% 9 95% 74% 100%Belgium 18 14 14 17 56% 100% 82% 17 84% 100% 92%Denmark 41 38 38 38 40% 35% 94% 38 40% 35% 94%EU Institutions 107 31 31 31 40% 34% 29% 31 40% 3% 29%France 0 0 0 0 29% ‑‑ ‑‑ 0 100% ‑‑ ‑‑GAVI Alliance 10 0 0 0 33% ‑‑ 0% 0 0% ‑‑ 0%Germany 37 4 19 5 11% ‑‑ 25% 13 69% ‑‑ 36%Global Fund 57 57 0 57 0% ‑‑ 67% 0 0% ‑‑ 0%Ireland 26 25 25 25 97% 90% 97% 25 97% 88% 98%Italy ‑‑ ‑‑ ‑‑ ‑‑ 68% ‑‑ ‑‑ ‑‑ 68% ‑‑ ‑‑Japan 50 18 18 18 0% ‑‑ 36% 18 0% ‑‑ 36%Korea 1 0 0 0 ‑‑ ‑‑ 0% 0 ‑‑ ‑‑ 0%Netherlands 32 25 32 32 95% 96% 93% 32 60% 96% 100%Norway 37 27 27 27 93% ‑‑ 73% 33 100% 72% 87%Sweden 27 15 15 15 47% 74% 56% 15 62% 54% 56%United Kingdom 109 97 97 98 82% 100% 90% 98 82% 100% 90%United Nations 42 12 12 12 11% 15% 28% 9 0% 9% 22%United States 6 0 5 0 ‑‑ ‑‑ 26% 0 ‑‑ ‑‑ 0%World Bank 332 329 101 329 86% 73% 76% 105 65% 34% 32%Total 1 051 701 555 824 60% 57% 66% 454 54% 37% 43%
tAblE 6: how much aid for the government sector uses country systems?
INDICATOR 5b use of country procurement systems

10 Aid EffEctivEnEss 2011: ProgrEss in imPlEmEnting thE PAris dEclArAtion – volumE ii country chAPtErs
ugAndA
been set for Uganda. The United Nations appears to have made considerable progress on its use of Uganda’s procurement systems having improved on its scores from 0% in 2006 to 9% in 2008 and then 22% in 2010.
Among other major donors to Uganda, the United Kingdom scores highest at 90%, followed by the EU Institutions. Other donors such as Denmark also score well. Japan and the World Bank score approximately 30%, while the African Development Bank and Global Fund score significantly lower. The primary issues constraining the use of government procurement systems are perceived weaknesses in the legal and regulatory framework governing public sector procurement, the slow progress in reforming procurement practices and the lack of transparency associated with procurement systems. The Ugandan government seeks to reform the legal and regulatory framework through amending the Public Procurement and Disposal Act.
When providing development assistance, some donors establish dedicated project management units or implementation units (PIUs) - to support development projects or programmes. A PIU is said to be “paral-lel” when it is created by the donor and operates outside existing country institutional and administrative structures. In the short term, parallel PIUs can play a useful role in establishing good practice and promot-ing effective project management. However, in the long run, parallel PIUs often tend to undermine national capacity development efforts, distort salaries and weaken accountability for development.
To make aid more effective, the Paris Declaration encourages donors to “avoid, to the maximum extent pos-sible, creating dedicated structures for day-to-day management and implementation of aid-financed projects and programmes.” Indicator 6 counts the number of parallel PIUs being used in partner countries. The target is to reduce by two-thirds the number of parallel PIUs in each partner country between 2005 and 2010.
The number of parallel PIUs has significantly decreased from previous surveys to 15 in 2010, meeting the target. The government recognises the short-term role of PIUs in promoting good project management and effective implementation. However, over the long-term there are concerns that PIUs undermine rather than strengthen local capacity and can weaken accountability between government and citizens. Reasons given by donors for using parallel PIUs include perceptions that government institutions lack the capacity to adequately implement and execute projects efficiently, and the specification of particular accounting and
INDICATOR 6 Avoiding parallel implementation structures (Pius)
Parallel PIUs2005
(for reference)2007
(for reference)2010
(units)African Dev. Bank 14 14 0Austria 3 1 0Belgium 2 4 2Denmark 4 2 2EU Institutions 10 13 4France 2 ‑‑ 0GAVI Alliance 0 ‑‑ 0Germany 0 0 0Global Fund 1 0 0Ireland 2 0 0Italy 1 4 ‑‑Japan 0 0 0Korea ‑‑ ‑‑ 0Netherlands 0 0 0Norway ‑‑ 0 1Sweden 1 0 1United Kingdom 1 0 0United Nations 5 9 5United States 0 0 0World Bank 8 8 0Total 54 55 15
tAblE 7: how many Pius are parallel to country structures?
11Aid EffEctivEnEss 2011: ProgrEss in imPlEmEnting thE PAris dEclArAtion – volumE ii country chAPtErs
ugAndA
reporting requirements among donors which require specialised staff. The government is taking a number of steps to avoid the creation of new PIUs, requiring explicit government approval and clear evidence of excep-tional circumstances for their use. The government also seeks to encourage and collaborate with staff from PIUs to work closely in order to ensure knowledge transfer and eventual integration of PIUs.
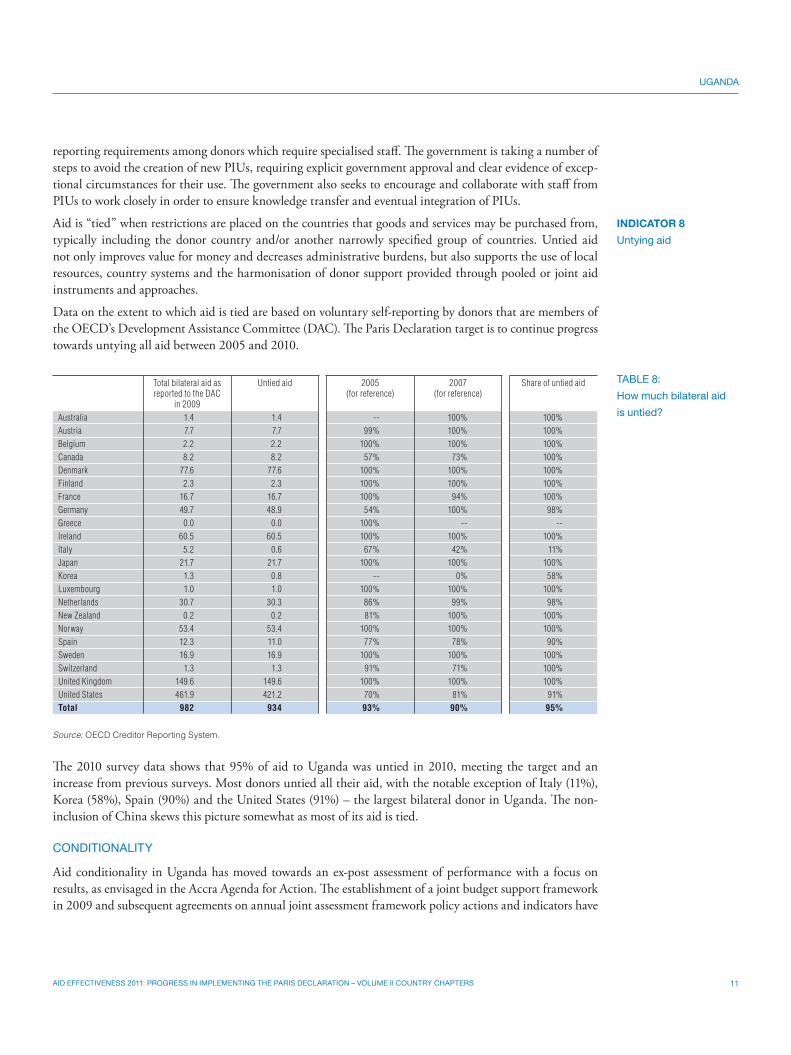
Aid is “tied” when restrictions are placed on the countries that goods and services may be purchased from, typically including the donor country and/or another narrowly specified group of countries. Untied aid not only improves value for money and decreases administrative burdens, but also supports the use of local resources, country systems and the harmonisation of donor support provided through pooled or joint aid instruments and approaches.
Data on the extent to which aid is tied are based on voluntary self-reporting by donors that are members of the OECD’s Development Assistance Committee (DAC). The Paris Declaration target is to continue progress towards untying all aid between 2005 and 2010.
The 2010 survey data shows that 95% of aid to Uganda was untied in 2010, meeting the target and an increase from previous surveys. Most donors untied all their aid, with the notable exception of Italy (11%), Korea (58%), Spain (90%) and the United States (91%) – the largest bilateral donor in Uganda. The non-inclusion of China skews this picture somewhat as most of its aid is tied.
conditionAlity
Aid conditionality in Uganda has moved towards an ex-post assessment of performance with a focus on results, as envisaged in the Accra Agenda for Action. The establishment of a joint budget support framework in 2009 and subsequent agreements on annual joint assessment framework policy actions and indicators have
INDICATOR 8 untying aid
Total bilateral aid as reported to the DAC
in 2009
Untied aid 2005 (for reference)
2007 (for reference)
Share of untied aid
Australia 1.4 1.4 ‑‑ 100% 100%Austria 7.7 7.7 99% 100% 100%Belgium 2.2 2.2 100% 100% 100%Canada 8.2 8.2 57% 73% 100%Denmark 77.6 77.6 100% 100% 100%Finland 2.3 2.3 100% 100% 100%France 16.7 16.7 100% 94% 100%Germany 49.7 48.9 54% 100% 98%Greece 0.0 0.0 100% ‑‑ ‑‑Ireland 60.5 60.5 100% 100% 100%Italy 5.2 0.6 67% 42% 11%Japan 21.7 21.7 100% 100% 100%Korea 1.3 0.8 ‑‑ 0% 58%Luxembourg 1.0 1.0 100% 100% 100%Netherlands 30.7 30.3 86% 99% 98%New Zealand 0.2 0.2 81% 100% 100%Norway 53.4 53.4 100% 100% 100%Spain 12.3 11.0 77% 78% 90%Sweden 16.9 16.9 100% 100% 100%Switzerland 1.3 1.3 91% 71% 100%United Kingdom 149.6 149.6 100% 100% 100%United States 461.9 421.2 70% 81% 91%Total 982 934 93% 90% 95%
Source: OECD Creditor Reporting System.
tAblE 8: how much bilateral aid is untied?

12 Aid EffEctivEnEss 2011: ProgrEss in imPlEmEnting thE PAris dEclArAtion – volumE ii country chAPtErs
ugAndA
provided a basis for dialogue and assessment of aid. The Partnership Policy and the National Development Plan have called upon donors to simplify or abolish procedural conditionalities where possible. Although the government attempts to publicise conditions linked to disbursement through reports to Parliament, compre-hensiveness of the reporting remains a challenge due to deficiency of information capture systems. A particu-lar challenge also relates to the fact that some forms of aid are increasingly tied de facto to the provision of technical assistance. This can significantly reduce ownership of programmes/projects and also lead to “supply-driven” technical assistance not based on government priorities. n
hArmonisAtionPoor co-ordinAtion of Aid increases the cost to both donors and partner countries and significantly reduces the real value of aid. Harmonisation of aid delivery procedures and the adoption of common arrangements help reduce duplication of effort and lower the transaction costs associated with aid management. The Paris Declaration focuses on two dimensions of aid as a proxy for assessing overall harmonisation: the use of common arrangements within programme-based approaches (PBAs) and the extent to which donors and partner countries conduct joint missions and co-ordinate analytic work.
Aid effectiveness is enhanced when donors use common arrangements to manage and deliver aid in support of partner country priorities. A good mechanism for aid co-ordination can be described as one that has shared objectives and integrates the various interests of stakeholders. Indicator 9 assesses the degree to which donors work together – and with partner governments and organisations - by measuring the proportion of total ODA disbursed within programme-based-approaches (PBAs). In practice, there are many different approaches and modalities which can use PBAs and harmonisation takes place at various levels.
At one level, the partner country is responsible for defining clear, country-owned programmes (e.g. a sector programme or strategy) and establishing a single budgetary framework that captures all resources (both domestic and external). At another level, donors are responsible for taking steps to use local systems for
INDICATOR 9 using common arrangements
Programme‑based approaches Total aid disbursed
2005 2007 2010Budget support Other PBAs Total
(USD m) (USD m) (USD m) (USD m) (for reference) (for reference) (%)a b c = a + b d e = c / d
African Dev. Bank 0 0 0 140 0% 22% 0%Austria 4 6 9 10 35% 63% 88%Belgium 12 2 14 25 74% 78% 57%Denmark 36 5 41 68 93% 96% 59%EU Institutions 31 0 31 119 46% 54% 26%France 0 0 0 0 0% ‑‑ ‑‑GAVI Alliance 0 0 0 10 10% ‑‑ 0%Germany 4 27 31 41 11% ‑‑ 76%Global Fund 0 57 57 57 100% 100% 100%Ireland 22 2 24 44 85% 97% 55%Italy ‑‑ ‑‑ ‑‑ ‑‑ 0% 85% ‑‑Japan 0 18 18 52 51% 52% 35%Korea 0 0 0 1 ‑‑ ‑‑ 0%Netherlands 32 2 34 34 100% 81% 100%Norway 17 9 26 61 33% 35% 43%Sweden 20 7 27 37 49% 71% 74%United Kingdom 92 15 107 130 73% 76% 82%United Nations 1 26 27 76 53% 47% 36%United States 1 12 13 267 0% ‑‑ 5%World Bank 101 171 272 332 60% 62% 82%Total 372 359 732 1 504 50% 66% 49%
tAblE 9: how much aid is programme-based?
13Aid EffEctivEnEss 2011: ProgrEss in imPlEmEnting thE PAris dEclArAtion – volumE ii country chAPtErs
ugAndA
programme design and implementation, financial management, monitoring and evaluation. Finally, partner countries and donors are jointly responsible for donor co-ordination and harmonisation of donor procedures. The 2010 target is that two-thirds of aid flows are provided in the context of PBAs.
In 2010, the proportion of aid utilising programme-based approaches declined from 2007, leaving the target unmet. Of major donors to Uganda in this regard, the United Kingdom and World Bank scored highest at 82%, while the EU institutions, the United States and the African Development Bank scored significantly lower at 26%, 5% and 0% respectively.
There are several remaining challenges in channelling a greater proportion of aid in support of PBAs in Uganda. In particular, the share of general budget support in total ODA absolute terms is projected to decline over the medium term, having peaked around 2008. A significant proportion of aid is currently channelled ‘off-budget’ (not included in the government’s medium-term expenditure framework) and ‘off-plan’ (directly to NGOs and not linked to government priorities). Other challenges include: continuing governance con-cerns by donors; weak impact & slow implementation of public service reforms; concerns by donors over the level of resources channelled to front line service delivery; weak or non-existent sector strategies; and difficul-ties in meeting government obligations under the joint budget support framework (JBSF) - the framework that all budget support donors to Uganda are required to join.
Efforts to promote the use of programme-based approaches include the Government of Uganda’s stated prefer-ence for general budget support, meeting obligations under the joint budget support framework, and encour-aging donors to align projects with national and sector strategies. Other approaches include the establishment of sector working groups, which provide a forum to align donor projects with government and sector priorities.
A common complaint of partner countries is that donors make too many demands on their limited resources: country authorities spend too much time meeting with donor officials and responding to their many requests. The Paris Declaration recognises that donors have a responsibility to ensure that, to the greatest extent pos-sible, the missions and analytical work they commission are undertaken jointly – i.e. that the burden of such work is shared. The 2010 target is that 40% of donor missions to the field are conducted jointly.
In 2010, only 24% of donor missions were conducted jointly, a marginal improvement from previous years and far short of the 40% target. The Government of Uganda anticipates that introducing a closed-season for donor missions during key budget preparation months will lead to further progress on the indicator on joint missions. Some donors to Uganda have called for a revision of the methodology for this indicator as its con-sideration of only overseas missions involving international travel does not capture co-ordinated ‘in-country missions’, such as those conducted through the Joint Budget Support Framework.
Country analytic work is the analysis and advice necessary to strengthen policy dialogue, and to develop and implement country strategies. It includes country or sector studies and strategies, country evaluations and discussion papers. The Paris Declaration foresees that donors should conduct analytic work jointly where pos-sible as it helps curb transaction costs for partner authorities, avoids unnecessary duplicative work and helps to foster common understanding. Indicator 10b measures the proportion of country analytic work that is undertaken jointly. The 2010 target is that 66% of country analytic work is carried out jointly.
Uganda reports steady progress on joint country analytic work over previous surveys, moving from 40% in 2005 to 56% in 2010. This suggests that the 2010 target of 66% is close to being achieved. Of major donors to Uganda in this regard, the United Nations (with 44 analytic works out of 77 in total) and the African Development Bank conducted almost all analytic work jointly, followed by Denmark and Norway at approxi-mately 70%. The United States, Austria and Global Fund scored significantly lower. The implementation of the joint budget support framework which encourages donors to align projects with national and sector strat-egies make use of local technical capacity is a possible factor for this progress.
INDICATOR 10a Joint missions
INDICATOR 10b Joint country analytic work

14 Aid EffEctivEnEss 2011: ProgrEss in imPlEmEnting thE PAris dEclArAtion – volumE ii country chAPtErs
ugAndA
Co‑ordinated donor missions *
Total donor missions 2005 * 2007 * 2010 *
(missions) (missions) (for reference) (for reference) (%)a b c = a / b
African Dev. Bank 4 38 6% 13% 11%Austria 0 3 33% ‑‑ 0%Belgium 2 8 0% 20% 25%Denmark 4 6 67% 17% 67%EU Institutions 12 26 0% 0% 46%France 4 6 0% ‑‑ 67%GAVI Alliance 1 1 ‑‑ ‑‑ 100%Germany 2 8 100% 92% 25%Global Fund 1 3 0% 0% 33%Ireland 1 3 ‑‑ ‑‑ 33%Italy ‑‑ ‑‑ 0% 29% ‑‑Japan 0 10 0% 9% 0%Korea 0 2 ‑‑ ‑‑ 0%Netherlands 1 1 30% 17% 100%Norway 3 6 69% 22% 50%Sweden 1 1 60% 50% 100%United Kingdom 11 17 52% 92% 65%United Nations 22 47 42% 21% 47%United States 1 9 0% ‑‑ 11%World Bank 15 40 21% 37% 38%Total 55 235 17% 21% 24%
* The total of coordinated missions has been adjusted to avoid double counting.A discount factor of 35% is applied.
tAblE 10: how many donor missions are co-ordinated?
tAblE 11: how much country analytic work is co-ordinated?
Co‑ordinated donor analytic work *
Total donor analytic work
2005 * 2007 * 2010 *
(units) (units) (for reference) (for reference) (%)a b c = a / b
African Dev. Bank 4 4 100% 100% 100%Austria 1 3 33% 60% 33%Belgium 1 1 ‑‑ ‑‑ 100%Denmark 6 9 100% 100% 67%EU Institutions 1 2 100% 100% 50%France 0 0 0% ‑‑ ‑‑GAVI Alliance 0 0 ‑‑ ‑‑ ‑‑Germany 0 0 100% 100% ‑‑Global Fund 1 3 100% 0% 33%Ireland 0 0 67% 100% ‑‑Italy ‑‑ ‑‑ 0% 50% ‑‑Japan 0 1 ‑‑ ‑‑ 0%Korea 0 0 ‑‑ ‑‑ ‑‑Netherlands 0 0 100% 75% ‑‑Norway 3 4 86% 80% 75%Sweden 1 1 60% 100% 100%United Kingdom 2 4 73% 63% 50%United Nations 36 39 33% 73% 92%United States 1 4 17% 12% 25%World Bank 0 1 30% 57% 0%Total 43 76 40% 54% 56%
* The total of coordinated missions has been adjusted to avoid double counting.A discount factor of 25% is applied.

15Aid EffEctivEnEss 2011: ProgrEss in imPlEmEnting thE PAris dEclArAtion – volumE ii country chAPtErs
ugAndA
Aid frAgmEntAtion
Fragmented aid – aid that comes in many small slices from a large number of donors – creates high trans-action costs and makes it difficult for partner countries effectively to manage their own development. Aid fragmentation also increases the risk of duplication and inefficient aid allocation among donors. According to a pilot analysis on aid fragmentation carried out by the OECD and GIZ between 2005 and 2009, aid fragmentation within sectors decreased on the whole, although fragmentation increased in four out of twelve sectors (education, health, water and sanitation and other social infrastructure).
Reducing donor fragmentation has been identified as a priority by both Government of Uganda and donors alike to reduce transaction costs. In this context the Government of Uganda initiated a division of labour exercise in 2006 with the aim of ensuring a more balanced distribution of donors across different sectors. By 2010 results of the division of labour exercise were reported to have been mixed (OECD, 2011b). One of the major challenges facing improvement of complimentarity and division of labour seems to relate to the hesita-tion of donors to delegate their aid to a donor with a more important presence in-country, and assume a less active role as a silent partner, which they might perceive as reducing their influence and involvement in the relevant sectors. n
mAnAging for rEsultsboth donors And PArtnEr countriEs should manage resources according to well-defined, desired results, measuring progress toward them and using information on results to improve decision making and perfor-mance. Achieving this implies strengthening capacity to undertake such management and emphasising a focus on results. Countries are expected to develop cost-effective and results-oriented reporting and performance assessment frameworks, while donors commit to use them and refrain from requiring separate reporting.
Indicator 11 assesses the quality of a country’s results-oriented frameworks. In particular, it considers the quality of the information generated, stakeholder access to information, and the extent to which the informa-tion is utilised within a country level monitoring and evaluation system. The government provides evidence against these criteria through the survey, and this is translated by the World Bank into a score running from A (highest score) to E (lowest score).
The Paris Declaration 2010 global target is to reduce the proportion of countries without transparent and monitorable performance assessment frameworks by one-third.
The Paris Declaration 2010 global target is to reduce the proportion of countries without transparent and monitorable performance assessment frameworks by one-third. Uganda has experienced a setback since 2005/07, dropping to a C rating in 2010 – below the target of B or A. Uganda has a national monitoring and evaluation (M&E) framework designed to assess and track implementation of its national development strat-egy (NDS). This M&E framework has clearly established responsibilities and co-ordination, and the data used to support it has comprehensive sectoral and geographic coverage. The main data sources have moder-ate frequencies of collection. However, it is unclear how quality and reliability are ensured, whether progress against the NDS is reported in a unified way, or whether there is comprehensive data coverage for the targets in the NDS. Stakeholder access to information is adequate but there remain serious barriers to improving access to vital information on public expenditure data and the NDS. Although the M&E system is designed to track input, output, and outcome indicators, it is unclear how it tracks these indicators. Furthermore, there is no evidence that policy makers or line ministries use the M&E reports. n
INDICATOR 11 do countries have results-oriented monitoring frameworks?

16 Aid EffEctivEnEss 2011: ProgrEss in imPlEmEnting thE PAris dEclArAtion – volumE ii country chAPtErs
ugAndA
mutuAl AccountAbilityStrong and balanced mechanisms that support accountability are required at all levels for aid to be most effec-tive. Donors and partner country governments should be accountable to their respective publics and to each other for implementing their commitments on aid, its effectiveness, and the results to which it contributes.Indicator 12 examines whether there is a country-level mechanism for mutual assessment of progress on partner-ship commitments, including on aid effectiveness. There are three criteria that must all be met: the existence of an aid policy or strategy agreed between the partner country government and donors; specific country-level aid effectiveness targets for both the partner country government and donors; an assessment towards these targets undertaken by both partner and donors in the last two years, and discussed in a forum for broad-based dialogue.The 2010 target is for all partner countries to have mutual assessment reviews meeting these criteria in place.In 2011, the survey identified that Uganda had a mutual accountability mechanism in place, meeting the 2010 target and showing an improvement from previous surveys. Existing country mechanisms permit joint assess-ment of progress in implementing some of the agreed Paris commitments on aid effectiveness. The NDS cur-rently outlines several priority areas and strategies to improve the effectiveness of development assistance. These include ensuring that all development assistance is aligned with the objectives and priorities of the National Development Plan; the reduction of transaction costs; establishment of structures to strengthen dialogue with donors and other stakeholders; improving the predictability of and information on aid flows; and formulating and institutionalising measures and mechanisms for assessing mutual accountability. Additionally, one of the aims of the joint budget support framework (JBSF) is to strengthen dialogue and foster mutual accountability. As such, the joint assessment framework (JAF) used by budget support donors under the JBSF, contains a brief section on mutual accountability with indicators to assess donor performance on an annual basis. However, it should be noted that the final indicators are to be determined following the conclusion of the new partnership policy. Upon approval in 2011, the new partnership policy will update the current framework setting out the future principles through which government will manage its relationship with donors. n
notEs1. Payroll management refers to the integrated pay and personnel system.2. This Act has since been amended.
The quantitative information presented in this chapter is taken from data provided by national co-ordinators up to 31 July 2011, following the data validation process with stakeholders at the country level. It was not possible to modify or correct any data received after this date.
This document and any map included herein are without prejudice to the status of or sovereignty over any terri-tory, to the delimitation of international frontiers and boundaries and to the name of any territory, city or area.
rEfErEncEsOECD (2011a), DAC Statistics, http://stats.oecd.org/Index.aspx.
OECD (2011b), Country aid fragmentation tables. Pilot analysis of aid fragmentation at the partner country level drawing on evidence sourced from the OECD-DAC Creditor Reporting System. WP-EFF Task Team on Division of Labour and Complementarity, OECD, Paris.
OECD (forthcoming), OECD Report on Division of Labour: Addressing Cross-country Fragmentation of Aid, www.oecd.org/document/46/0,3746,en_2649_33721_46022446_1_1_1_1,00.html.
World Development Indicators, The World Bank Group, 2011. Available at http://data.worldbank.org/indicator, accessed 23 May 2011.
INDICATOR 12 mutual accountability