001 chapter 17
DESCRIPTION
dutt chapter 17TRANSCRIPT

We propose to study in this chapter the development plans of India and thereby understand whether economic development under planning is taking place at an adequate pace and in the right direction. In this chapter, we shall give a broad overview of the first nine five year plans.
PLANNING
EXPERIENCE IN
I NDIA
Itir 1. FIRST NINE FIVE YEAR PLANS (1950-51 TO 2001-02)
Since 1951, India has completed nine five-year plans. The guiding principles of India's Five-Year Plans are provided by the basic objectives of growth, employ-ment, self-reliance and social justice. Apart from these basic objectives, each five-year plan takes into account the new constraints and possibilities faced during the period and attempts to make the necessary directional changes and emphasis.
Approach to each Plan
At the time of the First Five Year Plan (1951-56) India was faced with three problems--influx of refugees, severe food shortage and mounting inflation. India had also to correct the disequilibrium in the economy caused by the Second World War and the Partition of the country. Accordingly, the First Plan emphasised, as its immediate objectives the rehabilitation of refugees, rapid agricultural development so as to achieve food self-sufficiency in the shortest possible time and control of inflation. Simultane-ously, the First Plan attempted a process of all-round bal-anced development which could ensure a rising national income and a steady improvement in the living standards of the people over a period of time.
The Second Plan (1956-61) was conceived in an atmosphere of economic stability. Agricultural targets fixed in the First Plan had been achieved. Price level had regis-tered a fall and, consequently, it was felt that the Indian economy had reached a stage where agriculture could be assigned a lower priority and a forward thrust made in the development of heavy and basic industries of the economy for a more rapid advance in future. The basic philosophy of the Second Plan was, therefore, to give a big push to the economy so that it enters the take-off stage.
Besides, the Government announced its Industrial Policy in 1956 accepting the establishment of a socialistic pattern of society as the goal of economic policy. This
"Planning is, not a once-for all exercise for a five-year period, it requires - a continual watch on current or incipient trends, systematic observation of technical, economic and social data and adjustments of programmes in the light of new requirements."
— Planning Commission
292

velopment economic
I adequate we shall
w plans.
AR 001-02)
five-year rear Plans t. employ-om these o account tring the lirectional
(1951-56) refugees.
India had ny caused
country. immediate gricultural cy in the iimultane-3und bal-g national standards
red in an gets fixed had regis-he Indian could be
I made in of the
The basic give a big
stage.
Industrial socialistic licy. This
293 PLANNING EXPERIENCE IN INDIA
necessitated the orientation of economic policy to con-form to the national goal of "socialist economy". Accordingly, the Second Plan aimed at rapid industrialisation with particular emphasis on the de-velopment of basic and heavy industries, such as iron and steel, heavy chemicals, including nitrogenous fertilisers, heavy engineering and machine building industry.
By the beginning of the Third Plan (1961-66) the Indian planners felt that the Indian economy had en-tered the "Take off stage" and that the first two plans had generated an institutional structure needed for rapid economic development. Consequently, the Third Plan set as its goal the establishment of a self-reliant and self-generating economy. But the working of the Sec-ond Plan had also shown that the rate of growth of agricultural production was the main limiting factor in India's economic development. The experience of the first two plans suggested that agriculture should be assigned top priority. The Third Plan accordingly gave top priority to agriculture but it also laid adequate em-phasis on the development of basic industries, which were vitally necessary for rapid economic development of the country. However, because of India's conflicts with China in 1962 and with Pakistan in 1965, the approach of the Third Plan was later shifted from development to defence and development.
The original draft outline of the Fourth Plan prepared in 1966 under the stewardship of Ashok Mehta had to be abandoned on account of the pressure exerted on the economy by two years of drought, devaluation of the rupee and the inflationary recession. Instead, three Annual Plans (1966-69) eu-phemistically described as "Plan Holiday" were imple-mented. India learnt a bitter lesson during Indo-Paki-stan war when its so-called allies refused to supply essential equipment and raw materials for its eco-nomic development. The Fourth Plan (1969-74) set before itself the two principal objectives of "growth with stability" and "progressive achievement of self-reliance". The Fourth Plan aimed at 5.5 per cent aver-age rates of growth in the national income and the provision of national minimum for the weaker sections of the community--the latter came to be known as the objectives of 'growth with justice' and "Garibi Hatao" (Removal of poverty).
The Fifth Plan (1974-79) was introduced at the time when the country was reeling under a veritable economic crisis arising out of a run-away inflation, fuelled by the hike in oil prices since September 1973 and failure of the Government take-over of the whole-sale trade in wheat. But the Indian planners were con-cerned with the slogans of 'Garibi Hatao' (Removal of poverty) and the "growth with social justice". The original approach paper of the Fifth Plan prepared
under C. Subramaniam in 1972 emphasised that "the main causes of abject poverty were open unemploy-ment, under-employment and low resource base of a very large number of producers in agriculture and service sectors." The elimination of poverty could not be attained simply by acceleration in the rate of growth of the economy alone but the strategy should be to launch a direct attack on the problems of unemploy-ment, under-employment and massive low-end pov-erty. But this approach was eventually abandoned and the final draft of the Fifth Plan prepared and launched by D.P. Dhar proposed to achieve the two main objec-tives, viz., removal of poverty and attainment of self-reliance, through promotion of higher rate of growth, better distribution of income and a very significant step-up in the domestic rate of saving. The Fifth Plan, however, was terminated by the Janata Party at the end of the fourth year of the Plan in March 1978.
There were two Sixth Plans. The Janata Party Sixth Plan (1978-83) openly praised the achievements of economy in terms of self-reliance and. modernisation but held the Nehru model of growth responsible for growing unemployment, for the concentration of eco-nomic power in the hands of a few powerful business and industrial families, for the widening of inequali-ties of income and wealth and for mounting poverty. The Janata Sixth Plan sought to reconcile the objec-tives of higher production with those of greater employment so that millions of people living below the poverty line could benefit therefrom. The focus of the Janata Sixth Plan was enlargement of the employ-ment potential in agriculture and allied activities, en-couragement to household and small industries pro-ducing consumer goods for mass consumption and to raise the incomes of the lowest income classes through a minimum needs programme. After the defeat of the Janata Party, the Congress came to power in 1980 and decided to have a new Sixth Plan. When the new Sixth Plan (1980-85) was introduced by the Congress, the Planners rejected the Janata approach and brought back Nehru Model of growth by aiming at a direct attack on the problem of poverty by creating condi-tions of an expanding economy.
The Seventh Five Year Plan (1985-90) was introduced in April 1985, after the country had enjoyed a reasonable rate of economic growth of the order of 5.4 per cent during the Sixth Plan. The Seventh Plan sought to emphasise policies and programmes which would accelerate the growth in foodgrains production, increase employment opportunities and raise produc-tivity—all these three immediate objectives were regarded central to the achievement of long-term goals determined as far back as the First Plan itself.
The approach to the Eighth Five Year Plan (1990-95) was approved in September 1989 and the Eighth Plan

amid MEI Mid corn um mem The mow tbe diiiional tow To immt mega fir_ there in Awake d go MSC I
iced
The pubbc
The Goven odic sec
a C
*maw sec
Tali pi& sea 51,6 is dr Itearaher, pair secs fr. imam diman■■cs awl is ma et prnier
294
was to be introduced in April 1990. However, there were a series of changes in Governments at the Centre, neces-sitating constant reconstitution of the Planning Commis-sion and preparation of a series of versions of the "approach" to the Eighth Plan. Finally, the fourth version of the Eighth Plan (1992-97) was approved at a time the country was going through a severe economic crisis caused by a balance of payments crisis, a rising debt burden, ever-widening budget deficits, mounting infla-tion and recession in industry. The Narasimha Rao Government initiated the process of fiscal reforms as also of economic reforms with a view to provide a new dynamism to the economy. The Eighth Plan (1992-97) reflected these changes in its attempt to accelerate eco-nomic growth and improve the quality of life of the common man.
The Ninth. Plan prepared under the United Front Government was released in March 1998. The same was modified and approved by the National Development Council in February 1999, nearly two years after its implementation from April 1, 1997. The focus of the Ninth Plan was on "Growth with Social Justice and Equality". It assigned priority to agriculture and rural development with a view to generating adequate produc-tive employment and eradication of poverty. It aimed at achieving GDP growth of 7 per cent per annum, since during the eighth plan, already a GDP growth rate of 6.5 per cent had been achieved. Besides, it ensured food and nutritional security for all, particularly for the weaker
PLANNING EXPERIENCE IN INDIA
sections of the society. However, the Plan failed to achieve the GDP growth target of 7 per cent and realized only 5.35 per cent average GDP growth.
It is, thus, clear that the short-term objectives of each plan--also called as the Approach to each Plan--reflect the current state of the economy and the economic thinking of the Party in power and of the planners in the Planning Commission.
Plan Outlays/Investments
For each Plan, the Planning Commission fixed an overall total outlay for economic growth, part of which was to be contributed by the private sector and the remainder by the public sector. Initially, the Plan-ning Commission started with modest outlays but, with experience, the planned outlays on development programmes were raised substantially. Table 1 gives the proposed plan outlays, the share of private and public sector outlays and the actual public sector outlays in the different plans.
The total outlay in the First Plan was quite modest - Z 3,870 crores and it was more than doubled during the Second Plan - Z 7,900 crores reflecting the tremendous sense of confidence which the planners acquired after the success of the first Plan. But because of resource constraints and specially due to severe foreign exchange shortage, the Third Plan outlay was only about 50 per cent more than that of the Second
TABLE 1: Plan Outlays in the Public and Private Sector crores)
Total proposed Plan Outlay
1=(21-3)
Total private sector outlay
(2)
Total proposed public sector outlay
(3)
Actual public sector outlay
(4)
First Plan (1951-56) 3,870 1,800 2,070 1,960 (100.0) (46.5) (53.5)
Second Plan (1956-61) 7.900 3,100 4,800 4,600 (100.0) (39.2) (60.8)
Third Plan (1961-66) 11,600 4,100 7,500 8,500 (100.0) (35.3) (64.7)
Fourth Plan (1969-74) 24,880 8,980 15,900 15,900 (100.0) (36.1) (63.9)
Fifth Plan (1974-79) 53,410 s16,160 37,250 39,430 (100.0) (30.3) (69.7)
Sixth Plan (1980-85) 1,58,710 61,210 97,500 1,09,290 (100.0) (38.6) (61.4)
Seventh Plan (1985-90) 3,48,150 1,68,150 1,80,000 2,18,730 (100.0) (48.3) (51.7)
Eighth Plan (1992-97) 8,71,000 4,37,000 4,34,100 4,85,460 (100.0) (50.2) (49.8)
Ninth Plan (1997-2002) 23,03,200 14,44,000 8,59,200 7,05,820 (100.00) (62.7) (37.3)
Note : Figure in brackets are percentages of total outlay. SOURCE : 1. Plan Documents of Five Year Plans. 2. Economic Survey, 2005-06.

E IN INDIA
in failed to and realized
objectives ch to each !my and the and of the
PLANNING EXPERIENCE IN INDIA
Plan. From the Third Plan onwards, however, the increase in the total outlay was over 100 per cent compared to the previous plan and the Sixth Plan outlay in money terms was indeed more than 200 per cent of the outlay of the Fifth Plan. This was true for the Seventh and the Eighth Plans.The Plan outlays are obviously expressed in money terms at different price levels and, therefore, they reflect partly the inflation-ary rise in prices and partly the increased effort in enhancing development programmes. Even if we de-flate the monetary investment to allow for rise in prices, the real outlay during the last three plans was really huge.
The Ninth Plan proposed a total public sector outlay of the order of Z 8,59,200 crores at 1996-97 prices for the plan period, but actually, it could realize only Z 7,05,200 crores, i.e., 82 per cent of the proposed outlay at 1996-97 prices. In this sense, there was a big shortfall in the proposed and actual outlay of the Ninth Plan. Out of the proposed total public sector outlay of ' 8,59,200 crores, the share of investment was of the order of Z 7,26,000 crores.
This huge increase in total outlay (or invest-ment) with every five year plan was the result of the confidence of the Planning Commission that the coun-try could absorb increasingly larger doses of invest-ment and that the tempo of economic growth in the country warranted such a huge escalation of invest-ment. The Government has also been successful in raising the rate of domestic savings and mobilise ad-ditional resources from foreign countries and institu-tions. To supplement these two sources, the Govern-ment regularly resorted to deficit financing. Occasion-ally, there have been serious constraints of resources as during the Second Plan when the Government could not raise the planned resources and was, therefore, forced to "prune" the plan.
The total outlay planned in a plan is divided into public sector outlay and private sector outlay. The Government is directly responsible for raising the public sector outlay. As regards the private sector outlay, it is only an estimate, an anticipation and the Planning Commission does not have accurate figures to show whether the planned outlay fixed for the private sector materialised or not.
Table I clearly points out that the share of the public sector outlay showed a steady increase from about 54% in the First Plan to about 70% in the Fifth Plan. Thereafter, there was a steady decline and the share of the public sector was about 52 per cent in Seventh Plan and fell further to reach 50 per cent in the Eighth Plan. The dominance of the public sector was gradually declining and this was being replaced by the growing emphasis on the private sector (Refer table 1).
295
The really significant figure in Table 1 is the actual public sector outlay, given is the last column. This is different from the planned public sector outlay at the beginning of each plan. It would be clear from Table I that only during the first two plans, the actual public sector outlay was less than the planned public sector outlay. In the successive plans, the actual outlay ex-ceeded the planned outlay— we ignore the Fifth Plan as it was terminated before its full term.
The real magnitude of actual public sector outlay can be briefly summarised as follows
Total outlay Outlay Per annum ( T crores) (f crores)
First Plan (1951-56) 1,960 392
Fourth Plan (1969-74) 15,900 3,180
Eighth Plan (1992-97) 4,85,460 97,092
Ninth Plan (1997-2002) 8,59,200 1,71,840 Tenth Plan (2002-07) 15,25,639 3,05,128 Eleventh Plan (2007-12) 36,44,718 7,28,943
Priorities and Pattern of Investment in the Plans
During the first six plans, the Planning Commis-sion distinguished between five sectors of develop-ment, viz. agriculture and irrigation, power, industry, transport and communication and social services. From the Seventh Plan onwards, there was greater refinement of the sectors of development. The distribution of public sector outlay on major heads clearly reflects the Commission's priorities of development in the differ-ent plans.
In Table 2 we observe that the Government outlay on each sector has continuously increased with every plan. For instance, the actual allocation on agriculture and irrigation was of the order of Z 600 crores in the First Plan, this had increased to Z 26,130 crores by the Sixth Plan and Z 2,01,442 crores by the Ninth Plan. Likewise, allocation on power, industries, transport and communications had increased considerably but the most significant increase was on industries--from Z 120 crores to over Z 60,362 crores between the First and the Ninth Plan. For a better understanding of the allocation pattern in the different plans, it would be better to study the figures in percentage terms.
Agriculture and Irrigation. This item "agriculture and irrigation" actually includes:
(a) agricultural and allied activities; (b) rural development; (c) special area programmes; and (d) irrigation and flood control.
Except during the First Plan, when agriculture and irrigation was allotted 31 per cent of the total outlay, all other Plans allocated between 20 to 24 per cent of the
fission fixed vth, part of sector and
y, the Plan-putlays but, welopment le I gives private and ',lie sector
was quite an doubled lecting the
planners Ut because to severe
outlay was re Second
(crores)
ic
y
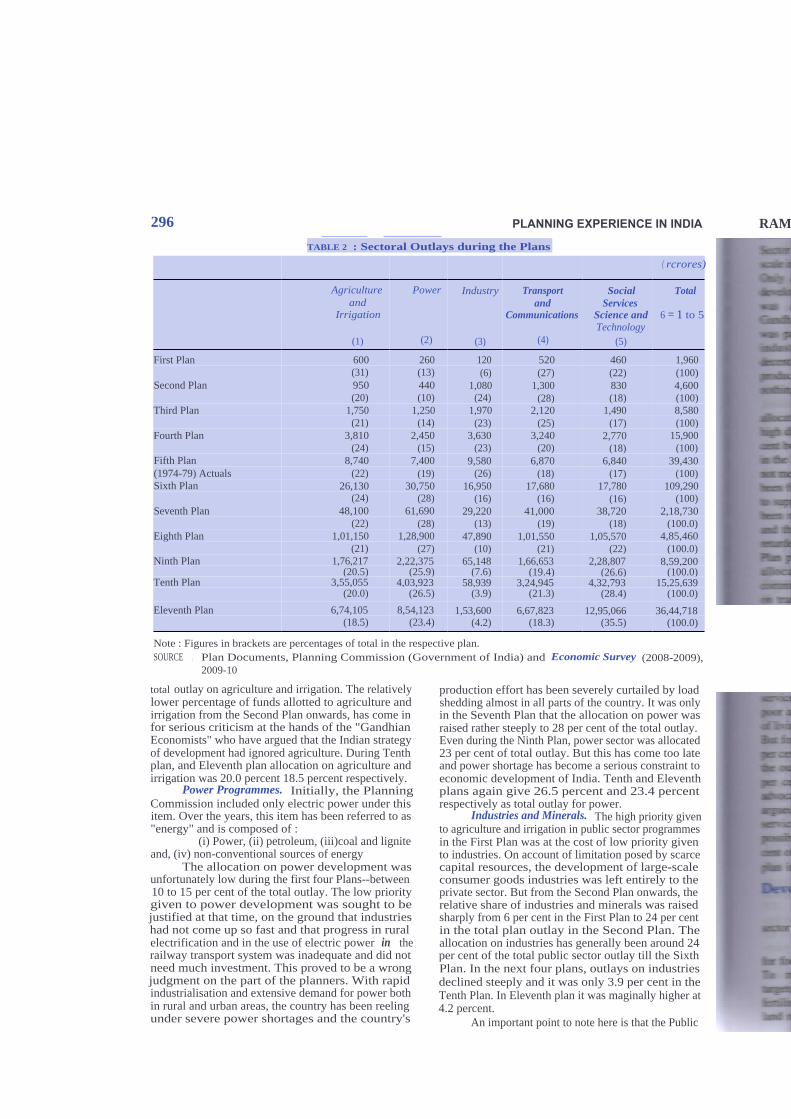
TABLE 2 : Sectoral Outlays during the Plans
( rcrores)
Agriculture and
Irrigation
(1)
Power
(2)
Industry
(3)
Transport and
Communications
(4)
Social Services
Science and Technology
(5)
Total
6 = 1 to 5
First Plan 600 260 120 520 460 1,960 (31) (13) (6) (27) (22) (100)
Second Plan 950 440 1,080 1,300 830 4,600 (20) (10) (24) (28) (18) (100)
Third Plan 1,750 1,250 1,970 2,120 1,490 8,580 (21) (14) (23) (25) (17) (100)
Fourth Plan 3,810 2,450 3,630 3,240 2,770 15,900 (24) (15) (23) (20) (18) (100)
Fifth Plan 8,740 7,400 9,580 6,870 6,840 39,430 (1974-79) Actuals (22) (19) (26) (18) (17) (100) Sixth Plan 26,130 30,750 16,950 17,680 17,780 109,290
(24) (28) (16) (16) (16) (100) Seventh Plan 48,100 61,690 29,220 41,000 38,720 2,18,730
(22) (28) (13) (19) (18) (100.0) Eighth Plan 1,01,150 1,28,900 47,890 1,01,550 1,05,570 4,85,460
(21) (27) (10) (21) (22) (100.0) Ninth Plan 1,76,217 2,22,375 65,148 1,66,653 2,28,807 8,59,200
(20.5) (25.9) (7.6) (19.4) (26.6) (100.0) Tenth Plan 3,55,055 4,03,923 58,939 3,24,945 4,32,793 15,25,639
(20.0) (26.5) (3.9) (21.3) (28.4) (100.0)
Eleventh Plan 6,74,105 8,54,123 1,53,600 6,67,823 12,95,066 36,44,718 (18.5) (23.4) (4.2) (18.3) (35.5) (100.0)
296 PLANNING EXPERIENCE IN INDIA RAM
Note : Figures in brackets are percentages of total in the respective plan. SOURCE : Plan Documents, Planning Commission (Government of India) and Economic Survey (2008-2009),
2009-10
total outlay on agriculture and irrigation. The relatively lower percentage of funds allotted to agriculture and irrigation from the Second Plan onwards, has come in for serious criticism at the hands of the "Gandhian Economists" who have argued that the Indian strategy of development had ignored agriculture. During Tenth plan, and Eleventh plan allocation on agriculture and irrigation was 20.0 percent 18.5 percent respectively.
Power Programmes. Initially, the Planning Commission included only electric power under this item. Over the years, this item has been referred to as "energy" and is composed of :
(i) Power, (ii) petroleum, (iii)coal and lignite and, (iv) non-conventional sources of energy
The allocation on power development was unfortunately low during the first four Plans--between 10 to 15 per cent of the total outlay. The low priority given to power development was sought to be justified at that time, on the ground that industries had not come up so fast and that progress in rural electrification and in the use of electric power in the railway transport system was inadequate and did not need much investment. This proved to be a wrong judgment on the part of the planners. With rapid industrialisation and extensive demand for power both in rural and urban areas, the country has been reeling under severe power shortages and the country's
production effort has been severely curtailed by load shedding almost in all parts of the country. It was only in the Seventh Plan that the allocation on power was raised rather steeply to 28 per cent of the total outlay. Even during the Ninth Plan, power sector was allocated 23 per cent of total outlay. But this has come too late and power shortage has become a serious constraint to economic development of India. Tenth and Eleventh plans again give 26.5 percent and 23.4 percent respectively as total outlay for power.
Industries and Minerals. The high priority given to agriculture and irrigation in public sector programmes in the First Plan was at the cost of low priority given to industries. On account of limitation posed by scarce capital resources, the development of large-scale consumer goods industries was left entirely to the private sector. But from the Second Plan onwards, the relative share of industries and minerals was raised sharply from 6 per cent in the First Plan to 24 per cent in the total plan outlay in the Second Plan. The allocation on industries has generally been around 24 per cent of the total public sector outlay till the Sixth Plan. In the next four plans, outlays on industries declined steeply and it was only 3.9 per cent in the Tenth Plan. In Eleventh plan it was maginally higher at 4.2 percent.
An important point to note here is that the Public

rerores)
ial Total ices r and 6= 1 to 5 ology
3 1,960 (100)
1 4,600 (100) 8,580 (100)
15,900 ) (100)
39,430 (100)
109,290 (100)
2,18,730 (100.0)
D 4,85,460 (100.0)
7 8,59,200 (100.0)
3 15,25,639 .1 (100.0)
6 36,44,718 (100.0)
Pvey (2008-2009).
curtailed by load entry. It was only
on power was the total outlay.
for was allocated as come too late ious constraint to 1th and Eleventh d 23.4 percent
igh priority given ctor programmes ow priority given posed by scarce
I of large-scale entirely to the
'Ian onwards, the ierals was raised an to 24 per cent cond Plan. The been around 24
day till the Sixth rs on industries per cent in the
tginally higher at
is that the Public
PLANNING EXPERIENCE IN INDIA 297 ENCE IN INDIA
Sector outlay on industries was mostly on the large-scale industries and that too on heavy and basic sectors. Only a small token allocation was made for the development of village and small-scale industries. This was also a standing complaint on the part of Gandhian Economists who criticsed that only lip service was paid to the importance of small and cottage Industries from the point of employment, decentralisation of income and favourable effect on production and the price level. In practice, however, mottling special was done for the tiny and small sector.
Transportation and Communication. The allocation on transport and communication was quite high during the first two plans, between 25 and 28 per can but since then their share has declined (16 per cent • the Sixth Plan). The lower allocation since then did mot mean that transport and communication sector had been fully developed and that it was adequate enough go support other sectors. In fact, the country had also been regularly facing serious transport bottlenecks and this was also one of the contributing factors for retarded output and income. Accordingly, the Ninth Plan pushed up the outlay to 25 per cent. Tenth Plan allocates 21.3 percent oulay for transport and communication. Eleventh Plan provided 18.3 percent cm transport and communication
Social and miscellaneous services. These items include such vital services as education, health and family planning, housing, urban development, labour welfare and welfare of backward classes etc., A considerable amount of plan funds has been allotted in Plans for the provision of these services. These services are significant from the point of view of the poor and the economically backward whose low level of living could be raised with the help of these services. Ihn for the First and the Third Plans which allocated 23 pa cent and 24 per cent respectively for social services, the outlay on social services ranged between 15 to 20 pa cent from the Second to the Eighth Plan. The advocates of human resource development have always argued that unless societies spend more on social services, rapid and sustained development is not possible. Consequently, Tenth Plan allocated 28.4 per cent of the total plan outlay to social services. Eleventh plan increased this allocation to 35.5 percent.
Development Targets in the Plans
Every Plan fixed clear targets of growth for each lector and sub-sector of the economy.
Targets for increase in production were fixed lir foodgrains, oilseeds, sugarcane, cotton and jute. To realise these production targets, each Plan fixed targets of increase of various inputs such as irrigation, fertilisers, use of better and hybrid seeds, pesticides, bad reclamation, provision of finance, etc.
In the field of industries targets were fixed for increase in production in such traditional industries as cotton, jute, sugar, cement, iron and steel etc. Besides, new industries were planned to be set up and ex-panded. The Second Plan, for instance, saw the setting up of the three steel plants at Durgapur, Bhilai and Rourkela, the expansion of the Chittaranjan Locomo-tive Works, the Avadi Integral Coach Factory, etc.
In the field of power, specific targets were fixed for generation and distribution of electricity from all sources. Initially, plan allocation for power was low, between 10 to 15 per cent, but it was increased to match the growth rate in industrialisation, transport and other sectors of the economy. From the Sixth Plan onwards, the Planning Commission enlarged the power sector and renamed it as energy sector and specific targets were fixed in each Plan for the growth and progress of electricity, oil, crude, petroleum and petro-leum products, coal, non-conventional energy, and so on.
Likewise, growth targets were fixed in each five-year Plan under transport system which included targets of growth for railways, roads, ports, shipping, civil aviation, and so on. Growth of communications in general and telecommunications in particular, received considerable attention from the planners. With the growth of non-Plan expenditure in the last two decades and the consequent constraint of resources for development, the Planning Commission was forced to invite the private sector to enter the infrastructure sector in a big way —specially in power, road transport, civil aviation, and telecommunications — and help achieve the ambitious targets fixed by it.
Finally, the Planning Commission fixed specific targets of growth under each five year plan for diferent components of social services such as general and tech-nical education, health and sanitation, housing, labour welfare, welfare of Dalits and tribals, etc. In the latter plans, the Planning Commission reclassified and re-grouped these services into social services, economic services and general services.
Assessment of each of the Nine Plans
We shall briefly outline now the success or the failure of each of these plans. A general assessment of development planning in India in the last 55 years is attempted separately towards the end of this chapter.
The First Plan (1951-56) was a great success, as the production targets especially in the agricultural sector were more than fulfilled and the three short-term objectives, viz., rehabilitation of the refugees, food self-sufficiency and control of prices were more or less achieved. Though the success of the First Plan was partly due to the favourable climatic conditions of the period, the Planning Commission and the Government of India took the credit for the fulfilment of the various Plan targets.

3 I 4 I
I
I
I I I
I
298 PLANNING EXPERIENCE IN INDIA
The more ambitious Second Plan (1956-61) could not be implemented fully because of the acute shortage of foreign exchange. As a result the Planning Commission had to prune the development targets. Besides, the country started experiencing rise in prices. The Second Plan was only moderately successful.
The Third Plan (1961-66) was a realistic and more balanced plan and was based on the experience of the first two plans. However, the Third Plan was a thorough failure because the country suffered from one of the severest famines in a hundred years during the last year of the Plan (1965-66). Besides, India had to go through two major conflicts with China and Pakistan and during the Indo-Pakistan conflict, India was let down badly by the major aid-giving countries. The failure of the Third Plan led to suspension and postponement of the Fourth Plan by three years (1996-99) these three years were called as Annual Plans or were sarcastically called "Plan holiday".
The Fourth Plan (1969-74), when it was intro-duced after a gap of three years, was an ambitious plan as it aimed at an annual growth rate of 5.5 per cent (as against an average of 3.5 per cent during the previ-ous plans). It proposed to attain self-reliance and pro-vided a national minimum. The first two years of the Fourth Plan were quite promising; with record foodgrains production and equally rising industrial production. But the next three years of the Plan proved a great disappointment with successive failure of monsoons, decline in foodgrains production, failure on the industrial front due to power breakdowns and load shedding, transport bottlenecks, industrial unrest, etc. Above all, the price situation deteriorated to crisis proportions and the rapid rise in prices from the middle of 1972 completely upset the cost calculations of the Fourth Plan development projects. Above all, the country had to cope up with huge influx of refu-gees from Bangladesh and Indo-Pakistan war of 1972. The Fourth Plan, was able to achieve only 3.4 per cent GNP growth rate as against the target of 5.5 per cent and was, therefore, considered as a big failure.
The Fifth Plan (1974-79) was introduced in April 1974 when the country was in the throes of a serious economic crisis in the form of a run-away inflation. The Fifth Plan cost calculations based on 1971-72 prices proved to be completely wrong and the original public sector outlay of 7 37,500 crores had to be revised upwards to a little over 39,430 crores. Moreover, after the promulgation of emergency in 1975, the emphasis shifted to the implementation of the Prime • Minister's 20-point Programme. The Fifth Plan was relegated to the background. When the Janata Party came to power at the Centre, it terminated the Fifth Plan in 1978.
This step was the most unfortunate since it made the constitution and working of the Planning Commis-sion as well as the Plan formulation change with the
assumption of every Government at the Centre. So much so, with the coalition governments coming to power at the Centre, the formulation of five year plans has become difficult and often a cruel joke. No one is really bothered about the formulation and implementation of the five year plans any more.
The Sixth Plan, for instance, was originally in-troduced by the Janata Party for the period 1978-83 but later it was replaced by a new Sixth Plan for the period 1980-85. During this period the Indian econ-omy made an all-round progress and most of the tar-gets fixed by the Planning Commission were realised, though during the last year of the Plan (1984-85) many parts of the country faced severe famine conditions and agricultural output was less than the record output of the previous year. Broadly, however, the Sixth Plan could be taken as a success since it achieved a growth rate of 5.5 of the GNP on the average.
The Seventh Five Year Plan ( 1985-90) attempted to accelerate the growth in foodgrains production, in-crease in employment opportunities and raise productiv-ity. In other words, the focus of the Seventh Plan was on Food, Work and Productivity. The Seventh Plan was heralded as a great success since the Indian economy recorded about 6 per cent rate of economic growth during this plan as against the targeted 5 per cent. The decade of the Eighties (the Sixth and Seventh Plans) witnessed a creditable average annual rate of growth of 5.8 per cent as against the average of 3.5 per cent in the previous five plans. The Indian economy, finally, crossed the barrier of what Professor Raj Krishna called sarcastically "the Hindu rate of growth"
The introduction of the Eighth Plan was post-poned by two years because of political changes at the Centre, but once it was approved, it was implemented and the country witnessed a new take-off of high GDP growth and industrial resurgence. During the Eighth Plan ( 1992-97), India registered the highest annual rate of growth of 6.8 per cent and the interesting point was that this high order of growth rate could be achieved even though the share of the public sector in total investment had declined considerably to about 34 per cent. With the adoption of economic reforms and liberalisation, the importance of the private sector and movement towards market based economic system were both responsible for the higher rate of economic growth during the Eighth Plan.
The Ninth Plan (1992-97) initially set the target of GDP growth at 7 per cent. However, due to a low GDP growth of 4.8 per cent in 1997-98, the National Develop-ment council revised the target in February 1999 to 6.5 per cent on the average for the Ninth Plan. The develop-ment strategy envisaged an important role for the private sector and on market forces. Reliance on market forces did not mean that state has no role to play. But, the state instead of being a regulator should assure the role of a facilitator. However, the state must increase its involve-ment in the following areas :
INDIA
) much ►wer at ecome •thered lie five
illy in-078-83 or the
econ-he tar-Wised. ) many di tions output th Plan growth
!mpted on. in-duc ti v was on an was onomy growth t. The Plans )
with of .t in the finally. I called
is post- s at the me nted fi GDP Eighth
ual rate int was xl even zunent Vith the on, the owards onsible Eighth
arget of w GDP evelop-) to 6.5 evelop-private t forces he state )le of a avolve-
PLANNING EXPERIENCE IN INDIA
(a) To provide education, health care and safe drink-ing water to the majority of population especially in rural areas.
(b) To provide economic infrastructure such as irri-gation, power, roads, ports, railways, telecom-munications etc. Public investment in infrastruc-ture must continue to have high priority, espe-cially in those areas where private sector's par-ticipation is likely to be limited.
Investment needs of the Ninth Plan were esti-mated at 21,70,000 crores, out of which the share of the pthlic sector was projected at 7,26,000 crores (33.4%) aid that of the private sector was estimated at Z11,19,000 acres (51.6%). This leaves a gap of 3,25,000 crores. This gap was to be filled up by Foreign Direct Investment mid disinvestment of Public Sector Enterprises. Obvi-ously, the Ninth Plan aimed to depend predominantly on the Private Sector — Indian as well as foreign
2. PATTERN OF FINANC-ING THE FIVE YEAR PLANS IN INDIA
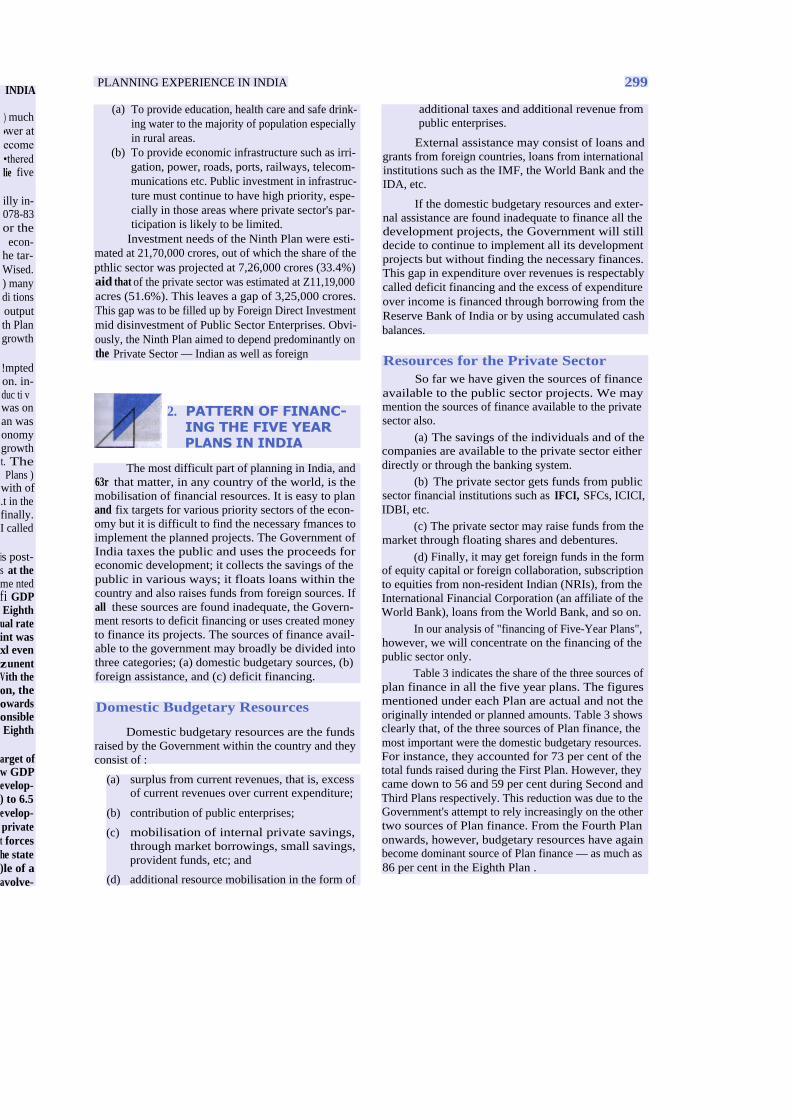
The most difficult part of planning in India, and 63r that matter, in any country of the world, is the mobilisation of financial resources. It is easy to plan and fix targets for various priority sectors of the econ-omy but it is difficult to find the necessary fmances to implement the planned projects. The Government of India taxes the public and uses the proceeds for economic development; it collects the savings of the public in various ways; it floats loans within the country and also raises funds from foreign sources. If all these sources are found inadequate, the Govern-ment resorts to deficit financing or uses created money to finance its projects. The sources of finance avail-able to the government may broadly be divided into three categories; (a) domestic budgetary sources, (b) foreign assistance, and (c) deficit financing.
Domestic Budgetary Resources
Domestic budgetary resources are the funds raised by the Government within the country and they consist of :
(a) surplus from current revenues, that is, excess of current revenues over current expenditure;
(b) contribution of public enterprises;
(c) mobilisation of internal private savings, through market borrowings, small savings, provident funds, etc; and
(d) additional resource mobilisation in the form of
299
additional taxes and additional revenue from public enterprises.
External assistance may consist of loans and grants from foreign countries, loans from international institutions such as the IMF, the World Bank and the IDA, etc.
If the domestic budgetary resources and exter-nal assistance are found inadequate to finance all the development projects, the Government will still decide to continue to implement all its development projects but without finding the necessary finances. This gap in expenditure over revenues is respectably called deficit financing and the excess of expenditure over income is financed through borrowing from the Reserve Bank of India or by using accumulated cash balances.
Resources for the Private Sector So far we have given the sources of finance
available to the public sector projects. We may mention the sources of finance available to the private sector also.
(a) The savings of the individuals and of the companies are available to the private sector either directly or through the banking system.
(b) The private sector gets funds from public sector financial institutions such as IFCI, SFCs, ICICI, IDBI, etc.
(c) The private sector may raise funds from the market through floating shares and debentures.
(d) Finally, it may get foreign funds in the form of equity capital or foreign collaboration, subscription to equities from non-resident Indian (NRIs), from the International Financial Corporation (an affiliate of the World Bank), loans from the World Bank, and so on.
In our analysis of "financing of Five-Year Plans", however, we will concentrate on the financing of the public sector only.
Table 3 indicates the share of the three sources of plan finance in all the five year plans. The figures mentioned under each Plan are actual and not the originally intended or planned amounts. Table 3 shows clearly that, of the three sources of Plan finance, the most important were the domestic budgetary resources. For instance, they accounted for 73 per cent of the total funds raised during the First Plan. However, they came down to 56 and 59 per cent during Second and Third Plans respectively. This reduction was due to the Government's attempt to rely increasingly on the other two sources of Plan finance. From the Fourth Plan onwards, however, budgetary resources have again become dominant source of Plan finance — as much as 86 per cent in the Eighth Plan .

300
PLANNING EXPERIENCE IN INDIA
TABLE 3. Sources of Plan Finance : First Eight Plans*
Plans Domestic Budgetary Resources
External Assistance Deficit financing Total
Amount ( rcrores)
Amount (f crores)
Amount crores)
% Amount (r crores)
%
First Plan 1,440 73 190 10 330 17 1,960 100 Second Plan 2,560 56 1,090 24 950 20 4,600 100 Third Plan 5,090 59 2,390 28 1,150 13 8,630 100 Fourth Plan 12,010 74 2,090 13 2,060 13 16,160 100 Fifth Plan 32,120 82 5,830 15 5,830 3 39,300 100 Sixth Plan 86,610 78 8,530 8 15,680 14 1,10,820 100 Seventh Plan 1,34,190 75 16,120 9 28,260 16 1,78,870 100 Eighth Plan 3,32,100 86 19,230 5 33,040 9 3,84,370 100
Shift in favour of foreign aid and deficit financing
Our planners were carried away by the success of the First Plan and the presence of such favourable factors at the end of the First Plan as the relative self-sufficiency in foodgrains, stability of prices in general and of foodgrains prices in particular, despite a high dose of deficit financing during the First Plan period and the enthusiasm and willing co-operation of foreign governments and international institutions (IMF and the World Bank to assist India in her planned eco-nomic development). Accordingly, our planners planned for (a) massive increase in our plans, (b) pro-posed to raise large financial resources by way of for-eign aid and (c) leave large uncovered gap (deficit financing) during the Second and Third Plans. For instance, as against 10 per cent of external assistance in the First Plan, the Second and Third Plans had raised 24 and 28 per cent of the needed funds by way of foreign assistance. Deficit financing was raised to 20 per cent of all finances during the Second Plan but was brought down during the Third Plan to 13 per cent of the aggregate resources because of the emer-gence of inflationary pressures during the latter part of the Second Plan.
Total Plan resources in Table 3 differ from the total plan outlays as given in Table I and 2. From the Sixth Plan onwards, the Planning Commission distin-guished between "current outlays of the public sector" and "public sector investment". In Table 3, total Plan resources exclude resources to meet current public outlay but include financial resources to meet public sector investment expenditure.
A careful consideration of data in table 3 reveals a clear shift in resource mobilisation from the Fourth Plan onwards. Long before the Fourth Plan was intro-duced in April 1969, the Government of India had already experienced the adverse effects of dependence on foreign Governments (American and British pres-sure against India during Indo-Pakistan conflict in 1965)
and the undue pressure of international financial in-stitutions (for example, the pressure of IMF to devalue the rupee in 1966). As a result, the Fourth Plan included self-reliance as a major objective of plan-ning. External assistance was reduced from 28 per cent to 13 per cent during the Third Plan. External assis-tance was gradually reduced to 5 per cent during the Eighth Plan.
At the same time, the Government was fully alive to the adverse consequences of deficit financing in the form of pressure on prices. Even though deficit financing was kept at 13 per cent during Third and Fourth Plans, it was reduced to 3 per cent in the Fifth Plan, but rose sharply to 14 per cent in the Sixth Plan (as against the original estimate of 5 per cent) and 16 per cent during the Seventh Plan.
Reduced dependence on foreign aid and less recourse to deficit financing naturally forced the Gov-ernment to rely increasingly on domestic budgetary resources. Accordingly, from 59 per cent in the Third Plan, domestic budgetary resources contributed 74 per cent of the aggregate finances during the Fourth Plan and 82 per cent during the Fifth Plan and 86 per cent during the Eighth Plan.
Domestic Budgetary Resources
Let us now consider the domestic budgetary resources in greater detail. As we have already indi-cated, domestic budgetary resources comprise of a surplus from current revenues, contribution from pub-lic enterprises, market borrowings, small savings, provi-dent fund contributions, term loans from financial in-stitutions, miscellaneous capital assets and finally, additional resource mobilisation (in the form of taxes or in the form of resources from the public sector enterprises). The relative importance of these compo-nents of domestic budgetary resources in the different plans is given in Table 4.
Balance From Current Revenues. The tradi-tional view has always been that current revenue

N INDIA
=_4',",ING EXPERIENCE IN INDIA
LA.BLE 4. Relative Significance of the Components of Domestic Budgetary Resources
in Various Plans
First Plan
Percentage of Total Plan Resources
r at
res t
Second Plan
Third Plan
Fourth Plan
Fifth Plan
Sixth Plan
Seventh Plan
Eighth Plan
i0 100 Illneestic Budgetary Resources 10 100 of which 73 56 59 74 82 78 75 86 10 100 Balance from current revenues (BCR) 25 -1 -5 -2 13 2 -8 -10* i0 100 Contributions from public enterprises 3 5 9 4 5 8 34* 10 100 Domestic private savings 35 31 25 40 28 41 58 62 X/ 100 Additional resource mobilisation (ARM) 13 23 34 27 37 30 17 FO 100 PO 100 include ARM also
• Various Five Year Plans.
trial in-, devalue rth Plan of plan-per cent
lal assis-iring the
vas fully inancing
though ng Third m in the he Sixth :ent) and
and less the Gov-udgetary to Third 1 74 per firth Plan per cent
udgetary idy indi-rise of a om pub-p, provi-icial in-I finally, of taxes
is sector compo-
different
ae tradi-revenue
diould be used for meeting current expenditure. Ikavever, as for back as 1950-51, the Planning Com-elusion accepted the recommendation of the Taxation Enquiry Commission (Chairman: V.T. Krishnamachari) am the current revenue of the Government could dad should be used partly to finance economic devel-
. The idea was to restrict current expenditure, come a surplus from current revenue and use the same In financing economic development. In theory, this 1112• really praise-worthy and the Planning Commis-sion dutifully provided for a certain amount of rev-sues as surplus from current revenues. In fact, the First Plan raised as much as 25 per cent of the total &uncial resources from this source. But for the next Once plans (Second, Third and the Fourth), the amplus from current revenues was negative, indicating Sat, instead of restricting current expenditure and ac-cumulating a surplus in the current account, the Government was having net deficits.
In spite of its best intentions to restrict its cur-rant expenditure, both the Central and State Govern-ments were not able to do so, partly because of multi-plication of ministres and departments and mindless expansion in the number of government servants and prtly because of rise in salaries and dearness allow-
■ees. In the case of the Central Government, another Wportant cause for rise in current expenditure was the sapid growth in subsidies, defence expenditure and i■serest payments.
Even the surplus shown in the Fifth Plan was not wally a surplus but only an anticipated surplus. The Sixth Plan provided for a surplus in current revenues amounting to Z 14,480 crores or 14.9 per cent, could actually generate very small surplus of Z 1,890 crores, accounting for only 1.7 per cent of the aggregate resources. The Seventh and Eighth Plans showed huge negative balances from current revenues.
Contribution from public enterprises. The contribution from public enterprises was not much but as Table 4 shows, it has been rising steadily over the years : from about 3 per cent in the Second Plan,
profits of public enterprises had risen to 9 per cent in the Fourth Plan. As a matter of fact, the contribution from public enterprises has always been much less than what was originally planned for.
Many of the Central Government enterprises have been running on losses and even the contributions of such departmental undertakings as the railways and posts and telegraphs have been minimal. The bright spots have been the Reserve Bank of India and other banking and financial institutions and some commer-cial enterprises like Indian Oil Corporation, which have been yielding regular profits to the Govern-ment. As far as State enterprises were concerned, the less said the better. The State Electricity Boards (SEBs) and the State Road Transport Corporations (SRTCs) which are the two major state enterprises have been running on losses throughout the planning period. The losses of SEBs are around Z 1,500 crores per year and the losses of SRTCs are around Z 200 crores per year. Further, states incur annual losses of Z 700 to 1000 crores on commercial irrigation. In spite of their poor record, the planners vainly expect increasingly larger contributions from the public sector enterprises in ev-ery Plan.
Domestic Private Savings. Market borrowings and small savings are the two components of domes-tic private savings in the country. These two sources have come to play an important role in raising finances for development. During the First Plan, domestic pri-vate savings contributed more than one-third of the aggregate resources, but in the next two plans, their importance was reduced marginally, as the Planners put more faith in external aid and deficit financing. In the Fourth Plan, however, the Government was so concerned about self-reliance and the need to reduce dependence on foreign aid, that it went in for a massive effort to raise financial resources within the country. During the Fourth Plan, domestic private sav-ings accounted for 40 per cent of the total financial requirements.

302 PLANNING EXPERIENCE IN INDIA
In the Sixth Plan, the original estimate was that the domestic private savings should contribute Z 36,400 crores or 37 per cent of the aggregate planned invest-ment. However, the Government succeeded in raising
45,930 crores or 41 per cent of the total investment. In the Seventh and Eighth Plans the importance of this source of Plan fmance continued to rise due to two reasons :
(a) The Government has a good and extensive captive market in the form of nationalised banks, pub-lic sector financial institutions, public provident funds, etc. which are able to supply almost any amount of funds needed by the Government.
(b) With rise in national and per capita in-comes, the ability and willingness to save among all sections of the people particularly the middle classes has been increasing and the Government has also been encouraging this tendency to save through appro-priate tax incentives (as for example, interest income and dividend income is exempted from income-tax upto the value of 15,000).
Accordingly, domestic private savings contrib-uted 58 per cent and 62 per cent respectively during Seventh and Eighth Plans.
Additional Resource Mobilisation (ARM). Un-der this head, we bring in two sources of raising funds for development. The first is additional taxa-tion which has been an important source in all the plans. The second is the additional resource mobilisation through public sector enterprises by raising their prices (or what is now called, through raising the adminis-tered prices of goods). That additional taxation has become an important source of development finance would be clear from the fact that its contribution was 13 per cent in the First Plan, 23 per cent in the Fourth Plan and 30 per cent in the Sixth Plan. While the tax burden on the urban consumers seems to have reached the maximum, there is considerable scope for additional taxation on rural incomes. There is high degree of prosperity among the farmers due to the green revolution and part of the additional income of the farming community could be easily collected for development purposes.
The Government has found it easy to raise the administered prices of goods and services produced and sold by the public sector enterprises, such as petrol, steel, coal, etc. But the public opposition to the price hike in essential commodities in the beginning of 1986 was an eye-opener to the Government and it was hoped that public opposition would restrain the Gov-ernment from raising additional resources by this method in the future. However the Government has continued to use this method even later.
As dependence on foreign assistance and deficit fmancing have serious adverse consequences for the country, the Government has been relying increas-ingly on domestic budgetary resources. All the dif-ferent constituents of domestic resources, particularly additional taxation, market borrowings and small savings and contribution from public enterprises have their own importance. To the extent the domestic resources are used to meet Plan requirements. our dependence on deficit financing and foreign assis-tance will be reduced.
Financial Pattern of the Ninth Plan Ninth Plan had projected a resource mobilisation
by the Centre and States/UTs of the order of 8,59,200 crores at 1996-97 prices, but actual realisations were of the order of 7,05,818 crores or nearly 82 per cent of projection. Obviously, this has meant a reduction in die size of the public sector plan by 18 per cent. (Refer Table 10).
A close perusal of the data provided in Table 10 presents a comparison between plan projections and actual realisations. So far as balance from current revenues was concerned, as against the expectation of reducing the deficit under this head to (-) 0.2 per cent of total resource mobilisation, the actual realisations showed a deficit of (-) 37.4 per cent of the total requirement, i.e. of the order of 2,63,752 crores. This has shattered the entire resource projections of the Ninth Plan. So far as resources of public enterprises are concerned, as against the expectation of Z3,40,409 crores, the actual realisation were of the order of 2,80,902 crores—! 59,507 crores less than the projection. However, their proportion to total resource mobilisation was of the order of 39.8 per cent. So far as net inflow from abroad is concerned, as against an expectation of 60,018 crores, the ralisation was a paltry 17,452 crores. As a result of serious slippages in resource generation from current revenues and net inflow from abroad, the Government was forced to resort to market borrowings. As against the projection of 460,179 crores from market borrowing, the actual realisation was of the order of Z 6,71,216 crores or nearly 95 per cent of total resource mobilisation. If market borrowing and net inflow from abroad are taken together. then nearly 98 per cent of the resources for the Plan were generated from them. The entire resource mobilisation projection exercise has gone haywire. It is a matter of deep dissatisfactin that the entire plan is being financed by external resources and this adds to burdens in the form of interest payments which eat into state revenues. The picutre of resource generation underscores total failure on the part of both the Centre and State Governments.
2. Planning Commission, Tenth Five Year Plan (2002-2007), Vol. I, p. 24.

IN INDIA
and deficit ces for the ag increas-11 the dif-particularly and small prises have e domestic nents, our reign assis-
Plan iobilisation Z 8,59,200 xis were of per cent of ction in the Refer Table
in Table 10 actions and im current oectation of per cent of
ons showed rement, i.e. tattered the a. So far as I, as against realisation
1,507 crones oportion to of 39.8 per ncerned, as e ralisation of serious
at revenues was forced projection the actual
es or nearly . If market m together. e Plan were aobilisation a matter of ig financed in the form
renues. The :otal failure vernments.
Year Plan
'crores at 1996-97 prices
Projections Realisations
Centre States Total Centre States Total
1. Balance from current 2,778 1,372 1,406 -1,56,790 -1,06,962 -2,63,752
revenues (-0.6) (0.4) (-0.2) (-38.6) (-35.8) (-37.4)
2. Borrowings including 3,16,761 1,43,419 4,60,179 4,55,624 2,15,592 6,71,216
net MCR (64.7) (38.8) (53.6) (112.0) (72.1) (95.1)
3. Net inflows from 60,018 60,018 17,452 17,452
abroad (12.3) (7.0) (4.3) (2.5)
4. Resources of Public 2,85,379 55,030 3,40,409 2,28,795 52107 2,80,902
Sector Enterprises (58.3) (14.8) (39.6) (56.3) (17.4) (39.8)
5. Central assistance to -1,70,018 1,70,018 - 1,38,394 1,38,394
States (-34.7) (46.0) (-34.0) (46.3)
6. Resources for the Plan 4,89,361 3,69,839 8,59,200 4,06,687 2,99,131 7,05,818
(1+2+3+4+5)
(100.0)
(100.0) (100.0) (100.0) (100.0) (100.0)
SouRcE:Compiled and computed from data provided by Planning Commission, Tenth Five Year Plan (2002-2007), Ch. 3.
i..ANNING EXPERIENCE IN INDIA
3. RELATIVE MERITS AND DEMERITS OF DIFFERENT SOURCES OF PLAN FINANCING
We have explained the various types of financial resources raised by the Union and the State Govern-ments to finance planned development. We shall now discuss the consequences as well as relative merits and demerits of each one of these sources.
Taxation Taxation was an important source of develop-
ment finance in India. As mentioned earlier, the Taxa-tion Enquiry Commission clearly advocated the use of taxation as a source of development finance : "Financ-ing a part of development by budgetary surpluses is a legitimate form of development finance and does not cause any greater real burden on the current consump-tion of the community than would be done by an equiva-lent amount of public borrowing". There are two ad-vantages claimed for taxation as a source of develop-ment finance in India :
(a) Taxation is a good instrument to increase the rate of saving in a country like India. On the one hand, it will bring about compulsory saving among the lower income groups and, on the other, it will help to increase voluntary savings of the higher income groups through tax incentives, tax holidays, etc.
(b) There is still scope for additional taxation, as majority of the rural people do not contribute to direct taxes and share very little of indirect taxes. This is particularly true of the more affluent farmers who have directly benefited from Government expenditures on agricultural development but without paying for them.
The economic consequences of taxation should be considered, taking direct and indirect taxes sepa-rately. Direct taxes - meaning income tax, corporation tax, wealth tax, estate duty and gift tax - fall heavily on the higher income groups and, being steeply progressive, they tend to affect adversely the ability and willingness to work, save and invest. In other words, direct taxes have an adverse effect on production and employment. The Government of India attempted to reduce the ad-verse effects of direct taxes through appropriate tax reliefs and concessions. At the same time, the Planners believed - at least during the 1950s and 1960s - that steeply progressive personal income tax, estate duty and wealth tax had an important place in India because of their ability to chop off high incomes and wealth in the country. It may be emphasised here that reduction of inequality of income and wealth was one of the major Plan objectives . Besides, steep direct taxes have the effect of reducing the volume of purchasing power in the hands of the general public and, thus, help to reduce their demand for goods and services - in other words, direct taxes could be used to control inflation in the country. In practice, however, steep direct taxes were extensively evaded and as such they were largely respon-sible for the emergence and perpetuation of black money in the country and for the steep decline in moral values among the people and for the general deterioration of the moral fibre of the nation.
TABLE 10: Ninth Plan Pattern of Financing Resources

304 PLANNING EXPERIENCE IN INDIA
Indirect taxes — meaning commodity taxes as a source of development finance were sought to be justi-fied on the ground that only through them the lower income groups, and even the very poor, could be made to contribute to economic development. There is a seri-ous flaw in this approach. For, regular hike in commod-ity taxes and administered prices was an important cause for pushing up the inflationary pressure in the country during the last four decades.
Unfortunately, the argument that taxation could be used to raise resources for financing economic devel-opment has lost its significance in India:
(a) the Government has been unable to control the ever-rising current expenditure;
(b) tax revenue which has also been rising, has been found hopelessly inadequate to pay for even current expenditure;
(c) for the last many years, the Government has been incurring huge revenue deficits; and accordingly
(d) the question of using surplus tax revenues to pay for economic development does not arise.
Profits of public undertakings
Depreciation and net profits of public enterprises could be used to finance expansion of these enter-prises. Some public enterprises, have financed their expansion out of their own accruals. The experience of the public sector in the first 35 years of planning has been quite disappointing--the losses of the public sector had to be made good out of general tax revenues. This is an unhappy situation. Improvement in the performance of public sector undertakings is necessary to contribute more resources for develop-ment.
Every five year plan has been emphasising that one of the major functions of public sector enterprises is to generate surplus for financing further economic devel-opment. During the Sixth Plan, for instance, certain public enterprises could finance only 28 to 30 per cent of their development expenditure through their own inter-nal resources. For the rest, they had to depend upon the Government ( viz., the budget ) The performance of State public enterprises was atrociously poor. It has been estimated that the SEBs (State Electric Boards) and SRTUs (State Road Transport Undertakings) could fi-nance barely 3.5 per cent of their development expendi-ture and consequently they had to depend almost solely on budgetary support. It is, thus, clear that, as vehicles of resource mobilisation for financing development ex-penditure, the public sector has a miserable record in India.
It is, however, possible to tone up the management of the public sector enterises and make them contribute substantially for their expansion. In this connection, the States should either improve the working of the SEBs and SRTUs or should be prepared for shifting them to the private sector. It fact, the private road transport compa-nies have invariably been yielding huge profits. Mobilisation of internal private savings and the mobilisation of addtional resouirces through additional taxation and through hike in administered prices have been the main source of funds for development in the country, but they may not be so in the years to come. Our experience during the Eighth and the Ninth Plan clearly indicates that the Government cannot raise adequate resources for planned development through budgetary resources any more and, accordingly, has to invite greater participation of the private sector in industrial and infrastructural development.
Market loans and small savings
The basic advantage of market borrowing is that it is voluntary and does not meet with public opposi-tion as in the case of taxation. Besides, the Govern-ment has captive institutions who subscribe to the loans floated by the Government, as for example, the LIC, the General Insurance Companies, the national-ised commercial banks, the Unit Trust of India, etc. Again, the Government also raises increasing amounts of funds for development through mobilisation of small savings viz., through post office savings ac-counts, national savings certificates, etc. While mobilisation of public savings for development pur-poses is really useful and in certain respects better than taxation, it has one serious disadvantage as compared to taxation--the Government has to pay interest and return the principal also at a future date. These burdens have to be borne by the future genera-tions in the form of higher taxation.
There is not much to choose between taxation and borrowing as regards the burden of an investment programme, for investment involves, in terms of real resources, the reduction in consumption of the general public and the diversion of the resources to investment. Whether this diversion will be done by taxation or through borrowing is immaterial since the present generation will in any case suffer (due to restriction of consumption). But taxes are better than public borrowing since they would impose no future burdens (as public borrowing and public debt would involve interest burden).

S
ving is that lic opposi- te Govern-
to the ample, the : national-India, etc.
ig amounts ilisation of avings ac-etc. While mient pur-ects better vantage as has to pay uture date. Ire genera-
en taxation investment
terms of tion of the sources to
done by since the
'er (due to better than e no future lebt would
4. REVIEW OF PLANNING EXPERIENCE IN INDIA
From what we have described above, it may be inferred that most of India's Five Year Plans more or less failed and did not produce any favourable results. But such a conclusion would obviously be wrong. When we
Year Net National Product (rcrores)
1950-51 132,367 1960-61 192,235 1970-71 270,597 1980-81 363,417 1990-91 614,206 1996-97 852,085 2003-04 12,66,005
At 2004-05 Prices 2004-05 26,23,995 2008-09 36,72,192 2009-10 39,29,853
Average Annual Growth Rates
Per capita (
3,687 4,429 5,002 5,352 7,321 9,007 11,799
24,095 31,821 33,588
PLANNING EXPERIENCE IN INDIA
Foreign Assistance
A developing country such as India generally funds it difficult to expand its exports; at the same time, it does not like to reduce its imports, lest its lute of growth is reduced. Foreign loans and grants are, therefore, useful and constitute an important source of financing economic growth. But there are two intrinsic disadvantages : (a) lending countries may ex-at political pressure on the aid-receiving countries, and (b) the debtor country will have to find resources later to pay off interest and the principal. We have examples of developing countries which have been forced to borrow to pay off their annual interest. This a the notorious "debt trap" which India should avoid.
Deficit Financing Deficit financing is handy when the Govern-
ment is unable to raise finances from other sources. So much so, Governments frequently succumb to the temptation of deficit financing; without bother-ing much about mobilising resources through additional taxation. Deficit financing may be use-ful too, if adopted in small doses. For, it will wise the money supply in the country and raise the demand for goods and services. In fact, deficit financing does help to activise the economy and increase production, if it is kept within safe limits. However, deficit financing has an inherent danger. Once deficit financing is adopted by the govern-ment, it becomes cumulative. With every passing year, the volume of deficit financing increases. By raising money supply, deficit financing raises prices. Much of the inflationary pressure in India in recent years is due directly to deficit financing and it is for this reason that taxation is preferred to deficit financing.
A consideration of the various measures of rais-ing resources for planned development clearly points out that the Government should avoid deficit financ-ing at all costs, reduce dependence on foreign assistance to the unavoidable minimum and increas-ingly rely on domestic budgetary resources. Here too, if the Government could restrict its current expendi-ture and succeed in generating a surplus, it would be really good. Under the present era of coalition gov-ernments, however, this is not going to be easy.
say that a particular plan had failed or was not a success, it only means that the targets fixed during a given Plan were not achieved fully. But we should remember that with every five year Plan, India could start at a higher level of growth and development. We shall now describe the concrete achievements of the development plans since 1951.
Achievements of Planning in India (i) Increase in national and per capita in-
come. One of the basic objectives of economic planning in our country is to increase national and per capita incomes. As a direct consequence of economic plan-ning, India's national income and per capita income rose, though not as rapidly as the planners planned and anticipated. Table 5 brings out clearly the rise in national income ( i.e., net national product at factor cost) and per capita income, since 1950-51 at 1993-94 prices.
TABLE 5 : Growth of National Income and Per Capita Income
(at 1993-94 prices)
1950-51 to 1980-81 3.4 1.2 1980-81 to 1996-97 5.5 3.3
1996-97 to 2003-04 5.8 3.9
2004-05 to 2009-10 8.4 6.9
SOURCE : Government of India, Economic Survey, various issues, RBI Hand book of Statistics on Indian Economy, 2009-10
From Table 5, we find that national income at 1993-94 prices rose from Z 132,367 crores at the beginning of the First Plan to Z 852,085 crores at the end of the Eighth Plan.
On the other hand, the per capita income in real terms had, however, increased at a much lower rate indicating that part of the increase in real national income had been eaten up by the increase in population. Table 5 shows that per capita income at 1993-94 prices had risen from Z 3,687 to Z 9,007 between 1951 and 1997.
Between 1950-51 and 1996-97, the growth pro- cess of the Indian economy can be divided into two broad periods : ( a) 1950-51 to 1980-81, and (b) 1980-81 to
tmagement contribute ection, the the SEBs
them to the oft compa-re profits. s and the additional
prices have rent in the :ome. Our 'Ian clearly
adequate budgetary
vite greater 'Istria' and
TAMIX 8 : Apr Y
31109- 10 1111.11bCE: Govei
I1. Table 8 sl
India had]
of the 10 -incrm
productio =me, the mast polincs. All thi SIC of the new
there t to fulfil ti
abliails in the] ice of continue
finclualions sugarcai
Pit%
in som El
weidlargical ind GIL A major who
eirm:rsificatic During th
not had ifindintries. ont iimaions. genera
53 to !:
As arm industries
Is fertili
APPreclati if industrialism in or achievein
306 PLANNING EXPERIENCE IN INDIA PLANNING E
1996-97. During the first period, Indian economy increased at an annual average growth rate of 3.4 per cent in NNP and 1.2 per cent in per capita NNP (contemptuously called the Hindu rate of growth by Prof. Raj Krishna ) However, during the second period, ( i.e., 1981 and 1997 ) the Indian economy crossed the barrier of the Hindu rate of growth and showed an average rate of growth rate of 5.5 per cent in NNP and 3.3 per cent in per capita income. However, during 1996-97 and 2003-04, NNP growth rate was 5.8 per cent and the per capita NNP increased by 3.9 per cent. Between 2004-05 and 2009-10 average annual growth of NNP and per capita NNP were recorded as 8.4 percents and 6.9 respectively.
From Table 6, it is clear that the actual growth rates have been fluctuating up to the Fourth Plan be-tween 2.8 to 4.3 per cent. Besides, the actual growth rate was less than the target from the Second Plan onwards and particularly during the Third and Fourth Plans. But from the Fifth Plan onwards, there has been a steady improvement in GDP growth from 4.8 per cent per annum during the Fifth Plan to 6.8 per cent during the Eighth Plan. This was indeed a healthy development. However, GDP growth rate declined to 5.4 per cent in the Ninth Plan. During 10th plan and 11th plan we find higher GDP growth at 7.5 percent and 8.3 percent respectively. However it was lower than targetted per-cent growth.
TABLE 6. Growth Performance in the Five Year Plans (at 1993-94 prices)
NNP at Factor cost (per cent per annum)
Target Actual
1. First Plan (1951-56) 2.1 3.6
2. Second Plan (1956-61) 4.5 4.1
3. Third Plan ( 1961-66) 5.6 2.8 4. Fourth Plan ( 1969-74) 5.7 3.3 5. Fifth Plan (1974-79) 4.4 4.8
6. Sixth Plan ( 1980-85) 5.2 5.7
7. Seventh Plan ( 1985-90) 5.0 6.0 8. Eighth Plan ( 1992-97) 5.6 6.8
9. Ninth Plan (1997-2002) 6.5 5.4 10. Tenth Plan (2002-07) 8.0 7.5
11. Eleventh Plan (2007-12) 9.0 8.3
Note : The growth targets of the first three Plans were set with respect to national income. In the Fourth Plan, it was with the NDP. In all the subsequent plans, the GDP has been used.
SOURCE : Planning Commission, Ninth Five Year Plan (1997-2002), Vol. I and Tenth Five Plan (2002-07),
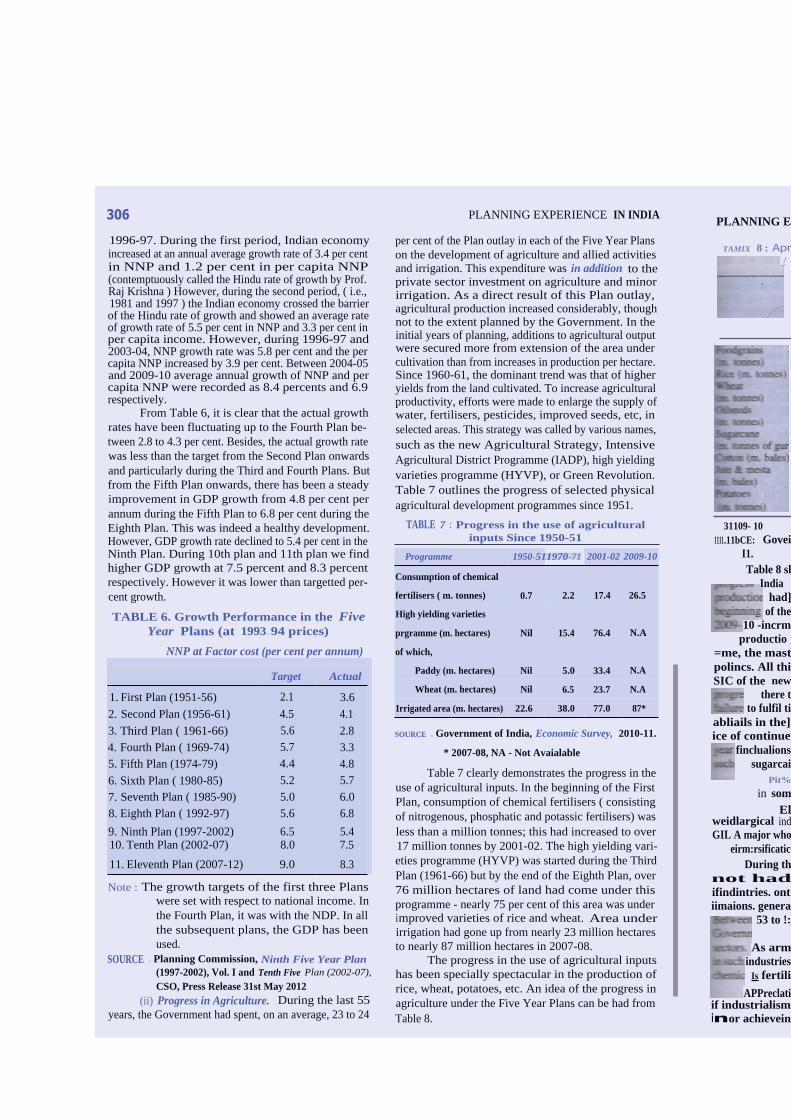
CSO, Press Release 31st May 2012 (ii) Progress in Agriculture. During the last 55
years, the Government had spent, on an average, 23 to 24
per cent of the Plan outlay in each of the Five Year Plans on the development of agriculture and allied activities and irrigation. This expenditure was in addition to the private sector investment on agriculture and minor irrigation. As a direct result of this Plan outlay, agricultural production increased considerably, though not to the extent planned by the Government. In the initial years of planning, additions to agricultural output were secured more from extension of the area under cultivation than from increases in production per hectare. Since 1960-61, the dominant trend was that of higher yields from the land cultivated. To increase agricultural productivity, efforts were made to enlarge the supply of water, fertilisers, pesticides, improved seeds, etc, in selected areas. This strategy was called by various names, such as the new Agricultural Strategy, Intensive Agricultural District Programme (IADP), high yielding varieties programme (HYVP), or Green Revolution. Table 7 outlines the progress of selected physical agricultural development programmes since 1951.
TABLE 7 : Progress in the use of agricultural inputs Since 1950-51
Programme 1950-511970-71 2001-02 2009-10
Consumption of chemical
fertilisers ( m. tonnes) 0.7 2.2 17.4 26.5
High yielding varieties
prgramme (m. hectares)
of which,
Paddy (m. hectares)
Nil
Nil
15.4
5.0
76.4
33.4
N.A
N.A
Wheat (m. hectares) Nil 6.5 23.7 N.A
Irrigated area (m. hectares) 22.6 38.0 77.0 87*
SOURCE : Government of India, Economic Survey, 2010-11.
* 2007-08, NA - Not Avaialable
Table 7 clearly demonstrates the progress in the use of agricultural inputs. In the beginning of the First Plan, consumption of chemical fertilisers ( consisting of nitrogenous, phosphatic and potassic fertilisers) was less than a million tonnes; this had increased to over 17 million tonnes by 2001-02. The high yielding vari-eties programme (HYVP) was started during the Third Plan (1961-66) but by the end of the Eighth Plan, over 76 million hectares of land had come under this programme - nearly 75 per cent of this area was under improved varieties of rice and wheat. Area under irrigation had gone up from nearly 23 million hectares to nearly 87 million hectares in 2007-08.
The progress in the use of agricultural inputs has been specially spectacular in the production of rice, wheat, potatoes, etc. An idea of the progress in agriculture under the Five Year Plans can be had from Table 8.

NCE IN INDIA
Five Year Plans I allied activities addition to the
ture and minor s Plan outlay, iderably, though rnment. In the bicultural output
the area under 'lion per hectare. LS that of higher ease agricultural rge the supply of d seeds, etc, in y various names, tegy, Intensive P), high yielding een Revolution. :lected physical since 1951.
agricultural
2001-02 2009-10
17.4 26.5
76.4 N.A
33.4 N.A
23.7 N.A
77.0 87*
Survey, 2010-11.
e progress in the ring of the First sers ( consisting c fertilisers) was ncreased to over gh yielding vari-during the Third iighth Plan, over nme under this s area was under 1. Area under million hectares 08. ric ul tura! inputs e production of the progress in
can be had from
--DLANNING EXPERIENCE IN INDIA
TABLE 8 : Agricultural Production under Five Year Plans (1951 to 2011)
1950 -51
1970 -71
2001 -02
2009 -10
Increase (%) between
1951 and 2010
Foodgrains tm. tonnes) 51 108 213 218.2 328 Rice (m. tonnes) 21 42 93 89.1 324 Wlieat fo. tonnes) 7 24 73 80.7 1052 Oilseeds
tonnes) 5 10 21 24.9 398 Sugarcane
tonnes of gur) 57 126 297 277.7 387 Cotton Jut &
(m. bales) mesta
3 5 10 23.9 697
tan. bales) 3 6 12 10.7 257 Potatoes M. tonnes) 2 5 24 34.4* 1,620
* 2009- I 0 SOURCE: Government of India, Economic Survey, 2010-11.
Table 8 shows clearly the spectacular agricultural progress India has made since 1950-51. Foodgrains poduction had gone up from 51 million tonnes at the beginning of the First Plan to 218.2 million tonnes by 2009-10-increase by over four times. Likewise, in every crop, production had increased by three or four times. Of course, the most spectacular increase was in wheat and potatoes. All this has been made possible because of the use of the new agricultural strategy. Inspite of this pogress, there have been many shortcomings, such as failure to fulfil the targets of production in many crops, shortfalls in the production of pulses and oilseeds in the face of continuous rise in demand for them and year-to-y= fluctuations in the production of commercial crops mr-h as sugarcane, cotton and jute.
(iii ► Progress in Industry. Table 9 gives the progress in some basic industries only which is quite impressive. Equally impressive is the progress in metallurgical industries, chemical and allied industries, etc. A major achievement in the industrial sector has been the diversification of Indian industries.
During the first ten plans (1951 to 2007), the Government had invested heavily on the development of industries, on the expansion of transport and commu- nications, generation and distribution of electricity, etc. Between 53 to 55 per cent of all planned outlay of the Government in each Five Year Plan was on these sectors. As a result, there has been considerable progress a such industries as steel, aluminium, engineering goods, chemicals, fertilisers and petroleum products.
Appreciating the progress and rapid development of industrialisation, the Janata Sixth Plan states : " A major achievement has been the diversification and
307
expansion of India's industrial capacity with the public sector playing a leading role. The country is self-sufficient in consumer goods and in basic commodities like steel and cement, while the capacity of other indus-tries like fertilisers is rapidly expanding. The growth of capital goods production has been particularly impres-sive., and India can now sustain the likely growth of most of her industries, whether textiles, food processing or cement or chemicals, metallurgical industries, power or transport, by the domestic production of capital goods needed with only marginal imports"'
TABLE 9 : Progress of Industrial Production ( Selected industries)
1950
-51 1970
-71
2001
-02
2005
-10
1. Coal (m. tonnes) 32 76 353 566 2. Iron ore (m. tonnes) 3 32 76 218.6 3. Fertilisers (m. tonnes) 0.02 1 15 16.7 4. Cement (m. tonnes) 3 14 107 200.7 5. Finished steel (m. tonnes) 1 5 31 59.7 6. Aluminium (1)00 tonnes) 4 169 552 745.5 7. Petroleum, crude
(m. tonnes) 0.3 7 32 33.7 8. Electricity (billion kwh) 5 56 579 768
SOURCE : Government of India, Economic Survey, 2005-06. 2010- ] 1
As a direct consequence of the increase in planned production in agriculture, industry and in all other sectors of the economy, per capita availability and con-sumption of essential commodities had increased in India. Table 10 shows how the net availability of foodgrains, sugar and other basic necessities had in-creased since the beginning of the First Plan.
TABLE 10 : Net per capita availability of some essential consumer goods in India
Items 1950 1970 2001 2009
-51 -71 -02 -10
1. Cereals and pulses (kgs) 144 167 180 162
2. Sugar (kgs) 5.0* 7.4 16.0 18.6 3. Edible oils &
vanaspati (kgs) 3.2* 4.5 10.2 14.3 4. Tea (grams) 362* 401 650 687* 5. Milk (kgs) 47 40 80 96 6. Eggs (number) 5 11 37 51 7. Cloth (metres) 14* 16 32 43.1 8. Electricity,
domestic (khw) 2.4* 7.0 76.8 102.7**
* These figures relate the year 1955-56, that is, the last year of the First Plan. ** 2008-09@ 2006-07 SOURCE : Government of India, Economic Survey, 2005-06. 2010-11
1. Planning Commission, Draft Sixth Five year Plan,
1978-83. p. 1.

In his 11 ERPerienre
can to th planning
la) A maj in n
are many a widesprmas sled. feni
There in thenng
ceaL There i -7. of the
lb i India I karger pop
has ten (c) The pl
impbc grow
wee Profess Ile process
issue: But probi tot effect
ll samegmeiad In t
kR agricu
largely i For over I
the Centre —came to
— ha% e India ii
a social ha
with jug of expi
as, it is m . The mon
towards soci question
the othe In
percolate! or have
OE rich and of m
that the economic
hate becon — particuli
hope* has failure
L Fad= pirwas
IL C hi= Eva
308 PLANNING EXPERIENCE IN INDIA
Table 10 shows that, between 1951 and 2008-09, per capita consumption of foodgrains (i.e., cereals and pulses) had increased considerably — between a modest 30 per cent in the case of cereals and pulses to296 per cent in the case of sugar, 860 per cent increase in the case of eggs and 44 times increase in the consumption of domes-tic electric power. The increase in per capita consump-tion of essential consumer goods would have been much greater if population had not risen from 361 million to an estimated 1,154 million between 1951 and 2008 or if population growth had been effectively controlled. It is also interesting to observe that despite increase in per capita consumption of essential consumer goods, sav-ings as a proportion of GDP had inccreased from 10.4 per cent in 1950-51 to 32.5 per cent in 2008-09.
(iv) Development of economic infrastructure. Another achievement of great significance is the cre-ation of economic infrastructure which provides the base for the programme of industrialisation. The expansion of roads and road transport has led to the enlargement of the market. Irrigation and hydro-electric projects have given a big boost to agriculture and also provided energy for installing factories and other modern establishments in small towns and cities. The infrastructure has opened the possibilities of modernising semi-urban and rural areas. The Janata Sixth Plan rightly mentions : "A large infrastructure has been built to sustain this sub-continen-tal economy: the network of irrigation storage works and canals, hydro and thermal power generation, regional power grids, a largely electrified and dieselised railway system, national and state highways on which a rapidly growing road transport fleet can operate and telecommu-nication system covering the most urban centres and linking India with the world"2
(v) Diversification of exports and import substitution.As a consequence of the policy of rapid industrialisation, India's dependence on foreign coun-tries for the import of capital goods has declined. Simi-larly, quite a good number of consumer goods imported earlier are being produced indigenously. This has led to import substitution. Consequently, the commodity composition of India's exports has changed in favour of manufactures, mineral ores and engineering goods.
(vi)Development of science and technology An-other achievement of significance is the growth of sci-ence and technology and the development of technical and managerial cadres to run the modern industrial structure. This has significantly reduced our depen-dence on foreign experts. Being relatively more ad-vanced than some of the other underdeveloped and developing countries, India has started exporting techni-cal experts to middle East and African countries. This is a matter of legitimate pride for the country.
(vii) Development of a huge educational system. One of the great achievements of planning era is the development of a huge educational system - the second
2. Ibid., p. 1.
largest in the world. By 2004-05, the enrolment at the Primary (Ito V) and Upper Primary (VI to VIII) was 18.2 crores. Similarly enrolment at the Secondary and Higher Secondary (IX to XII) was 3.7 crores. Taken together, total enrolment in school education (I to XII) was of the order of 21.9 crores - a matter of legitimate pride.
The country was able to achieve a Gross Enrol-ment Ratio (GER) of 96 percent at the primary level, though the drop-out rate for class Ito VIII was 51 percent which is quite high.
At the secondary and higher secondary level, total enrolment for the age group 14-18 was about 40 percent though the drop-out rate for class Ito X was as high as 62 percent.
The country developed a huge infrastructure in higher education with 378 universities and 18,064 col-leges. 110 lakh students were enrolled in higher educa-tion institutions in 2005-06, as against only 34 lakhs in 1984-85. Of them, 89 percent are enrolled in under-graduate courses, 9 percent in post-graduate courses and only 0.6 percent in research and 1 percent in diploma and certificate courses. Gross Enrolment Ratio in higher education reached a level of 11 percent in 2004-05, though the world average was 23.2 percent. The country was able to establish institutions of excellence in the field of engineering, medicine and management. Besides this, national level research institutions in agriculture and science have been created. The result is that the country produces the second largest pool of educated and skilled manpower in the world - next only to China.
The development of a huge educational structure of 378 universities and 18,064 colleges, 1.52 lakh sec-ondary and higher secondary schools, and 10.43 lakh schools of primary and upper primary schools, is an achievement the country can be proud of.
A similar opinion was expressed by Professor D.T. Lakdawala, while reviewing national achievements after 40 years of planning, wrote: "There has been some satisfaction with the economic progress made by India on several fronts — the rate and diversity of economic growth, the increase in savings and investment, the almost entire self-reliance realised in foodgrains produc-tion, the high transformation in the structure of industry, the capacity in training highly skilled manpower so as to lead to an exportable surplus in certain lines, the exten-sion of normal and special banking facilities to hitherto unbanked areas and sectors, the unprecedented expan-sion of state, quasi-state and cooperative institutions in marketing and technical aid and guidance, etc. Some indicators of the quality of life like expectation of life at birth, death rate, infant mortality rate have also recorded a welcome change."'
From the credit side of the account, let us now turn to the debit side and focus attention on the fundamental failures of planning in India.
3. Lakdawala, D.T.,India - The Socialist Republic, (1988).
P. 1.

IN INDIA
rent at the was 18.2
and Higher m together, was of the
pride. Toss Enrol- mary level, s 51 percent
r level, total t 40 percent s high as 62
structure in 18,064 col-ter educa-34 lakhs in
in under-courses and liploma and ) in higher n 2004-05, fhe country
in the field ksides this, culture and the country
I and skilled
Lai structure i2 lakh sec-10.43 lakh
cools, is an
Professor :hievements s been some de by India if economic stment, the iins produc-of industry,
ower so as to the exten-
s to hitherto nted expan-stitutions in etc. Some ion of life at lso recorded
us now turn 'hindamental
4_ Sukhamoy Chakravarty, Development Planning, The Indian Experience (1987), p8.
.ublic, (1988),
PLANNING EXPERIENCE IN INDIA
Fundamental Failures of Planning In his book "Development Planning — the M-
ikan Experience" late Professor Sukhamoy Chakravarty points out to three major weaknesses and failures of bdian planning.
(a) A major defect is the gross inefficiency of production in many of the public sector enterprises. There are many areas of production where inefficiency is fairly widespread. as in the generation of power, trans-port, steel, fertilisers, let alone high cost consumer durables. There is no inherent reason why plant load factors in thermal power stations have to be around 50 per cent. There is much greater scope for improving the efficiency of the integrated steel plants.
(b) India has not been able to employ proportion-arely larger population in industry. The occupational structure has remained more or less unchanged.
(c) The planners did not comprehend the full set of logical implications of the Mahalanobis strategy of accelerated growth in the context of a mixed economy. To quote Professor Chakravarty here : " This showed that the process of industrialisation had ignored certain important issues relating to the phasing of investment outlay. But probably and more importantly, the inability Incarry out effective land reform in the early fifties when conditions had been reasonably opportune, along with d maintenance of largely unchanged input base of traditional agriculture, meant that the agrarian transition was left largely incomplete." 4
For over five decades, the Congress Government a the Centre — and even the coalition Governments which came to power at the Centre, for brief periods in between — have been constantly impressing upon the people of India that development planning in India aims ro build a socialist or socialistic pattern of society. The Governments have been proclaiming measures to achieve growth with justice, abolition of poverty (Garibi hatao), removal of exploitation and inequality of incomes, etc But then, it is not slogans or political catch-phrases that matter. The more relevant thing is whether we are mov-lig towards socialism or drifting away from it. The crucial question, therefore, is : whether the lot of the underdog, the weak and the under-privileged has im-proved? In other words, have the benefits of develop-ment percolated down to the lower layers of Indian society or have they been appropriated by a small group of the rich and the higher middle classes? It is the contention of many economists and non-political ob-servers that the poor in India have not really benefitted from economic planning and that, to a large extent, the rich have become richer while the vast majority of the poor — particularly the Dalits and the tribals — have remained hopelessly poor. Let us now spell out some of the basic failures of planning in India.
1. Failure to eliminate poverty. The basic objec-tive of planning is the provision of a national minimum
level of living. The " garibi hatao " ,(Remove poverty) slogan of Mrs. Indira Gandhi could be provided a mean-ingful content only if measures were taken to remove poverty. It was felt that growth rate per se would not be sufficient to remove poverty and, instead, it would be more desirable to undertake specific measures to remove poverty. Thus, poverty removal programmes were made an integral part of the Fifth Plan and subsequent plans. Prof. D.T. Lakdawala's Expert Group estimated that in 1973-74, about 55 per cent of population was living below the poverty line and in 1987-88, this proportion had come down to 39 per cent. Using a slightly modified methodology, the Planning Commission estimated that in 1993-94, 36 per cent of the population lived below the poverty line. In absolute terms, even after two decades, that is, between 1973-74 and 1993-94, the total number of poor remained around 320 million The fact that even after 4 decades of planning, 36 per cent of population lived under conditions of poverty is a sad commentary on our planning. In this connection, Professor P.R. Brahmananda wrote :
"Instead of attacking the problem of poverty di-rectly through wage-goods model, the authorities pre-ferred to initiate a number of anti-poverty and public distribution measures, which were simply in the nature of fire-fighting exercises with large leakages. No wonder that the magnitude of poverty continued to be close to 40 per cent even with a modest povertly line in 1993-94" 5
As per the methodology suggested by Tendulkar Committee, 45 percent population was below poverty line in 1993-94, which gradually reduced to 37.2 percent and 29.8 percent in 2004-05 and 2009-10 respectively.
In other words, all through, India had followed a blood transfusion approach which provided temporary relief. It would have been much better if India had followed a blood generation approach by emphasising sustainable employment creation.
2. Failure to provide employment to all able bodied persons. Another basic failure of planning in India was the emphasis on growth rather than on employ-ment and the adoption of capital-intensive production rather than labour intensive production. Despite the implementation of eight five year plans, unemployment has been on the increase. According to the Planning Commission, the backlog of unemployed persons was 5.3 million at the end of the First Plan and 7.5 million at the end of the Eighth Plan. The combined incidence of unemployment and underemployment would be about 10.5 per cent of the labour force at the end of 1996-97. Taking unemployed and under-employed together, at the beginning of the Tenth Plan i.e. 2001-02, 9.21 per cent of the labour force or 35 million persons were unem-ployed. As per 66th round of NSSO, we find all india unemployment rate of 6.6 percent. It is the considered opinion of experts that unless India adopts an employ-ment-oriented strategy and aims at 3 to 4 per cent annual increase of employment at higher levels of productivity, the chances of reaching the goal of full employment and alleviating under-employment would defy solution.
5. Brahmananda P.R. 50 Years of Free Indian Economy (1997), p 13.

310
3. Failure to reduce inequalities of income and wealth. It is rather doubtful that during the last five decades of planned economic development, redistribu-tion of income in favour of the less privileged classes has taken place. Between 1950-51 and 1973-74, per capita income rose by 1.5 per cent per annum. But even this small increase was unequally distributed. Prof. V.M.Dandekar and Neelkantha Rath concluded, from their study in 1971 that the condition of the bottom 20 per cent of the population had definitely deteriorated and for the next higher 20 per cent of the population had remained more or less stagnant. There was thus evidence of increased concentration of income and wealth in the hands of the propertied class. The Fourth Plan admitted this fact : "Another area where our effort so far has been feeble and halting is in narrowing the disparities in incomes and property ownership." 6
Another method of judging social justice relates to the rise in prices and changes in price structure. Prices of foodstuffs and essential consumer goods rose at a much higher rate than the prices of luxuries and semi-luxuries. Between 1990-91 and 1996-97, the general price index ( 1980-81 = 100) moved up by 72 per cent but the index of foodgrains prices shot up by 87 per cent. The prices of other consumer goods like sugar, matches, kerosene, cloth, vegetables etc., also moved at a faster rate vis-a-vis articles consumed by the upper classes. In a socialist economy, failure to control the prices of food and essential consumer goods is the denial of economic justice to the masses. The situation has been worsening over the years.
4. Failure to check the growth of black money. There is no doubt that speculative gains, illegitimate incomes of various forms through illicit gains of con-tractors, windfall profits from protected markets, semi-monopolistic conditions created by import restrictions and capital issues and corruption generated by licences and quota system in various fields of economic activity have all resulted in illicit income shifts in favour of upper income classes. Inflation, controls and the vast expansion of the public sector have bred corruption, tax evasion and illicit speculative gains. Thus, the fruits of economic progress instead of being shared by the masses flow into the pockets of the traders, businessmen and industrialists. The highly placed civil servants and the active politicians are all busy spinning money.
Fiscal measures to unearth unaccounted money have failed, and have actually buried the unaccounted money still deeper. Whereas the Govenment tries to unearth black money, the capitalists, the businessmen
PLANNING EXPERIENCE IN INDIA
and speculators are keen to devise ways and means to convert black money into private capital formation. So far in this tug-of-war, it is the capitalist class which has been successful in dodging the State. But unaccounted money has resulted in stimulating demand for prestige goods like scooters, cars, washing machines, television sets, air conditioners, etc. In other words, a part of the gains of illicit incomes is spent on conspicuous con-sumption.
5. Failure to reduce concentration of economic power. One of the main tenets of socialism as accepted by our planners is the reduction of concentration of economic power. But actually, monopoly has increased in India during the last 55 years, even though Jawaharlal Nehru had stated categorically: " Monopoly is the enemy of socialism". To reduce concentratiion of economic power and wealth in the hands of a few, the Government adopted fiscal and other measures regarding taxation, ownership of wealth and property, curtailment of luxu-rious consumption and provision of subsidies on necessaries. Although fiscal measures had a positive role to play, a near expropriatory tax rate structure remained only on paper and became the source of black money. Similarly, a system of heavy taxation on articles of luxurious consumption and provision of subsidies on necessaries was tried for many years as a part of a programme of social justice but without any result.
6. Failure to implement land reforms. One of the basic policy decisions to transfer ownership of land to the peasantry, for which efforts were made for four decades, was not properly implemented. It has been now admitted by the Government that progress of land re-forms had been rather slow and that the State govern-ments were not eager to implement them with a speed sufficient for a quick transition to progressive agricul-ture and socialism.
To sum up. The philosophical foundations of the planning policies and strategy were sound but there was crisis of implementation due to the existence of a gap between the theory and practice of socialist planning . The planning process has been able to create social and economic infrastructure, provide an industrial base by fostering the development of heavy and basic industries and enlarge educational opportunities, it failed to pro-vide employment to every able-bodied person, eliminate poverty and bring about institutional reforms leading to reduction in concentration of income and wealth. More-over, the benefits from economic development have accrued largely to the relatively affluent and those in urban areas.
SELECT REFERENCES Planning Commission (1992) Eighth Five Year Plan,
(1992-97), Vol. I.
Planning Commission ( 1999) Ninth Five Year Plan (1997-2002), Vol. L
Planning Commission Indian Planning Experience –A Statistical Profile (Feb. 1989).
S. Chakravarty, Development Planning – the Indian Experience.
6. Planning Commission, Fourth Five Year Plan—Draft Outline, p. 22.