02 intro graphics
TRANSCRIPT
8/10/2019 02 Intro Graphics
http://slidepdf.com/reader/full/02-intro-graphics 1/42
104 Student Guide
Copyright © 1994-2003, GE Fanuc International, Inc. 104 v7.0 - 04.03 2-1
2. Introduction to Graphics ____________________________________
Chapter 2
Introduction to Graphics

8/10/2019 02 Intro Graphics
http://slidepdf.com/reader/full/02-intro-graphics 2/42
FIX Fundamentals
Copyright © 1994-2003, GE Fanuc International, Inc. 104 v7.0 - 04.03 2-2
2. Introduction to Graphics__________________________________
Section Objectives
This section is the beginning of an ongoing discussion about graphics in FIX. There are many
aspects of the graphics package, however, all of these fall within two applications: Draw and
View. The Draw program provides the display designer with graphic text, animation, andcharting tools to create displays that are easy for the operator to understand. The View program
provides the operator with commands and means to interact with displays for actions such as
acknowledging alarms and changing process set points.
This section discusses the following Draw features:
• Object drawing tools
• Dynamic properties
• Data link
More features of the graphics package will be introduced in subsequent sections.
8/10/2019 02 Intro Graphics
http://slidepdf.com/reader/full/02-intro-graphics 3/42
104 Student Guide
Copyright © 1994-2003, GE Fanuc International, Inc. 104 v7.0 - 04.03 2-3
2. Introduction to Graphics__________________________________
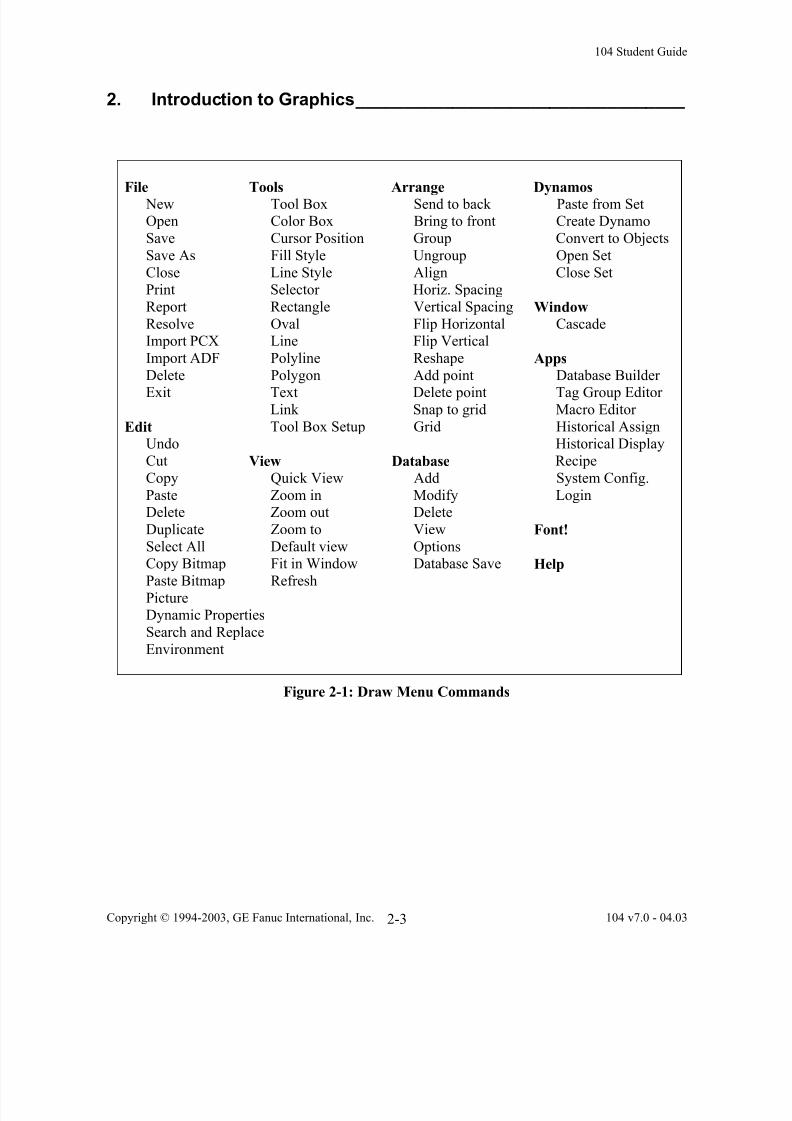
File Tools Arrange Dynamos New Tool Box Send to back Paste from SetOpen Color Box Bring to front Create Dynamo
Save Cursor Position Group Convert to Objects
Save As Fill Style Ungroup Open Set
Close Line Style Align Close SetPrint Selector Horiz. Spacing
Report Rectangle Vertical Spacing Window
Resolve Oval Flip Horizontal CascadeImport PCX Line Flip Vertical
Import ADF Polyline Reshape Apps
Delete Polygon Add point Database BuilderExit Text Delete point Tag Group Editor
Link Snap to grid Macro Editor
Edit Tool Box Setup Grid Historical AssignUndo Historical Display
Cut View Database Recipe
Copy Quick View Add System Config.
Paste Zoom in Modify LoginDelete Zoom out Delete
Duplicate Zoom to View Font!
Select All Default view Options
Copy Bitmap Fit in Window Database Save HelpPaste Bitmap Refresh
PictureDynamic Properties
Search and Replace
Environment
Figure 2-1: Draw Menu Commands

8/10/2019 02 Intro Graphics
http://slidepdf.com/reader/full/02-intro-graphics 4/42
FIX Fundamentals
Copyright © 1994-2003, GE Fanuc International, Inc. 104 v7.0 - 04.03 2-4
2.1. Drawing Tools __________________________________________
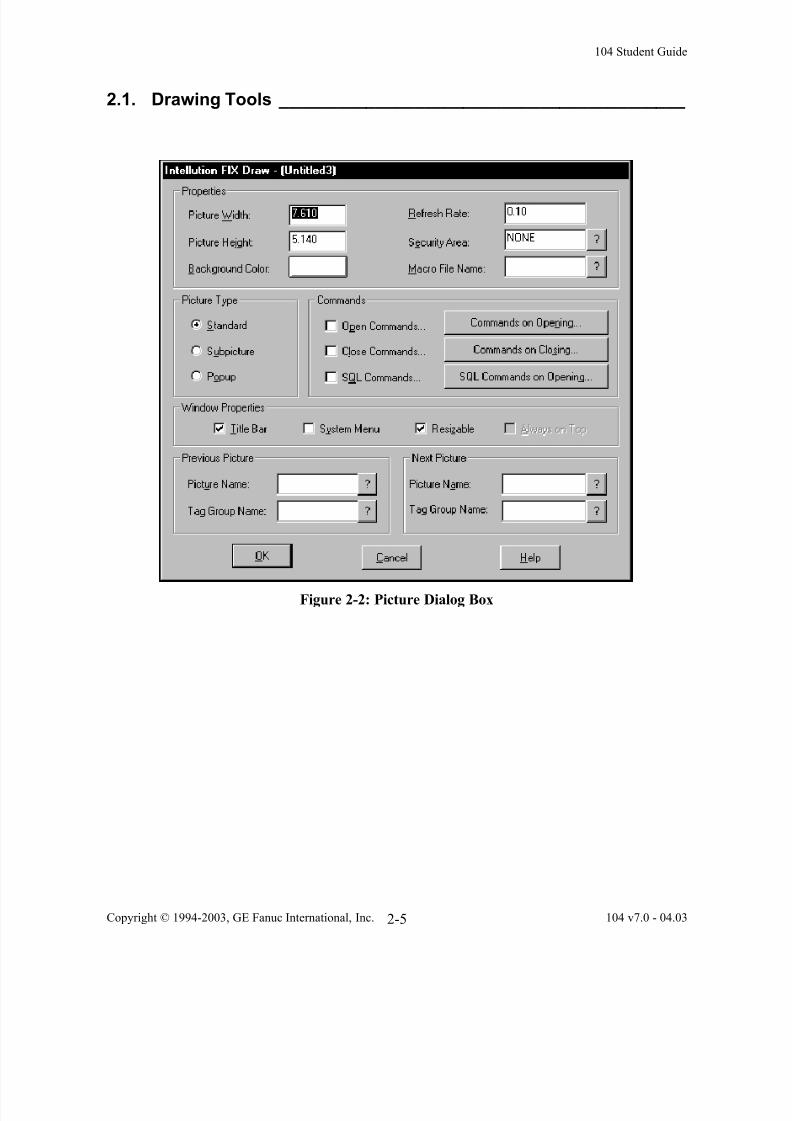
A. Picture Dialog Box
• Located in the Edit menu
• The Picture dialog box is used to modify display size and settings
• Key features of the Picture dialog box:
- Refresh Rate
◊ determines update time of all links
- Security Area
◊ allows access to the picture only if the user has access to thesecurity area
- Picture Types
◊ standard, subpicture, and popup options
- Commands on Open/Close
◊ executes command language script
- Previous and Next Pictures
◊ ties pictures together to form a logical sequence
- Tag Group Name
◊ allows a tag group file to be passed to previous and next pictures
◊ tag groups allow generic pictures to represent multiple
◊ lines/equipment
8/10/2019 02 Intro Graphics
http://slidepdf.com/reader/full/02-intro-graphics 5/42
104 Student Guide
Copyright © 1994-2003, GE Fanuc International, Inc. 104 v7.0 - 04.03 2-5
2.1. Drawing Tools __________________________________________
Figure 2-2: Picture Dialog Box

8/10/2019 02 Intro Graphics
http://slidepdf.com/reader/full/02-intro-graphics 6/42
FIX Fundamentals
Copyright © 1994-2003, GE Fanuc International, Inc. 104 v7.0 - 04.03 2-6
2.1. Drawing Tools __________________________________________
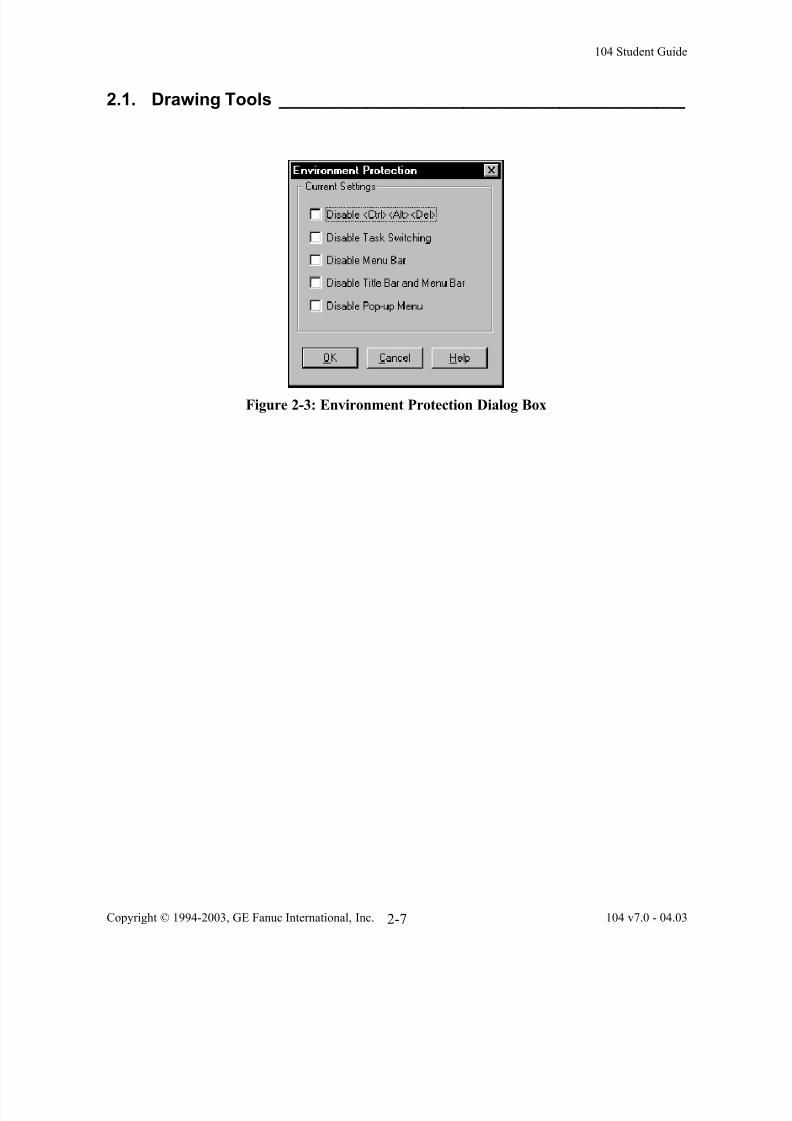
B. Environment Protection
• Located on the Edit menu in Draw
• Allows the developer to create a secure environment for View
• Settings:
- disable <Ctrl><Alt><Del>
◊ cannot reboot PC while running View
- disable Task Switching
◊ cannot switch to another program using the following:
<Alt><Tab>
<Ctrl><Esc>- disable Menu Bar
◊ menu bar in View is not available
◊ command language will be needed to maneuver within View
- disable Title Bar and Menu Bar
◊ program title and command bar do not appear in View
- disable Popup Menu
◊ right mouse button menu is not available in View
• Changes made in the Environment Protection affect all pictures in View on
this node
8/10/2019 02 Intro Graphics
http://slidepdf.com/reader/full/02-intro-graphics 7/42
104 Student Guide
Copyright © 1994-2003, GE Fanuc International, Inc. 104 v7.0 - 04.03 2-7
2.1. Drawing Tools __________________________________________
Figure 2-3: Environment Protection Dialog Box

8/10/2019 02 Intro Graphics
http://slidepdf.com/reader/full/02-intro-graphics 8/42
FIX Fundamentals
Copyright © 1994-2003, GE Fanuc International, Inc. 104 v7.0 - 04.03 2-8
2.1. Drawing Tools __________________________________________
C. Tool Box
• The Tool Box can be used instead of pull-down menu commands
• Open and close the Tool Box from the Tools menu
- See Figure 2-4 for an example of a typical Tool Box
• Objects can be created using the Tool Box or from the Tools menu
- See Figure 2-6 for a list of the most common draw objects
• Tool Box Setup:
- located on the Tools menu
- can be configured to contain commonly used Draw commands
- see Figure 2-5 for the Tool Box Setup dialog box
Figure 2-4: Typical Draw Tool Box

8/10/2019 02 Intro Graphics
http://slidepdf.com/reader/full/02-intro-graphics 9/42
104 Student Guide
Copyright © 1994-2003, GE Fanuc International, Inc. 104 v7.0 - 04.03 2-9
2.1. Drawing Tools __________________________________________
Figure 2-5: Tool Box Setup Dialog Box
Object Type Tool To Create...
Line Click once and drag.
Stop at desired length and release mouse.
Polyline Click once for each point.
Double-click to finish.
Polygon Click once for each point, and double-click to finish.
Closes itself, no need to match start and finish.
Rectangle Click once and drag.
Release at desired size.
Oval Click once and drag.
Release mouse at desired size.
Figure 2-6: Common Draw Objects
8/10/2019 02 Intro Graphics
http://slidepdf.com/reader/full/02-intro-graphics 10/42
FIX Fundamentals
Copyright © 1994-2003, GE Fanuc International, Inc. 104 v7.0 - 04.03 2-10
2.1. Drawing Tools __________________________________________
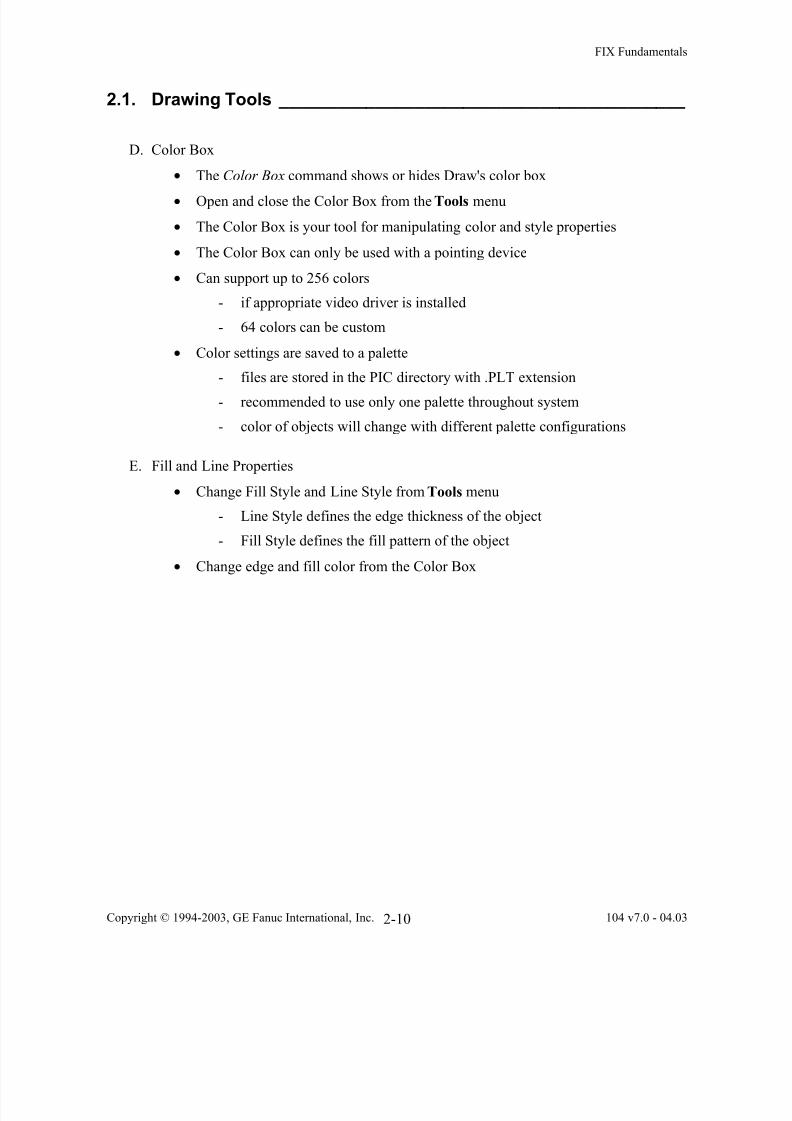
D. Color Box
• The Color Box command shows or hides Draw's color box
• Open and close the Color Box from the Tools menu
• The Color Box is your tool for manipulating color and style properties
• The Color Box can only be used with a pointing device
• Can support up to 256 colors
- if appropriate video driver is installed
- 64 colors can be custom
• Color settings are saved to a palette
- files are stored in the PIC directory with .PLT extension
- recommended to use only one palette throughout system
- color of objects will change with different palette configurations
E. Fill and Line Properties
• Change Fill Style and Line Style from Tools menu
- Line Style defines the edge thickness of the object
- Fill Style defines the fill pattern of the object
• Change edge and fill color from the Color Box
8/10/2019 02 Intro Graphics
http://slidepdf.com/reader/full/02-intro-graphics 11/42
104 Student Guide
Copyright © 1994-2003, GE Fanuc International, Inc. 104 v7.0 - 04.03 2-11
2.1. Drawing Tools __________________________________________
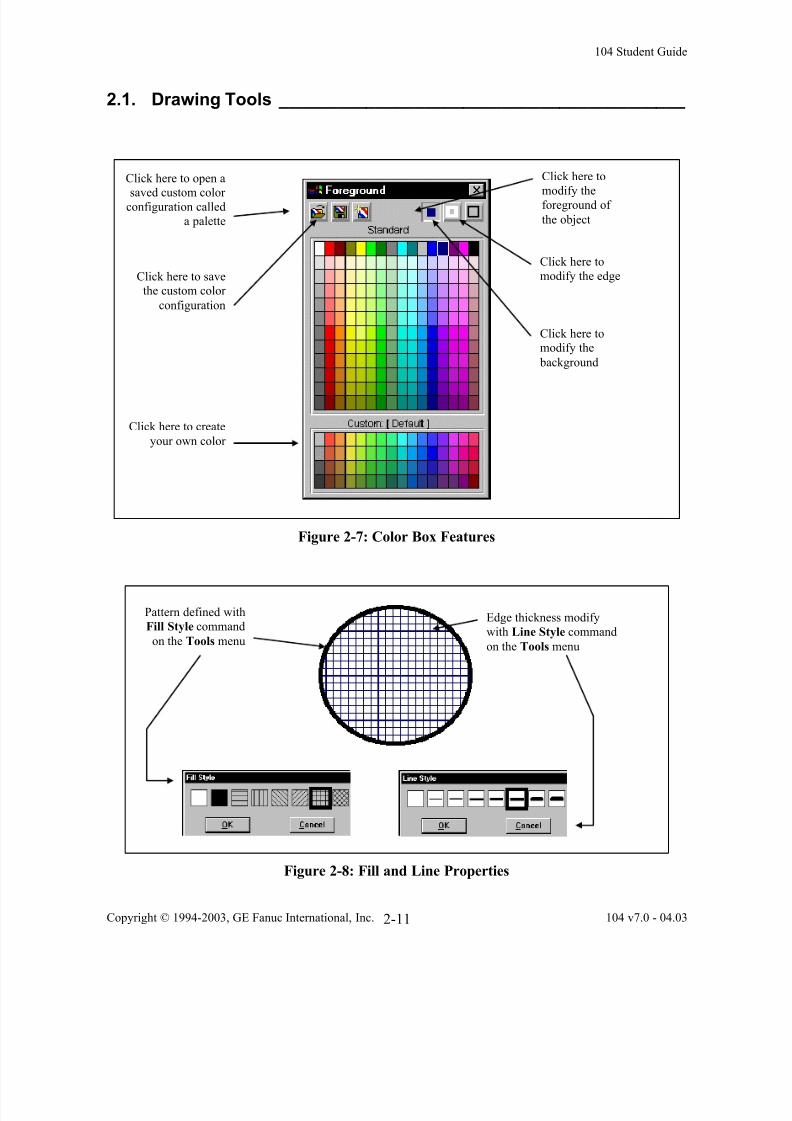
Figure 2-7: Color Box Features
Figure 2-8: Fill and Line Properties
Click here to open a
saved custom color configuration called
a palette
Click here to save
the custom color
configuration
Click here to
modify theforeground of
the object
Click here to
modify the edge
Click here to
modify the
background
Click here to create
your own color
Pattern defined with
Fill Style command
on the Tools menu
Edge thickness modify
with Line Style command
on the Tools menu

8/10/2019 02 Intro Graphics
http://slidepdf.com/reader/full/02-intro-graphics 12/42
FIX Fundamentals
Copyright © 1994-2003, GE Fanuc International, Inc. 104 v7.0 - 04.03 2-12
2.2. Dynamic Properties ______________________________________
A. Notes:
• Located in the Edit menu
• Object attributes that change based on changes in the process database
• Selections available are based on the object type
- unavailable selections are gray
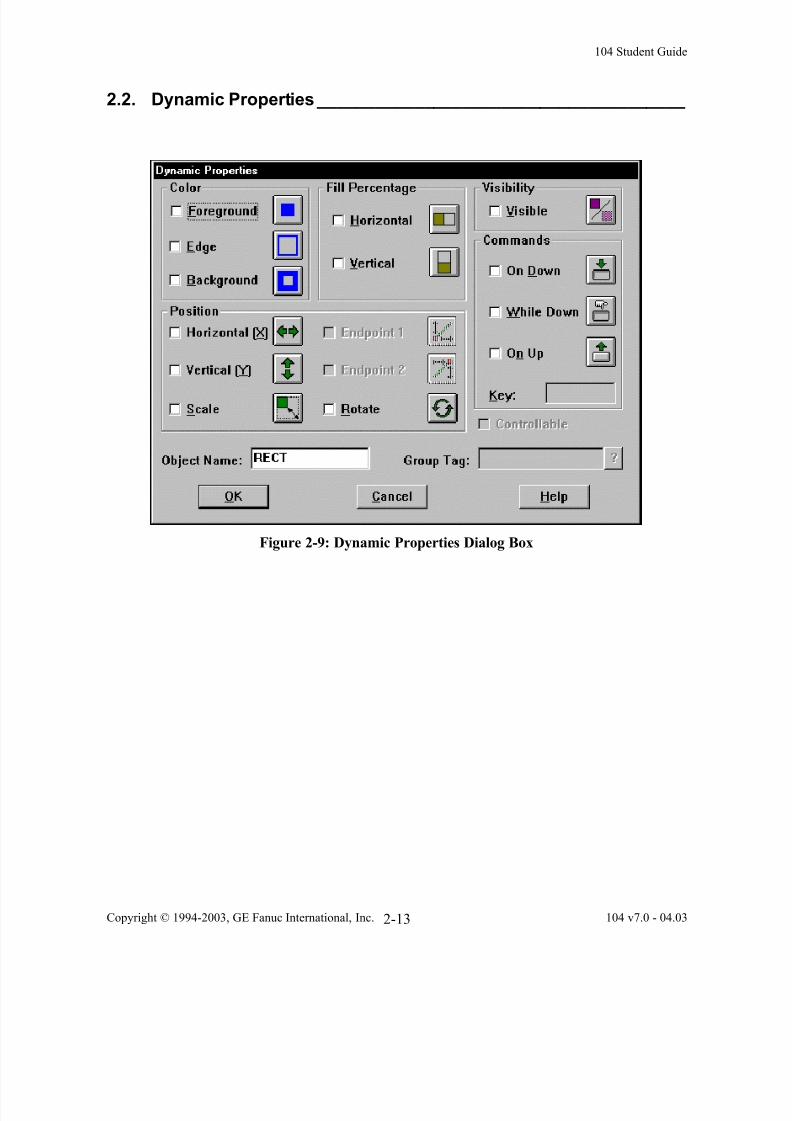
B. Dynamic Properties Overview
• Color
- change colors based on alarm condition or current value from the process
database
• Fill Percentage
- can fill an object up or down, left or right, or in combination
• Visible
- object appears or disappears based on a comparison of current value to
target value
• Commands
- executes a command script when object is selected
- options for when button is pressed, while button is held, and when button
is released• Position
- move, rotate, or scale objects based on values from the database
• Object Name
- use with the command language to quickly select the object
8/10/2019 02 Intro Graphics
http://slidepdf.com/reader/full/02-intro-graphics 13/42
104 Student Guide
Copyright © 1994-2003, GE Fanuc International, Inc. 104 v7.0 - 04.03 2-13
2.2. Dynamic Properties ______________________________________
Figure 2-9: Dynamic Properties Dialog Box

8/10/2019 02 Intro Graphics
http://slidepdf.com/reader/full/02-intro-graphics 14/42
FIX Fundamentals
Copyright © 1994-2003, GE Fanuc International, Inc. 104 v7.0 - 04.03 2-14
2.2. Dynamic Properties ______________________________________
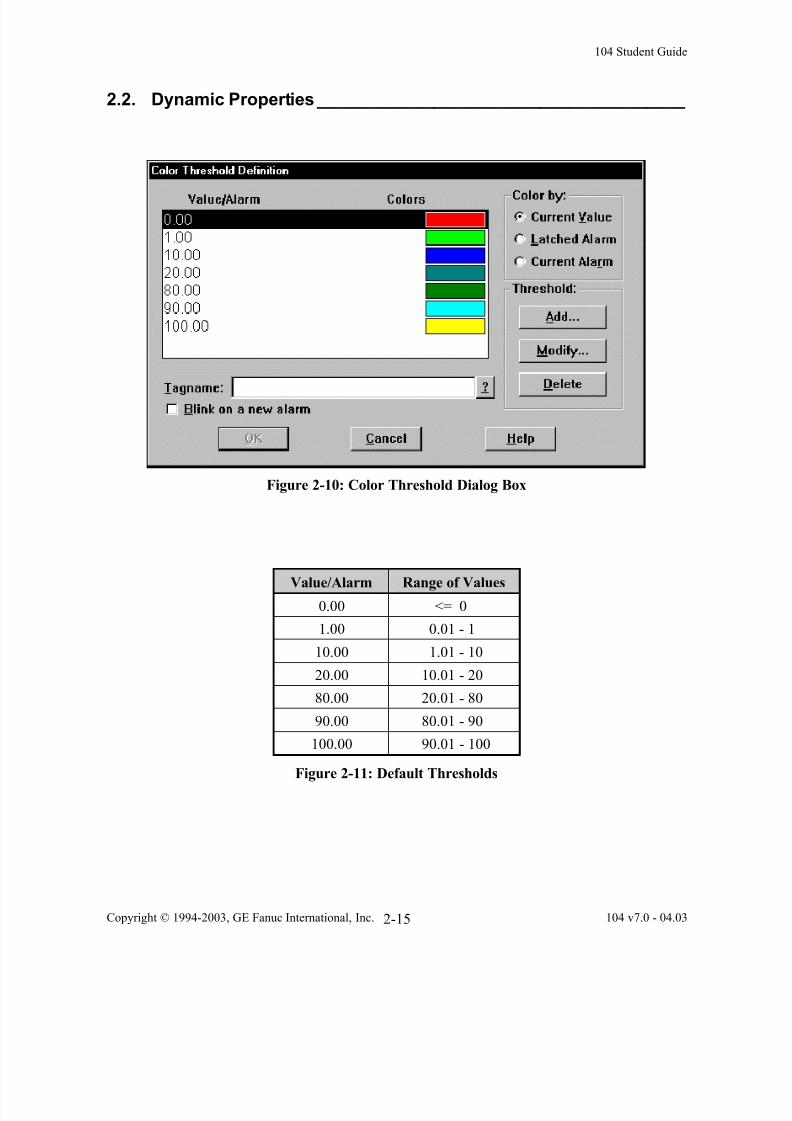
C. Color Threshold Definition
• ‘Color by’ radio buttons - three choices for color change:
- Current Value - default
- Latched Alarm - most severe unacknowledged tag alarm
- Current Alarm - current tag alarm status
• Thresholds
- default - shows values in range of 0.00 to 100.00
- if tag has a different EGU range, thresholds should be changed
- see Figure 2-11 for list of default threshold values
•
Alarm selections- defaults for alarms are based on Analog Input tag
- can select alarm conditions from a list when Modify is used
8/10/2019 02 Intro Graphics
http://slidepdf.com/reader/full/02-intro-graphics 15/42
104 Student Guide
Copyright © 1994-2003, GE Fanuc International, Inc. 104 v7.0 - 04.03 2-15
2.2. Dynamic Properties ______________________________________
Figure 2-10: Color Threshold Dialog Box
Value/Alarm Range of Values
0.00 <= 0
1.00 0.01 - 1
10.00 1.01 - 10
20.00 10.01 - 20
80.00 20.01 - 80
90.00 80.01 - 90
100.00 90.01 - 100
Figure 2-11: Default Thresholds

8/10/2019 02 Intro Graphics
http://slidepdf.com/reader/full/02-intro-graphics 16/42
FIX Fundamentals
Copyright © 1994-2003, GE Fanuc International, Inc. 104 v7.0 - 04.03 2-16
2.2. Dynamic Properties ______________________________________
D. Horizontal Position Definition
• Tagname
- used to read value from database to move object across screen
• Low/High Limits
- defines the range of values to use for movement
- does not have to correspond to the tag's Engineering Units
- using Fetch Limits pulls in the EGU values from the tag
• Minimum/Maximum Offset
- number of inches to move from starting point to reach the limit
- use positive or negative numbers to indicate the direction• Allow input properties
- allows writes to the tag as the object is dragged on screen
- usually used in conjunction with an output tag
- tag must be on scan to receive the value (for input tags)
E. Field Select Dialog Box
• Use to select the information without having to remember syntax
• Use to select N:T.F throughout the FIX software
• NODE:TAG.FIELD (N:T.F)
- node - SCADA node where the database resides
- tag - the name of the database block
- field:
F_ - for Numeric information
A_ - for Text data
- all fields for that tag type will be displayed
• Can use the asterisk wildcard in combination with the Filter field
• To search for a tagname, type the search specification in the Filter field and selectthe Filter button

8/10/2019 02 Intro Graphics
http://slidepdf.com/reader/full/02-intro-graphics 17/42
104 Student Guide
Copyright © 1994-2003, GE Fanuc International, Inc. 104 v7.0 - 04.03 2-17
2.2. Dynamic Properties ______________________________________
Figure 2-12: Horizontal Position Dialog Box
Figure 2-13: Field Select Dialog Box

8/10/2019 02 Intro Graphics
http://slidepdf.com/reader/full/02-intro-graphics 18/42
FIX Fundamentals
Copyright © 1994-2003, GE Fanuc International, Inc. 104 v7.0 - 04.03 2-18
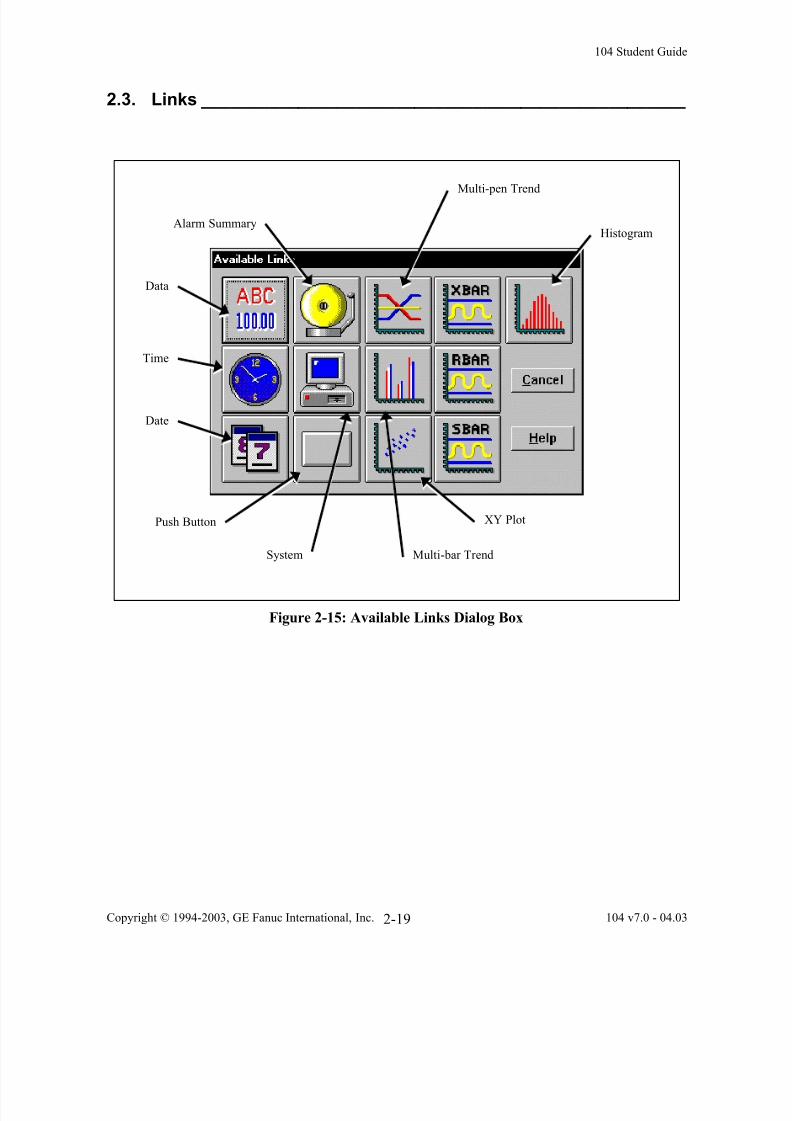
2.3. Links __________________________________________________
A. Notes:
• Located in the Tools menu and on the Tool Box
• Used to display real-time information from the database
• See Figure 2-14 for a description of link types
Link Selections Description
Data ASCII or Numeric database information.
Time Current system time.
Date Current system date.
Alarm Alarm Summary Display.
System Information about a SCADA node.
Button Perform command language script.
Multi-Pen Trend Plot of trend information.
Multi-Bar Trend Information in Bar Chart format.
Xbar Used with Statistical Process Control (SPC) tags for X-BAR analysis.
Rbar Used with SPC tags for R-BAR analysis.
Sbar Used with SPC tags for S-BAR analysis.
XY Plot Displays one process variable against another.
Histogram Frequency distribution.
Figure 2-14: Description of Link Types
8/10/2019 02 Intro Graphics
http://slidepdf.com/reader/full/02-intro-graphics 19/42
104 Student Guide
Copyright © 1994-2003, GE Fanuc International, Inc. 104 v7.0 - 04.03 2-19
2.3. Links __________________________________________________
Figure 2-15: Available Links Dialog Box
Data
Time
Date
Alarm Summary
Push Button
System Multi-bar Trend
XY Plot
Multi-pen Trend
Histogram

8/10/2019 02 Intro Graphics
http://slidepdf.com/reader/full/02-intro-graphics 20/42
FIX Fundamentals
Copyright © 1994-2003, GE Fanuc International, Inc. 104 v7.0 - 04.03 2-20
2.3. Links __________________________________________________
B. Data Link
• Located in the Link dialog box and on the Tool Box
• Displays ASCII or numeric information from the database
• Format Fields
- numeric data must be 7 digits or less, can do exponential
- text defines number of lines and characters per line
• Dynamic Coloring
- to color link based on alarm or current value
- similar to Dynamic Properties coloring
• Configure Data Entry- dialog box for selecting method of data entry
- clicking on each selection allows limits to be set on input
- see Figure 2-17 for Data Entry dialog box

8/10/2019 02 Intro Graphics
http://slidepdf.com/reader/full/02-intro-graphics 21/42
104 Student Guide
Copyright © 1994-2003, GE Fanuc International, Inc. 104 v7.0 - 04.03 2-21
2.3. Links __________________________________________________
Figure 2-16: Data Link Dialog Box
Figure 2-17: Choose Data Entry Method Dialog Box
8/10/2019 02 Intro Graphics
http://slidepdf.com/reader/full/02-intro-graphics 22/42
FIX Fundamentals
Copyright © 1994-2003, GE Fanuc International, Inc. 104 v7.0 - 04.03 2-22
2.4. __________________________________________ Lab Exercise 2
Draw & Data Links
Lab Exercise 2
8/10/2019 02 Intro Graphics
http://slidepdf.com/reader/full/02-intro-graphics 23/42
104 Student Guide
Copyright © 1994-2003, GE Fanuc International, Inc. 104 v7.0 - 04.03 2-23
______________________________________________ Lab Exercise 2
Learning Objectives:
Upon successful completion of this lab exercise the student, using the appropriate procedures, will be able to:
• Display information in Draw and View.
• Create objects in Draw.
• Retrieve and manipulate existing objects using Dynamos.
• Add and modify data links.
• Configure an object to exhibit dynamic properties.
References:
• The FIX™ for Windows On-line Help
• The FIX™ for Windows Electronic Documentation
Introduction:
This lab exercise covers the steps involved in creating a picture. The student will build a
graphical depiction of a tank, piping, and a valve using several features in Draw. In addition,
the student will use Data Links to connect the picture to the database. View will be used to
monitor the data in real-time.

8/10/2019 02 Intro Graphics
http://slidepdf.com/reader/full/02-intro-graphics 24/42
FIX Fundamentals
Copyright © 1994-2003, GE Fanuc International, Inc. 104 v7.0 - 04.03 2-24
______________________________________________ Lab Exercise 2
Lab Information
In our lab example we are monitoring a tank, or reservoir, that supplies concentrate to severalmixing stations. Tags to monitor the tank level and the flow out of the tank through one
conveyor, are pre-loaded into your database. You will create a picture to display this
information in both graphical and numerical formats.
Several of the tank connections displayed on the picture are contained in Dynamo sets. Use
the commands in the Dynamo selection of the Draw menu bar to add these Dynamos. Otherequipment, such as the tank and a section of the piping, use the rectangle and polyline tools.
Once you have created the graphics, the data links will be added.
At the completion of the lab your drawing should look similar to Figure 2-18. Use this picture as a guide to your screen layout.
Figure 2-18: CONC.ODF Picture

8/10/2019 02 Intro Graphics
http://slidepdf.com/reader/full/02-intro-graphics 25/42
104 Student Guide
Copyright © 1994-2003, GE Fanuc International, Inc. 104 v7.0 - 04.03 2-25
______________________________________________ Lab Exercise 2
A. Open a New Picture
Create a new picture to display information using the following steps:
1. Double click the Draw icon in the Intellution FIX group.
The Draw window appears.
2. From the File menu, select New.
The New dialog box appears.
3. Select Luge and click OK .
The following template appears on the screen:

8/10/2019 02 Intro Graphics
http://slidepdf.com/reader/full/02-intro-graphics 26/42
FIX Fundamentals
Copyright © 1994-2003, GE Fanuc International, Inc. 104 v7.0 - 04.03 2-26
______________________________________________ Lab Exercise 2
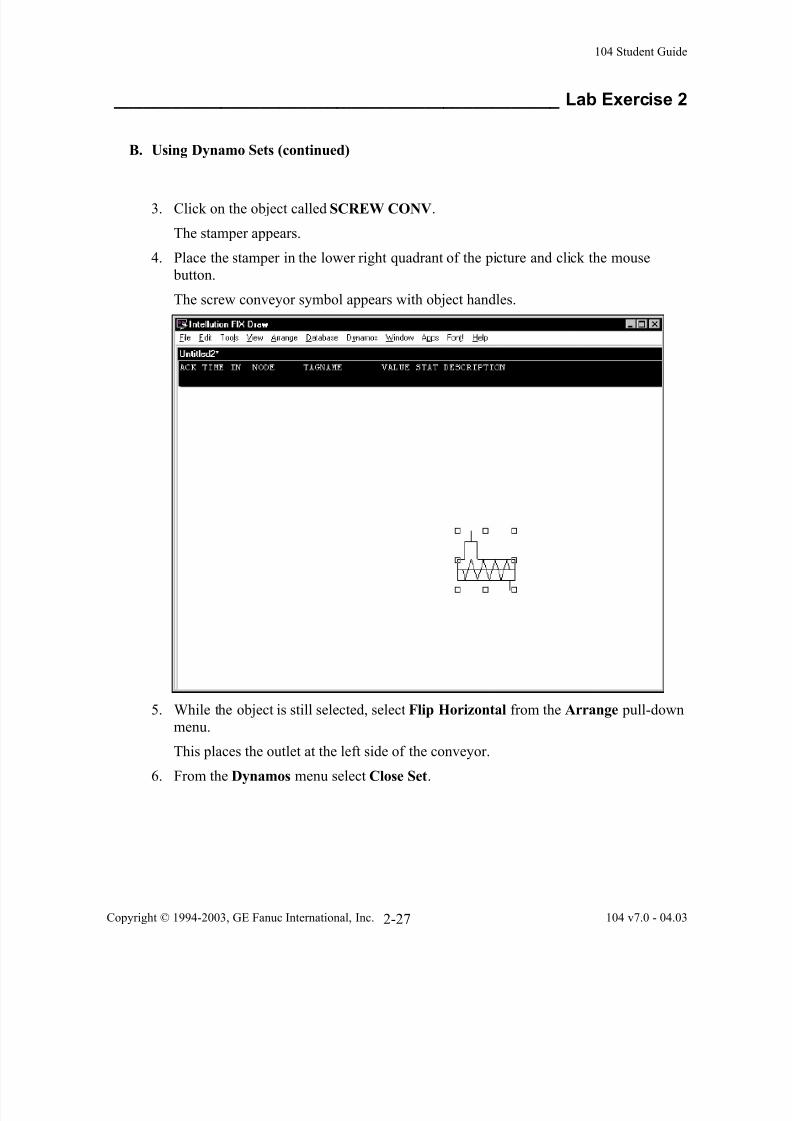
B. Using Dynamo Sets
Use the following steps to add symbols to the picture that graphically represent some of
the equipment.
1. From the Dynamos menu select Paste From Set.
The Open Dynamo Set dialog box appears:
2. Scroll down the list to highlight isa-s55c and click OK .
The isa-s55c Dynamo set appears.
8/10/2019 02 Intro Graphics
http://slidepdf.com/reader/full/02-intro-graphics 27/42
8/10/2019 02 Intro Graphics
http://slidepdf.com/reader/full/02-intro-graphics 28/42
FIX Fundamentals
Copyright © 1994-2003, GE Fanuc International, Inc. 104 v7.0 - 04.03 2-28
______________________________________________ Lab Exercise 2
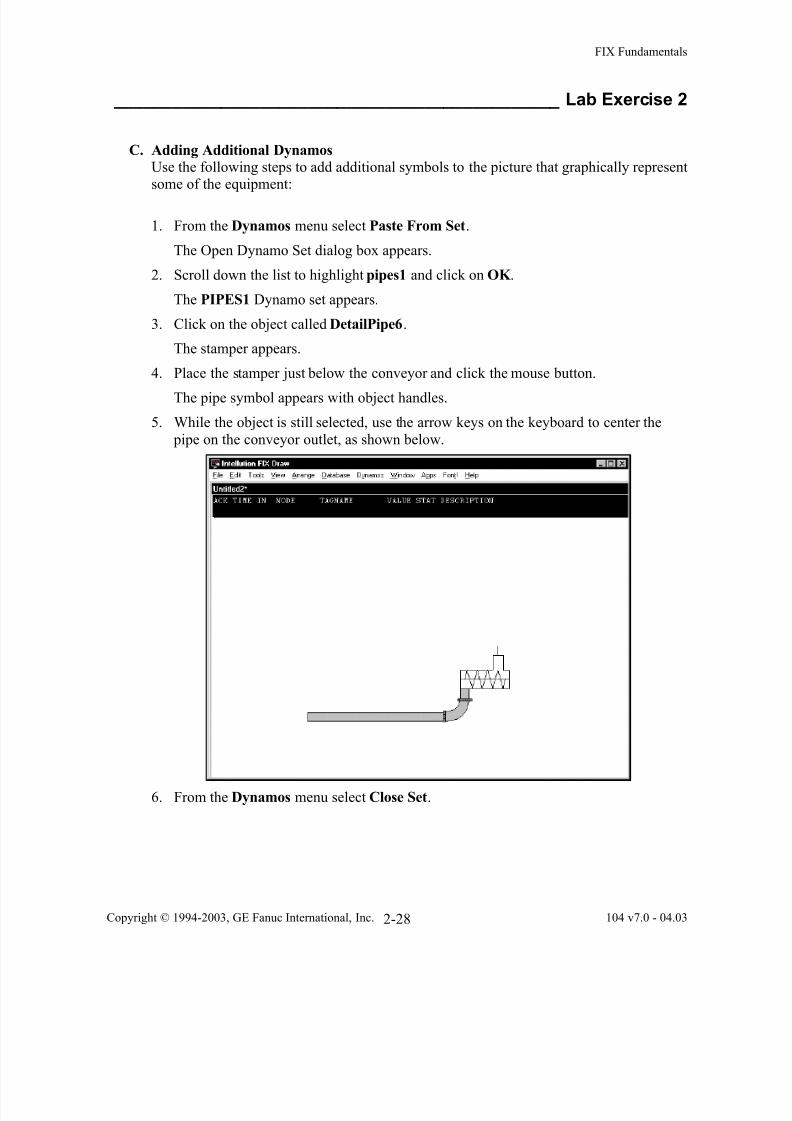
C. Adding Additional Dynamos
Use the following steps to add additional symbols to the picture that graphically represent
some of the equipment:
1. From the Dynamos menu select Paste From Set.
The Open Dynamo Set dialog box appears.
2. Scroll down the list to highlight pipes1 and click on OK .
The PIPES1 Dynamo set appears.
3. Click on the object called DetailPipe6.
The stamper appears.
4. Place the stamper just below the conveyor and click the mouse button.The pipe symbol appears with object handles.
5. While the object is still selected, use the arrow keys on the keyboard to center the
pipe on the conveyor outlet, as shown below.
6. From the Dynamos menu select Close Set.

8/10/2019 02 Intro Graphics
http://slidepdf.com/reader/full/02-intro-graphics 29/42
104 Student Guide
Copyright © 1994-2003, GE Fanuc International, Inc. 104 v7.0 - 04.03 2-29
______________________________________________ Lab Exercise 2
D. Add Valves and Piping to the Picture
Use the following steps to add objects to the picture that represent the valve and piping
into the conveyor:
NOTE: Remember that any object, symbol or dynamo can be resized and relocated toaccommodate your screen layout.
1. From the Tools menu (or from the Tool Box ), select Rectangle,.
2. Draw a rectangular pipe to the conveyor inlet as shown in the figure below.
3. From the Dynamos menu select Paste From Set.
The Open Dynamo Set dialog box appears.
4. Select valves! and click OK .
The VALVES! Dynamo set appears.
5. Click on the object named Valve16.The stamper appears.
6. Place the stamper atop the pipe created in steps 1 and 2 and click.
The Dynamo Properties box appears prompting you to “Enter Digital Tagname”
Rectangular
Pipe

8/10/2019 02 Intro Graphics
http://slidepdf.com/reader/full/02-intro-graphics 30/42
FIX Fundamentals
Copyright © 1994-2003, GE Fanuc International, Inc. 104 v7.0 - 04.03 2-30
______________________________________________ Lab Exercise 2
D. Add Valves and Piping to the Picture (continued)
7. Enter SCADA?:TNK1V1STAT (Tank1 Valve1 status), and click OK .
Where SCADA? represents your local node name.
The following dialog box appears stating that the tag does not exist:
8. Click on Use Anyway. (You will create the block in a subsequent lab.)
The valve symbol appears with object handles.
9. From the Dynamos menu select Close Set.
10. From the Dynamos menu select Paste From Set.
The Open Dynamo Set dialog box appears.
11. Select pipes2 and click OK .
The PIPES2 Dynamo set appears.
12. Click on the object named Funnel1.
The stamper appears.
13. Place the stamper atop the valve and click the mouse button.
The funnel symbol appears with object handles
14. While the object is still selected, use the arrow keys on the keyboard to center the
funnel on the valve.
15. From the Dynamos menu select Close Set.

8/10/2019 02 Intro Graphics
http://slidepdf.com/reader/full/02-intro-graphics 31/42
104 Student Guide
Copyright © 1994-2003, GE Fanuc International, Inc. 104 v7.0 - 04.03 2-31
______________________________________________ Lab Exercise 2
E. Grouping and Manipulating Objects
Add additional objects using the rectangle and the polyline tools to represent a tank as
illustrated below:
1. From the Tools menu (or from the Tool Box ), select Rectangle,.
2. Draw a rectangle to represent the tank contents as shown below.
3. With the rectangle selected, select Line Style from the Tools menu.
The Line Style selection box appears.
4. Select the leftmost box (zero line thickness) and click on OK .
The tank fill appears as a rectangle of foreground color without an outline.
5. With the rectangle selected, select a foreground color from the Color Box that, to you,represents orange concentrate.
6. From the toolbox, or from the Tools menu, select Polyline.

8/10/2019 02 Intro Graphics
http://slidepdf.com/reader/full/02-intro-graphics 32/42
FIX Fundamentals
Copyright © 1994-2003, GE Fanuc International, Inc. 104 v7.0 - 04.03 2-32
______________________________________________ Lab Exercise 2
E. Grouping and Manipulating Objects (continued)
7. Draw a tank outline around three sides of the tank contents as shown below.
Make the top of tank extend beyond the top of the rectangle that represents the tank
contents.
8. Use the Reshape command from the Arrange menu to align the tank sides with the
rectangular fill.
9. With the polyline selected, select Line Style from the Tools menu.
The Line Style selection box appears.
Rectangle
Polyline

8/10/2019 02 Intro Graphics
http://slidepdf.com/reader/full/02-intro-graphics 33/42
104 Student Guide
Copyright © 1994-2003, GE Fanuc International, Inc. 104 v7.0 - 04.03 2-33
______________________________________________ Lab Exercise 2
E. Grouping and Manipulating Objects (continued)
10. Select a line thickness for the thickness of your tank and click OK .
The tank cross-section appears as three sides of the tank holding the concentrate.
11. With the polyline selected, choose, from the Color box, the edge color that is to be the
color of your tank.
12. While the polyline is selected, hold down the Shift key and click on the tank fillrectangle.
Both objects are now selected.
Note: You can also use the Selector from the Tools menu to select multiple objects
within an area. Move the pointer to the upper left corner of the area and hold themouse button while dragging the mouse. Expand the area to include the objects to be selected and release the mouse button.
13. Relocate the selected objects together so that they are centered over the funnel.
Use the mouse or keyboard arrow keys to adjust the two selected objects.

8/10/2019 02 Intro Graphics
http://slidepdf.com/reader/full/02-intro-graphics 34/42
FIX Fundamentals
Copyright © 1994-2003, GE Fanuc International, Inc. 104 v7.0 - 04.03 2-34
______________________________________________ Lab Exercise 2
F. Adding Text to the picture
Text labels provide you with an easy method of identifying information. Add text labels
to the picture using the following steps:
1. If it is not already on the screen, select the Tool Box from the Tools menu.
The Tool Box appears on the picture.
If the Tool Box covers an area in the picture that you need to modify, use the mouseto move it to a more convenient location.
2. Select the Text icon from the Tool Box, or from the Tools pull-down menu.
3. Add the text as it appears in the figure below.
Align and Vertical Spacing (from Arrange menu) and Duplicate (from Edit menu)
can facilitate the formatting and addition of text labels.

8/10/2019 02 Intro Graphics
http://slidepdf.com/reader/full/02-intro-graphics 35/42
104 Student Guide
Copyright © 1994-2003, GE Fanuc International, Inc. 104 v7.0 - 04.03 2-35
______________________________________________ Lab Exercise 2
G. Adding Links to the picture
Links are the connection between the real-time process database and the pictures. Add
links to the picture, to display information about the tags, using the following procedure:
1. From the Tools menu, select Link .
The Available Links dialog box appears.
2. Click the Data Link icon.
The Data Link is the upper left selection in the Available Links dialog box.
The Link Stamper appears.
3. Locate the data link by placing the stamper as shown below and clicking.
Place
stamper
here
8/10/2019 02 Intro Graphics
http://slidepdf.com/reader/full/02-intro-graphics 36/42
FIX Fundamentals
Copyright © 1994-2003, GE Fanuc International, Inc. 104 v7.0 - 04.03 2-36
______________________________________________ Lab Exercise 2
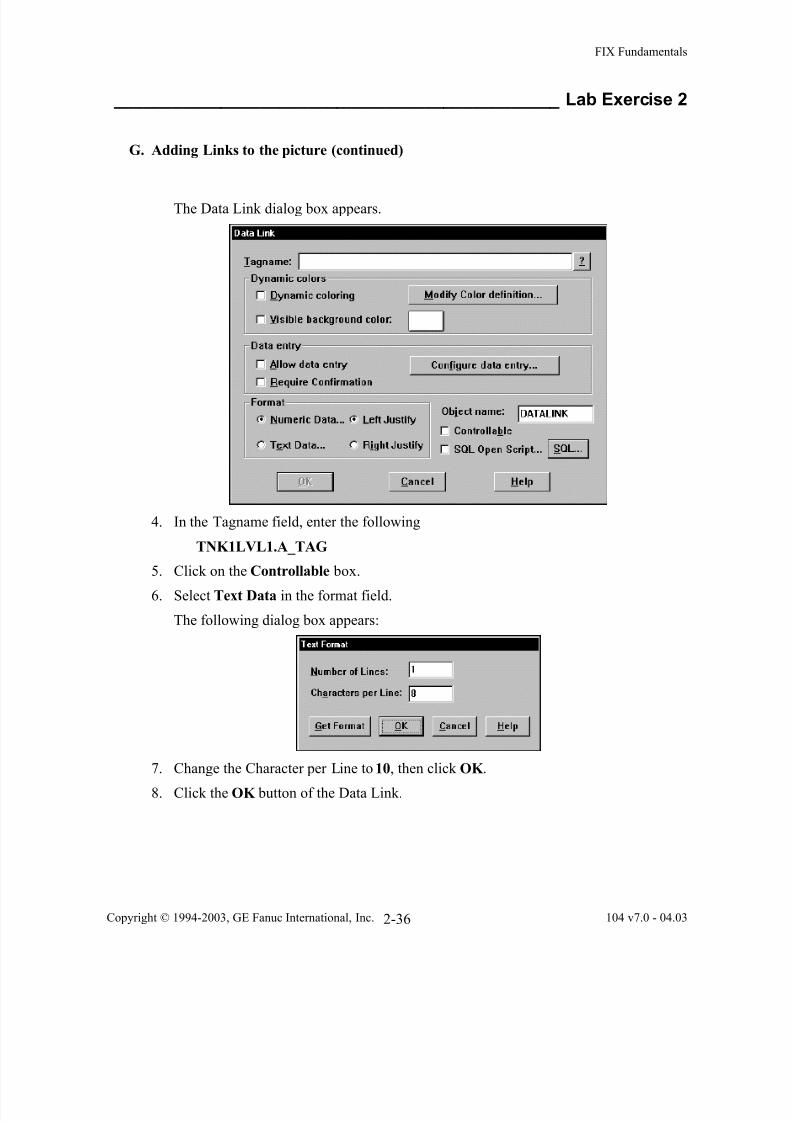
G. Adding Links to the picture (continued)
The Data Link dialog box appears.
4. In the Tagname field, enter the following
TNK1LVL1.A_TAG
5. Click on the Controllable box.
6. Select Text Data in the format field.
The following dialog box appears:
7. Change the Character per Line to 10, then click OK .
8. Click the OK button of the Data Link.
8/10/2019 02 Intro Graphics
http://slidepdf.com/reader/full/02-intro-graphics 37/42
104 Student Guide
Copyright © 1994-2003, GE Fanuc International, Inc. 104 v7.0 - 04.03 2-37
______________________________________________ Lab Exercise 2
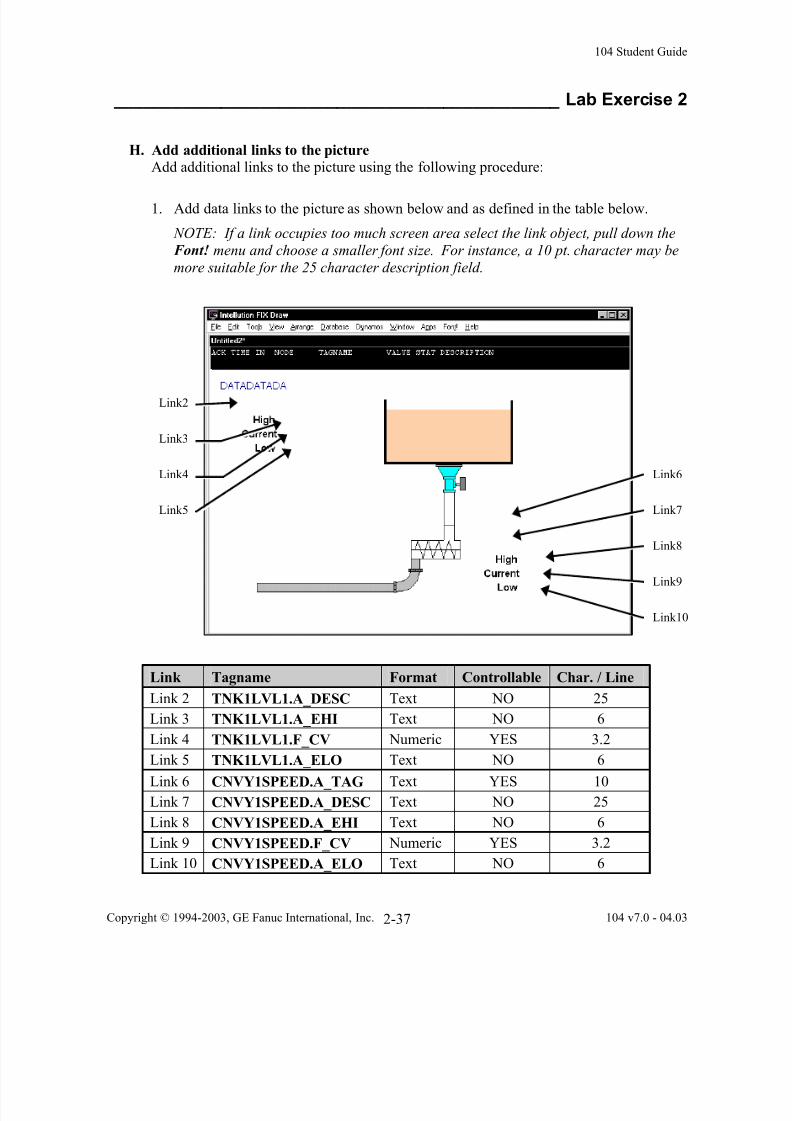
H. Add additional links to the picture
Add additional links to the picture using the following procedure:
1. Add data links to the picture as shown below and as defined in the table below.
NOTE: If a link occupies too much screen area select the link object, pull down theFont! menu and choose a smaller font size. For instance, a 10 pt. character may be
more suitable for the 25 character description field.
Link Tagname Format Controllable Char. / Line
Link 2 TNK1LVL1.A_DESC Text NO 25
Link 3 TNK1LVL1.A_EHI Text NO 6
Link 4 TNK1LVL1.F_CV Numeric YES 3.2
Link 5 TNK1LVL1.A_ELO Text NO 6
Link 6 CNVY1SPEED.A_TAG Text YES 10
Link 7 CNVY1SPEED.A_DESC Text NO 25
Link 8 CNVY1SPEED.A_EHI Text NO 6
Link 9 CNVY1SPEED.F_CV Numeric YES 3.2
Link 10 CNVY1SPEED.A_ELO Text NO 6
Link2
Link3
Link5
Link6
Link7
Link8
Link9
Link10
Link4

8/10/2019 02 Intro Graphics
http://slidepdf.com/reader/full/02-intro-graphics 38/42
FIX Fundamentals
Copyright © 1994-2003, GE Fanuc International, Inc. 104 v7.0 - 04.03 2-38
______________________________________________ Lab Exercise 2
I. Assigning Dynamic Properties
Dynamic Properties allow you to graphically represent changes in value and alarm state
using color, size and position changes in an object. This lab uses the tankfill rectangle toshow the changing tank level by changing the level within the tankfill, based on a level
measurement. The level is read by the tag TNK1LVL1 and its value is assigned to theVertical Fill property.
1. Click on the tankfill Rectangle.
Object handles appear around the tankfill.
2. From the Edit menu, select Dynamic Properties.
The following dialog box appears.

8/10/2019 02 Intro Graphics
http://slidepdf.com/reader/full/02-intro-graphics 39/42
104 Student Guide
Copyright © 1994-2003, GE Fanuc International, Inc. 104 v7.0 - 04.03 2-39
______________________________________________ Lab Exercise 2
I. Assigning Dynamic Properties (continued)
3. Click on the Vertical Fill Percentage box.
The following box appears:
4. In the tagname field, enter the following:
TNK1LVL1
5. Click the Fetch Limits button to get the high and low engineering limits.
6. Click OK twice to complete.
8/10/2019 02 Intro Graphics
http://slidepdf.com/reader/full/02-intro-graphics 40/42

8/10/2019 02 Intro Graphics
http://slidepdf.com/reader/full/02-intro-graphics 41/42
104 Student Guide
Copyright © 1994-2003, GE Fanuc International, Inc. 104 v7.0 - 04.03 2-41
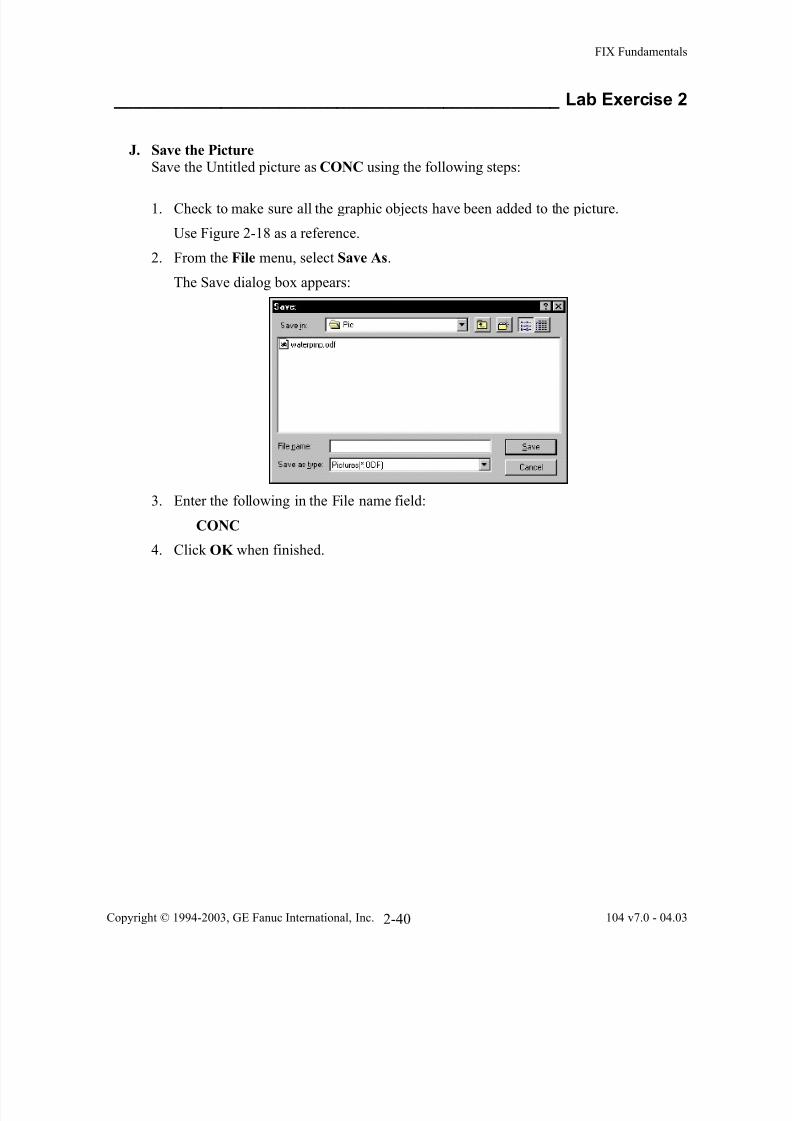
______________________________________________ Lab Exercise 2
K. View
The View program shows the graphics that were created in the Draw program. In
addition, the links will now be updated with the most current information from thedatabase. View the picture just created using the following steps:
1. Select QuickView from the View menu.
As FIX enters the View program, a Data Retrieval dialog box appears to remind us
that we have not yet built the block (TNK1V1STAT) that we assigned to the Valve16
dynamo.
2. Click on Skip One.
The screen is displayed in View.
NOTE: If question marks appear in the current value links for TNK1LVL1 and
CNVY1SPEED, the tags are not on scan. Turn the tags on scan by selecting thecurrent value link for the tag and selecting On Scan from the Commands menu.
End of Lab Exercise

8/10/2019 02 Intro Graphics
http://slidepdf.com/reader/full/02-intro-graphics 42/42
FIX Fundamentals
______________________________________________ Lab Exercise 2
this page intentionally contains no data