03 consol idated f inancial statements and notesgeschaeftsbericht2013-14.tui-group.com/sites/... ·...
TRANSCRIPT
03
CONSOLIDATED FINANCIAL STATEMENTS AND NOTES150 Consolidated Financial Statements
150 Income Statement
151 Statement of Comprehensive Income
152 Financial Position
154 Statement of Changes in Group Equity
156 Cash Flow Statement
157 Notes
157 Principles and Methods Underlying the
Consolidated Financial Statements
184 Segment Reporting
192 Notes to the Consolidated Income Statement
202 Notes to the Consolidated Statement of Financial Position
259 Notes to the Cash Flow Statement
261 Other Notes
283 Responsibility Statement by Management
284 Independent Auditors’ Report
286 Forward-looking Statements

150 C O N S O L I D AT E D F I N A N C I A L S TAT E M E N T S Income Statement
CO N S O L I D AT E D F I N A N C I A L S TAT E M E N T S
I N C O M E S TAT E M E N T O F T H E T U I G R O U P F O R T H E P E R I O D F R O M 1 O C T 2 0 13 T O 3 0 S E P 2 0 1 4
€ million
Notes 2013 / 14 2012 / 13
restated
Turnover (1) 18,714.7 18,477.5
Cost of sales (2) 16,436.6 16,436.3
Gross pro�t 2,278.1 2,041.2
Administrative expenses (2) 1,577.3 1,557.3
Other income (3) 35.9 37.1
Other expenses (3) 2.1 10.8
Impairment of goodwill (4) – 8.3
Financial income (5) 36.2 42.7
Financial expenses (6) 305.2 292.5
Share of result of joint ventures and associates (7) + 40.0 + 59.3
Earnings before income taxes 505.6 311.4
Reconciliation to underlying earnings:
Earnings before income taxes 505.6 311.4
plus: Loss on Container Shipping measured at equity 38.9 22.3
plus: Net Interest expense and expense from the measurement
of interest hedges 229.3 252.8
plus: Impairment of goodwill – 8.3
EBITA 773.8 594.8
Adjustments: (8)
less: Gain on disposals (prior year loss) – 3.6 1.4
plus: Restructuring expense 43.6 62.3
plus: Expense from purchase price allocation 73.7 75.0
less: Income (prior year expense) from other one-o§ items – 19.0 28.4
Underlying EBITA 868.5 761.9
Earnings before income taxes 505.6 311.4
Income taxes (9) 221.7 145.0
Group pro�t for the year 283.9 166.4
Group pro�t for the year attributable to shareholders of TUI AG (10) 104.7 – 11.1
Group pro�t for the year attributable to non-controlling interest (11) 179.2 177.5
E A R N I N G P E R S H A R E
€
Notes 2013 / 14 2012 / 13
restated
Basic and diluted earnings per share (12) 0.31 – 0.14
151Statement of Comprehensive Income C O N S O L I D AT E D F I N A N C I A L S TAT E M E N T S
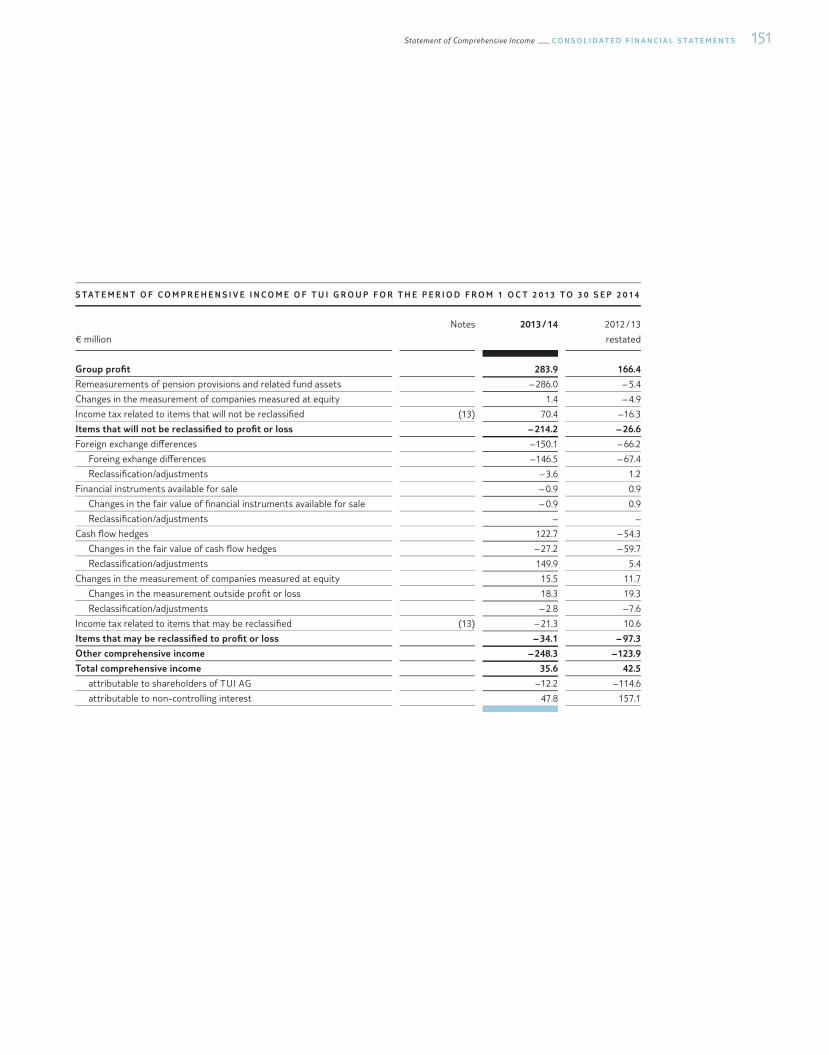
S TAT E M E N T O F C O M P R E H E N S I V E I N C O M E O F T U I G R O U P F O R T H E P E R I O D F R O M 1 O C T 2 0 13 T O 3 0 S E P 2 0 1 4
€ million
Notes 2013 / 14 2012 / 13
restated
Group pro�t 283.9 166.4
Remeasurements of pension provisions and related fund assets – 286.0 – 5.4
Changes in the measurement of companies measured at equity 1.4 – 4.9
Income tax related to items that will not be reclassi�ed (13) 70.4 – 16.3
Items that will not be reclassi�ed to pro�t or loss – 214.2 – 26.6
Foreign exchange di§erences – 150.1 – 66.2
Foreing exhange di§erences – 146.5 – 67.4
Reclassi�cation/adjustments – 3.6 1.2
Financial instruments available for sale – 0.9 0.9
Changes in the fair value of �nancial instruments available for sale – 0.9 0.9
Reclassi�cation/adjustments – –
Cash ®ow hedges 122.7 – 54.3
Changes in the fair value of cash ®ow hedges – 27.2 – 59.7
Reclassi�cation/adjustments 149.9 5.4
Changes in the measurement of companies measured at equity 15.5 11.7
Changes in the measurement outside pro�t or loss 18.3 19.3
Reclassi�cation/adjustments – 2.8 – 7.6
Income tax related to items that may be reclassi�ed (13) – 21.3 10.6
Items that may be reclassi�ed to pro�t or loss – 34.1 – 97.3
Other comprehensive income – 248.3 – 123.9
Total comprehensive income 35.6 42.5
attributable to shareholders of TUI AG – 12.2 – 114.6
attributable to non-controlling interest 47.8 157.1
152 C O N S O L I D AT E D F I N A N C I A L S TAT E M E N T S Financial Position
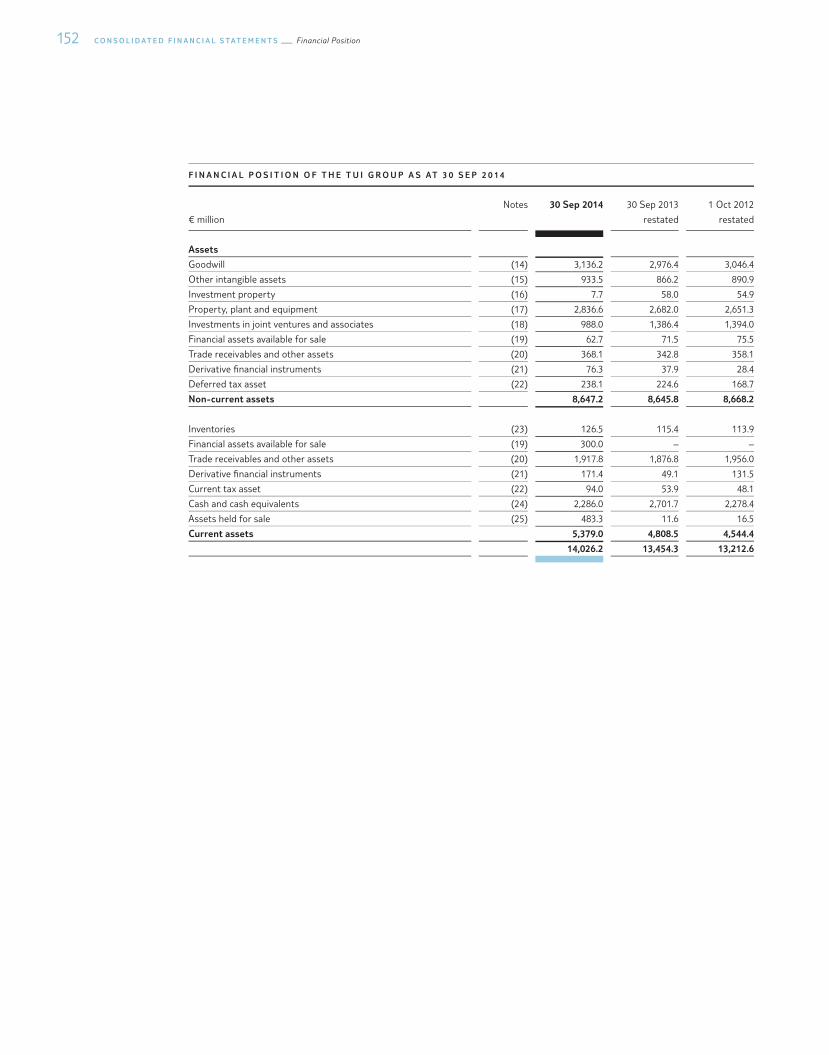
F I N A N C I A L P O S I T I O N O F T H E T U I G R O U P A S AT 3 0 S E P 2 0 1 4
€ million
Notes 30 Sep 2014 30 Sep 2013
restated
1 Oct 2012
restated
Assets
Goodwill (14) 3,136.2 2,976.4 3,046.4
Other intangible assets (15) 933.5 866.2 890.9
Investment property (16) 7.7 58.0 54.9
Property, plant and equipment (17) 2,836.6 2,682.0 2,651.3
Investments in joint ventures and associates (18) 988.0 1,386.4 1,394.0
Financial assets available for sale (19) 62.7 71.5 75.5
Trade receivables and other assets (20) 368.1 342.8 358.1
Derivative �nancial instruments (21) 76.3 37.9 28.4
Deferred tax asset (22) 238.1 224.6 168.7
Non-current assets 8,647.2 8,645.8 8,668.2
Inventories (23) 126.5 115.4 113.9
Financial assets available for sale (19) 300.0 – –
Trade receivables and other assets (20) 1,917.8 1,876.8 1,956.0
Derivative �nancial instruments (21) 171.4 49.1 131.5
Current tax asset (22) 94.0 53.9 48.1
Cash and cash equivalents (24) 2,286.0 2,701.7 2,278.4
Assets held for sale (25) 483.3 11.6 16.5
Current assets 5,379.0 4,808.5 4,544.4
14,026.2 13,454.3 13,212.6
153Financial Position C O N S O L I D AT E D F I N A N C I A L S TAT E M E N T S
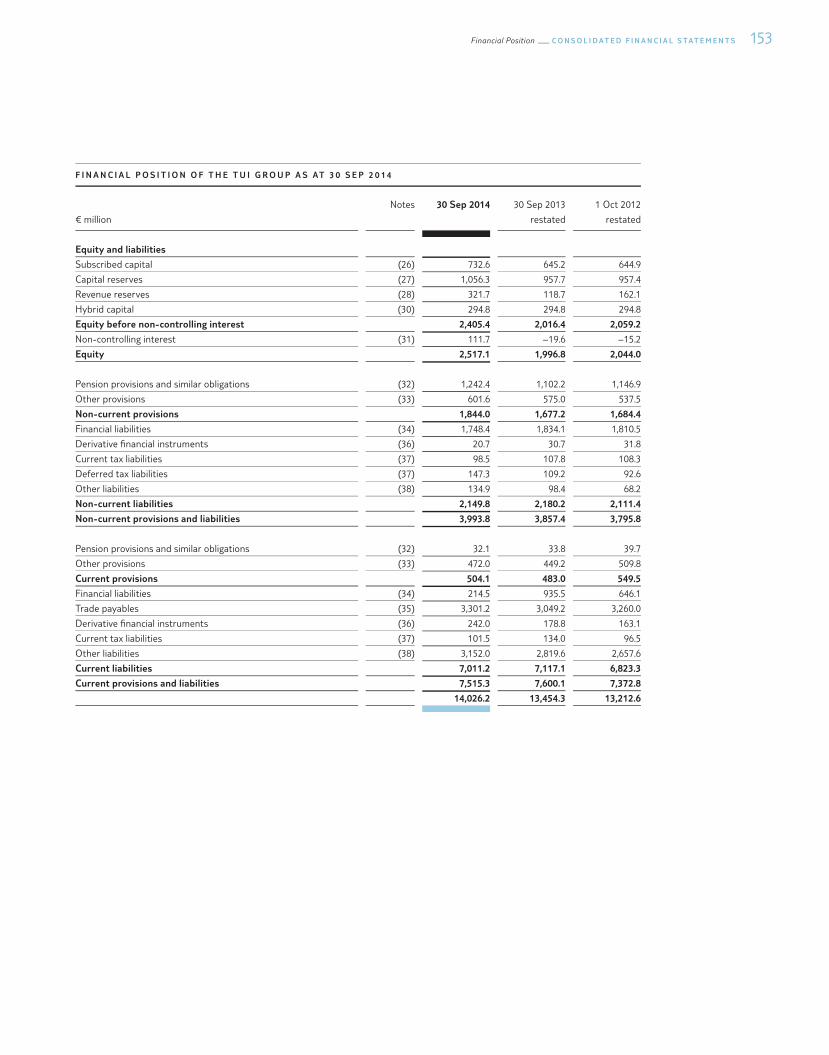
F I N A N C I A L P O S I T I O N O F T H E T U I G R O U P A S AT 3 0 S E P 2 0 1 4
€ million
Notes 30 Sep 2014 30 Sep 2013
restated
1 Oct 2012
restated
Equity and liabilities
Subscribed capital (26) 732.6 645.2 644.9
Capital reserves (27) 1,056.3 957.7 957.4
Revenue reserves (28) 321.7 118.7 162.1
Hybrid capital (30) 294.8 294.8 294.8
Equity before non-controlling interest 2,405.4 2,016.4 2,059.2
Non-controlling interest (31) 111.7 – 19.6 – 15.2
Equity 2,517.1 1,996.8 2,044.0
Pension provisions and similar obligations (32) 1,242.4 1,102.2 1,146.9
Other provisions (33) 601.6 575.0 537.5
Non-current provisions 1,844.0 1,677.2 1,684.4
Financial liabilities (34) 1,748.4 1,834.1 1,810.5
Derivative �nancial instruments (36) 20.7 30.7 31.8
Current tax liabilities (37) 98.5 107.8 108.3
Deferred tax liabilities (37) 147.3 109.2 92.6
Other liabilities (38) 134.9 98.4 68.2
Non-current liabilities 2,149.8 2,180.2 2,111.4
Non-current provisions and liabilities 3,993.8 3,857.4 3,795.8
Pension provisions and similar obligations (32) 32.1 33.8 39.7
Other provisions (33) 472.0 449.2 509.8
Current provisions 504.1 483.0 549.5
Financial liabilities (34) 214.5 935.5 646.1
Trade payables (35) 3,301.2 3,049.2 3,260.0
Derivative �nancial instruments (36) 242.0 178.8 163.1
Current tax liabilities (37) 101.5 134.0 96.5
Other liabilities (38) 3,152.0 2,819.6 2,657.6
Current liabilities 7,011.2 7,117.1 6,823.3
Current provisions and liabilities 7,515.3 7,600.1 7,372.8
14,026.2 13,454.3 13,212.6
154 C O N S O L I D AT E D F I N A N C I A L S TAT E M E N T S Statement of Changes in Group Equity
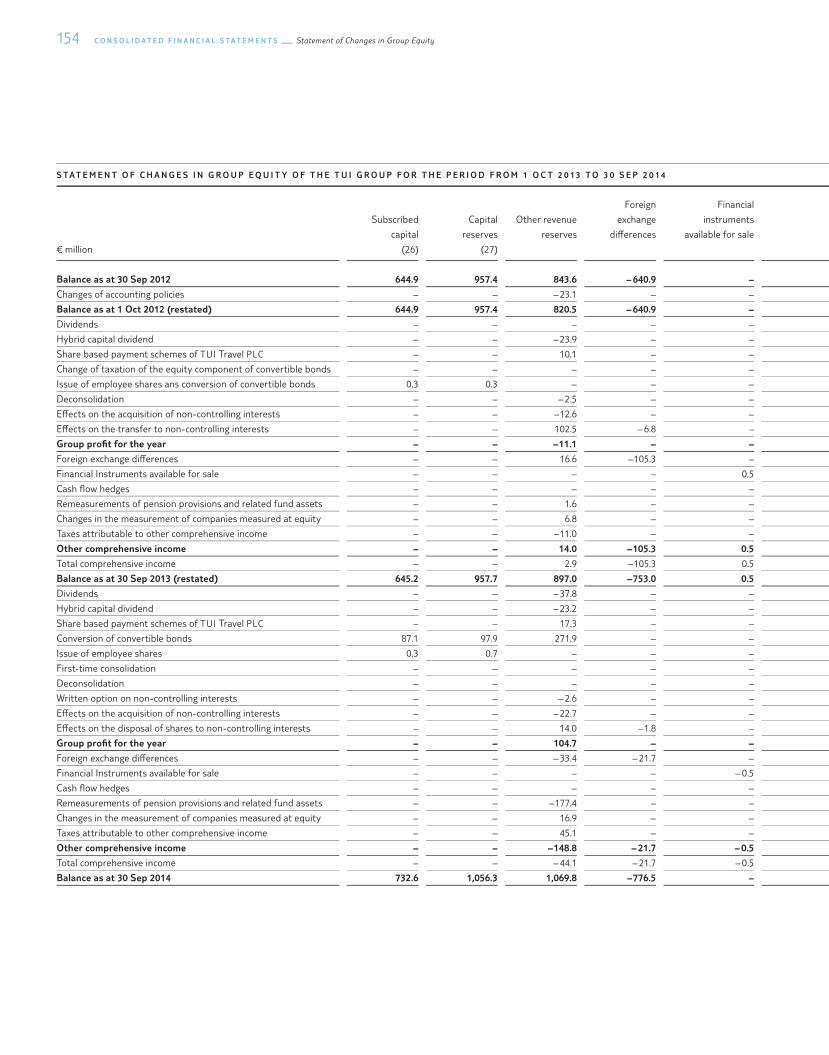
S TAT E M E N T O F C H A N G E S I N G R O U P E Q U I T Y O F T H E T U I G R O U P F O R T H E P E R I O D F R O M 1 O C T 2 0 13 T O 3 0 S E P 2 0 1 4
€ million
Subscribed
capital
(26)
Capital
reserves
(27)
Other revenue
reserves
Foreign
exchange
di§erences
Financial
instruments
available for sale
Cash ®ow
hedges
Revaluation
reserve
Revenue
reserves
(28)
Hybrid capital
(30)
Equity before
non-controlling
interest
Non-controlling
interest
(31)
Total
Balance as at 30 Sep 2012 644.9 957.4 843.6 – 640.9 – – 38.4 20.9 185.2 294.8 2,082.3 – 15.2 2,067.1
Changes of accounting policies – – – 23.1 – – – – – 23.1 – – 23.1 – – 23.1
Balance as at 1 Oct 2012 (restated) 644.9 957.4 820.5 – 640.9 – – 38.4 20.9 162.1 294.8 2,059.2 – 15.2 2,044.0
Dividends – – – – – – – – – – – 129.7 – 129.7
Hybrid capital dividend – – – 23.9 – – – – – 23.9 – – 23.9 – – 23.9
Share based payment schemes of TUI Travel PLC – – 10.1 – – – – 10.1 – 10.1 8.3 18.4
Change of taxation of the equity component of convertible bonds – – – – – – – – – – 4.0 4.0
Issue of employee shares ans conversion of convertible bonds 0.3 0.3 – – – – – – – 0.6 – 0.6
Deconsolidation – – – 2.5 – – – 2.5 – – – – –
E§ects on the acquisition of non-controlling interests – – – 12.6 – – – – – 12.6 – – 12.6 – 12.8 – 25.4
E§ects on the transfer to non-controlling interests – – 102.5 – 6.8 – 1.9 – 97.6 – 97.6 – 31.3 66.3
Group pro�t for the year – – – 11.1 – – – – – 11.1 – – 11.1 177.5 166.4
Foreign exchange di§erences – – 16.6 – 105.3 – 3.4 – 1.7 – 87.0 – – 87.0 20.8 – 66.2
Financial Instruments available for sale – – – – 0.5 – – 0.5 – 0.5 0.4 0.9
Cash ®ow hedges – – – – – – 15.7 – – 15.7 – – 15.7 – 38.6 – 54.3
Remeasurements of pension provisions and related fund assets – – 1.6 – – – – 1.6 – 1.6 – 7.0 – 5.4
Changes in the measurement of companies measured at equity – – 6.8 – – – – 6.8 – 6.8 – 6.8
Taxes attributable to other comprehensive income – – – 11.0 – – 1.3 – – 9.7 – – 9.7 4.0 – 5.7
Other comprehensive income – – 14.0 – 105.3 0.5 – 11.0 – 1.7 – 103.5 – – 103.5 – 20.4 – 123.9
Total comprehensive income – – 2.9 – 105.3 0.5 – 11.0 – 1.7 – 114.6 – – 114.6 157.1 42.5
Balance as at 30 Sep 2013 (restated) 645.2 957.7 897.0 – 753.0 0.5 – 47.5 21.7 118.7 294.8 2,016.4 – 19.6 1,996.8
Dividends – – – 37.8 – – – – – 37.8 – – 37.8 – 91.2 – 129.0
Hybrid capital dividend – – – 23.2 – – – – – 23.2 – – 23.2 – – 23.2
Share based payment schemes of TUI Travel PLC – – 17.3 – – – – 17.3 – 17.3 14.2 31.5
Conversion of convertible bonds 87.1 97.9 271.9 – – – – 271.9 – 456.9 193.8 650.7
Issue of employee shares 0.3 0.7 – – – – – – – 1.0 – 1.0
First-time consolidation – – – – – – – – – – 1.6 1.6
Deconsolidation – – – – – – – – – – – 1.8 – 1.8
Written option on non-controlling interests – – – 2.6 – – – – – 2.6 – – 2.6 – 2.1 – 4.7
E§ects on the acquisition of non-controlling interests – – – 22.7 – – – – – 22.7 – – 22.7 – 18.7 – 41.4
E§ects on the disposal of shares to non-controlling interests – – 14.0 – 1.8 – 0.1 – 12.3 – 12.3 – 12.3 –
Group pro�t for the year – – 104.7 – – – – 104.7 – 104.7 179.2 283.9
Foreign exchange di§erences – – – 33.4 – 21.7 – – 3.2 – 1.2 – 59.5 – – 59.5 – 90.6 – 150.1
Financial Instruments available for sale – – – – – 0.5 – – – 0.5 – – 0.5 – 0.4 – 0.9
Cash ®ow hedges – – – – – 71.3 – 71.3 – 71.3 51.4 122.7
Remeasurements of pension provisions and related fund assets – – – 177.4 – – – – – 177.4 – – 177.4 – 108.6 – 286.0
Changes in the measurement of companies measured at equity – – 16.9 – – – – 16.9 – 16.9 – 16.9
Taxes attributable to other comprehensive income – – 45.1 – – – 12.8 – 32.3 – 32.3 16.8 49.1
Other comprehensive income – – – 148.8 – 21.7 – 0.5 55.3 – 1.2 – 116.9 – – 116.9 – 131.4 – 248.3
Total comprehensive income – – – 44.1 – 21.7 – 0.5 55.3 – 1.2 – 12.2 – – 12.2 47.8 35.6
Balance as at 30 Sep 2014 732.6 1,056.3 1,069.8 – 776.5 – 7.9 20.5 321.7 294.8 2,405.4 111.7 2,517.1

155Statement of Changes in Group Equity C O N S O L I D AT E D F I N A N C I A L S TAT E M E N T S
S TAT E M E N T O F C H A N G E S I N G R O U P E Q U I T Y O F T H E T U I G R O U P F O R T H E P E R I O D F R O M 1 O C T 2 0 13 T O 3 0 S E P 2 0 1 4
€ million
Subscribed
capital
(26)
Capital
reserves
(27)
Other revenue
reserves
Foreign
exchange
di§erences
Financial
instruments
available for sale
Cash ®ow
hedges
Revaluation
reserve
Revenue
reserves
(28)
Hybrid capital
(30)
Equity before
non-controlling
interest
Non-controlling
interest
(31)
Total
Balance as at 30 Sep 2012 644.9 957.4 843.6 – 640.9 – – 38.4 20.9 185.2 294.8 2,082.3 – 15.2 2,067.1
Changes of accounting policies – – – 23.1 – – – – – 23.1 – – 23.1 – – 23.1
Balance as at 1 Oct 2012 (restated) 644.9 957.4 820.5 – 640.9 – – 38.4 20.9 162.1 294.8 2,059.2 – 15.2 2,044.0
Dividends – – – – – – – – – – – 129.7 – 129.7
Hybrid capital dividend – – – 23.9 – – – – – 23.9 – – 23.9 – – 23.9
Share based payment schemes of TUI Travel PLC – – 10.1 – – – – 10.1 – 10.1 8.3 18.4
Change of taxation of the equity component of convertible bonds – – – – – – – – – – 4.0 4.0
Issue of employee shares ans conversion of convertible bonds 0.3 0.3 – – – – – – – 0.6 – 0.6
Deconsolidation – – – 2.5 – – – 2.5 – – – – –
E§ects on the acquisition of non-controlling interests – – – 12.6 – – – – – 12.6 – – 12.6 – 12.8 – 25.4
E§ects on the transfer to non-controlling interests – – 102.5 – 6.8 – 1.9 – 97.6 – 97.6 – 31.3 66.3
Group pro�t for the year – – – 11.1 – – – – – 11.1 – – 11.1 177.5 166.4
Foreign exchange di§erences – – 16.6 – 105.3 – 3.4 – 1.7 – 87.0 – – 87.0 20.8 – 66.2
Financial Instruments available for sale – – – – 0.5 – – 0.5 – 0.5 0.4 0.9
Cash ®ow hedges – – – – – – 15.7 – – 15.7 – – 15.7 – 38.6 – 54.3
Remeasurements of pension provisions and related fund assets – – 1.6 – – – – 1.6 – 1.6 – 7.0 – 5.4
Changes in the measurement of companies measured at equity – – 6.8 – – – – 6.8 – 6.8 – 6.8
Taxes attributable to other comprehensive income – – – 11.0 – – 1.3 – – 9.7 – – 9.7 4.0 – 5.7
Other comprehensive income – – 14.0 – 105.3 0.5 – 11.0 – 1.7 – 103.5 – – 103.5 – 20.4 – 123.9
Total comprehensive income – – 2.9 – 105.3 0.5 – 11.0 – 1.7 – 114.6 – – 114.6 157.1 42.5
Balance as at 30 Sep 2013 (restated) 645.2 957.7 897.0 – 753.0 0.5 – 47.5 21.7 118.7 294.8 2,016.4 – 19.6 1,996.8
Dividends – – – 37.8 – – – – – 37.8 – – 37.8 – 91.2 – 129.0
Hybrid capital dividend – – – 23.2 – – – – – 23.2 – – 23.2 – – 23.2
Share based payment schemes of TUI Travel PLC – – 17.3 – – – – 17.3 – 17.3 14.2 31.5
Conversion of convertible bonds 87.1 97.9 271.9 – – – – 271.9 – 456.9 193.8 650.7
Issue of employee shares 0.3 0.7 – – – – – – – 1.0 – 1.0
First-time consolidation – – – – – – – – – – 1.6 1.6
Deconsolidation – – – – – – – – – – – 1.8 – 1.8
Written option on non-controlling interests – – – 2.6 – – – – – 2.6 – – 2.6 – 2.1 – 4.7
E§ects on the acquisition of non-controlling interests – – – 22.7 – – – – – 22.7 – – 22.7 – 18.7 – 41.4
E§ects on the disposal of shares to non-controlling interests – – 14.0 – 1.8 – 0.1 – 12.3 – 12.3 – 12.3 –
Group pro�t for the year – – 104.7 – – – – 104.7 – 104.7 179.2 283.9
Foreign exchange di§erences – – – 33.4 – 21.7 – – 3.2 – 1.2 – 59.5 – – 59.5 – 90.6 – 150.1
Financial Instruments available for sale – – – – – 0.5 – – – 0.5 – – 0.5 – 0.4 – 0.9
Cash ®ow hedges – – – – – 71.3 – 71.3 – 71.3 51.4 122.7
Remeasurements of pension provisions and related fund assets – – – 177.4 – – – – – 177.4 – – 177.4 – 108.6 – 286.0
Changes in the measurement of companies measured at equity – – 16.9 – – – – 16.9 – 16.9 – 16.9
Taxes attributable to other comprehensive income – – 45.1 – – – 12.8 – 32.3 – 32.3 16.8 49.1
Other comprehensive income – – – 148.8 – 21.7 – 0.5 55.3 – 1.2 – 116.9 – – 116.9 – 131.4 – 248.3
Total comprehensive income – – – 44.1 – 21.7 – 0.5 55.3 – 1.2 – 12.2 – – 12.2 47.8 35.6
Balance as at 30 Sep 2014 732.6 1,056.3 1,069.8 – 776.5 – 7.9 20.5 321.7 294.8 2,405.4 111.7 2,517.1
156 C O N S O L I D AT E D F I N A N C I A L S TAT E M E N T S Cash Flow Statement
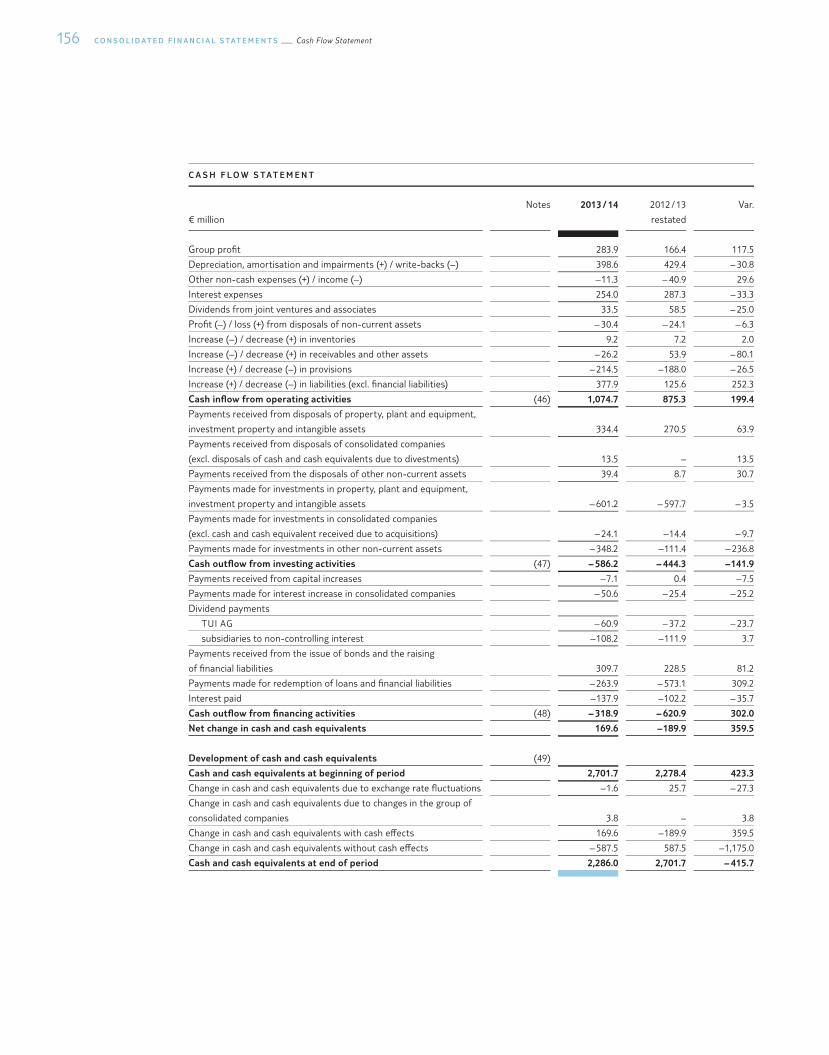
C A S H F L O W S TAT E M E N T
€ million
Notes 2013 / 14 2012 / 13
restated
Var.
Group pro�t 283.9 166.4 117.5
Depreciation, amortisation and impairments (+) / write-backs (–) 398.6 429.4 – 30.8
Other non-cash expenses (+) / income (–) – 11.3 – 40.9 29.6
Interest expenses 254.0 287.3 – 33.3
Dividends from joint ventures and associates 33.5 58.5 – 25.0
Pro�t (–) / loss (+) from disposals of non-current assets – 30.4 – 24.1 – 6.3
Increase (–) / decrease (+) in inventories 9.2 7.2 2.0
Increase (–) / decrease (+) in receivables and other assets – 26.2 53.9 – 80.1
Increase (+) / decrease (–) in provisions – 214.5 – 188.0 – 26.5
Increase (+) / decrease (–) in liabilities (excl. �nancial liabilities) 377.9 125.6 252.3
Cash in³ow from operating activities (46) 1,074.7 875.3 199.4
Payments received from disposals of property, plant and equipment,
investment property and intangible assets 334.4 270.5 63.9
Payments received from disposals of consolidated companies
(excl. disposals of cash and cash equivalents due to divestments) 13.5 – 13.5
Payments received from the disposals of other non-current assets 39.4 8.7 30.7
Payments made for investments in property, plant and equipment,
investment property and intangible assets – 601.2 – 597.7 – 3.5
Payments made for investments in consolidated companies
(excl. cash and cash equivalent received due to acquisitions) – 24.1 – 14.4 – 9.7
Payments made for investments in other non-current assets – 348.2 – 111.4 – 236.8
Cash out³ow from investing activities (47) – 586.2 – 444.3 – 141.9
Payments received from capital increases – 7.1 0.4 – 7.5
Payments made for interest increase in consolidated companies – 50.6 – 25.4 – 25.2
Dividend payments
TUI AG – 60.9 – 37.2 – 23.7
subsidiaries to non-controlling interest – 108.2 – 111.9 3.7
Payments received from the issue of bonds and the raising
of �nancial liabilities 309.7 228.5 81.2
Payments made for redemption of loans and �nancial liabilities – 263.9 – 573.1 309.2
Interest paid – 137.9 – 102.2 – 35.7
Cash out³ow from �nancing activities (48) – 318.9 – 620.9 302.0
Net change in cash and cash equivalents 169.6 – 189.9 359.5
Development of cash and cash equivalents (49)
Cash and cash equivalents at beginning of period 2,701.7 2,278.4 423.3
Change in cash and cash equivalents due to exchange rate ®uctuations – 1.6 25.7 – 27.3
Change in cash and cash equivalents due to changes in the group of
consolidated companies 3.8 – 3.8
Change in cash and cash equivalents with cash e§ects 169.6 – 189.9 359.5
Change in cash and cash equivalents without cash e§ects – 587.5 587.5 – 1,175.0
Cash and cash equivalents at end of period 2,286.0 2,701.7 – 415.7
157Principles and methods underlying the consolidated §nancial statements N O T E S
N OT E S
Principles and methods underlying the consolidated �nancial statements
General
The TUI Group operates in tourism with its major subsidiaries and shareholdings. Its Tourism Segment comprises TUI Travel, TUI Hotels & Resorts and the Cruises Sector.
TUI AG, based in Hanover, Karl-Wiechert-Allee 4, is the TUI Group’s parent company and a listed stock cor-poration under German law. The Company has been registered in the commercial registers of the district courts of Berlin-Charlottenburg (HRB 321) and Hanover (HRB 6580).
The members of the Executive Board and the Supervisory Board as well as other board mandates held by them are listed in the section on Corporate Governance in the Management Report.
The Executive Board and the Supervisory Board have submitted the Declaration of Compliance with the German Corporate Governance Code required pursuant to section 161 of the German Stock Corporation Act (AktG) and made it permanently accessible to the general public on the Company’s website (www.tui-group.com).
The �nancial year of the TUI Group and its major subsidiaries included in consolidation covers the period from 1 October of any one year to 30 September of the following year. Where any of TUI ’s subsidiaries (in particular those of the Riu Group) use �nancial years with other closing dates, interim �nancial statements were prepared in order to include these subsidiaries in TUI AG’s consolidated �nancial statements.
The consolidated �nancial statements are prepared in euros. Unless stated otherwise, all amounts are indicated in million euros (€ m).
The present consolidated �nancial statements were approved for publication by TUI AG’s Executive Board on 8 December 2014.
Accounting principles
Pursuant to section 315a (1) of the German Commercial Code (HGB), in combination with Regulation EEC No. 1606 / 2002 of the European Union, TUI AG is legally obliged, as a listed company, to prepare consolidated �nancial statements in accordance with the rules of the International Accounting Standards Board (IASB), the International Financial Reporting Standards (IFRSs).
The IFRSs are applied in the form in they have been transposed into national legislation in the framework of the European Commission endorsement process. Moreover, the commercial-law provisions listed in section 315a (1) of the German Commercial Code are also observed.
The accounting and measurement methods and the explanatory information and Notes to these annual �nancial statements for �nancial year 2013 / 14 are consistent in every respect with those followed in preparing the previous consolidated �nancial statements for �nancial year 2012 / 13. Exceptions to this principle are the standards e§ective as from 1 October 2013 and the change presented in the section on Changes in accounting and measure-ment methods caused by an agenda decision by the IFRS Interpretations Committee.
N O T E S Principles and methods underlying the consolidated §nancial statements 158
S TA N DA R D S A P P L I E D F O R T H E F I R S T T I M E
The following standards and interpretations revised or newly published by the IASB have been mandatory since the beginning of �nancial year 2013 / 14:
• Amendments to IAS 19: Employee Bene�ts• IFRS 13: Fair Value Measurement • Amendments to IFRS 7: Financial Instruments – Disclosures• Annual Improvements Project (2009 – 2011)
In addition, the following standards amended by the IASB and transposed into European legislation by the European Union have been applied ahead of the e§ective date in �nancial year 2013 / 14:
• Amendments to IAS 36: Impairment of Assets – Recoverable Amount Disclosures for Non-Financial Assets • Amendments to IAS 39: Financial Instruments – Recognition and Measurement: Novation of Derivatives and
Continuation of Hedge Accounting
With the exception of the amendments to IAS 19, the �rst-time application of the above provisions did not have any material e§ects on the presentation of the TUI Group’s net assets, �nancial position and results of oper-ations in the present consolidated �nancial statements.
A M E N D M E N T S TO I A S 19 : E M P L OY E E B E N E F I T S
The mandatory application of the amendments to IAS 19 on the accounting for employee bene�ts result in material e§ects on the TUI Group’s net assets, �nancial position and results of operations so that the prior year’s numbers were restated as at 1 October 2013.
The amendments to the standard, published in June 2011, have eliminated the existing option to use the corridor approach and have led to the immediate recognition of actuarial gains and losses in other comprehensive in-come outside pro�t and loss. In determining the net interest expense for de�ned bene�t pension plans, income from plan assets will no longer have to be estimated as the expected return but will have to be determined as the interest on the plan based on the rate of interest used to determine the present value. Other amendments relate to the immediate recognition through pro�t and loss of past service costs in the event of future changes to plan arrangements or the presentation of the net interest on de�ned bene�t pension plans. Amendments have furthermore been made to the distinction between termination bene�ts and other bene�ts provided by the employer. The revised standard also includes an extension of disclosure requirements in connection with em-ployee bene�ts.
Elimination of the so-called corridor method does not have an impact as the immediate and full recognition of revaluations (in particular actuarial gains and losses) re®ects the method already used by TUI. Accordingly, the amendment does not have an e§ect on the presentation of the consolidated statement of �nancial position. Changes in the TUI Group’s cash ®ow statement only result with regard to the indirect method of deriving the cash in®ow from operating activities.
In line with the transition guidance, the amendments outlined above are applied with retroactive e§ect as of the beginning of the reference period, i. e. 1 October 2012. The quantitative e§ects of the �rst-time application of the amended IAS 19 on the TUI Group’s net assets, �nancial position and results of operations are presented in the section on Restatement of prior reporting period.
In the current reporting period, the consolidated comprehensive income and the consolidated statement of �nan-cial position for �nancial year 2013 / 14 would not change as a result of application of the amended version of IAS 19 compared with continued application of IAS 19 in its previous version. The only changes arising from the calculation according to the new version would relate to the statement of comprehensive income, as follows:
159Principles and methods underlying the consolidated §nancial statements N O T E S
• Increase in Group pro�t after tax of € 20.1 m with an increase in the �nancial result of € 27.0 m and reduction in tax assets of € 6.9 m
• Decrease in other comprehensive income within the items not to be reclassi�ed to the income statement by € 20.1 m due to lower actuarial gains on fund assets and a reduction in allocable taxes
• Increase in (basic and diluted) earnings per share of € 0.04
The amendments related to the recognition of past service costs do not have an impact on earnings in the present consolidated �nancial statements. The Group has examined the e§ects of the amended de�nition of termina-tion bene�ts on the current and the previous consolidated �nancial statements. For materiality reasons, provisions for part-time early retirement arrangements were not restated.
I F R S 13 : FA I R VA L U E M E A S U R E M E N T
The amendments establish a uniform approach to determining fair value. According to IFRS 13, fair value is rede�ned as the price that would be received to sell an asset or paid to transfer a liability (exit price) in an orderly transaction between the market participants at the measurement date. Moreover, the disclosures in the Notes in connection with fair value measurement are expanded to cover all standards. Apart from the additional dis-closures in the Notes, the prospective �rst-time application of this standard did not have any material e§ects on the consolidated �nancial statements.
A M E N D M E N T S TO I F R S 7 : F I N A N C I A L I N S T R U M E N T S – D I S C L O S U R E S
The amendments expand the existing qualitative and quantitative disclosure requirements in the Notes on the o§setting of �nancial assets and �nancial liabilities e§ected. They also contain additional disclosure require-ments for �nancial instruments subject to netting agreements, regardless of whether they have actually been netted according to IAS 32. The amendments create additional disclosure requirements in the Notes.
A N N UA L I M P R OV E M E N T S P R OJ E C T 2 0 0 9 – 2 0 11
The annual improvements project (2009 – 2011) contains amendments to �ve standards (IFRS 1, IAS 1, IAS 16, IAS 32 and IAS 34). The provisions include minor changes in the contents and above all clari�cations of the presentation, recognition and measurement. The amendments did not have a material e§ect on the consolidated �nancial statements.
A M E N D M E N T TO I A S 3 6 : I M PA I R M E N T O F A S S E T S
The amendments clarify and expand the disclosure requirements regarding the recoverable amount for non- �nancial assets. The amendments make it clear that the recoverable amount of a cash generating unit to which sub-stantial goodwill has been assigned only has to be disclosed if an impairment was recorded for this unit for the period under review and the recoverable amount is based on fair value less costs of disposal. The amendments also introduce additional disclosures for non-�nancial assets required if the recoverable amount was deter-mined on the basis of fair value less costs of disposal. The amendments were endorsed by the European Union in December 2013 and are e§ective for �nancial years beginning on or after 1 January 2014. The TUI Group has applied the amendment as from 1 October 2013, ahead of the e§ective date. The amendments result in add-itional disclosures in the Notes to the present consolidated �nancial statements.
A M E N D M E N T S TO I A S 39 : F I N A N C I A L I N S T R U M E N T S – R E CO G N I T I O N A N D M E A S U R E M E N T
As a result of the amendments to IAS 39 on the recognition and measurement of �nancial instruments, the nov-ation of a hedge to a central counterparty due to legal requirements does not impose discontinuation of a hedging relationship if certain conditions are met. The amendments were transposed into European legislation by the European Union in December 2013 and are e§ective for �nancial years beginning on or after 1 January 2014. The TUI Group has applied the amendment as from 1 October 2013, ahead of the e§ective date. The retro-spective �rst-time application did not have any e§ects on the presentation of the Group’s net assets, �nancial position and results of operations.
N O T E S Principles and methods underlying the consolidated §nancial statements 160
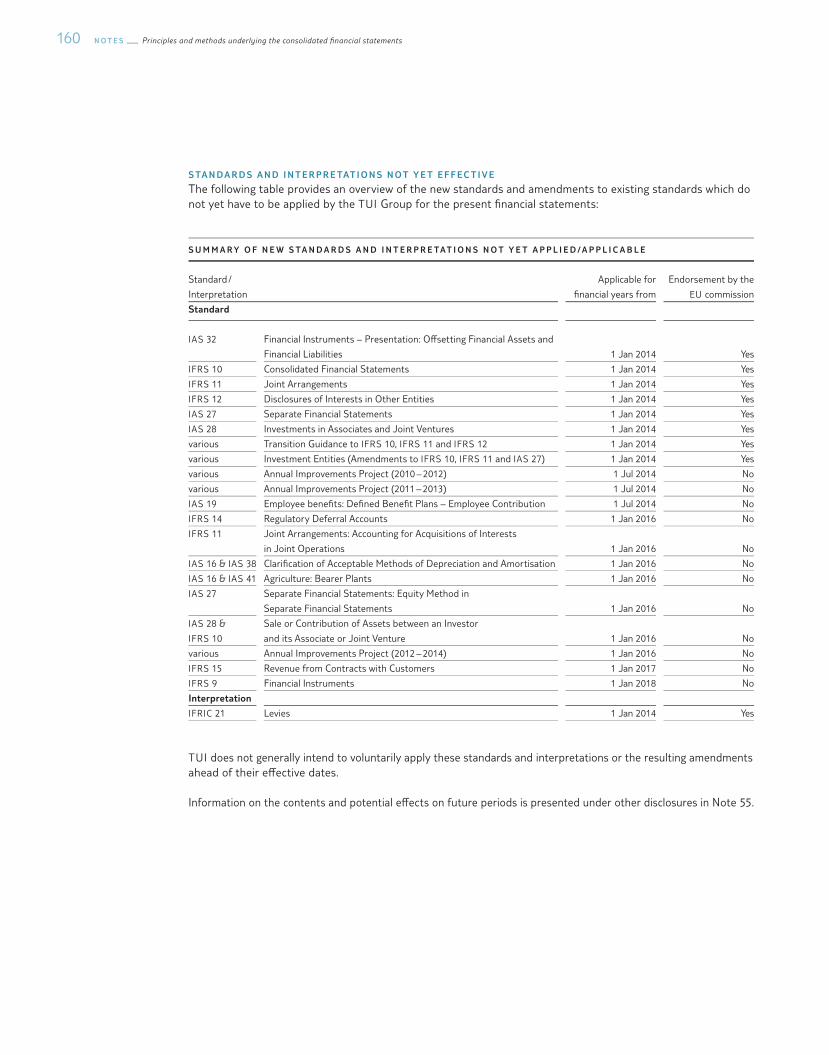
S TA N DA R D S A N D I N T E R P R E TAT I O N S N O T Y E T E F F E C T I V E
The following table provides an overview of the new standards and amendments to existing standards which do not yet have to be applied by the TUI Group for the present �nancial statements:
S U M M A R Y O F N E W S TA N D A R D S A N D I N T E R P R E TAT I O N S N O T Y E T A P P L I E D / A P P L I C A B L E
Standard /
Interpretation
Applicable for
�nancial years from
Endorsement by the
EU commission
Standard
IAS 32 Financial Instruments – Presentation: O§setting Financial Assets and
Financial Liabilities 1 Jan 2014 Yes
IFRS 10 Consolidated Financial Statements 1 Jan 2014 Yes
IFRS 11 Joint Arrangements 1 Jan 2014 Yes
IFRS 12 Disclosures of Interests in Other Entities 1 Jan 2014 Yes
IAS 27 Separate Financial Statements 1 Jan 2014 Yes
IAS 28 Investments in Associates and Joint Ventures 1 Jan 2014 Yes
various Transition Guidance to IFRS 10, IFRS 11 and IFRS 12 1 Jan 2014 Yes
various Investment Entities (Amendments to IFRS 10, IFRS 11 and IAS 27) 1 Jan 2014 Yes
various Annual Improvements Project (2010 – 2012) 1 Jul 2014 No
various Annual Improvements Project (2011 – 2013) 1 Jul 2014 No
IAS 19 Employee bene�ts: De�ned Bene�t Plans – Employee Contribution 1 Jul 2014 No
IFRS 14 Regulatory Deferral Accounts 1 Jan 2016 No
IFRS 11 Joint Arrangements: Accounting for Acquisitions of Interests
in Joint Operations 1 Jan 2016 No
IAS 16 & IAS 38 Clari�cation of Acceptable Methods of Depreciation and Amortisation 1 Jan 2016 No
IAS 16 & IAS 41 Agriculture: Bearer Plants 1 Jan 2016 No
IAS 27 Separate Financial Statements: Equity Method in
Separate Financial Statements 1 Jan 2016 No
IAS 28 &
IFRS 10
Sale or Contribution of Assets between an Investor
and its Associate or Joint Venture 1 Jan 2016 No
various Annual Improvements Project (2012 – 2014) 1 Jan 2016 No
IFRS 15 Revenue from Contracts with Customers 1 Jan 2017 No
IFRS 9 Financial Instruments 1 Jan 2018 No
Interpretation
IFRIC 21 Levies 1 Jan 2014 Yes
TUI does not generally intend to voluntarily apply these standards and interpretations or the resulting amendments ahead of their e§ective dates.
Information on the contents and potential e§ects on future periods is presented under other disclosures in Note 55.
161Principles and methods underlying the consolidated §nancial statements N O T E S
C H A N G E S I N ACCO U N T I N G A N D M E A S U R E M E N T M E T H O D S
Due to an agenda decision adopted by the IFRS Interpretations Committee in May 2014, minimum taxation will also be taken into account in recognising deferred tax assets on loss carryforwards as from �nancial year 2013 / 14 if deferred tax assets are only recognised to the extent that there is an overhang of deferred tax lia bilities due to a lack of taxable pro�t. This recognition change is applied with retroactive e§ect as from the be-ginning of the reference period, i.e. as from 1 October 2012. The prior year’s numbers were restated accordingly.
The restatements of prior year’s numbers resulting from this change are presented in the section on Restatement of prior reporting period.
If the recognition of deferred tax assets on loss carryforwards had not changed, the following changes would have resulted in the income statement, statement of �nancial position and statement of comprehensive income for �nancial year 2013 / 14:
• Increase in Group pro�t after tax of € 2.6 m due to an increase in tax assets of the same amount • Increase in deferred tax assets of € 3.6 m• Decrease in deferred tax liabilities of € 31.6 m • Increase in consolidated comprehensive income of € 2.6 m
The (basic and diluted) earnings per share would not have changed.
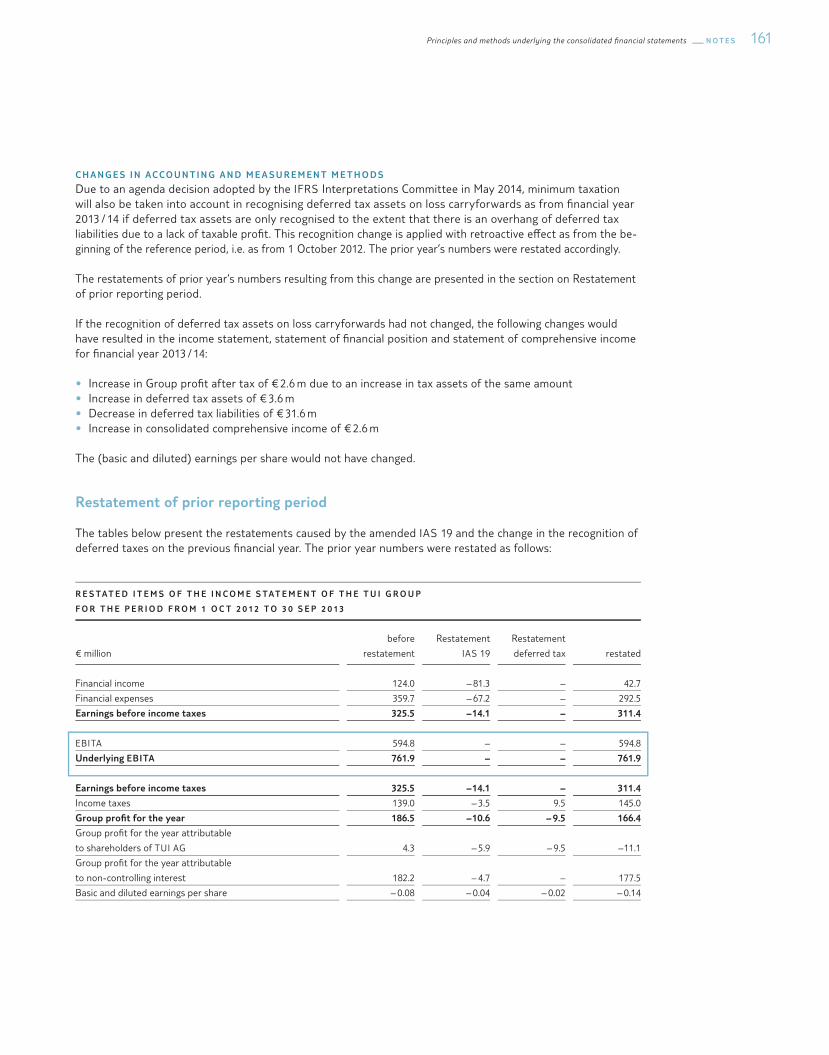
Restatement of prior reporting period
The tables below present the restatements caused by the amended IAS 19 and the change in the recognition of deferred taxes on the previous �nancial year. The prior year numbers were restated as follows:
R E S TAT E D I T E M S O F T H E I N C O M E S TAT E M E N T O F T H E T U I G R O U P
F O R T H E P E R I O D F R O M 1 O C T 2 0 12 T O 3 0 S E P 2 0 13
€ million
before
restatement
Restatement
IAS 19
Restatement
deferred tax restated
Financial income 124.0 – 81.3 – 42.7
Financial expenses 359.7 – 67.2 – 292.5
Earnings before income taxes 325.5 – 14.1 – 311.4
EBITA 594.8 – – 594.8
Underlying EBITA 761.9 – – 761.9
Earnings before income taxes 325.5 – 14.1 – 311.4
Income taxes 139.0 – 3.5 9.5 145.0
Group pro�t for the year 186.5 – 10.6 – 9.5 166.4
Group pro�t for the year attributable
to shareholders of TUI AG 4.3 – 5.9 – 9.5 – 11.1
Group pro�t for the year attributable
to non-controlling interest 182.2 – 4.7 – 177.5
Basic and diluted earnings per share – 0.08 – 0.04 – 0.02 – 0.14

N O T E S Principles and methods underlying the consolidated §nancial statements 162
R E S TAT E D I T E M S I N T H E S TAT E M E N T O F C O M P R E H E N S I V E I N C O M E O F T H E T U I G R O U P
F O R T H E P E R I O D F R O M 1 O C T 2 0 12 T O 3 0 S E P 2 0 13
€ million
before
restatement
Restatement
IAS 19
Restatement
deferred tax restated
Group pro�t 186.5 – 10.6 – 9.5 166.4
Actuarial gains from pension provisions and related fund assets – 19.5 14.1 – – 5.4
Income tax related to items that will not be reclassi�ed – 12.8 – 3.5 – – 16.3
Items that will not be reclassi�ed to pro�t or loss – 37.2 10.6 – – 26.6
Total comprehensive income 52.0 – – 9.5 42.5
attributable to shareholders of TUI AG – 105.1 – – 9.5 – 114.6
attributable to non-controlling interest 157.1 – – 157.1
R E S TAT E D I T E M S I N T H E B A L A N C E S H E E T O F T H E T U I G R O U P A S AT 1 O C T 2 0 12 A N D 3 0 S E P 2 0 13
1 Oct 2012 30 Sep 2013
€ million
before
restatement
Restatement
Deferred tax restated
before
restatement
Restatement
Deferred tax restated
Revenue Reserves 185.2 – 23.1 162.1 151.3 – 32.6 118.7
Equity 2,067.1 – 23.1 2,044.0 2,029.4 – 32.6 1,996.8
Deferred tax liabilities 69.5 23.1 92.6 76.6 32.6 109.2
Non-current provisions
and liabilities 3,772.7 23.1 3,795.8 3,824.8 32.6 3,857.4
Principles and methods of consolidation
P R I N C I P L E S
The consolidated �nancial statements include all major companies in which TUI AG is able, directly or indirectly, to govern the �nancial and operating policies so as to obtain bene�ts from the activity of these companies (subsidiaries). As a rule, the control is exercised by means of a majority of voting rights. The consolidation of the RIUSA II Group is based on de facto control, with TUI AG and the co-shareholder holding equal interests and voting rights. TUI AG is thus able in this case to exercise a controlling in®uence and to govern the �nancial and operating policies so as to obtain bene�ts from the activity of this hotel group. In assessing control, the exist-ence and e§ect of potential voting rights that are currently exercisable or convertible are taken into account. Con-solidation of such companies starts as from the date at which the TUI Group gains control. When the TUI Group ceases to control the corresponding companies, they are removed from consolidation.
The consolidated �nancial statements are prepared from the separate or single-entity �nancial statements of TUI AG and its subsidiaries, drawn up on the basis of uniform accounting, measurement and consolidation methods and usually exclusively audited or reviewed by auditors.
Shareholdings in companies in which the Group is able to exert signi�cant in®uence over the �nancial and operating decisions within these companies (associates, all shareholdings of 20 % to less than 50 %) are measured at equity. Stakes in companies managed jointly with one or several partners ( joint ventures) are also measured using the equity method. The dates as of which associates and joint ventures are included in or removed from the group of companies measured at equity are determined in analogy to the principles applying to subsidiaries. At equity measurement in each case is based on the last annual �nancial statements available or the interim �nancial statements as at 30 September if the balance sheet dates di§er from TUI AG’s balance sheet date.

163Principles and methods underlying the consolidated §nancial statements N O T E S
This a§ects 35 companies with a �nancial year from 1 January to 31 December, four companies with a �nancial year from 1 November to 31 October and two companies with a �nancial year from 1 April to 31 March of the subsequent year.
G R O U P O F CO N S O L I DAT E D C O M PA N I E S
In �nancial year 2013 / 14, the consolidated �nancial statements included a total of 46 domestic and 576 foreign subsidiaries, besides TUI AG.
27 domestic and 59 foreign subsidiaries were not included in the consolidated �nancial statements. Even when taken together, these companies were not signi�cant for the presentation of a true and fair view of the net assets, �nancial position and results of operations of the Group.
D E V E L O P M E N T O F T H E G R O U P C O N S O L I D AT E D C O M P A N I E S *
A N D T H E G R O U P C O M P A N I E S M E A S U R E D AT E Q U I T Y
Balance
30 Sep 2013 Additions Disposals
Balance
30 Sep 2014
Consolidated subsidiaries 677 17 71 622
Domestic companies 47 3 4 46
Foreign companies 630 14 68 576
Associated companies 22 1 1 22
Domestic companies 5 – 1 4
Foreign companies 17 1 – 18
Joint ventures 40 1 6 35
Domestic companies 7 – – 7
Foreign companies 33 1 6 28
* Excl. TUI AG
Since 1 October 2013, a total of 17 companies have been newly included in consolidation, with eight companies added due to acquisitions and purchase of additional stakes and �ve companies due to an expansion of their business operations. Moreover, four companies were newly established. All additions relate to the Tourism Segment.
Since 30 September 2013, a total of 72 companies have been removed from consolidation. Seven of the companies were removed from consolidation due to mergers, 60 due to liquidation and four due to divestments. In addi-tion, one company was removed from consolidation due to the discontinuation of its business operations. All re-movals relate to companies operating in the Tourism Segment.
22 associated companies and 35 joint ventures were measured at equity. The number of companies measured at equity remained unchanged as against 30 September 2013, with one acquisition and one disposal due to a reclassi�cation to assets held for sale. The number of joint ventures measured at equity declined by a total of �ve due to a sale and the addition of companies to the group of consolidated companies.
N O T E S Principles and methods underlying the consolidated §nancial statements 164
The major direct and indirect subsidiaries, associates and joint ventures of TUI AG are listed under Other Notes – TUI Group Shareholdings.
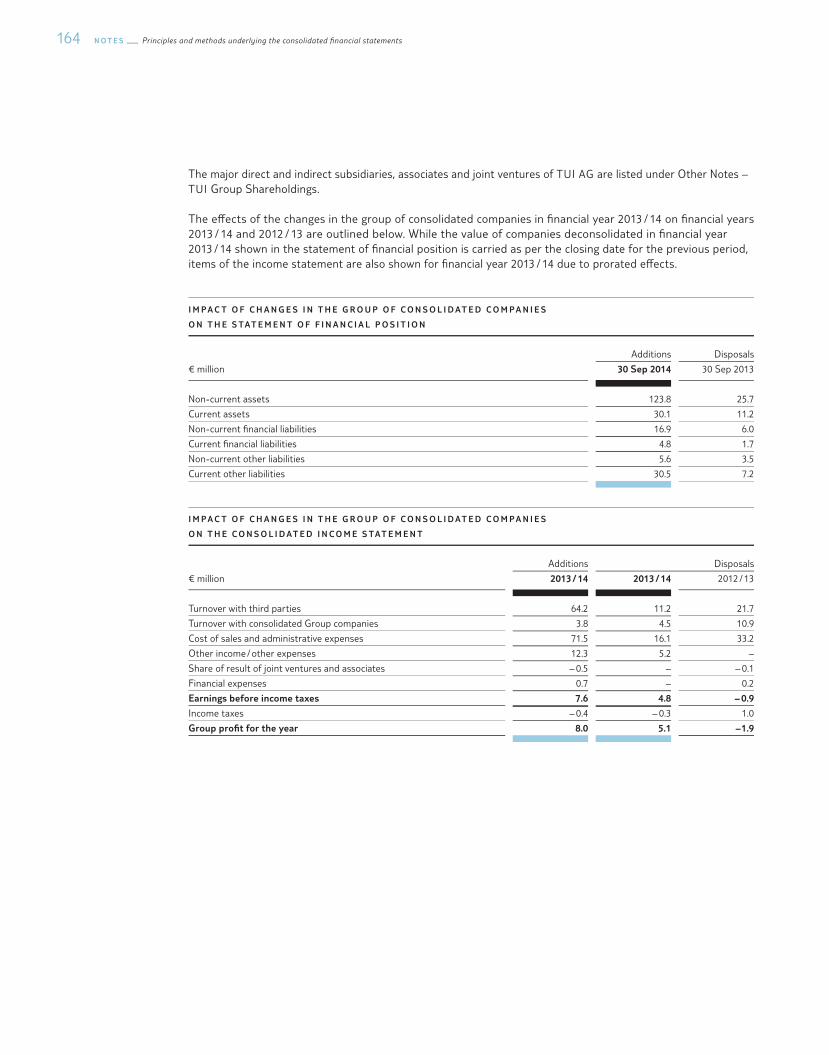
The e§ects of the changes in the group of consolidated companies in �nancial year 2013 / 14 on �nancial years 2013 / 14 and 2012 / 13 are outlined below. While the value of companies deconsolidated in �nancial year 2013 / 14 shown in the statement of �nancial position is carried as per the closing date for the previous period, items of the income statement are also shown for �nancial year 2013 / 14 due to prorated e§ects.
I M P A C T O F C H A N G E S I N T H E G R O U P O F C O N S O L I D AT E D C O M P A N I E S
O N T H E S TAT E M E N T O F F I N A N C I A L P O S I T I O N
Additions Disposals
€ million 30 Sep 2014 30 Sep 2013
Non-current assets 123.8 25.7
Current assets 30.1 11.2
Non-current �nancial liabilities 16.9 6.0
Current �nancial liabilities 4.8 1.7
Non-current other liabilities 5.6 3.5
Current other liabilities 30.5 7.2
I M P A C T O F C H A N G E S I N T H E G R O U P O F C O N S O L I D AT E D C O M P A N I E S
O N T H E C O N S O L I D AT E D I N C O M E S TAT E M E N T
Additions Disposals
€ million 2013 / 14 2013 / 14 2012 / 13
Turnover with third parties 64.2 11.2 21.7
Turnover with consolidated Group companies 3.8 4.5 10.9
Cost of sales and administrative expenses 71.5 16.1 33.2
Other income / other expenses 12.3 5.2 –
Share of result of joint ventures and associates – 0.5 – – 0.1
Financial expenses 0.7 – 0.2
Earnings before income taxes 7.6 4.8 – 0.9
Income taxes – 0.4 – 0.3 1.0
Group pro�t for the year 8.0 5.1 – 1.9
165Principles and methods underlying the consolidated §nancial statements N O T E S
ACQ U I S I T I O N S – D I V E S T M E N T S
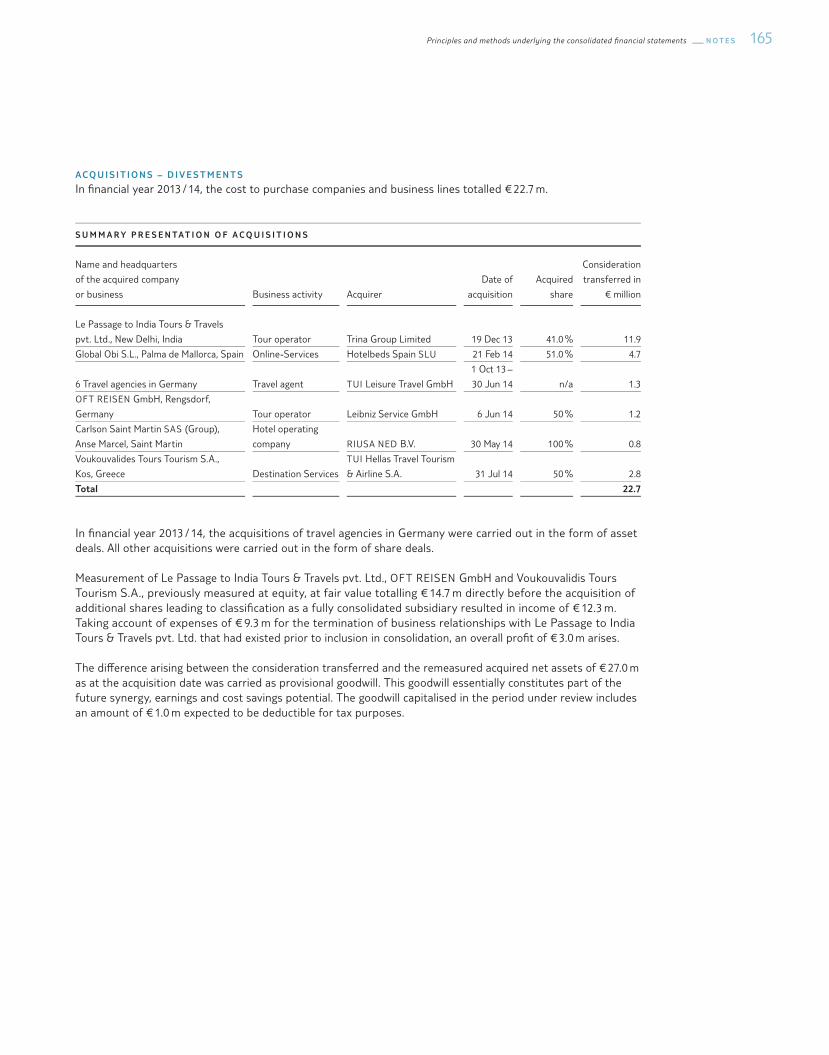
In �nancial year 2013 / 14, the cost to purchase companies and business lines totalled € 22.7 m.
S U M M A R Y P R E S E N TAT I O N O F A C Q U I S I T I O N S
Name and headquarters
of the acquired company
or business Business activity Acquirer
Date of
acquisition
Acquired
share
Consideration
transferred in
€ million
Le Passage to India Tours & Travels
pvt. Ltd., New Delhi, India Tour operator Trina Group Limited 19 Dec 13 41.0 % 11.9
Global Obi S.L., Palma de Mallorca, Spain Online-Services Hotelbeds Spain SLU 21 Feb 14 51.0 % 4.7
6 Travel agencies in Germany Travel agent TUI Leisure Travel GmbH
1 Oct 13 –
30 Jun 14 n / a 1.3
OFT REISEN GmbH, Rengsdorf,
Germany Tour operator Leibniz Service GmbH 6 Jun 14 50 % 1.2
Carlson Saint Martin SAS (Group),
Anse Marcel, Saint Martin
Hotel operating
company RIUSA NED B.V. 30 May 14 100 % 0.8
Voukouvalides Tours Tourism S.A.,
Kos, Greece Destination Services
TUI Hellas Travel Tourism
& Airline S.A. 31 Jul 14 50 % 2.8
Total 22.7
In �nancial year 2013 / 14, the acquisitions of travel agencies in Germany were carried out in the form of asset deals. All other acquisitions were carried out in the form of share deals.
Measurement of Le Passage to India Tours & Travels pvt. Ltd., OFT REISEN GmbH and Voukouvalidis Tours Tourism S.A., previously measured at equity, at fair value totalling € 14.7 m directly before the acquisition of additional shares leading to classi�cation as a fully consolidated subsidiary resulted in income of € 12.3 m. Taking account of expenses of € 9.3 m for the termination of business relationships with Le Passage to India Tours & Travels pvt. Ltd. that had existed prior to inclusion in consolidation, an overall pro�t of € 3.0 m arises.
The di§erence arising between the consideration transferred and the remeasured acquired net assets of € 27.0 m as at the acquisition date was carried as provisional goodwill. This goodwill essentially constitutes part of the future synergy, earnings and cost savings potential. The goodwill capitalised in the period under review includes an amount of € 1.0 m expected to be deductible for tax purposes.
N O T E S Principles and methods underlying the consolidated §nancial statements 166
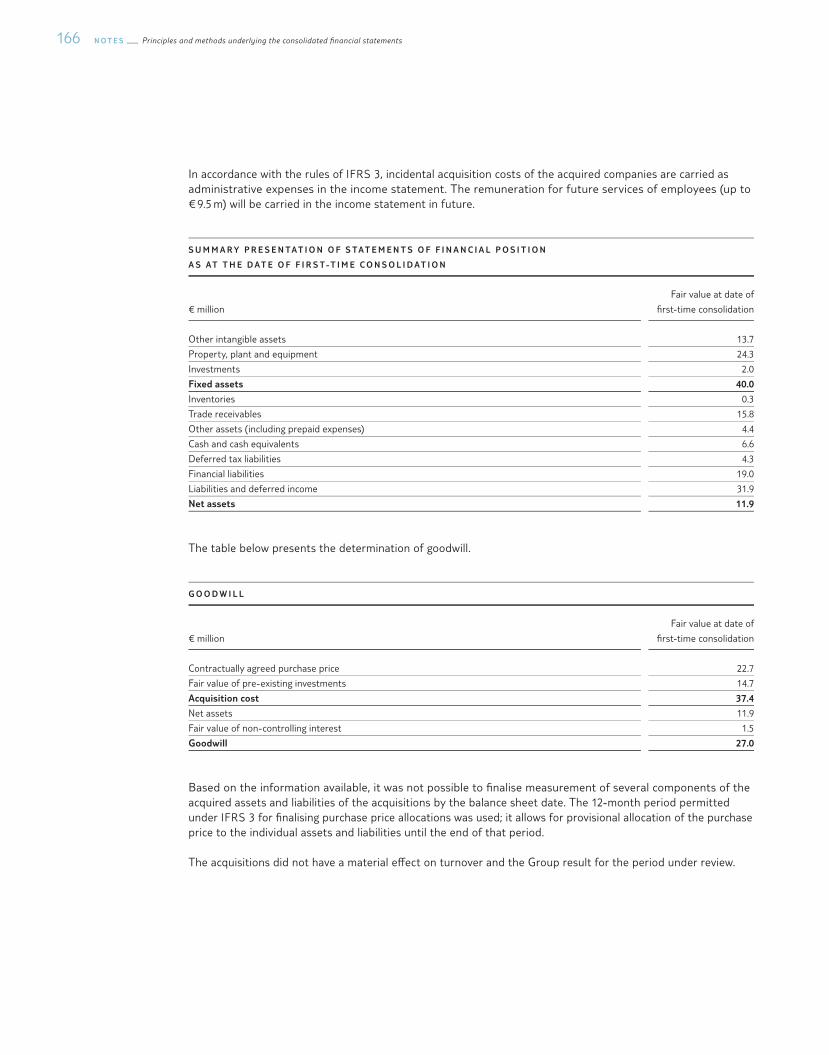
In accordance with the rules of IFRS 3, incidental acquisition costs of the acquired companies are carried as administrative expenses in the income statement. The remuneration for future services of employees (up to € 9.5 m) will be carried in the income statement in future.
S U M M A R Y P R E S E N TAT I O N O F S TAT E M E N T S O F F I N A N C I A L P O S I T I O N
A S AT T H E D AT E O F F I R S T-T I M E C O N S O L I D AT I O N
€ million
Fair value at date of
�rst-time consolidation
Other intangible assets 13.7
Property, plant and equipment 24.3
Investments 2.0
Fixed assets 40.0
Inventories 0.3
Trade receivables 15.8
Other assets (including prepaid expenses) 4.4
Cash and cash equivalents 6.6
Deferred tax liabilities 4.3
Financial liabilities 19.0
Liabilities and deferred income 31.9
Net assets 11.9
The table below presents the determination of goodwill.
G O O D W I L L
€ million
Fair value at date of
�rst-time consolidation
Contractually agreed purchase price 22.7
Fair value of pre-existing investments 14.7
Acquisition cost 37.4
Net assets 11.9
Fair value of non-controlling interest 1.5
Goodwill 27.0
Based on the information available, it was not possible to �nalise measurement of several components of the acquired assets and liabilities of the acquisitions by the balance sheet date. The 12-month period permitted under IFRS 3 for �nalising purchase price allocations was used; it allows for provisional allocation of the purchase price to the individual assets and liabilities until the end of that period.
The acquisitions did not have a material e§ect on turnover and the Group result for the period under review.
167Principles and methods underlying the consolidated §nancial statements N O T E S
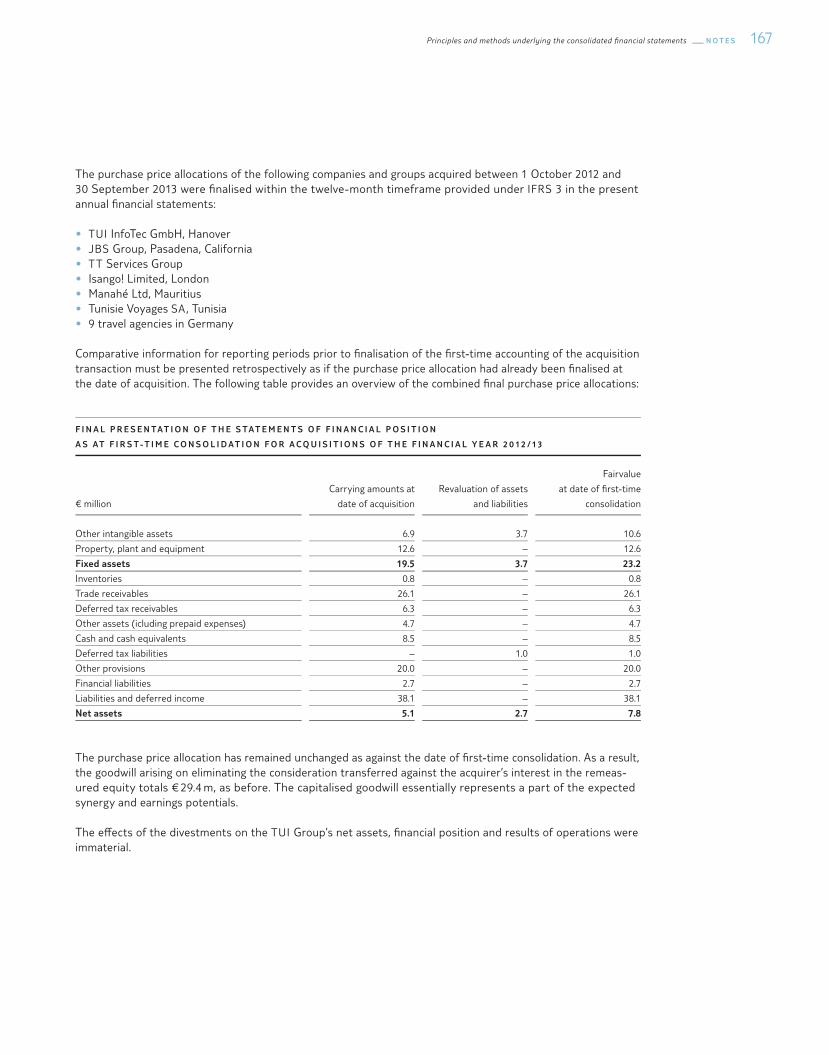
The purchase price allocations of the following companies and groups acquired between 1 October 2012 and 30 September 2013 were �nalised within the twelve-month timeframe provided under IFRS 3 in the present annual �nancial statements:
• TUI InfoTec GmbH, Hanover• JBS Group, Pasadena, California• TT Services Group• Isango! Limited, London• Manahé Ltd, Mauritius• Tunisie Voyages SA , Tunisia• 9 travel agencies in Germany
Comparative information for reporting periods prior to �nalisation of the �rst-time accounting of the acquisition transaction must be presented retrospectively as if the purchase price allocation had already been �nalised at the date of acquisition. The following table provides an overview of the combined �nal purchase price allocations:
F I N A L P R E S E N TAT I O N O F T H E S TAT E M E N T S O F F I N A N C I A L P O S I T I O N
A S AT F I R S T-T I M E C O N S O L I D AT I O N F O R A C Q U I S I T I O N S O F T H E F I N A N C I A L Y E A R 2 0 12 / 13
€ million
Carrying amounts at
date of acquisition
Revaluation of assets
and liabilities
Fairvalue
at date of �rst-time
consolidation
Other intangible assets 6.9 3.7 10.6
Property, plant and equipment 12.6 – 12.6
Fixed assets 19.5 3.7 23.2
Inventories 0.8 – 0.8
Trade receivables 26.1 – 26.1
Deferred tax receivables 6.3 – 6.3
Other assets (icluding prepaid expenses) 4.7 – 4.7
Cash and cash equivalents 8.5 – 8.5
Deferred tax liabilities – 1.0 1.0
Other provisions 20.0 – 20.0
Financial liabilities 2.7 – 2.7
Liabilities and deferred income 38.1 – 38.1
Net assets 5.1 2.7 7.8
The purchase price allocation has remained unchanged as against the date of �rst-time consolidation. As a result, the goodwill arising on eliminating the consideration transferred against the acquirer’s interest in the remeas-ured equity totals € 29.4 m, as before. The capitalised goodwill essentially represents a part of the expected synergy and earnings potentials.
The e§ects of the divestments on the TUI Group’s net assets, �nancial position and results of operations were immaterial.
N O T E S Principles and methods underlying the consolidated §nancial statements 168
F O R E I G N E XC H A N G E T R A N S L AT I O N
Transactions in foreign currencies are translated into the functional currency at the foreign exchange rates pertaining at the date of the transaction. Any gains and losses resulting from the execution of such transactions and the translation of monetary assets and liabilities denominated in foreign currencies at the foreign exchange rate pertaining at the date of the transaction are shown in the income statement, with the exception of gains and losses to be recognised in equity as qualifying cash ®ow hedges.
The annual �nancial statements of companies are prepared in the respective functional currency. The functional currency of a company is the currency of the primary economic environment in which the company operates. With the exception of a small number of companies in the Tourism Segment, the functional currencies of all sub-sidiaries correspond to the currency of the country of incorporation of the respective subsidiary.
Where subsidiaries prepare their �nancial statements in functional currencies other than the euro, i.e. the Group’s reporting currency, the assets, liabilities and notes to the statement of �nancial position are translated at the mean rate of exchange applicable at the balance sheet date (closing rate). Goodwill allocated to these companies and adjustments of the fair value arising on the acquisition of a foreign company are treated as assets and liabilities of the foreign company and also translated at the mean rate of exchange applicable at the balance sheet date. The items of the income statement and hence the result for the year shown in the income statement are always translated at the mean rate of the month in which the respective transaction takes place.
Di§erences arising on the translation of the annual �nancial statements of foreign subsidiaries are carried outside pro�t and loss and separately shown as foreign exchange di§erences in the consolidated statement of changes in equity. When a foreign company or operation is sold, any foreign exchange di§erences previously carried in equity outside pro�t and loss are recognised as a gain or loss from disposal in the income statement through pro�t and loss.
Translation di§erences relating to non-monetary items with changes in their fair values eliminated through pro�t and loss (e.g. equity instruments measured at their fair value through pro�t and loss) are carried in the income statement. In contrast, translation di§erences for non-monetary items with changes in their fair values taken to equity (e.g. equity instruments classi�ed as available for sale) are carried in revenue reserves.
The TUI Group did not hold any subsidiaries operating in hyperin®ationary economies in the �nancial year under review, nor in the previous year.
The translation of the �nancial statements of foreign companies measured at equity follows the same principles for adjusting carrying amounts and translating goodwill as those used for consolidated subsidiaries.
N E T I N V E S T M E N T I N A F O R E I G N O P E R AT I O N
Monetary items receivable from or payable to a foreign operation, the settlement of which is neither planned nor likely in the foreseeable future, essentially constitute part of a net investment in this foreign operation. Foreign exchange di§erences from the translation of these monetary items are recognised in other comprehen-sive income, i.e. in equity outside pro�t and loss.
169Principles and methods underlying the consolidated §nancial statements N O T E S
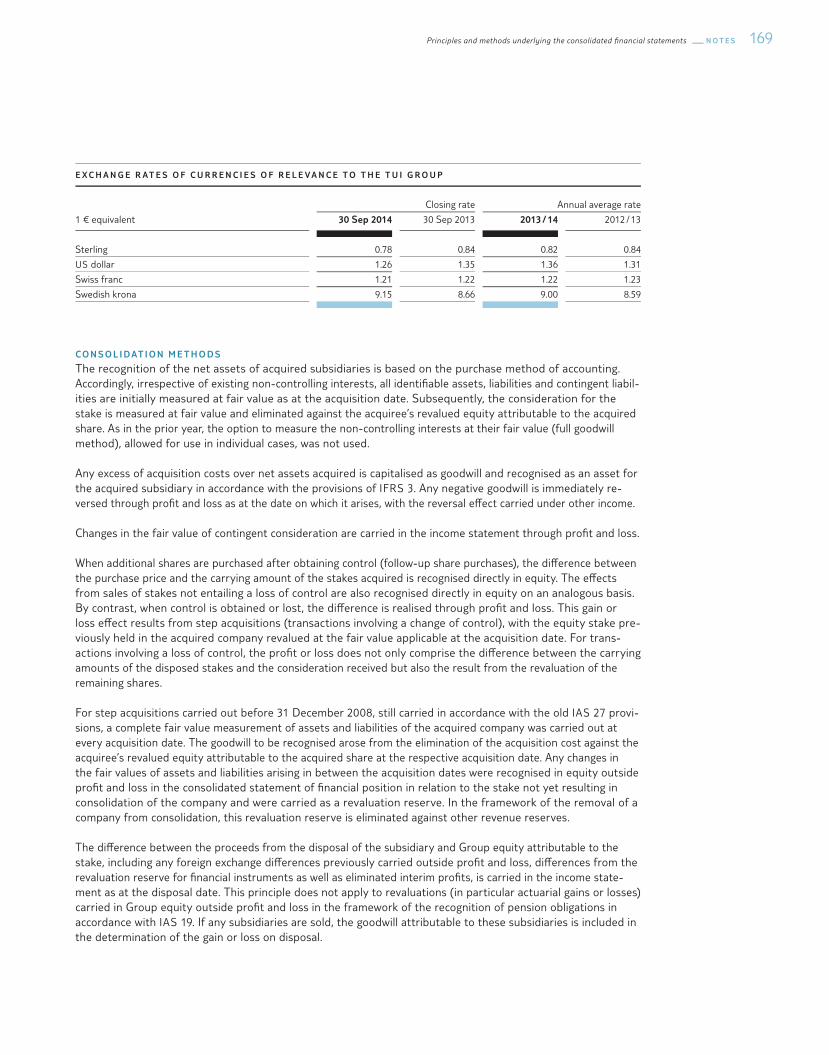
E X C H A N G E R AT E S O F C U R R E N C I E S O F R E L E V A N C E T O T H E T U I G R O U P
Closing rate Annual average rate
1 € equivalent 30 Sep 2014 30 Sep 2013 2013 / 14 2012 / 13
Sterling 0.78 0.84 0.82 0.84
US dollar 1.26 1.35 1.36 1.31
Swiss franc 1.21 1.22 1.22 1.23
Swedish krona 9.15 8.66 9.00 8.59
CO N S O L I DAT I O N M E T H O D S
The recognition of the net assets of acquired subsidiaries is based on the purchase method of accounting. Accordingly, irrespective of existing non-controlling interests, all identi�able assets, liabilities and contingent liabil-ities are initially measured at fair value as at the acquisition date. Subsequently, the consideration for the stake is measured at fair value and eliminated against the acquiree’s revalued equity attributable to the acquired share. As in the prior year, the option to measure the non-controlling interests at their fair value (full goodwill method), allowed for use in individual cases, was not used.
Any excess of acquisition costs over net assets acquired is capitalised as goodwill and recognised as an asset for the acquired subsidiary in accordance with the provisions of IFRS 3. Any negative goodwill is immediately re-versed through pro�t and loss as at the date on which it arises, with the reversal e§ect carried under other income.
Changes in the fair value of contingent consideration are carried in the income statement through pro�t and loss.
When additional shares are purchased after obtaining control (follow-up share purchases), the di§erence between the purchase price and the carrying amount of the stakes acquired is recognised directly in equity. The e§ects from sales of stakes not entailing a loss of control are also recognised directly in equity on an analogous basis. By contrast, when control is obtained or lost, the di§erence is realised through pro�t and loss. This gain or loss e§ect results from step acquisitions (transactions involving a change of control), with the equity stake pre-viously held in the acquired company revalued at the fair value applicable at the acquisition date. For trans-actions in volving a loss of control, the pro�t or loss does not only comprise the di§erence between the carrying amounts of the disposed stakes and the consideration received but also the result from the revaluation of the remaining shares.
For step acquisitions carried out before 31 December 2008, still carried in accordance with the old IAS 27 provi-sions, a complete fair value measurement of assets and liabilities of the acquired company was carried out at every acquisition date. The goodwill to be recognised arose from the elimination of the acquisition cost against the acquiree’s revalued equity attributable to the acquired share at the respective acquisition date. Any changes in the fair values of assets and liabilities arising in between the acquisition dates were recognised in equity outside pro�t and loss in the consolidated statement of �nancial position in relation to the stake not yet resulting in consolidation of the company and were carried as a revaluation reserve. In the framework of the removal of a company from consolidation, this revaluation reserve is eliminated against other revenue reserves.
The di§erence between the proceeds from the disposal of the subsidiary and Group equity attributable to the stake, including any foreign exchange di§erences previously carried outside pro�t and loss, di§erences from the revaluation reserve for �nancial instruments as well as eliminated interim pro�ts, is carried in the income state-ment as at the disposal date. This principle does not apply to revaluations (in particular actuarial gains or losses) carried in Group equity outside pro�t and loss in the framework of the recognition of pension obligations in accordance with IAS 19. If any subsidiaries are sold, the goodwill attributable to these subsidiaries is included in the determination of the gain or loss on disposal.
N O T E S Principles and methods underlying the consolidated §nancial statements 170
The Group’s major associates and joint ventures are measured at equity and carried at the cost to purchase as at the acquisition date. The group’s stake in associates and joint ventures includes the goodwill arising from the respective acquisition transaction.
The Group’s share in pro�ts and losses of associates and joint ventures is carried in the income statement as from the date of acquisition (Result from joint ventures and associates), while the Group’s share in changes in reserves is shown in its revenue reserves. The accumulated changes arising after the acquisition are shown in the carrying amount of the participation. Where the share in the loss of an associated company or joint venture equals or exceeds the Group’s original stake in this company, including other unsecured receivables, no further losses are recognised as a matter of principle. Any losses exceeding that stake are only recognised where obliga-tions have been assumed or payments have been made for the associated company or joint venture.
Intercompany pro�ts from transactions between subsidiaries are eliminated in full. Intercompany pro�ts from transactions with companies measured at equity are eliminated in relation to the Group’s stake in the com-pany. Intercompany losses are also eliminated if the transaction does not indicate an impairment in the trans-ferred asset.
Where the accounting and measurement methods applied by associates and joint ventures di§er from the uniform accounting rules applied in the Group and the di§erences are su¯ciently known and accessible, adjust-ments are made as a matter of principle.
Intercompany receivables and payables or provisions are eliminated. Intercompany turnover and other income as well as the corresponding expenses are eliminated. Intercompany results from intercompany deliveries and services are reversed through pro�t and loss, taking account of deferred taxes. However, intercompany losses are understood as suggesting that an impairment test is required for the transferred assets. Intercompany de-liveries and services are provided in conformity with the arm’s length principle.
Accounting and measurement methods
The �nancial statements of the consolidated subsidiaries are prepared in accordance with uniform accounting and measurement principles. The amounts recognised in the consolidated �nancial statements are not determined by tax regulations but solely by the commercial presentation of the net assets, �nancial position and results of operations as set out in the rules of the IASB.
T U R N OV E R R E CO G N I T I O N
Turnover comprises the fair value of the consideration received or to be received for the sale of products and services in the framework of ordinary business activities. Turnover is carried excluding value-added tax, returns, discounts and price rebates and after elimination of intra-Group sales.
As a matter of principle, turnover and other income is recognised upon rendering of the service or delivery of the assets and hence upon transfer of the risk.
The commission fees received by travel agencies for package tours are recognised once the travel agencies have performed their contractual obligations towards the tour operator. As a rule, this condition is met upon pay-ment by the customers or, at the latest, at the date of departure. The services of tour operators mainly consist in organising and coordinating package tours. Turnover from the organisation of tours is therefore recognised in full when the customer departs. Turnover from individual travel modules booked directly from airlines, hotel companies or incoming agencies by customers is recognised when the customers use the services concerned. Income from non-completed cruises is recognised according to the proportion of contract performance at the balance sheet date. The percentage of completion is determined as the ratio between travel days completed by the balance sheet date and overall travel days.
171Principles and methods underlying the consolidated §nancial statements N O T E S
Interest income is reported on a prorated basis according to the e§ective interest method. Dividends are recog-nised when the legal claim has arisen.
G O O DW I L L A N D O T H E R I N TA N G I B L E A S S E T S
Acquired intangible assets are carried at cost. Self-generated intangible assets, primarily software for use by the Group itself, are capitalised at cost where an in®ow of future economic bene�ts for the Group is probable and can be reliably measured. The cost to produce comprises direct costs and directly allocable overheads. Intan-gible assets with a limited service life are amortised over the expected useful life.
Intangible assets acquired in the framework of business combinations, such as order book, customer base or trademark rights, are carried at their fair value as at the date of acquisition and amortised on a straight-line basis.
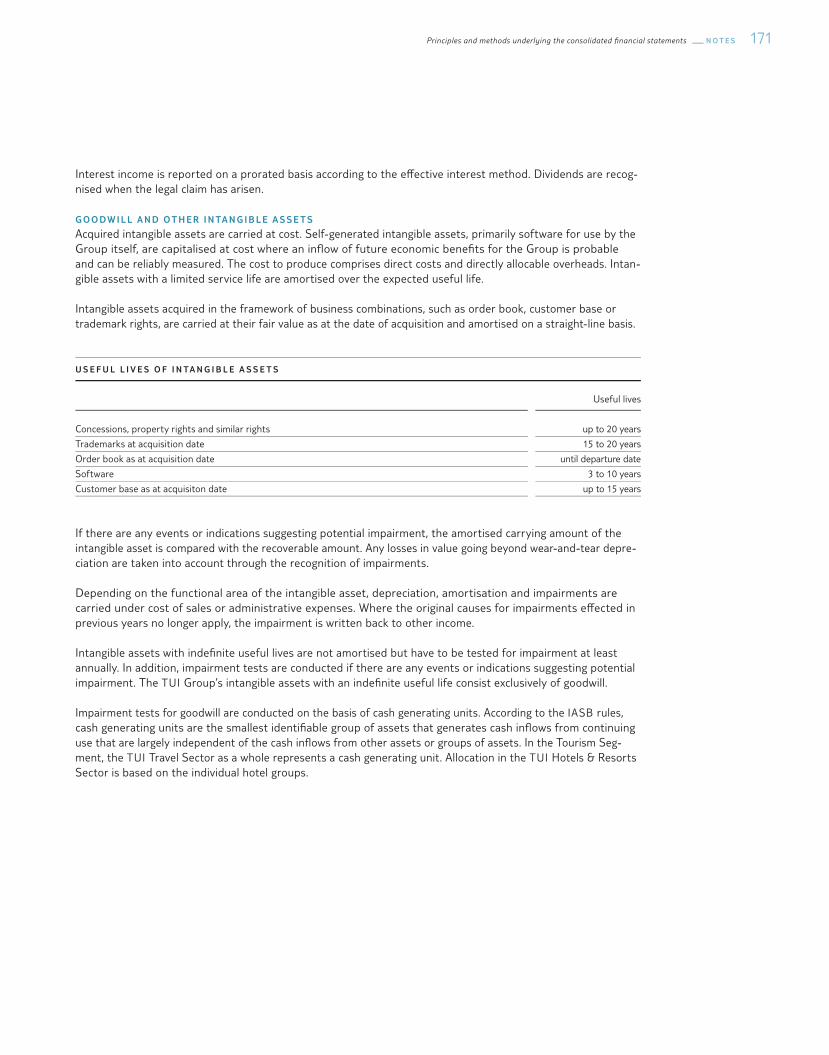
U S E F U L L I V E S O F I N TA N G I B L E A S S E T S
Useful lives
Concessions, property rights and similar rights up to 20 years
Trademarks at acquisition date 15 to 20 years
Order book as at acquisition date until departure date
Software 3 to 10 years
Customer base as at acquisiton date up to 15 years
If there are any events or indications suggesting potential impairment, the amortised carrying amount of the intangible asset is compared with the recoverable amount. Any losses in value going beyond wear-and-tear depre-ciation are taken into account through the recognition of impairments.
Depending on the functional area of the intangible asset, depreciation, amortisation and impairments are carried under cost of sales or administrative expenses. Where the original causes for impairments e§ected in previous years no longer apply, the impairment is written back to other income.
Intangible assets with inde�nite useful lives are not amortised but have to be tested for impairment at least annually. In addition, impairment tests are conducted if there are any events or indications suggesting potential impairment. The TUI Group’s intangible assets with an inde�nite useful life consist exclusively of goodwill.
Impairment tests for goodwill are conducted on the basis of cash generating units. According to the IASB rules, cash generating units are the smallest identi�able group of assets that generates cash in®ows from continuing use that are largely independent of the cash in®ows from other assets or groups of assets. In the Tourism Seg-ment, the TUI Travel Sector as a whole represents a cash generating unit. Allocation in the TUI Hotels & Resorts Sector is based on the individual hotel groups.
N O T E S Principles and methods underlying the consolidated §nancial statements 172
Impairments are e§ected where the carrying amount of the tested units plus the allocated goodwill exceeds the recoverable amount. The recoverable amount is the higher of fair value less costs of disposal and the present value of future payment ®ows of the tested entity based on continued use within the company (value in use). The fair value less costs of disposal corresponds to the amount that could be generated between knowledgeable, willing, independent business partners after deduction of the costs of disposal. Due to the restrictions applicable to the determination of cash ®ows when deriving the value in use, e.g. the requirement not to account for earnings e§ects from investments in expansions or from restructuring activities for which no provision was formed according to IAS 37, the fair value less costs of disposal usually exceeds the value in use and therefore represents the recoverable amount.
Impairments of goodwill required are shown separately in the consolidated income statement. In accordance with IAS 36, reversals of impairment losses for goodwill are prohibited.
P R O P E R T Y, P L A N T A N D E Q U I P M E N T
Property, plant and equipment are measured at amortised cost. The costs to purchase comprise the consider-ations spent to purchase an asset and to place it in a working condition. The costs to produce are determined on the basis of direct costs and appropriate allocations of overheads and depreciation.
Borrowing costs directly associated with the acquisition, construction or production of quali�ed assets are included in the costs to acquire or produce these assets until the assets are ready for their intended use. The capitalisation rate is 6.00 % for the �nancial year under review and 6.75 % for the previous year. In �nancial year 2013 / 14, borrowing costs of € 10.1 m (previous year € 9.6 m) were capitalised as part of the costs to purchase and costs to produce. Other borrowing costs are recognised as current expenses.
To the extent that funds are borrowed speci�cally for the purpose of obtaining a quali�ed asset, the underlying capitalisation rate is determined on the basis of the speci�c borrowing cost; in all other cases the weighted aver-age of the borrowing costs applicable to the borrowings outstanding is applied.
173Principles and methods underlying the consolidated §nancial statements N O T E S
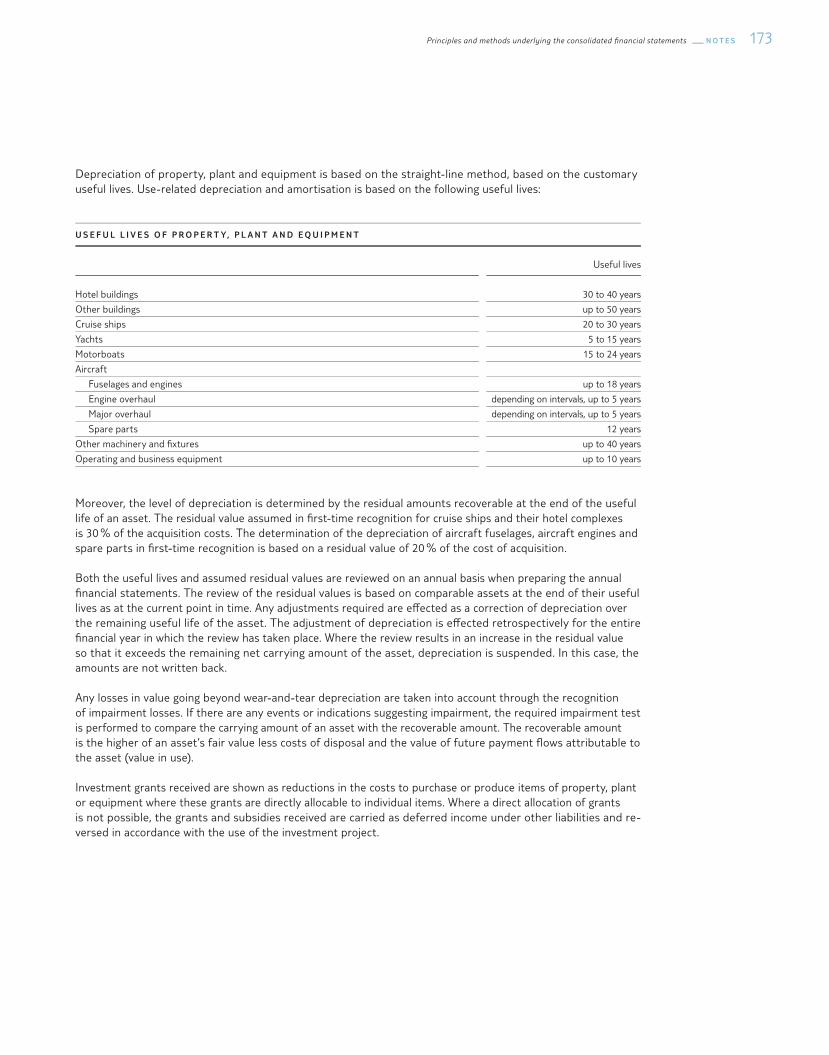
Depreciation of property, plant and equipment is based on the straight-line method, based on the customary useful lives. Use-related depreciation and amortisation is based on the following useful lives:
U S E F U L L I V E S O F P R O P E R T Y, P L A N T A N D E Q U I P M E N T
Useful lives
Hotel buildings 30 to 40 years
Other buildings up to 50 years
Cruise ships 20 to 30 years
Yachts 5 to 15 years
Motorboats 15 to 24 years
Aircraft
Fuselages and engines up to 18 years
Engine overhaul depending on intervals, up to 5 years
Major overhaul depending on intervals, up to 5 years
Spare parts 12 years
Other machinery and �xtures up to 40 years
Operating and business equipment up to 10 years
Moreover, the level of depreciation is determined by the residual amounts recoverable at the end of the useful life of an asset. The residual value assumed in �rst-time recognition for cruise ships and their hotel complexes is 30 % of the acquisition costs. The determination of the depreciation of aircraft fuselages, aircraft engines and spare parts in �rst-time recognition is based on a residual value of 20 % of the cost of acquisition.
Both the useful lives and assumed residual values are reviewed on an annual basis when preparing the annual �nancial statements. The review of the residual values is based on comparable assets at the end of their useful lives as at the current point in time. Any adjustments required are e§ected as a correction of depreciation over the remaining useful life of the asset. The adjustment of depreciation is e§ected retrospectively for the entire �nancial year in which the review has taken place. Where the review results in an increase in the residual value so that it exceeds the remaining net carrying amount of the asset, depreciation is suspended. In this case, the amounts are not written back.
Any losses in value going beyond wear-and-tear depreciation are taken into account through the recognition of impairment losses. If there are any events or indications suggesting impairment, the required impairment test is performed to compare the carrying amount of an asset with the recoverable amount. The recoverable amount is the higher of an asset’s fair value less costs of disposal and the value of future payment ®ows attributable to the asset (value in use).
Investment grants received are shown as reductions in the costs to purchase or produce items of property, plant or equipment where these grants are directly allocable to individual items. Where a direct allocation of grants is not possible, the grants and subsidies received are carried as deferred income under other liabilities and re-versed in accordance with the use of the investment project.
N O T E S Principles and methods underlying the consolidated §nancial statements 174
L E A S E S
F I N A N C E L E A S E S
In accordance with IAS 17, leased property, plant and equipment in which the TUI Group carries all essential risks and rewards incident to ownership of the assets are capitalised. Capitalisation is based on the fair value of the asset or the present value of the minimum lease payments, if lower. Depreciation is charged over the useful life or the lease term, if shorter, on the basis of the depreciation method applicable to comparable purchased or manufactured assets. Payment obligations arising from future lease payments are carried as liabilities with no consideration of future interest expenses. Every lease payment is broken down into an interest portion and a redemption portion so as to produce a constant periodic rate of interest on the remaining balance of the liability. The interest portion is carried in the income statement through pro�t or loss.
Where companies of the TUI Group are lessors in �nance leases, receivables equivalent to the net investment value are carried for the leases. The periodic distribution of the income from �nance leases results in constant interest payments on the outstanding net investment volume of the leases over the course of time.
O P E R AT I N G L E A S E S
Both expenses made and income received under operating leases are recognised in the income statement on a straight-line basis over the term of the corresponding leases.
S A L E - A N D - L E A S E - B AC K T R A N S AC T I O N S
Gains from sale-and-lease-back transactions resulting in a �nance lease are recognised in income over the term of the lease.
If a sale-and-lease-back transaction results in an operating lease, a gain or loss is recognised immediately if the transaction has demonstrably been carried out at fair value. If a loss is compensated for by future lease pay-ments at below-market price, this loss is to be deferred and amortised over the term of the lease agreement. If the agreed purchase price exceeds fair value, the gain from the di§erence between these two values is also deferred and amortised.
I N V E S T M E N T P R O P E R T Y
Property not occupied for use by subsidiaries and exclusively held to generate rental income and capital gains is recognised at amortised cost. This property is depreciated over a period of up to 50 years.
F I N A N C I A L I N S T R U M E N T S
Financial instruments are contractual rights or obligations that will lead to an in®ow or out®ow of �nancial assets or the issue of equity rights. They also comprise derivative rights or obligations derived from primary assets.
In accordance with IAS 39, �nancial instruments are broken down into �nancial assets or liabilities to be meas-ured at fair value through pro�t and loss, loans and receivables, �nancial assets available for sale, �nancial assets held to maturity and other liabilities.
In terms of �nancial instruments measured at fair value through pro�t and loss, the TUI Group holds derivative �nancial instruments mainly to be classi�ed as held for trading as they do not meet the balance sheet-related criteria as hedges in the framework of a hedging relationship. The fair value option is not exercised. Moreover, the TUI Group holds �nancial assets in the loans and receivables and available for sale categories. However, the present �nancial statements do not include any assets held to maturity.
175Principles and methods underlying the consolidated §nancial statements N O T E S
In �nancial year 2013 / 14, no major reclassi�cations were e§ected within the individual measurement categories (previous year no reclassi�cations).
P R I M A RY F I N A N C I A L A S S E T S A N D F I N A N C I A L L I A B I L I T I E S
Primary �nancial assets are recognised at the value as at the trading date on which the Group commits to buy the asset. Primary �nancial assets are classi�ed as loans and receivables or as �nancial assets available for sale when recognised for the �rst time. Loans and receivables as well as �nancial assets available for sale are initially recognised at fair value plus transaction costs.
Loans and receivables are non-derivative �nancial assets with �xed or �xable contractual payments not listed in an active market. They are shown under trade accounts receivable and other assets in the statement of �nancial position and classi�ed as current receivables if they mature within twelve months after the balance sheet date.
In the framework of follow-up measurement, loans and receivables are measured at amortised cost based on the e§ective interest method. Value adjustments are made to account for identi�able individual risks. Where objective information indicates that impairments are required, e.g. substantial �nancial di¯culties of the counter-party, payment delays or adverse changes in regional industry conditions expected to impact the Group’s borrowers in the light of past experience, impairments are e§ected at an amount corresponding to the expected loss. Impairments and reversals of impairments are carried under cost of sales, administrative expenses or �nancial expenses, depending on the technical nature of the transaction.
Financial assets available for sale are non-derivative �nancial assets either individually expressly allocated to this category or not allocable to any other category of �nancial assets. In the TUI Group, they exclusively consist of stakes in companies and securities. They are allocated to non-current assets unless the management intends to sell them within twelve months after the balance sheet date.
Financial assets available for sale are measured at their fair value upon initial measurement. Changes in fair values are carried in equity outside pro�t and loss until the disposal of the assets. A permanent reduction in fair value gives rise to impairments recognised through pro�t or loss. In the event of subsequent reversal of the impairment, the impairment carried through pro�t or loss is not reversed for equity instruments but eliminated against equity outside pro�t and loss. Where a listed market price in an active market is not available for shares held and other methods to determine an objective market value are not applicable, the equity instruments are measured at cost to purchase.
A derecognition of assets is primarily e§ected as at the date on which the rights for payments from the asset expire or are transferred and therefore as at the date essentially all risks and rewards of ownership are transferred.
Primary �nancial liabilities are carried in the consolidated statement of �nancial position if an obligation exists to transfer cash and cash equivalents or other �nancial assets to another party. First-time recognition of a primary liability is e§ected at its fair value. For loans taken out, the nominal amount received is reduced by dis-counts obtained and borrowing costs paid. In the framework of follow-up measurement, primary �nancial liabilities are measured at amortised cost based on the e§ective interest method.
N O T E S Principles and methods underlying the consolidated §nancial statements 176
D E R I VAT I V E F I N A N C I A L I N S T R U M E N T S A N D H E D G I N G
In the framework of initial measurement, derivative �nancial instruments are measured at the fair value attrib-utable to them on the date the contract is entered into. The follow-up measurement is also e§ected at the fair value applicable at the respective balance sheet date. Where derivative �nancial instruments are not part of a hedge in connection with hedge accounting, they have to be classi�ed as held for trading in accordance with IAS 39.
The method used to carry pro�ts and losses depends on whether the derivative �nancial instrument has been classi�ed as a hedge and on the type of underlying hedged item. Changes in the fair values of derivative �nancial instruments are immediately carried through pro�t and loss unless they are classi�ed as a hedge in accordance with IAS 39. If, by contrast, they are classi�ed as an e§ective hedge in accordance with IAS 39, the transaction is recognised as a hedge.
The TUI Group applies the hedge accounting provisions relating to hedging of balance sheet items and future cash ®ows. Depending on the nature of the underlying transaction, the Group classi�es derivative �nancial instru-ments either as fair value hedges against exposure to changes in the fair value of assets or liabilities or as cash ®ow hedges against variability in cash ®ows from highly probable future transactions.
Upon conclusion of the transaction, the Group documents the hedge relationship between the hedge and the underlying item, the risk management goal and the underlying strategy. In addition, a record is kept of the assess-ment, both at the beginning of the hedge relationship and on a continual basis, as to whether the derivatives used for the hedge are highly e§ective in compensating for the changes in the fair values or cash ®ows of the underlying transactions.
Changes in the fair value of derivatives used as fair value hedges for the recognised assets or liabilities are carried through pro�t and loss. Moreover, the carrying amounts of the underlying transactions are adjusted through pro�t and loss for the gains or losses resulting from the hedged risk.
The e§ective portion of changes in the fair value of derivatives forming cash ®ow hedges is recognised in equity. Any ine§ective portion of such changes in the fair value, by contrast, is recognised immediately in the income statement through pro�t and loss. Amounts taken to equity are reclassi�ed to the income statement and carried as income or expenses in the period in which the hedged item has an e§ect on results.
If a hedge expires, is sold or no longer meets the criteria for hedge accounting, the cumulative gain or loss remains in equity and is only carried in the income statement through pro�t and loss when the originally hedged future transaction occurs. If the future transaction is no longer expected to take place, the cumulative gains or losses recognised directly in equity are recognised immediately through pro�t and loss.
I N V E N TO R I E S
Inventories are measured at the lower of cost or net realisable value. Net realisable value is the estimated selling price less the estimated cost incurred until completion and the estimated variable costs required to sell. All inventories are written down individually where the net realisable value of inventories is lower than their carrying amounts. Where the original causes of inventory write-downs no longer apply, the write-downs are reversed. The measurement method applied to similar inventory items is the weighted average cost formula.
177Principles and methods underlying the consolidated §nancial statements N O T E S
C A S H A N D C A S H E Q U I VA L E N T S
Cash and cash equivalents comprise cash, call deposits, other current highly liquid �nancial assets with an original term of a maximum of three months and current accounts. Used credits in current accounts are shown as liabilities to banks under current �nancial liabilities.
N O N - C U R R E N T A S S E T S H E L D F O R S A L E
Non-current assets and disposal groups are classi�ed as held for sale if the associated carrying amount will be recovered principally through sale rather than through continued use.
The measurement is e§ected at the lower of carrying amount and fair value less costs to sell. Depreciation and at equity measurements have to be suspended. Impairments to fair value less costs to sell must be carried through pro�t and loss, with any gains on subsequent remeasurement resulting in the recognition of pro�ts of up to the amount of the cumulative impairment cost.
E Q U I T Y
Ordinary shares are classi�ed as equity. Costs directly allocable to the issue of new shares or conversion options are taken to equity on a net after-tax basis as a deduction from the issuance proceeds.
H Y B R I D C A P I TA L
In accordance with IAS 32, the hybrid capital issued at the end of �nancial year 2005 has to be recognised as one of the Group’s equity components due to the bond terms. Accordingly, the tax-deductible interest payments are not shown under interest expenses but treated in analogy to dividend obligations to TUI AG shareholders. Any bor-rowing costs incurred were directly deducted from the hybrid capital, taking account of deferred income taxes.
P R OV I S I O N S
Other provisions are formed when the Group has a current legal or constructive obligation as a result of a past event and where in addition it is probable that assets will be impacted by the settlement of the obligation and the level of the provision can be reliably determined. Provisions for restructuring measures comprise severance payments to employees and payments for the early termination of rental agreements. Provisions for environ-mental protection measures, in particular the disposal of legacy industry waste, are carried if future cash out-®ows are likely due to legal and public obligations to implement safeguarding or restoration measures, if the cost of these measures can be reliably estimated and the measures are not expected to lead to a future in®ow of bene�ts.
Provisions for onerous losses are formed if the unavoidable costs of meeting contractual obligations exceed the expected economic bene�t. Any assets concerned are impaired, if necessary, prior to forming the appropriate provision. No provisions are carried for future operating losses.
Where a large number of similar obligations exist, the probability of a charge over assets is determined on the basis of this group of obligations. A provision is also carried if the probability of a charge over assets is low in relation to an individual obligation contained in this group.
Provisions are measured at the present value of the expected expenses, taking account of a pre-tax interest rate, re®ecting current market assessments of the time value of money and the risks speci�c to the liability. Risks already taken into account in estimating future cash ®ows do not a§ect the discount rate. Increases in provisions due to accrued interest are carried as interest expenses through pro�t or loss.
N O T E S Principles and methods underlying the consolidated §nancial statements 178
The pension provision recognised for de�ned bene�t plans corresponds to the net present value of the de�ned bene�t obligations (DBOs) as at the balance sheet date less the fair value of the plan assets. Measurement of these assets is limited to the net present value of the value in use in the form of reimbursements from the plan or reductions in future contribution payments. The DBOs are calculated annually by independent actuaries using the projected unit credit method. The net present value of the DBOs is calculated by discounting the ex-pected future out®ows of cash at a rate based on the interest rate of top-rated corporate bonds.
Past service cost is immediately recognised through pro�t or loss. Revaluations (in particular actuarial gains and losses) arising from the regular adjustment of actuarial parameters are eliminated against equity outside pro�t and loss in full when they occur.
For de�ned contribution plans, the Group pays contributions to public or private pension insurance plans on the basis of a statutory or contractual obligation or on a voluntary basis. The Group does not have any further payment obligations on top of the payment of the contributions. The contributions are carried under sta§ costs when they fall due.
L I A B I L I T I E S
Liabilities are always carried at the date on which they arise at fair value less borrowing and transaction costs. Over the course of time, liabilities are measured at amortised cost based on application of the e§ective interest method.
When issuing bonds comprising a debt component and a second component in the form of conversion options or warrants, the proceeds obtained for the respective components are recognised in accordance with their character. At the issuing date, the debt component is carried as a bond at a value that would have been generated for the issue of this debt instrument without corresponding conversion options or warrants on the basis of current market terms. If the conversion options or warrants have to be classi�ed as equity instruments, the di§erence over the issuing proceeds generated is transferred to the capital reserve with deferred taxes taken into account.
As a matter of principle, the foreign exchange di§erences resulting from the translation of trade accounts payable are reported as a correction of the cost of sales. Foreign exchange di§erences from the translation of lia bilities not resulting from normal performance processes are carried under other income / other expenses, �nancial ex-penses / income or administrative expenses, depending on the nature of the underlying liability.
D E F E R R E D TA X E S
In accordance with IAS 12, deferred taxes are determined using the balance sheet liability method. Accordingly, probable future tax assets and liabilities are recognised for all temporary di§erences between the carrying amounts of assets and liabilities for �nancial reporting purposes and the amounts used for taxation purposes.
Expected tax savings from the use of loss carryforwards assessed as recoverable in the future are capitalised. Although there continues to be no time limit for German loss carryforwards, the annual use of such carryforwards is restricted by means of minimum taxation. Foreign loss carryforwards frequently have to be used within a given country-speci�c time limit and are subject to restrictions concerning the use of these loss carryforwards for pro�ts on ordinary activities, which are taken into account accordingly in the measurement.
Income tax is directly charged or credited to equity if the tax relates to items directly credited or charged to equity in the same period or some other period.
179Principles and methods underlying the consolidated §nancial statements N O T E S
Deferred tax assets are carried to the extent that it is probable that future taxable pro�ts will be available against which the temporary di§erence or an unused tax loss can be utilised.
Deferred taxes are measured at the tax rates and tax provisions applicable at the balance sheet date or adopted by law and expected to be applicable at the date of recognition of the deferred tax asset or the payment of the deferred tax liability.
C U R R E N T I N CO M E TA X E S
The German companies of the TUI Group have to pay trade income tax of 15.2 % or 15.7 % (previous year 15.2 % or 15.7 %), depending on the applicable rate. As in the prior year, the corporation tax rate is 15.0 %, plus a 5.5 % solidarity surcharge on corporation tax.
The calculation of foreign income taxes is based on the laws and provisions applicable in the individual countries. The income tax rates applied to foreign companies vary from 0 % to 40.0 %.
Deferred and current income tax liabilities are o§set against the corresponding tax assets where they exist in the same �scal territory and have the same nature and maturity.
S H A R E - B A S E D PAY M E N T S
All share-based payment schemes in the Group are payment schemes paid in cash or via equity instruments.
For transactions with cash compensation, the resulting liability for the Group is charged to expenses at its fair value as at the date of the performance of the service by the bene�ciary. Until payment of the liability, the fair value of the liability is remeasured at every closing date and all changes in the fair value are carried through pro�t and loss.
In the Tourism Segment, share-based payment schemes exist in the form of share award programmes granted by TUI Travel PLC. Under these payment schemes, directors and employees are entitled to acquire shares in TUI Travel PLC. The fair value of the awards granted is carried under sta§ costs with a corresponding direct in-crease in equity. The fair value is determined at the point when the awards are granted and spread over the vesting period during which the employees become entitled to the awards.
The fair value of the awards granted is measured using option valuation models, taking into account the terms and conditions upon which the awards were granted. The amount to be carried under sta§ costs is adjusted to re®ect the actual number of share options that vest except where forfeiture is due only to market-based per-formance conditions not meeting the thresholds for vesting.
Transactions to acquire shares in TUI Travel PLC to perform the share option plans are taken directly to revenue reserves in equity.
N O T E S Principles and methods underlying the consolidated §nancial statements 180
S U M M A RY O F S E L E C T E D AC CO U N T I N G A N D M E A S U R E M E N T M E T H O D S
The table below lists the key accounting and measurement methods used by the TUI Group.
S U M M A R Y O F S E L E C T E D M E A S U R E M E N T M E T H O D S
Item in the statement of �nancial position Measurement base
Assets
Goodwill At cost (subsequent measurement: impairment test)
Other intangible assets with inde�nite useful lives At cost (subsequent measurement: impairment test)
Other intangible assets with de�nite useful lives At amortised cost
Property, plant & equipment At amortised cost
Equity accounted investments At cost as adjusted for post-acquisition changes in the
Group's share of the investment's net assets
Financial assets
Loans and receivables At amortised cost
Held to maturity Not applicable
Held for trading / Derivatives At fair value
Available for sale Fair value (with gains or losses recognised within other
comprehensive income) or at cost
Inventory Lower of cost and net realisable value
Trade and other receivables At amortised cost
Cash and cash equivalents At cost
Assets held for sale Lower of cost and fair value less costs of disposal
Liabilities and Provisions
Loans and borrowings At amortised cost
Provision for pensions Projected unit credit method
Other provisions Present value of the settlement amount
Financial liabilities
Non-derivative �nancial liabilities Amortised cost
Derivative �nancial liabilities At fair value
Payables, trade and other liabilities Amortised cost
Key estimates and judgements
The presentation of the assets, liabilities, provisions and contingent liabilities shown in the consolidated �nancial statements is based on estimates and judgements. Any uncertainties are appropriately taken into account in de-termining the values.
All estimates and judgements are based on the conditions and assessments as at the balance sheet date. In evaluating the future development of business, account was taken of the future economic environment in the business areas and regions in which the Group operates, assumed to be realistic as at that point in time.
181Principles and methods underlying the consolidated §nancial statements N O T E S
Estimates and judgements that may have a material impact on the amounts carried for assets and liabilities in the TUI Group are mainly related to the following balance sheet-related facts and circumstances:
• Establishment of assumptions in the framework of impairment tests, in particular for goodwill,• Determination of the fair values in the framework of acquisitions of companies and determination of the use-
ful lives of acquired intangible assets,• Determination of useful lives and residual carrying amounts of property, plant and equipment,• Determination of parameters to measure pension obligations, • Recognition and measurement of other provisions, • Recoverability of future tax savings from tax loss carryforwards and tax-deductible temporary di§erences, and • Measurement of tax risks
Other estimates and judgements relate, in particular, to the determination of the fair value of �nancial instru-ments and the determination of the recoverable amount in the framework of impairment tests for companies measured at equity.
Despite careful preparation of the estimates, actual developments may deviate from these. In such cases, the as-sumptions and the carrying amounts of the assets and liabilities concerned, if necessary, are adjusted accord-ingly. As a matter of principle, changes in estimates are taken into account in the �nancial year in which the changes have occurred and in future periods.
G O O DW I L L
The goodwill reported as at 30 September 2014 had a carrying amount of € 3,136.2 m (previous year € 2,976.4 m). As goodwill is not amortised, its carrying amount is compared with the recoverable amounts at the level of cash generating units in order to establish its value. The TUI Group carries out this impairment test at least once a year towards the end of the �nancial year. The determination of the recoverable amount of a CGU for the implementation of the impairment test requires estimates and judgement with regard to the methodology used and the assumptions, which may have a considerable e§ect on the recoverable amount and the level of a potential impairment. They relate, in particular, to the weighted average cost of capital (WACC) after income taxes, used as the discounting basis, the growth rate of perpetuity and the forecasts for future cash ®ows including the underlying budget assumptions based on corporate planning. Changes in these assumptions may have a sub-stantial impact on the recoverable amount and the level of a potential impairment.
Detailed disclosures about the implementation of the impairment test and the methods and assumptions used are provided in the section on Goodwill and other intangible assets in the chapter on Accounting and meas-urement methods.
ACQ U I S I T I O N O F CO M PA N I E S A N D I N TA N G I B L E A S S E T S
In accounting for business combinations, the identi�able assets, liabilities and contingent liabilities acquired have to be measured at their fair values. In this context, cash ®ow-based methods are regularly used. Depending on the assumptions underlying such methods, di§erent results may be produced. In particular, some judge-ment is required in estimating the economic useful lives of intangible assets and determining the fair values of contingent liabilities.
Detailed information on acquisitions of companies or useful lives of intangible assets is provided in the section Acquisitions – divestments in the chapter on Principles and methods of consolidation and in the section on Good-will and other intangible assets of the chapter Accounting and measurement methods.
N O T E S Principles and methods underlying the consolidated §nancial statements 182
P R O P E R T Y, P L A N T A N D E Q U I P M E N T
The measurement of wear-and-tear property, plant and equipment items entails estimates. The carrying amount of property, plant and equipment as at 30 September 2014 totals € 2,836.6 (previous year € 2,682.0 m). In order to review the amounts carried, an evaluation is carried out on an annual basis to assess whether there are any indications of a potential impairment. These indications relate to numerous areas and factors, e. g. the market-related or technical environment but also physical condition. If any such indication exists, management must estimate the recoverable amount on the basis of expected payment ®ows and appropriate interest rates. Moreover, essential estimates and judgements relate to the de�nition of economic useful lives as well as the re-sidual amounts of items of property, plant and equipment which may be recovered.
More detailed information on the useful lives and residual values of property, plant and equipment items is pro-vided in the section Property, plant and equipment in the chapter on Accounting and measurement methods.
P E N S I O N P R OV I S I O N S
As at 30 September 2014, the carrying amount of the provisions for pensions and similar liabilities totals € 1,274.5 m (previous year € 1,136.0 m).
In order to determine the obligations under de�ned bene�t pension schemes, actuarial calculations are used which depend heavily on underlying assumptions concerning life expectancy and the discount rate. The discount rate used is the interest rate for �rst-class corporate bonds denominated in the currencies in which the bene�ts are paid and with maturities corresponding to those of the pension obligations.
At the balance sheet date, plan assets total € 1,980.0 m (previous year € 1,616.6 m). As assets classi�ed as plan assets are never available for short-term sale, the fair values of these plan assets may change signi�cantly by the realisation date. The interest rate used to discount the liability is also used to determine the expected re-turn on plan assets.
Detailed information on actuarial assumptions is provided in the Notes to pension provisions carried in the state-ment of �nancial position under Note 32.
O T H E R P R OV I S I O N S
As at 30 September 2014, other provisions of € 1,073.6 m (previous year 1,024.2 m) are shown. When recognising and measuring provisions, considerable assumptions are required about probability of occurrence, maturity and level of risk. Provisions are formed if a past event has resulted in a current legal or factual obligation, if an out®ow of assets is probable in order to meet that obligation, and if a reliable estimate can be made of the amount of the liability.
Determining whether a current obligation exists is usually based on estimates by internal or external experts. The amount of provisions is based on expected expenses, and is either calculated by assessing the speci�c case in the light of empirical values, outcomes from comparable facts and circumstances or potential bandwidths, or else estimated by experts. Due to the uncertainties associated with assessment, actual expenses may deviate from estimates so that unexpected charges may result.
More detailed information on other provisions is o§ered in the Notes to the statement of �nancial position under Note 33.
D E F E R R E D TA X A S S E T S
As at 30 September 2014, deferred tax assets totalling € 238.1 m (previous year € 224.6 m) were carried. Prior to o§setting against deferred tax liabilities, deferred tax assets total € 595.5 m, including an amount of € 135.3 m (previous year € 160.8 m) for capitalised loss carryforwards. The assessment of the usability of deferred tax assets is based on the ability of the respective Group company to generate su¯cient taxable income. TUI therefore assesses as at every balance sheet date whether the recoverability of expected future tax savings is su¯ciently probable in order to recognise deferred tax assets. The assessment is based on various factors including inter-nal forecasts regarding the future tax asset situation of the Group. If the assessment of the recoverability of future deferred tax claims changes, impairments may be e§ected, if necessary, for the deferred tax assets.
183Principles and methods underlying the consolidated §nancial statements N O T E S
More detailed information on deferred tax assets is available in the Notes to the statement of �nancial position under Note 22.
C U R R E N T I N CO M E TA X E S
The Group is liable to pay income taxes in various countries. Key estimates are required when determining in-come tax liabilities. For certain transactions and calculations the �nal tax charge cannot be determined during the ordinary course of business. The level of obligations for expected tax audits is based on an estimation of whether and to what extent additional income taxes will be due. Judgements are corrected, if necessary, in the period in which the �nal tax charge is determined.
N O T E S Segment reporting184
Segment reporting
Notes to the segments
The identi�cation of operating segments is based on the internal organisational and reporting structure, built around the di§erent products and services within the TUI Group. Allocation of individual organisational entities to operating segments is exclusively based on economic criteria, irrespective of the participation structure under company law. For the presentation of reportable segments in accordance with IFRS 8, both operating seg-ments with comparable economic features and operating segments not meeting the quantitative thresholds are aggregated with other operating segments.
The Group’s core business is the Tourism Segment. The Tourism Segment consists of TUI Travel, TUI Hotels & Resorts and the Cruises Sector. The Sectors constitute the reportable segments according to IFRS 8.
TUI Travel comprises all distribution, tour operator, airline and incoming activities of the TUI Group. Operational management of the Mainstream, Specialist & Activity and Accommodation & Destinations Businesses is exer-cised by the management of TUI Travel PLC. TUI Hotels & Resorts comprises all hotel activities of the Group outside the TUI Travel Group.
The Cruises Sector consists of Hapag-Lloyd Kreuzfahrten and the TUI Cruises activities, a joint venture measured at equity.
The category entitled All other segments carries the Group’s real estate companies, all non-allocable business activ-ities (in particular holding companies) and the result from the measurement of the stake in Container Shipping.
Expenses for and income from TUI AG’s management tasks are allocated to the individual segments they are asso-ciated with.
Notes to the segment data
As a rule, inter-segment business transactions are based on the arm’s length principle, as applied in transactions with third parties.
The operating segment assets and liabilities comprise assets and liabilities, excluding �nancial assets, �nancial liabilities, pension provisions and income taxes. Goodwill is also shown as segment assets.
Non-current assets comprise goodwill, other intangible assets, property, plant and equipment and the non-current components of other assets.
Investments are additions of property, plant and equipment as well as intangible assets. Depreciation and amorti-sation relate to segment �xed assets and do not include goodwill impairments.
Non-cash expenses do not include depreciation or reversals of depreciation.
Proceeds from the disposal of subsidiaries are allocated to the individual segment revenues.

185Segment reporting N O T E S
Financial assets as well as cash and cash equivalents are used to generate the �nancial result. Financial liabilities and pension provisions are carried as interest-bearing liabilities and are used to �nance the operating and invest-ing activities.
Reconciliation of segment assets and liabilities to the Group’s assets or liabilities has to take account of income tax assets or income tax provisions and liabilities.
Segment reporting discloses in particular performance indicators such as EBITA , underlying EBITA , EBITDA and EBITDAR since these indicators are used for value-oriented corporate management. EBITA represents the consolidated performance indicator within the meaning of IFRS 8. As the investment in Hapag-Lloyd Holding AG constitutes a �nancial investment from TUI AG’s perspective, the at equity result from Container Shipping is not taken into account in calculating earnings by the segments.

N O T E S Segment reporting186
K E Y F I G U R E S B Y S E G M E N T A N D S E C T O R
Tourism All other Segments Consolidation Group
€ million
2013 / 14 2012 / 13
restated
2013 / 14 2012 / 13
restated
2013 / 14 2012 / 13 2013 / 14 2012 / 13
restated
Statement of results
Turnover 18,700.2 18,460.1 14.5 17.4 – – 18,714.7 18,477.5
Inter-segment turnover 13.3 18.0 11.6 22.5 – 24.9 – 40.5 – –
Segment turnover 18,713.5 18,478.1 26.1 39.9 – 24.9 – 40.5 18,714.7 18,477.5
Group pro�t for the year 283.9 166.4
Income taxes 221.7 145.0
Earnings before taxes (EBT) 652.9 496.8 – 147.3 – 185.4 – – 505.6 311.4
of which share of results of joint ventures and associates 78.9 81.6 – 38.9 – 22.3 – – 40.0 59.3
Net interest result and result from the measurement of interest hedges 172.2 167.9 57.1 84.9 – – 229.3 252.8
Impairment of goodwill – 8.3 – – – – – 8.3
Result from Container Shipping measured at equity – – 38.9 22.3 – – 38.9 22.3
Earnings before interest, taxes and amortisation of goodwill (EBITA) 825.1 673.0 – 51.3 – 78.2 – – 773.8 594.8
Adjustments 94.7 150.8 – 16.3 – – 94.7 167.1
Underlying EBITA 919.8 823.8 – 51.3 – 61.9 – – 868.5 761.9
Amortisation of other intangible assets and depreciation of property, plant and equipment 404.8 408.2 2.2 10.7 – – 407.0 418.9
of which impairments 21.5 36.3 0.1 6.6 – – 21.6 42.9
Other depreciation/amortisation and write-backs 8.7 1.0 – 2.1 – – 8.7 3.1
of which write-backs 9.3 3.3 – 2.1 – – 9.3 5.4
Earnings before interest, taxes, depreciation and amortisation (EBITDA) 1,221.2 1,080.2 – 49.1 – 69.6 – – 1,172.1 1,010.6
Rental expenses 795.0 795.4 – 5.5 3.7 – 3.1 798.7 797.8
Earnings before interest, taxes, depreciation, amortisation and rental expenses (EBITDAR) 2,016.2 1,875.6 – 49.1 – 64.1 3.7 – 3.1 1,970.8 1,808.4
Assets and liabilities
Segment assets 9,015.3 8,573.6 658.6 214.0 – 0.4 0.8 9,673.5 8,788.4
of which goodwill 3,136.2 2,976.4 – – – – 3,136.2 2,976.4
Carrying amounts of joint ventures and associates 988.0 864.5 – 521.9 – – 988.0 1,386.4
Interest-bearing Group receivables 80.6 57.5 909.4 989.3 – 990.0 – 1,046.8 – –
Cash and cash equivalents 1,914.9 2,194.7 371.1 507.0 – – 2,286.0 2,701.7
Other �nancial assets 377.6 236.3 2,808.1 2,451.7 – 2,439.1 – 2,388.7 746.6 299.3
Non-allocable taxes – – – – – – 332.1 278.5
Total assets 14,026.2 13,454.3
Segment liabilities 7,386.9 6,733.2 280.4 263.1 – 5.5 – 4.5 7,661.8 6,991.8
Third-party �nancial liabilities 1,305.1 2,145.9 657.8 623.7 – – 1,962.9 2,769.6
Group �nancial liabilities 908.6 987.7 81.9 58.1 – 990.5 – 1,045.8 – –
Other �nancial liability items 1,175.6 1,008.4 361.5 336.8 – – 1,537.1 1,345.2
Non-allocable taxes – – – – – – 347.3 351.0
Total liabilities and provisions 11,509.1 11,457.6
Additional disclosures
Non-cash expenses 54.5 38.4 38.9 22.3 – – 93.4 60.7
Non-cash income 104.7 101.6 – – – – 104.7 101.6
Return on sales (on EBITA) % 4.4 3.6 – – – – 4.1 3.2
Investments 828.6 817.3 1.9 3.5 – – 830.5 820.8
Investments in goodwill 27.0 29.4 – – – – 27.0 29.4
Investments in other intangible assets and property, plant and equipment 801.6 787.9 1.9 3.5 – – 803.5 791.4
Financing ratio % 48.9 51.0 115.8 305.7 – – 49.0 52.0
Employees at year-end 77,082 74,040 227 405 – – 77,309 74,445
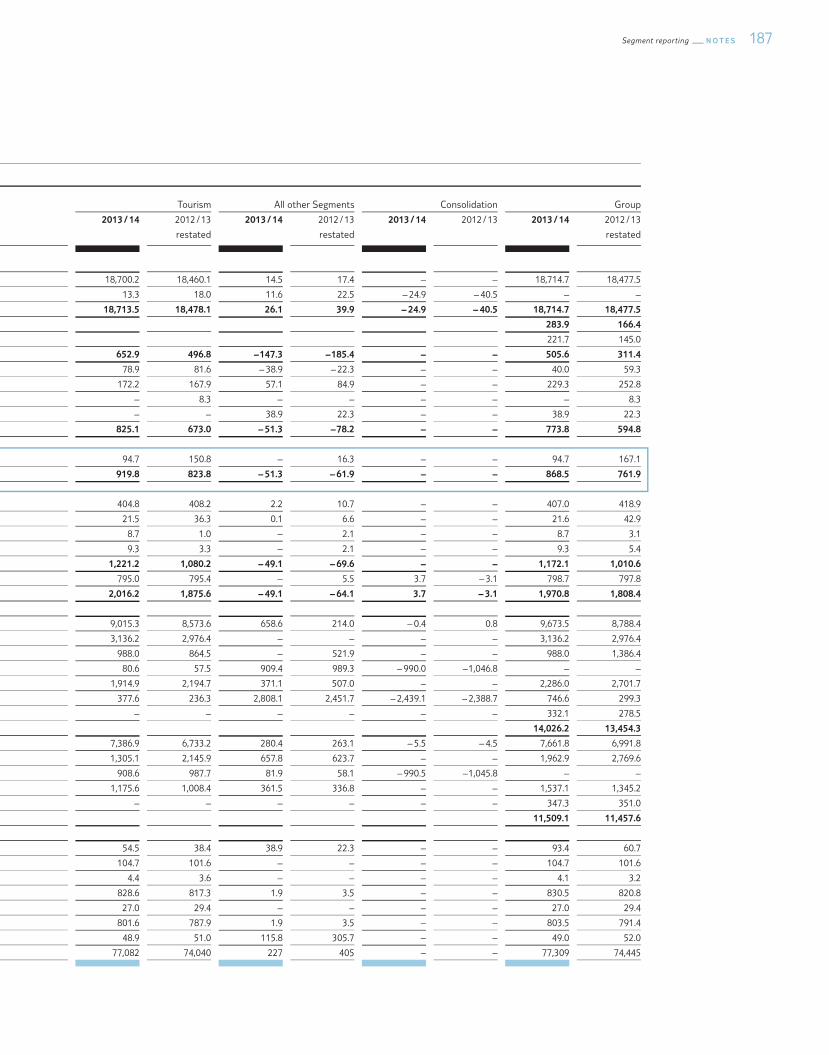
187Segment reporting N O T E S
K E Y F I G U R E S B Y S E G M E N T A N D S E C T O R
Tourism All other Segments Consolidation Group
€ million
2013 / 14 2012 / 13
restated
2013 / 14 2012 / 13
restated
2013 / 14 2012 / 13 2013 / 14 2012 / 13
restated
Statement of results
Turnover 18,700.2 18,460.1 14.5 17.4 – – 18,714.7 18,477.5
Inter-segment turnover 13.3 18.0 11.6 22.5 – 24.9 – 40.5 – –
Segment turnover 18,713.5 18,478.1 26.1 39.9 – 24.9 – 40.5 18,714.7 18,477.5
Group pro�t for the year 283.9 166.4
Income taxes 221.7 145.0
Earnings before taxes (EBT) 652.9 496.8 – 147.3 – 185.4 – – 505.6 311.4
of which share of results of joint ventures and associates 78.9 81.6 – 38.9 – 22.3 – – 40.0 59.3
Net interest result and result from the measurement of interest hedges 172.2 167.9 57.1 84.9 – – 229.3 252.8
Impairment of goodwill – 8.3 – – – – – 8.3
Result from Container Shipping measured at equity – – 38.9 22.3 – – 38.9 22.3
Earnings before interest, taxes and amortisation of goodwill (EBITA) 825.1 673.0 – 51.3 – 78.2 – – 773.8 594.8
Adjustments 94.7 150.8 – 16.3 – – 94.7 167.1
Underlying EBITA 919.8 823.8 – 51.3 – 61.9 – – 868.5 761.9
Amortisation of other intangible assets and depreciation of property, plant and equipment 404.8 408.2 2.2 10.7 – – 407.0 418.9
of which impairments 21.5 36.3 0.1 6.6 – – 21.6 42.9
Other depreciation/amortisation and write-backs 8.7 1.0 – 2.1 – – 8.7 3.1
of which write-backs 9.3 3.3 – 2.1 – – 9.3 5.4
Earnings before interest, taxes, depreciation and amortisation (EBITDA) 1,221.2 1,080.2 – 49.1 – 69.6 – – 1,172.1 1,010.6
Rental expenses 795.0 795.4 – 5.5 3.7 – 3.1 798.7 797.8
Earnings before interest, taxes, depreciation, amortisation and rental expenses (EBITDAR) 2,016.2 1,875.6 – 49.1 – 64.1 3.7 – 3.1 1,970.8 1,808.4
Assets and liabilities
Segment assets 9,015.3 8,573.6 658.6 214.0 – 0.4 0.8 9,673.5 8,788.4
of which goodwill 3,136.2 2,976.4 – – – – 3,136.2 2,976.4
Carrying amounts of joint ventures and associates 988.0 864.5 – 521.9 – – 988.0 1,386.4
Interest-bearing Group receivables 80.6 57.5 909.4 989.3 – 990.0 – 1,046.8 – –
Cash and cash equivalents 1,914.9 2,194.7 371.1 507.0 – – 2,286.0 2,701.7
Other �nancial assets 377.6 236.3 2,808.1 2,451.7 – 2,439.1 – 2,388.7 746.6 299.3
Non-allocable taxes – – – – – – 332.1 278.5
Total assets 14,026.2 13,454.3
Segment liabilities 7,386.9 6,733.2 280.4 263.1 – 5.5 – 4.5 7,661.8 6,991.8
Third-party �nancial liabilities 1,305.1 2,145.9 657.8 623.7 – – 1,962.9 2,769.6
Group �nancial liabilities 908.6 987.7 81.9 58.1 – 990.5 – 1,045.8 – –
Other �nancial liability items 1,175.6 1,008.4 361.5 336.8 – – 1,537.1 1,345.2
Non-allocable taxes – – – – – – 347.3 351.0
Total liabilities and provisions 11,509.1 11,457.6
Additional disclosures
Non-cash expenses 54.5 38.4 38.9 22.3 – – 93.4 60.7
Non-cash income 104.7 101.6 – – – – 104.7 101.6
Return on sales (on EBITA) % 4.4 3.6 – – – – 4.1 3.2
Investments 828.6 817.3 1.9 3.5 – – 830.5 820.8
Investments in goodwill 27.0 29.4 – – – – 27.0 29.4
Investments in other intangible assets and property, plant and equipment 801.6 787.9 1.9 3.5 – – 803.5 791.4
Financing ratio % 48.9 51.0 115.8 305.7 – – 49.0 52.0
Employees at year-end 77,082 74,040 227 405 – – 77,309 74,445
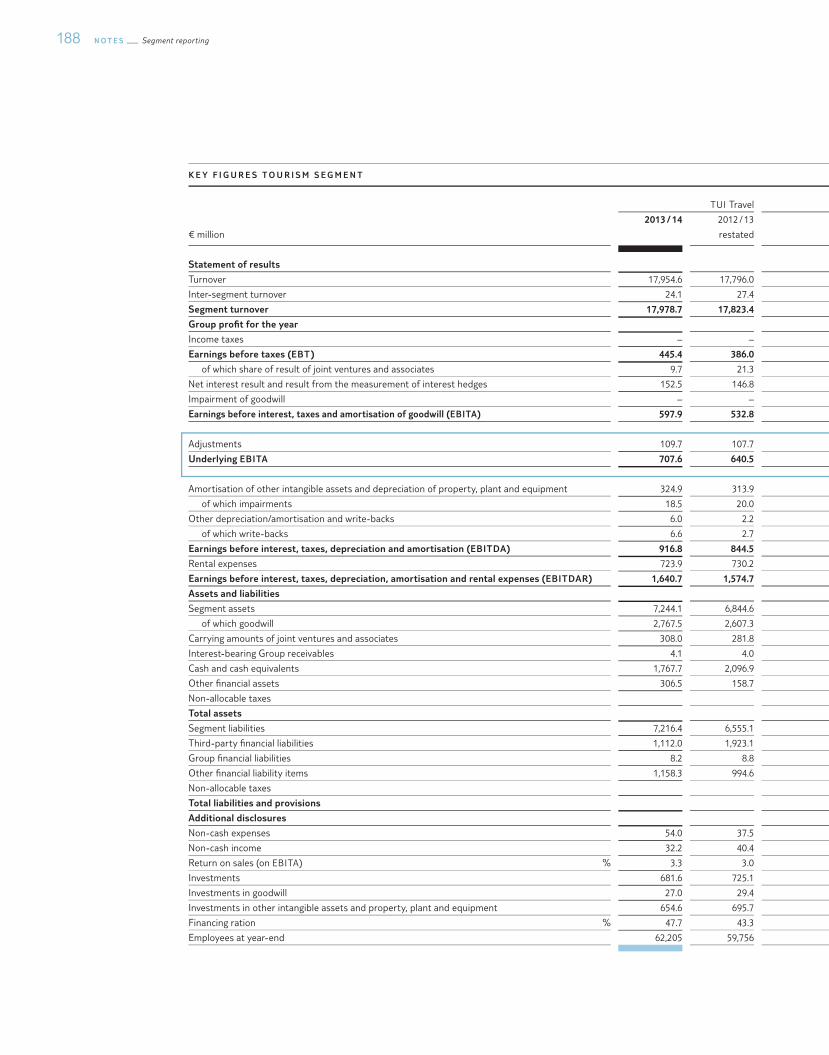
N O T E S Segment reporting188
K E Y F I G U R E S T O U R I S M S E G M E N T
TUI Travel TUI Hotels & Resorts Cruises Consolidation Tourism
€ million
2013 / 14 2012 / 13
restated
2013 / 14 2012 / 13 2013 / 14 2012 / 13 2013 / 14 2012 / 13 2013 / 14 2012 / 13
restated
Statement of results
Turnover 17,954.6 17,796.0 464.6 403.1 281.0 261.0 – – 18,700.2 18,460.1
Inter-segment turnover 24.1 27.4 396.7 423.5 1.0 – – 408.5 – 432.9 13.3 18.0
Segment turnover 17,978.7 17,823.4 861.3 826.6 282.0 261.0 – 408.5 – 432.9 18,713.5 18,478.1
Group pro�t for the year
Income taxes – – – – – – – – – –
Earnings before taxes (EBT) 445.4 386.0 183.4 141.4 24.1 – 30.6 – – 652.9 496.8
of which share of result of joint ventures and associates 9.7 21.3 37.9 42.9 31.3 17.4 – – 78.9 81.6
Net interest result and result from the measurement of interest hedges 152.5 146.8 19.6 20.9 0.1 0.2 – – 172.2 167.9
Impairment of goodwill – – – 8.3 – – – – – 8.3
Earnings before interest, taxes and amortisation of goodwill (EBITA) 597.9 532.8 203.0 170.6 24.2 – 30.4 – – 825.1 673.0
Adjustments 109.7 107.7 – 0.5 26.6 – 14.5 16.5 – – 94.7 150.8
Underlying EBITA 707.6 640.5 202.5 197.2 9.7 – 13.9 – – 919.8 823.8
Amortisation of other intangible assets and depreciation of property, plant and equipment 324.9 313.9 66.8 82.9 13.1 11.4 – – 404.8 408.2
of which impairments 18.5 20.0 3.0 16.3 – – – – 21.5 36.3
Other depreciation/amortisation and write-backs 6.0 2.2 2.7 – 1.3 – 0.1 – – 8.7 1.0
of which write-backs 6.6 2.7 2.7 0.5 – 0.1 – – 9.3 3.3
Earnings before interest, taxes, depreciation and amortisation (EBITDA) 916.8 844.5 267.1 254.8 37.3 – 19.1 – – 1,221.2 1,080.2
Rental expenses 723.9 730.2 32.3 33.5 38.8 31.7 – – 795.0 795.4
Earnings before interest, taxes, depreciation, amortisation and rental expenses (EBITDAR) 1,640.7 1,574.7 299.4 288.3 76.1 12.6 – – 2,016.2 1,875.6
Assets and liabilities
Segment assets 7,244.1 6,844.6 1,671.8 1,599.8 167.3 187.6 – 67.9 – 58.4 9,015.3 8,573.6
of which goodwill 2,767.5 2,607.3 368.7 369.1 – – – – 3,136.2 2,976.4
Carrying amounts of joint ventures and associates 308.0 281.8 433.4 385.3 246.6 197.4 – – 988.0 864.5
Interest-bearing Group receivables 4.1 4.0 9.3 1.8 67.2 51.7 – – 80.6 57.5
Cash and cash equivalents 1,767.7 2,096.9 144.2 93.4 3.0 4.4 – – 1,914.9 2,194.7
Other �nancial assets 306.5 158.7 65.2 76.6 5.9 1.0 – – 377.6 236.3
Non-allocable taxes
Total assets
Segment liabilities 7,216.4 6,555.1 148.8 119.4 89.5 116.9 – 67.8 – 58.2 7,386.9 6,733.2
Third-party �nancial liabilities 1,112.0 1,923.1 193.1 222.8 – – – – 1,305.1 2,145.9
Group �nancial liabilities 8.2 8.8 713.7 802.2 186.7 176.7 – – 908.6 987.7
Other �nancial liability items 1,158.3 994.6 2.0 2.3 15.3 11.5 – – 1,175.6 1,008.4
Non-allocable taxes
Total liabilities and provisions
Additional disclosures
Non-cash expenses 54.0 37.5 0.5 0.9 – – – – 54.5 38.4
Non-cash income 32.2 40.4 41.2 43.8 31.3 17.4 – – 104.7 101.6
Return on sales (on EBITA) % 3.3 3.0 23.6 20.6 8.6 – 11.6 – – 4.4 3.6
Investments 681.6 725.1 136.6 80.7 10.4 11.5 – – 828.6 817.3
Investments in goodwill 27.0 29.4 – – – – – – 27.0 29.4
Investments in other intangible assets and property, plant and equipment 654.6 695.7 136.6 80.7 10.4 11.5 – – 801.6 787.9
Financing ration % 47.7 43.3 48.9 113.0 126.0 99.1 – – 48.9 51.0
Employees at year-end 62,205 59,756 14,649 14,013 228 271 – – 77,082 74,040

189Segment reporting N O T E S
K E Y F I G U R E S T O U R I S M S E G M E N T
TUI Travel TUI Hotels & Resorts Cruises Consolidation Tourism
€ million
2013 / 14 2012 / 13
restated
2013 / 14 2012 / 13 2013 / 14 2012 / 13 2013 / 14 2012 / 13 2013 / 14 2012 / 13
restated
Statement of results
Turnover 17,954.6 17,796.0 464.6 403.1 281.0 261.0 – – 18,700.2 18,460.1
Inter-segment turnover 24.1 27.4 396.7 423.5 1.0 – – 408.5 – 432.9 13.3 18.0
Segment turnover 17,978.7 17,823.4 861.3 826.6 282.0 261.0 – 408.5 – 432.9 18,713.5 18,478.1
Group pro�t for the year
Income taxes – – – – – – – – – –
Earnings before taxes (EBT) 445.4 386.0 183.4 141.4 24.1 – 30.6 – – 652.9 496.8
of which share of result of joint ventures and associates 9.7 21.3 37.9 42.9 31.3 17.4 – – 78.9 81.6
Net interest result and result from the measurement of interest hedges 152.5 146.8 19.6 20.9 0.1 0.2 – – 172.2 167.9
Impairment of goodwill – – – 8.3 – – – – – 8.3
Earnings before interest, taxes and amortisation of goodwill (EBITA) 597.9 532.8 203.0 170.6 24.2 – 30.4 – – 825.1 673.0
Adjustments 109.7 107.7 – 0.5 26.6 – 14.5 16.5 – – 94.7 150.8
Underlying EBITA 707.6 640.5 202.5 197.2 9.7 – 13.9 – – 919.8 823.8
Amortisation of other intangible assets and depreciation of property, plant and equipment 324.9 313.9 66.8 82.9 13.1 11.4 – – 404.8 408.2
of which impairments 18.5 20.0 3.0 16.3 – – – – 21.5 36.3
Other depreciation/amortisation and write-backs 6.0 2.2 2.7 – 1.3 – 0.1 – – 8.7 1.0
of which write-backs 6.6 2.7 2.7 0.5 – 0.1 – – 9.3 3.3
Earnings before interest, taxes, depreciation and amortisation (EBITDA) 916.8 844.5 267.1 254.8 37.3 – 19.1 – – 1,221.2 1,080.2
Rental expenses 723.9 730.2 32.3 33.5 38.8 31.7 – – 795.0 795.4
Earnings before interest, taxes, depreciation, amortisation and rental expenses (EBITDAR) 1,640.7 1,574.7 299.4 288.3 76.1 12.6 – – 2,016.2 1,875.6
Assets and liabilities
Segment assets 7,244.1 6,844.6 1,671.8 1,599.8 167.3 187.6 – 67.9 – 58.4 9,015.3 8,573.6
of which goodwill 2,767.5 2,607.3 368.7 369.1 – – – – 3,136.2 2,976.4
Carrying amounts of joint ventures and associates 308.0 281.8 433.4 385.3 246.6 197.4 – – 988.0 864.5
Interest-bearing Group receivables 4.1 4.0 9.3 1.8 67.2 51.7 – – 80.6 57.5
Cash and cash equivalents 1,767.7 2,096.9 144.2 93.4 3.0 4.4 – – 1,914.9 2,194.7
Other �nancial assets 306.5 158.7 65.2 76.6 5.9 1.0 – – 377.6 236.3
Non-allocable taxes
Total assets
Segment liabilities 7,216.4 6,555.1 148.8 119.4 89.5 116.9 – 67.8 – 58.2 7,386.9 6,733.2
Third-party �nancial liabilities 1,112.0 1,923.1 193.1 222.8 – – – – 1,305.1 2,145.9
Group �nancial liabilities 8.2 8.8 713.7 802.2 186.7 176.7 – – 908.6 987.7
Other �nancial liability items 1,158.3 994.6 2.0 2.3 15.3 11.5 – – 1,175.6 1,008.4
Non-allocable taxes
Total liabilities and provisions
Additional disclosures
Non-cash expenses 54.0 37.5 0.5 0.9 – – – – 54.5 38.4
Non-cash income 32.2 40.4 41.2 43.8 31.3 17.4 – – 104.7 101.6
Return on sales (on EBITA) % 3.3 3.0 23.6 20.6 8.6 – 11.6 – – 4.4 3.6
Investments 681.6 725.1 136.6 80.7 10.4 11.5 – – 828.6 817.3
Investments in goodwill 27.0 29.4 – – – – – – 27.0 29.4
Investments in other intangible assets and property, plant and equipment 654.6 695.7 136.6 80.7 10.4 11.5 – – 801.6 787.9
Financing ration % 47.7 43.3 48.9 113.0 126.0 99.1 – – 48.9 51.0
Employees at year-end 62,205 59,756 14,649 14,013 228 271 – – 77,082 74,040
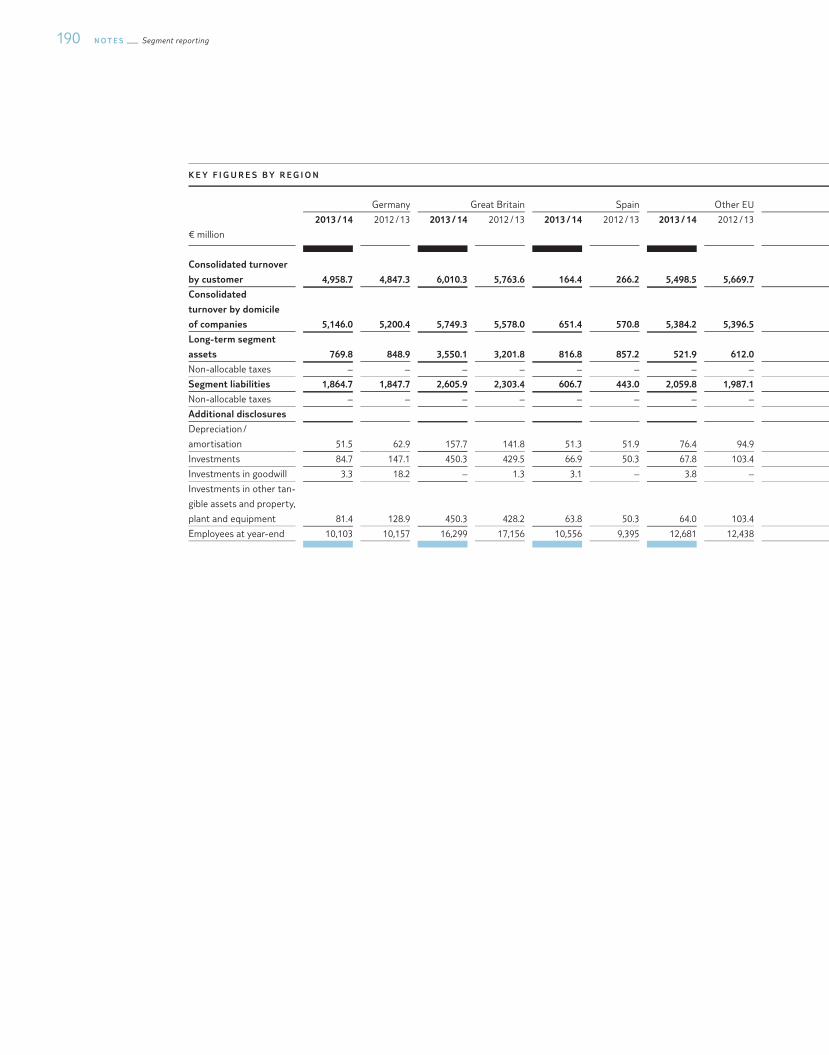
N O T E S Segment reporting190
K E Y F I G U R E S B Y R E G I O N
Germany Great Britain Spain Other EU Rest of Europe North and South America Other regions Consolidation Group
€ million
2013 / 14 2012 / 13 2013 / 14 2012 / 13 2013 / 14 2012 / 13 2013 / 14 2012 / 13
2013 / 14 2012 / 13 2013 / 14 2012 / 13 2013 / 14 2012 / 13 2013 / 14 2012 / 13 2013 / 14 2012 / 13
restated
Consolidated turnover
by customer 4,958.7 4,847.3 6,010.3 5,763.6 164.4 266.2 5,498.5 5,669.7 727.0 724.3 875.1 748.9 480.7 457.5 – – 18,714.7 18,477.5
Consolidated
turnover by domicile
of companies 5,146.0 5,200.4 5,749.3 5,578.0 651.4 570.8 5,384.2 5,396.5 509.6 577.7 773.0 715.4 501.2 438.7 – – 18,714.7 18,477.5
Long-term segment
assets 769.8 848.9 3,550.1 3,201.8 816.8 857.2 521.9 612.0 66.2 78.7 1,007.2 833.4 602.6 511.4 – 12.0 – 12.4 7,322.6 6,931.0
Non-allocable taxes – – – – – – – – – – – – – – – – 332.1 278.5
Segment liabilities 1,864.7 1,847.7 2,605.9 2,303.4 606.7 443.0 2,059.8 1,987.1 107.8 112.1 394.0 332.0 414.3 302.0 – 391.4 – 335.5 7,661.8 6,991.8
Non-allocable taxes – – – – – – – – – – – – – – – – 347.3 351.0
Additional disclosures
Depreciation /
amortisation 51.5 62.9 157.7 141.8 51.3 51.9 76.4 94.9 1.8 4.3 33.4 28.8 34.9 36.6 – – 407.0 421.2
Investments 84.7 147.1 450.3 429.5 66.9 50.3 67.8 103.4 1.6 3.2 55.5 38.1 103.7 49.2 – – 830.5 820.8
Investments in goodwill 3.3 18.2 – 1.3 3.1 – 3.8 – – – – 0.6 16.8 9.3 – – 27.0 29.4
Investments in other tan-
gible assets and property,
plant and equipment 81.4 128.9 450.3 428.2 63.8 50.3 64.0 103.4 1.6 3.2 55.5 37.5 86.9 39.9 – – 803.5 791.4
Employees at year-end 10,103 10,157 16,299 17,156 10,556 9,395 12,681 12,438 7,710 8,078 8,612 8,361 11,348 8,860 – – 77,309 74,445
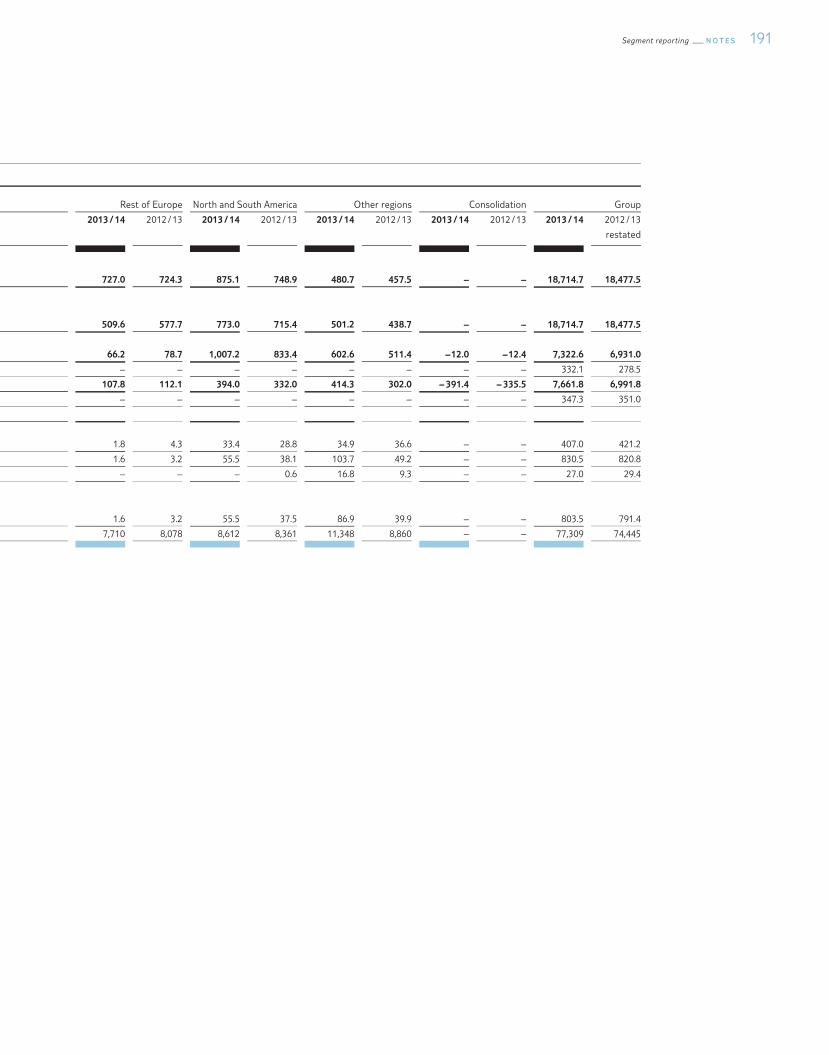
191Segment reporting N O T E S
K E Y F I G U R E S B Y R E G I O N
Germany Great Britain Spain Other EU Rest of Europe North and South America Other regions Consolidation Group
€ million
2013 / 14 2012 / 13 2013 / 14 2012 / 13 2013 / 14 2012 / 13 2013 / 14 2012 / 13
2013 / 14 2012 / 13 2013 / 14 2012 / 13 2013 / 14 2012 / 13 2013 / 14 2012 / 13 2013 / 14 2012 / 13
restated
Consolidated turnover
by customer 4,958.7 4,847.3 6,010.3 5,763.6 164.4 266.2 5,498.5 5,669.7 727.0 724.3 875.1 748.9 480.7 457.5 – – 18,714.7 18,477.5
Consolidated
turnover by domicile
of companies 5,146.0 5,200.4 5,749.3 5,578.0 651.4 570.8 5,384.2 5,396.5 509.6 577.7 773.0 715.4 501.2 438.7 – – 18,714.7 18,477.5
Long-term segment
assets 769.8 848.9 3,550.1 3,201.8 816.8 857.2 521.9 612.0 66.2 78.7 1,007.2 833.4 602.6 511.4 – 12.0 – 12.4 7,322.6 6,931.0
Non-allocable taxes – – – – – – – – – – – – – – – – 332.1 278.5
Segment liabilities 1,864.7 1,847.7 2,605.9 2,303.4 606.7 443.0 2,059.8 1,987.1 107.8 112.1 394.0 332.0 414.3 302.0 – 391.4 – 335.5 7,661.8 6,991.8
Non-allocable taxes – – – – – – – – – – – – – – – – 347.3 351.0
Additional disclosures
Depreciation /
amortisation 51.5 62.9 157.7 141.8 51.3 51.9 76.4 94.9 1.8 4.3 33.4 28.8 34.9 36.6 – – 407.0 421.2
Investments 84.7 147.1 450.3 429.5 66.9 50.3 67.8 103.4 1.6 3.2 55.5 38.1 103.7 49.2 – – 830.5 820.8
Investments in goodwill 3.3 18.2 – 1.3 3.1 – 3.8 – – – – 0.6 16.8 9.3 – – 27.0 29.4
Investments in other tan-
gible assets and property,
plant and equipment 81.4 128.9 450.3 428.2 63.8 50.3 64.0 103.4 1.6 3.2 55.5 37.5 86.9 39.9 – – 803.5 791.4
Employees at year-end 10,103 10,157 16,299 17,156 10,556 9,395 12,681 12,438 7,710 8,078 8,612 8,361 11,348 8,860 – – 77,309 74,445

N O T E S Notes to the consolidated income statement192
Notes to the consolidated income statement
The Group’s earnings position continued to show a positive development in �nancial year 2013 / 14. Both the operating result and Group result after tax rose substantially year-on-year in �nancial year 2013 / 14. This positive development is attributable to lower expenses by TUI AG’s corporate centre and, in particular, earnings im-provements at TUI Travel and a successful operating performance of the Riu and Robinson hotel companies and the Cruises Sector. In the period under review, the sound operating performance of TUI Travel was driven, in particular, by continued strong demand for di§erentiated product, a growing proportion of online sales and higher average selling prices in the Mainstream Business.
(1) Turnover
Group turnover is mainly generated from tourism services. A breakdown of turnover within the Tourism Segment into TUI Travel, TUI Hotels & Resorts and the Cruises Sector is provided by segment reporting.
(2) Cost of sales and administrative expenses
The cost of sales relate to the expenses incurred to provide the tourism services. Apart from the expenses for personnel, depreciation / amortisation and rental and lease expenses, they include in particular all costs in-curred by the Group in connection with the provision and delivery of airline services, hotel accommodation and cruises as well as distribution costs.
Administrative expenses comprise all expenses incurred in connection with activities by the administrative functions and break down as follows:
A D M I N I S T R AT I V E E X P E N S E S
€ million 2013 / 14 2012 / 13
Sta§ costs 899.1 860.2
Lease, rental and leasing expenses 73.8 68.1
Depreciation, amortisation and impairments 100.4 110.0
Others 504.0 519.0
Total 1,577.3 1,557.3
The year-on-year increase in administrative expenses in �nancial year 2013 / 14 is mainly attributable to foreign exchange e§ects, besides the e§ects explained below.
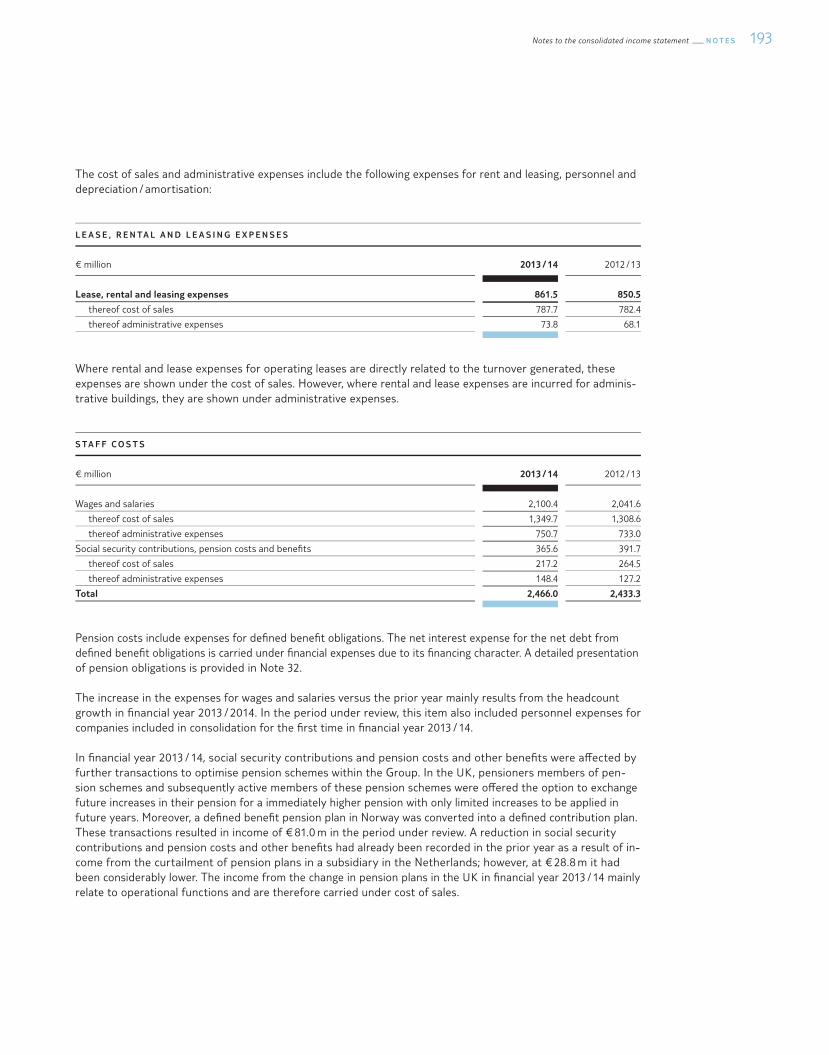
193Notes to the consolidated income statement N O T E S
The cost of sales and administrative expenses include the following expenses for rent and leasing, personnel and depreciation / amortisation:
L E A S E , R E N TA L A N D L E A S I N G E X P E N S E S
€ million 2013 / 14 2012 / 13
Lease, rental and leasing expenses 861.5 850.5
thereof cost of sales 787.7 782.4
thereof administrative expenses 73.8 68.1
Where rental and lease expenses for operating leases are directly related to the turnover generated, these expenses are shown under the cost of sales. However, where rental and lease expenses are incurred for adminis-trative buildings, they are shown under administrative expenses.
S TA F F C O S T S
€ million 2013 / 14 2012 / 13
Wages and salaries 2,100.4 2,041.6
thereof cost of sales 1,349.7 1,308.6
thereof administrative expenses 750.7 733.0
Social security contributions, pension costs and bene�ts 365.6 391.7
thereof cost of sales 217.2 264.5
thereof administrative expenses 148.4 127.2
Total 2,466.0 2,433.3
Pension costs include expenses for de�ned bene�t obligations. The net interest expense for the net debt from de�ned bene�t obligations is carried under �nancial expenses due to its �nancing character. A detailed presentation of pension obligations is provided in Note 32.
The increase in the expenses for wages and salaries versus the prior year mainly results from the headcount growth in �nancial year 2013 / 2014. In the period under review, this item also included personnel expenses for companies included in consolidation for the �rst time in �nancial year 2013 / 14.
In �nancial year 2013 / 14, social security contributions and pension costs and other bene�ts were a§ected by further transactions to optimise pension schemes within the Group. In the UK, pensioners members of pen-sion schemes and subsequently active members of these pension schemes were o§ered the option to exchange future increases in their pension for a immediately higher pension with only limited increases to be applied in future years. Moreover, a de�ned bene�t pension plan in Norway was converted into a de�ned contribution plan. These transactions resulted in income of € 81.0 m in the period under review. A reduction in social security contributions and pension costs and other bene�ts had already been recorded in the prior year as a result of in-come from the curtailment of pension plans in a subsidiary in the Netherlands; however, at € 28.8 m it had been considerably lower. The income from the change in pension plans in the UK in �nancial year 2013 / 14 mainly relate to operational functions and are therefore carried under cost of sales.
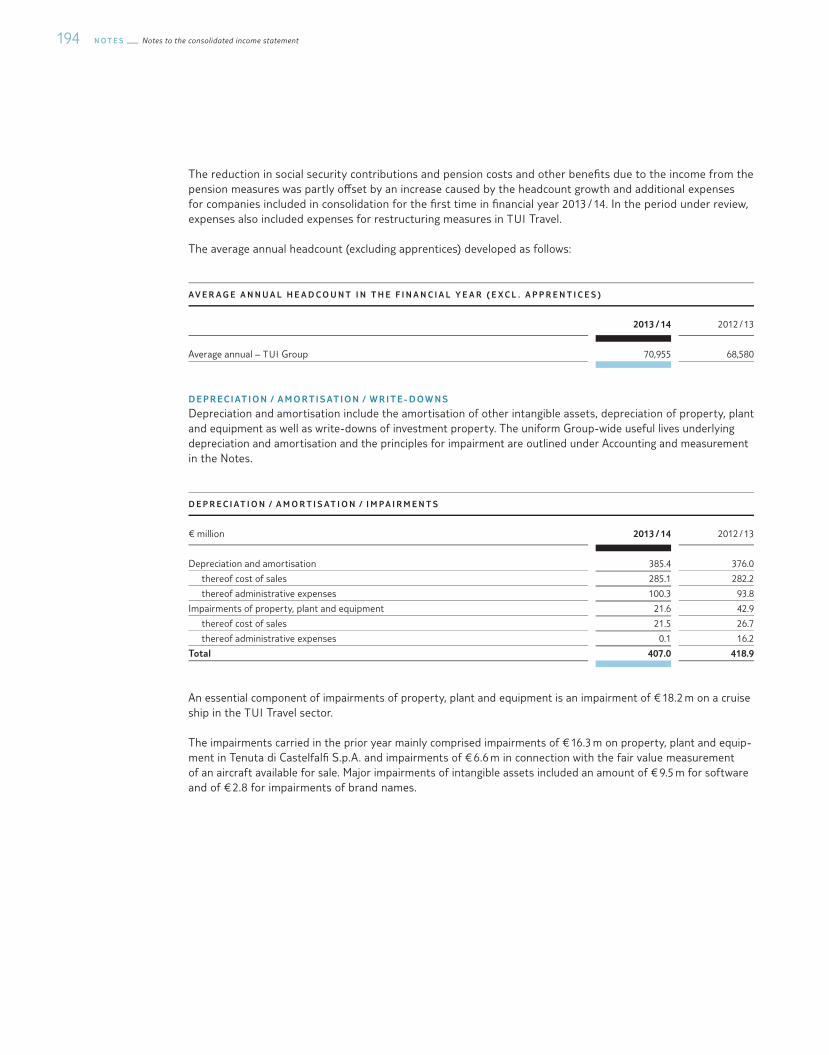
N O T E S Notes to the consolidated income statement194
The reduction in social security contributions and pension costs and other bene�ts due to the income from the pension measures was partly o§set by an increase caused by the headcount growth and additional expenses for companies included in consolidation for the �rst time in �nancial year 2013 / 14. In the period under review, expenses also included expenses for restructuring measures in TUI Travel.
The average annual headcount (excluding apprentices) developed as follows:
A V E R A G E A N N U A L H E A D C O U N T I N T H E F I N A N C I A L Y E A R ( E X C L . A P P R E N T I C E S )
2013 / 14 2012 / 13
Average annual – TUI Group 70,955 68,580
D E P R E C I AT I O N / A M O R T I S AT I O N / W R I T E - D O W N S
Depreciation and amortisation include the amortisation of other intangible assets, depreciation of property, plant and equipment as well as write-downs of investment property. The uniform Group-wide useful lives underlying depreciation and amortisation and the principles for impairment are outlined under Accounting and measurement in the Notes.
D E P R E C I AT I O N / A M O R T I S AT I O N / I M P A I R M E N T S
€ million 2013 / 14 2012 / 13
Depreciation and amortisation 385.4 376.0
thereof cost of sales 285.1 282.2
thereof administrative expenses 100.3 93.8
Impairments of property, plant and equipment 21.6 42.9
thereof cost of sales 21.5 26.7
thereof administrative expenses 0.1 16.2
Total 407.0 418.9
An essential component of impairments of property, plant and equipment is an impairment of € 18.2 m on a cruise ship in the TUI Travel sector.
The impairments carried in the prior year mainly comprised impairments of € 16.3 m on property, plant and equip-ment in Tenuta di Castelfal� S.p.A. and impairments of € 6.6 m in connection with the fair value measurement of an aircraft available for sale. Major impairments of intangible assets included an amount of € 9.5 m for software and of € 2.8 for impairments of brand names.
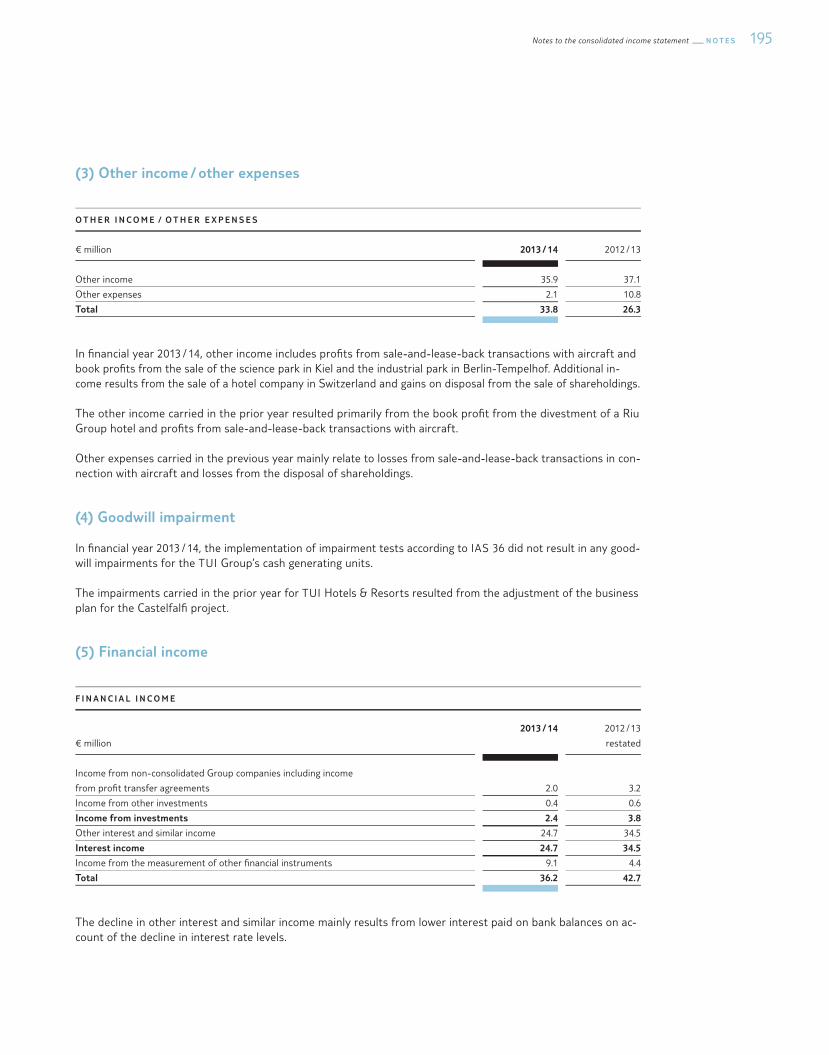
195Notes to the consolidated income statement N O T E S
(3) Other income / other expenses
O T H E R I N C O M E / O T H E R E X P E N S E S
€ million 2013 / 14 2012 / 13
Other income 35.9 37.1
Other expenses 2.1 10.8
Total 33.8 26.3
In �nancial year 2013 / 14, other income includes pro�ts from sale-and-lease-back transactions with aircraft and book pro�ts from the sale of the science park in Kiel and the industrial park in Berlin-Tempelhof. Additional in-come results from the sale of a hotel company in Switzerland and gains on disposal from the sale of shareholdings.
The other income carried in the prior year resulted primarily from the book pro�t from the divestment of a Riu Group hotel and pro�ts from sale-and-lease-back transactions with aircraft.
Other expenses carried in the previous year mainly relate to losses from sale-and-lease-back transactions in con-nection with aircraft and losses from the disposal of shareholdings.
(4) Goodwill impairment
In �nancial year 2013 / 14, the implementation of impairment tests according to IAS 36 did not result in any good-will impairments for the TUI Group’s cash generating units.
The impairments carried in the prior year for TUI Hotels & Resorts resulted from the adjustment of the business plan for the Castelfal� project.
(5) Financial income
F I N A N C I A L I N C O M E
€ million
2013 / 14 2012 / 13
restated
Income from non-consolidated Group companies including income
from pro�t transfer agreements 2.0 3.2
Income from other investments 0.4 0.6
Income from investments 2.4 3.8
Other interest and similar income 24.7 34.5
Interest income 24.7 34.5
Income from the measurement of other �nancial instruments 9.1 4.4
Total 36.2 42.7
The decline in other interest and similar income mainly results from lower interest paid on bank balances on ac-count of the decline in interest rate levels.
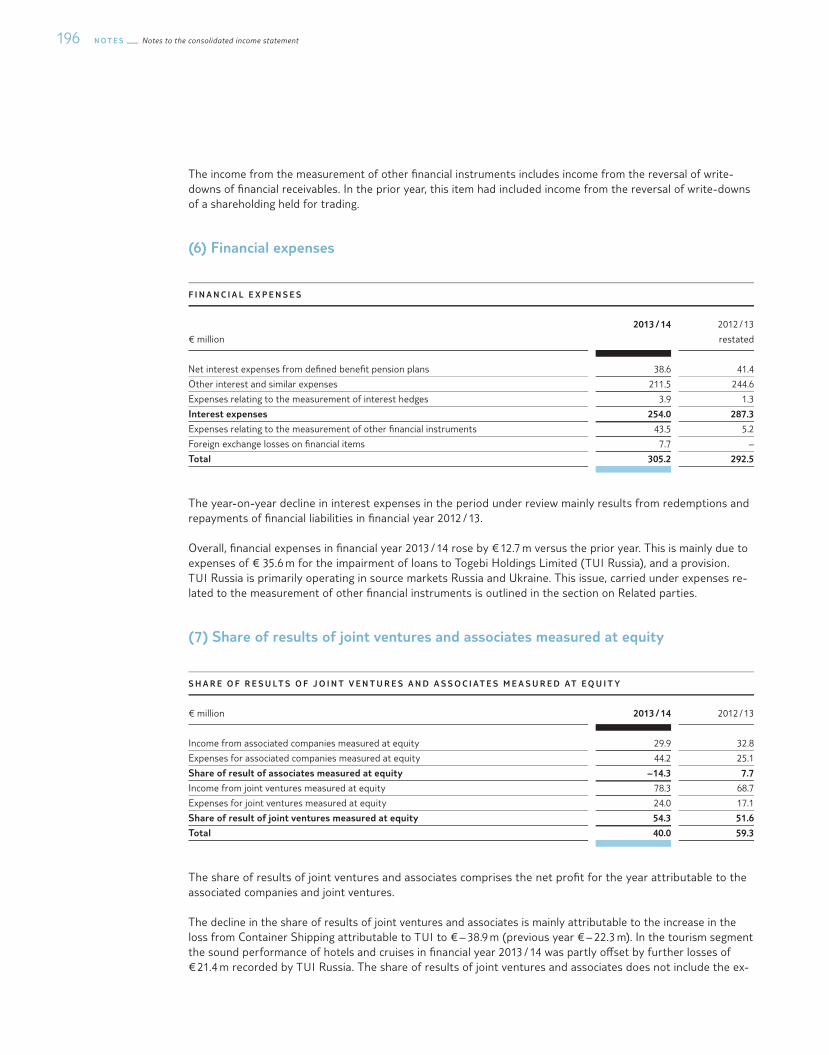
N O T E S Notes to the consolidated income statement196
The income from the measurement of other �nancial instruments includes income from the reversal of write-downs of �nancial receivables. In the prior year, this item had included income from the reversal of write-downs of a shareholding held for trading.
(6) Financial expenses
F I N A N C I A L E X P E N S E S
€ million
2013 / 14 2012 / 13
restated
Net interest expenses from de�ned bene�t pension plans 38.6 41.4
Other interest and similar expenses 211.5 244.6
Expenses relating to the measurement of interest hedges 3.9 1.3
Interest expenses 254.0 287.3
Expenses relating to the measurement of other �nancial instruments 43.5 5.2
Foreign exchange losses on �nancial items 7.7 –
Total 305.2 292.5
The year-on-year decline in interest expenses in the period under review mainly results from redemptions and repayments of �nancial liabilities in �nancial year 2012 / 13.
Overall, �nancial expenses in �nancial year 2013 / 14 rose by € 12.7 m versus the prior year. This is mainly due to expenses of € 35.6 m for the impairment of loans to Togebi Holdings Limited (TUI Russia), and a provision. TUI Russia is primarily operating in source markets Russia and Ukraine. This issue, carried under expenses re-lated to the measurement of other �nancial instruments is outlined in the section on Related parties.
(7) Share of results of joint ventures and associates measured at equity
S H A R E O F R E S U LT S O F J O I N T V E N T U R E S A N D A S S O C I AT E S M E A S U R E D AT E Q U I T Y
€ million 2013 / 14 2012 / 13
Income from associated companies measured at equity 29.9 32.8
Expenses for associated companies measured at equity 44.2 25.1
Share of result of associates measured at equity – 14.3 7.7
Income from joint ventures measured at equity 78.3 68.7
Expenses for joint ventures measured at equity 24.0 17.1
Share of result of joint ventures measured at equity 54.3 51.6
Total 40.0 59.3
The share of results of joint ventures and associates comprises the net pro�t for the year attributable to the associated companies and joint ventures.
The decline in the share of results of joint ventures and associates is mainly attributable to the increase in the loss from Container Shipping attributable to TUI to € – 38.9 m (previous year € – 22.3 m). In the tourism segment the sound performance of hotels and cruises in �nancial year 2013 / 14 was partly o§set by further losses of € 21.4 m recorded by TUI Russia. The share of results of joint ventures and associates does not include the ex-
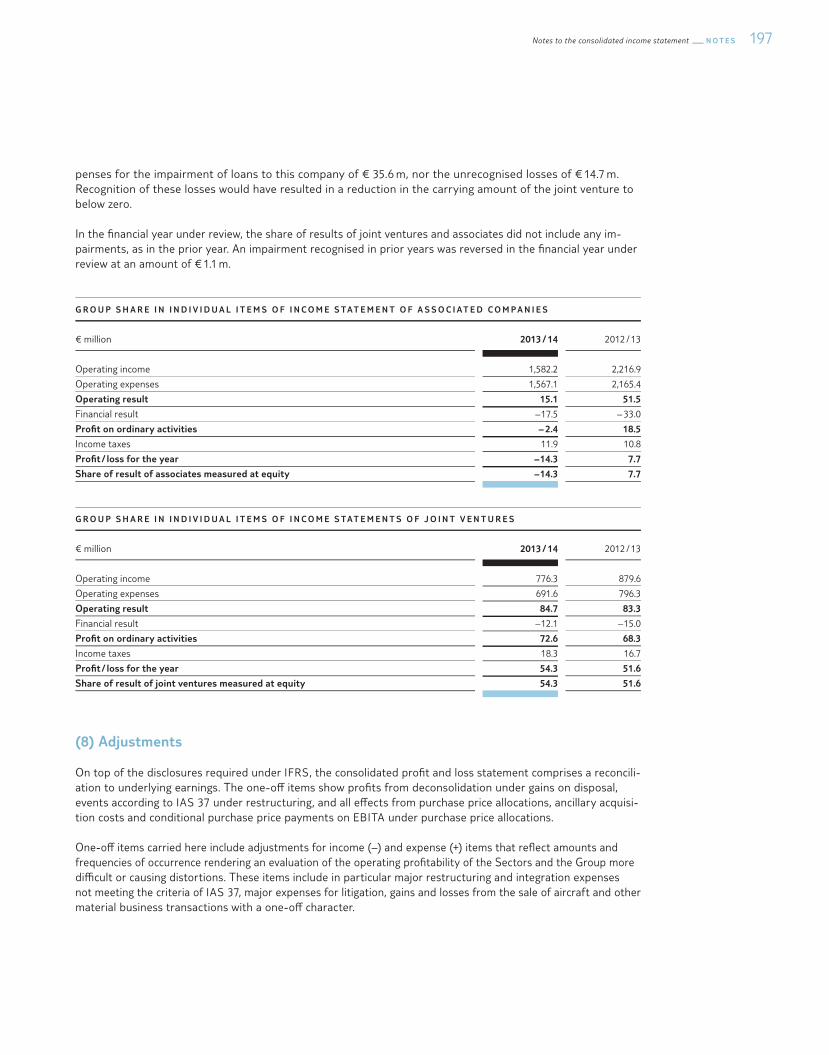
197Notes to the consolidated income statement N O T E S
penses for the impairment of loans to this company of € 35.6 m, nor the unrecognised losses of € 14.7 m. Recognition of these losses would have resulted in a reduction in the carrying amount of the joint venture to below zero.
In the �nancial year under review, the share of results of joint ventures and associates did not include any im-pairments, as in the prior year. An impairment recognised in prior years was reversed in the �nancial year under review at an amount of € 1.1 m.
G R O U P S H A R E I N I N D I V I D U A L I T E M S O F I N C O M E S TAT E M E N T O F A S S O C I AT E D C O M P A N I E S
€ million 2013 / 14 2012 / 13
Operating income 1,582.2 2,216.9
Operating expenses 1,567.1 2,165.4
Operating result 15.1 51.5
Financial result – 17.5 – 33.0
Pro�t on ordinary activities – 2.4 18.5
Income taxes 11.9 10.8
Pro�t / loss for the year – 14.3 7.7
Share of result of associates measured at equity – 14.3 7.7
G R O U P S H A R E I N I N D I V I D U A L I T E M S O F I N C O M E S TAT E M E N T S O F J O I N T V E N T U R E S
€ million 2013 / 14 2012 / 13
Operating income 776.3 879.6
Operating expenses 691.6 796.3
Operating result 84.7 83.3
Financial result – 12.1 – 15.0
Pro�t on ordinary activities 72.6 68.3
Income taxes 18.3 16.7
Pro�t / loss for the year 54.3 51.6
Share of result of joint ventures measured at equity 54.3 51.6
(8) Adjustments
On top of the disclosures required under IFRS, the consolidated pro�t and loss statement comprises a reconcili-ation to underlying earnings. The one-o§ items show pro�ts from deconsolidation under gains on disposal, events according to IAS 37 under restructuring, and all e§ects from purchase price allocations, ancillary acquisi-tion costs and conditional purchase price payments on EBITA under purchase price allocations.
One-o§ items carried here include adjustments for income (–) and expense (+) items that re®ect amounts and frequencies of occurrence rendering an evaluation of the operating pro�tability of the Sectors and the Group more di¯cult or causing distortions. These items include in particular major restructuring and integration expenses not meeting the criteria of IAS 37, major expenses for litigation, gains and losses from the sale of aircraft and other material business transactions with a one-o§ character.
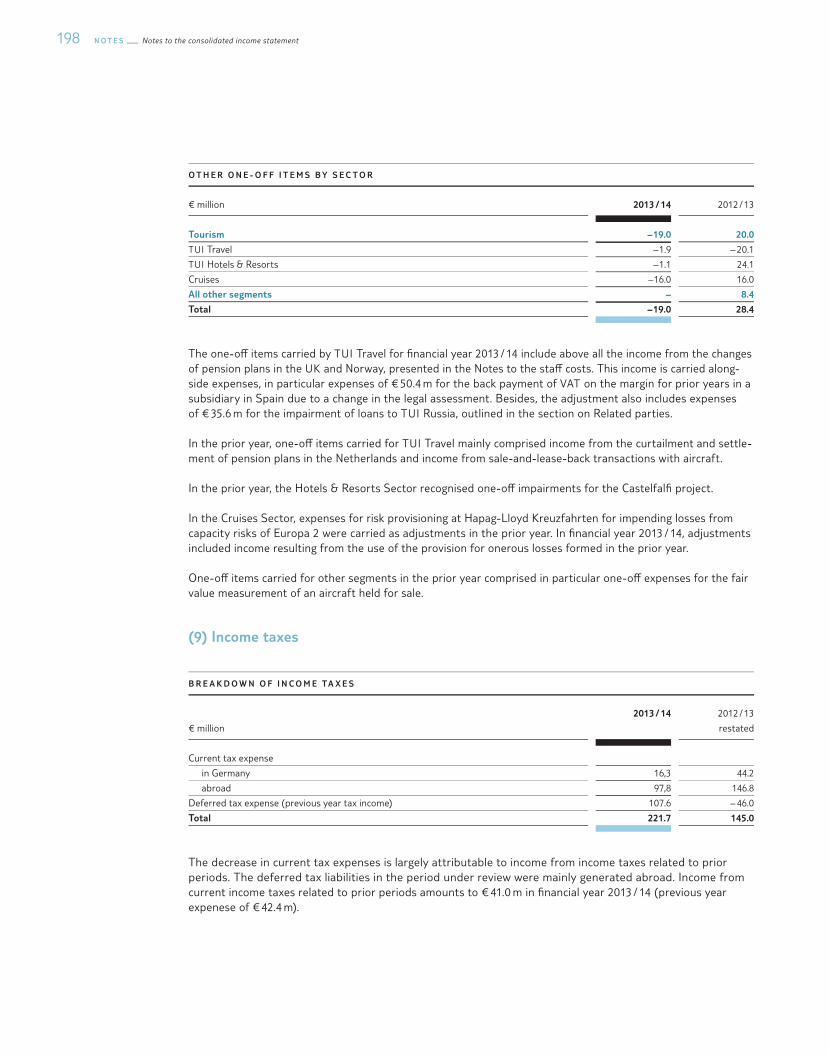
N O T E S Notes to the consolidated income statement198
O T H E R O N E - O F F I T E M S B Y S E C T O R
€ million 2013 / 14 2012 / 13
Tourism – 19.0 20.0
TUI Travel – 1.9 – 20.1
TUI Hotels & Resorts – 1.1 24.1
Cruises – 16.0 16.0
All other segments – 8.4
Total – 19.0 28.4
The one-o§ items carried by TUI Travel for �nancial year 2013 / 14 include above all the income from the changes of pension plans in the UK and Norway, presented in the Notes to the sta§ costs. This income is carried along-side expenses, in particular expenses of € 50.4 m for the back payment of VAT on the margin for prior years in a subsidiary in Spain due to a change in the legal assessment. Besides, the adjustment also includes expenses of € 35.6 m for the impairment of loans to TUI Russia, outlined in the section on Related parties.
In the prior year, one-o§ items carried for TUI Travel mainly comprised income from the curtailment and settle-ment of pension plans in the Netherlands and income from sale-and-lease-back transactions with aircraft.
In the prior year, the Hotels & Resorts Sector recognised one-o§ impairments for the Castelfal� project.
In the Cruises Sector, expenses for risk provisioning at Hapag-Lloyd Kreuzfahrten for impending losses from capacity risks of Europa 2 were carried as adjustments in the prior year. In �nancial year 2013 / 14, adjustments included income resulting from the use of the provision for onerous losses formed in the prior year.
One-o§ items carried for other segments in the prior year comprised in particular one-o§ expenses for the fair value measurement of an aircraft held for sale.
(9) Income taxes
B R E A K D O W N O F I N C O M E TA X E S
€ million
2013 / 14 2012 / 13
restated
Current tax expense
in Germany 16,3 44.2
abroad 97,8 146.8
Deferred tax expense (previous year tax income) 107.6 – 46.0
Total 221.7 145.0
The decrease in current tax expenses is largely attributable to income from income taxes related to prior periods. The deferred tax liabilities in the period under review were mainly generated abroad. Income from current income taxes related to prior periods amounts to € 41.0 m in �nancial year 2013 / 14 (previous year expenese of € 42.4 m).
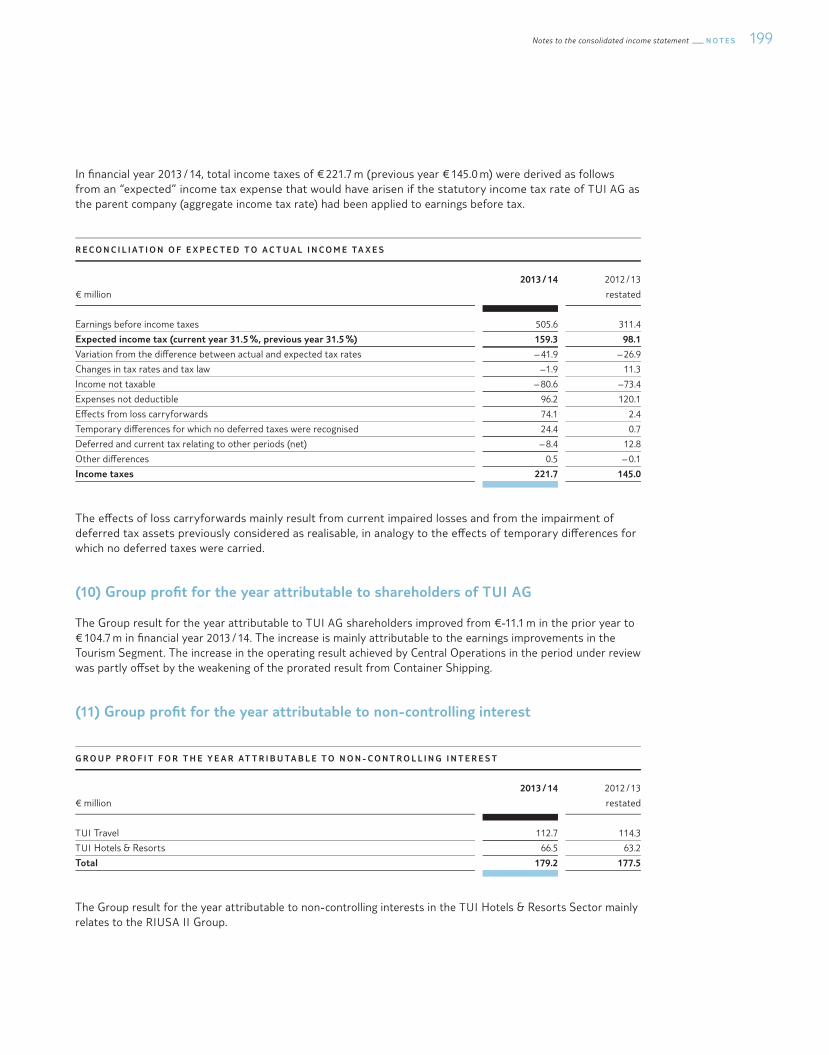
199Notes to the consolidated income statement N O T E S
In �nancial year 2013 / 14, total income taxes of € 221.7 m (previous year € 145.0 m) were derived as follows from an “expected” income tax expense that would have arisen if the statutory income tax rate of TUI AG as the parent company (aggregate income tax rate) had been applied to earnings before tax.
R E C O N C I L I AT I O N O F E X P E C T E D T O A C T U A L I N C O M E TA X E S
€ million
2013 / 14 2012 / 13
restated
Earnings before income taxes 505.6 311.4
Expected income tax (current year 31.5 %, previous year 31.5 %) 159.3 98.1
Variation from the di§erence between actual and expected tax rates – 41.9 – 26.9
Changes in tax rates and tax law – 1.9 11.3
Income not taxable – 80.6 – 73.4
Expenses not deductible 96.2 120.1
E§ects from loss carryforwards 74.1 2.4
Temporary di§erences for which no deferred taxes were recognised 24.4 0.7
Deferred and current tax relating to other periods (net) – 8.4 12.8
Other di§erences 0.5 – 0.1
Income taxes 221.7 145.0
The e§ects of loss carryforwards mainly result from current impaired losses and from the impairment of deferred tax assets previously considered as realisable, in analogy to the e§ects of temporary di§erences for which no deferred taxes were carried.
(10) Group pro�t for the year attributable to shareholders of TUI AG
The Group result for the year attributable to TUI AG shareholders improved from €-11.1 m in the prior year to € 104.7 m in �nancial year 2013 / 14. The increase is mainly attributable to the earnings improvements in the Tourism Segment. The increase in the operating result achieved by Central Operations in the period under review was partly o§set by the weakening of the prorated result from Container Shipping.
(11) Group pro�t for the year attributable to non-controlling interest
G R O U P P R O F I T F O R T H E Y E A R AT T R I B U TA B L E T O N O N - C O N T R O L L I N G I N T E R E S T
€ million
2013 / 14 2012 / 13
restated
TUI Travel 112.7 114.3
TUI Hotels & Resorts 66.5 63.2
Total 179.2 177.5
The Group result for the year attributable to non-controlling interests in the TUI Hotels & Resorts Sector mainly relates to the RIUSA II Group.
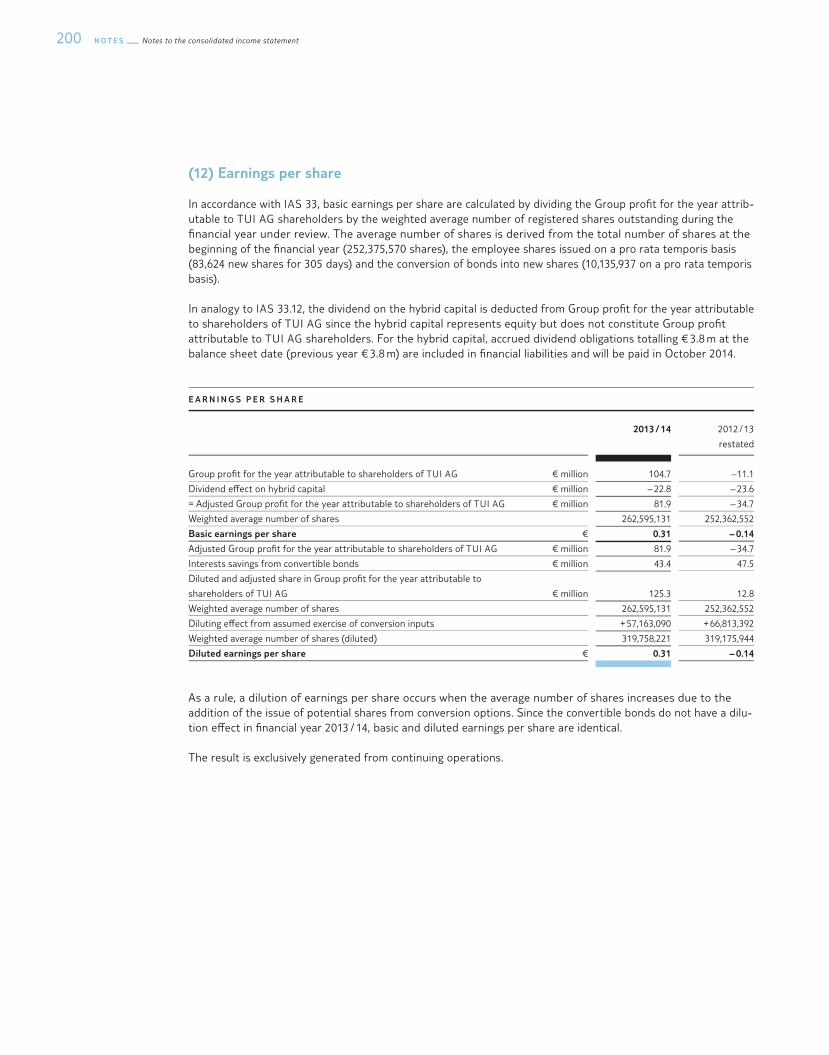
N O T E S Notes to the consolidated income statement200
(12) Earnings per share
In accordance with IAS 33, basic earnings per share are calculated by dividing the Group pro�t for the year attrib-utable to TUI AG shareholders by the weighted average number of registered shares outstanding during the �nancial year under review. The average number of shares is derived from the total number of shares at the beginning of the �nancial year (252,375,570 shares), the employee shares issued on a pro rata temporis basis (83,624 new shares for 305 days) and the conversion of bonds into new shares (10,135,937 on a pro rata temporis basis).
In analogy to IAS 33.12, the dividend on the hybrid capital is deducted from Group pro�t for the year attributable to shareholders of TUI AG since the hybrid capital represents equity but does not constitute Group pro�t attributable to TUI AG shareholders. For the hybrid capital, accrued dividend obligations totalling € 3.8 m at the balance sheet date (previous year € 3.8 m) are included in �nancial liabilities and will be paid in October 2014.
E A R N I N G S P E R S H A R E
2013 / 14 2012 / 13
restated
Group pro�t for the year attributable to shareholders of TUI AG € million 104.7 – 11.1
Dividend e§ect on hybrid capital € million – 22.8 – 23.6
= Adjusted Group pro�t for the year attributable to shareholders of TUI AG € million 81.9 – 34.7
Weighted average number of shares 262,595,131 252,362,552
Basic earnings per share € 0.31 – 0.14
Adjusted Group pro�t for the year attributable to shareholders of TUI AG € million 81.9 – 34.7
Interests savings from convertible bonds € million 43.4 47.5
Diluted and adjusted share in Group pro�t for the year attributable to
shareholders of TUI AG € million 125.3 12.8
Weighted average number of shares 262,595,131 252,362,552
Diluting e§ect from assumed exercise of conversion inputs + 57,163,090 + 66,813,392
Weighted average number of shares (diluted) 319,758,221 319,175,944
Diluted earnings per share € 0.31 – 0.14
As a rule, a dilution of earnings per share occurs when the average number of shares increases due to the addition of the issue of potential shares from conversion options. Since the convertible bonds do not have a dilu-tion e§ect in �nancial year 2013 / 14, basic and diluted earnings per share are identical.
The result is exclusively generated from continuing operations.
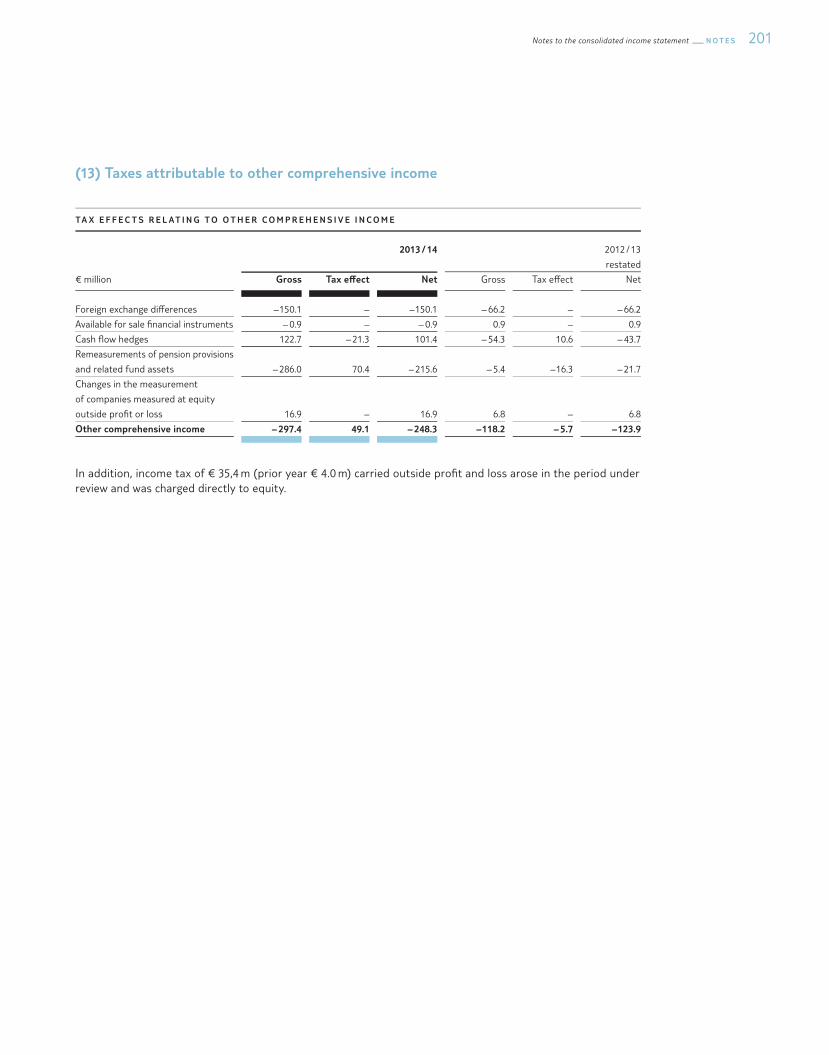
201Notes to the consolidated income statement N O T E S
(13) Taxes attributable to other comprehensive income
TA X E F F E C T S R E L AT I N G T O O T H E R C O M P R E H E N S I V E I N C O M E
2013 / 14 2012 / 13
restated
€ million Gross Tax e�ect Net Gross Tax e§ect Net
Foreign exchange di§erences – 150.1 – – 150.1 – 66.2 – – 66.2
Available for sale �nancial instruments – 0.9 – – 0.9 0.9 – 0.9
Cash ®ow hedges 122.7 – 21.3 101.4 – 54.3 10.6 – 43.7
Remeasurements of pension provisions
and related fund assets – 286.0 70.4 – 215.6 – 5.4 – 16.3 – 21.7
Changes in the measurement
of companies measured at equity
outside pro�t or loss 16.9 – 16.9 6.8 – 6.8
Other comprehensive income – 297.4 49.1 – 248.3 – 118.2 – 5.7 – 123.9
In addition, income tax of € 35,4 m (prior year € 4.0 m) carried outside pro�t and loss arose in the period under review and was charged directly to equity.
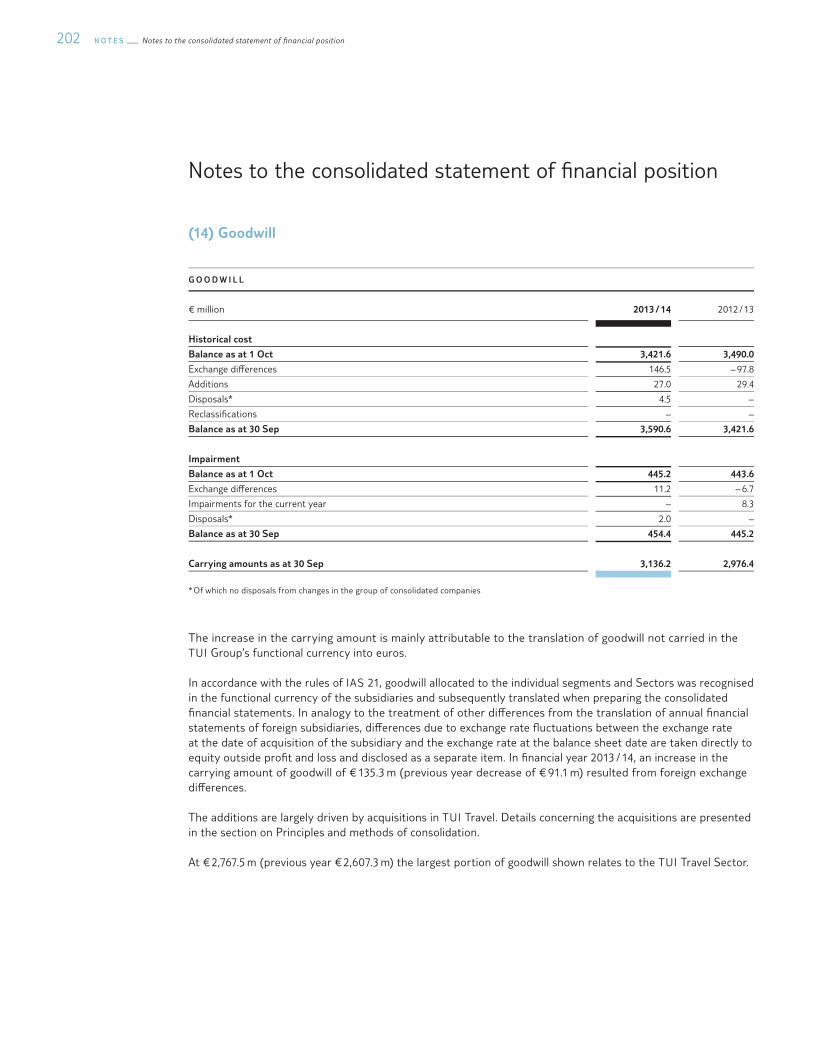
N O T E S Notes to the consolidated statement of §nancial position202
Notes to the consolidated statement of �nancial position
(14) Goodwill
G O O D W I L L
€ million 2013 / 14 2012 / 13
Historical cost
Balance as at 1 Oct 3,421.6 3,490.0
Exchange di§erences 146.5 – 97.8
Additions 27.0 29.4
Disposals* 4.5 –
Reclassi�cations – –
Balance as at 30 Sep 3,590.6 3,421.6
Impairment
Balance as at 1 Oct 445.2 443.6
Exchange di§erences 11.2 – 6.7
Impairments for the current year – 8.3
Disposals* 2.0 –
Balance as at 30 Sep 454.4 445.2
Carrying amounts as at 30 Sep 3,136.2 2,976.4
* Of which no disposals from changes in the group of consolidated companies
The increase in the carrying amount is mainly attributable to the translation of goodwill not carried in the TUI Group’s functional currency into euros.
In accordance with the rules of IAS 21, goodwill allocated to the individual segments and Sectors was recognised in the functional currency of the subsidiaries and subsequently translated when preparing the consolidated �nancial statements. In analogy to the treatment of other di§erences from the translation of annual �nancial statements of foreign subsidiaries, di§erences due to exchange rate ®uctuations between the exchange rate at the date of acquisition of the subsidiary and the exchange rate at the balance sheet date are taken directly to equity outside pro�t and loss and disclosed as a separate item. In �nancial year 2013 / 14, an increase in the carrying amount of goodwill of € 135.3 m (previous year decrease of € 91.1 m) resulted from foreign exchange di§erences.
The additions are largely driven by acquisitions in TUI Travel. Details concerning the acquisitions are presented in the section on Principles and methods of consolidation.
At € 2,767.5 m (previous year € 2,607.3 m) the largest portion of goodwill shown relates to the TUI Travel Sector.

203Notes to the consolidated statement of §nancial position N O T E S
The following table presents a breakdown of goodwill breaks by cash generating unit (CGUs) at carrying amounts:
G O O D W I L L P E R C A S H G E N E R AT I N G U N I T
€ million 30 Sep 2014 30 Sep 2013
CGU TUI Travel 2,767.5 2,607.3
TUI Travel 2,767.5 2,607.3
CGU RIU 351.7 351.7
CGU Robinson 9.7 9.8
CGU Iberotel 7.3 7.6
TUI Hotels & Resorts 368.7 369.1
Segment Tourism 3,136.2 2,976.4
Impairments are e§ected where the carrying amount of the tested units plus the allocated goodwill exceeds the recoverable amount. Goodwill was tested for impairment at the level of cash generating units (CGUs) as at 30 September 2014.
For all cash generating units, the recoverable amount was determined on the basis of fair value less costs of dis-posal. The fair value of the CGU TUI Travel was determined on the basis of the closing price of the TUI Travel share in its primary market, the London Stock Exchange. If the closing price had been 10 % lower, no impairment would have arisen, either.
Since a fair value was not available in an active market for the other entities to be tested, the fair value was determined by means of discounting the expected future cash in®ows. This was based on the medium-term plan for the entity under review, prepared as at 30 September 2014, following deduction of income tax payments. Budgeted turnover and EBITA margins are based on empirical values from prior �nancial years and expectations with regard to the future development of the market. The cash in®ows after the planning period are extrapo-lated on the basis of individual growth rates based on long-term business expectations.
The discount rates are calculated as the weighted average cost of capital, taking account of the risks associated with the cash generating unit on the basis of external capital market information. The cost of equity included in the determination re®ects the return expected by investors. The cost of borrowing is derived from the long-term �nancing terms of comparable companies in the peer group.
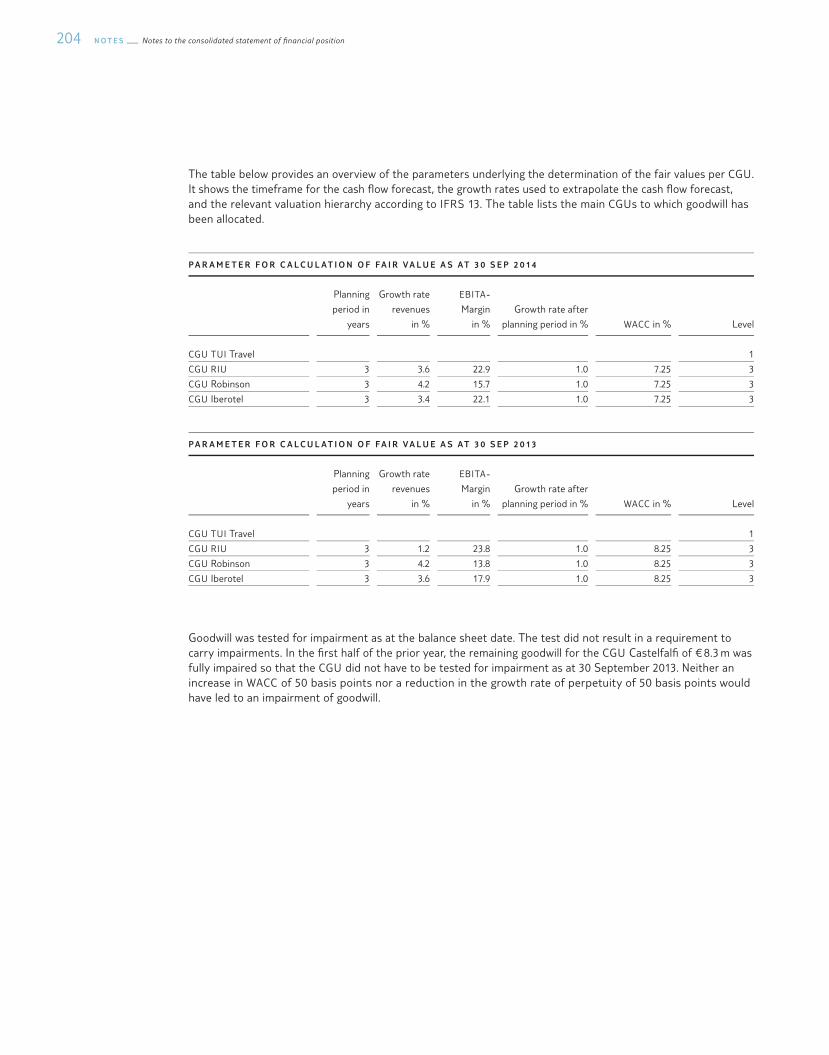
N O T E S Notes to the consolidated statement of §nancial position204
The table below provides an overview of the parameters underlying the determination of the fair values per CGU. It shows the timeframe for the cash ®ow forecast, the growth rates used to extrapolate the cash ®ow forecast, and the relevant valuation hierarchy according to IFRS 13. The table lists the main CGUs to which goodwill has been allocated.
P A R A M E T E R F O R C A L C U L AT I O N O F F A I R V A L U E A S AT 3 0 S E P 2 0 1 4
Planning
period in
years
Growth rate
revenues
in %
EBITA-
Margin
in %
Growth rate after
planning period in % WACC in % Level
CGU TUI Travel 1
CGU RIU 3 3.6 22.9 1.0 7.25 3
CGU Robinson 3 4.2 15.7 1.0 7.25 3
CGU Iberotel 3 3.4 22.1 1.0 7.25 3
P A R A M E T E R F O R C A L C U L AT I O N O F F A I R V A L U E A S AT 3 0 S E P 2 0 13
Planning
period in
years
Growth rate
revenues
in %
EBITA-
Margin
in %
Growth rate after
planning period in % WACC in % Level
CGU TUI Travel 1
CGU RIU 3 1.2 23.8 1.0 8.25 3
CGU Robinson 3 4.2 13.8 1.0 8.25 3
CGU Iberotel 3 3.6 17.9 1.0 8.25 3
Goodwill was tested for impairment as at the balance sheet date. The test did not result in a requirement to carry impairments. In the �rst half of the prior year, the remaining goodwill for the CGU Castelfal� of € 8.3 m was fully impaired so that the CGU did not have to be tested for impairment as at 30 September 2013. Neither an increase in WACC of 50 basis points nor a reduction in the growth rate of perpetuity of 50 basis points would have led to an impairment of goodwill.
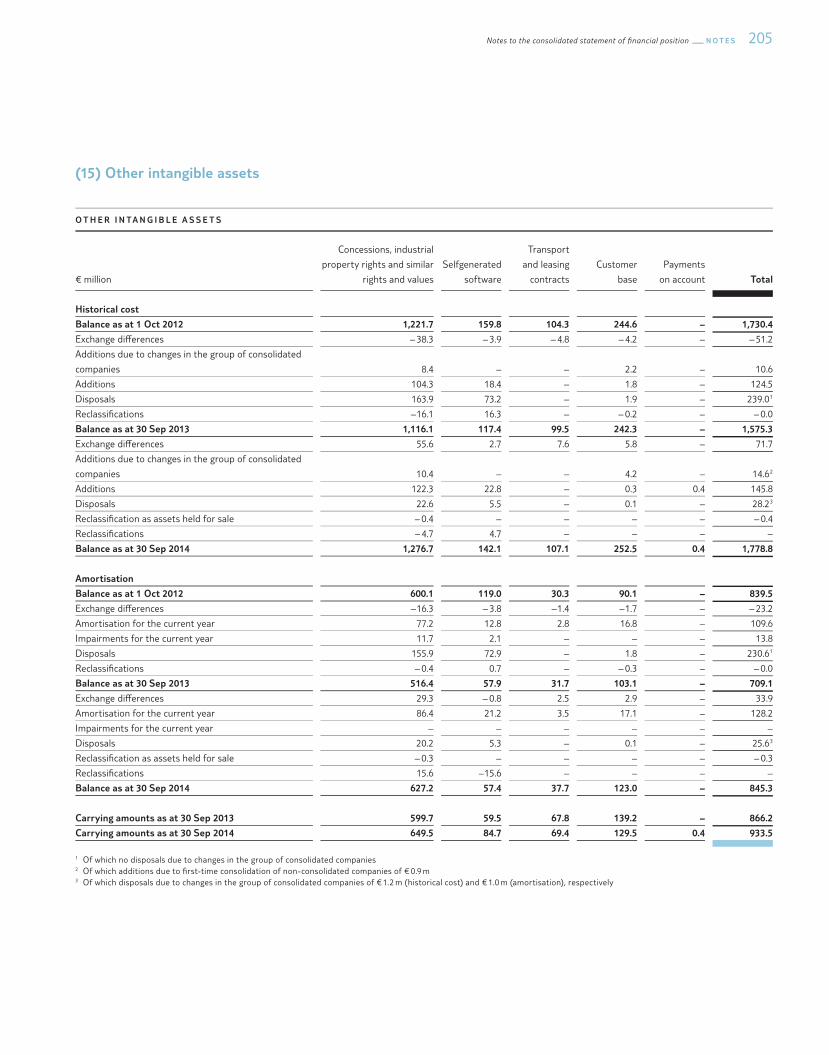
205Notes to the consolidated statement of §nancial position N O T E S
(15) Other intangible assets
O T H E R I N TA N G I B L E A S S E T S
€ million
Concessions, industrial
property rights and similar
rights and values
Selfgenerated
software
Transport
and leasing
contracts
Customer
base
Payments
on account Total
Historical cost
Balance as at 1 Oct 2012 1,221.7 159.8 104.3 244.6 – 1,730.4
Exchange di§erences – 38.3 – 3.9 – 4.8 – 4.2 – – 51.2
Additions due to changes in the group of consolidated
companies 8.4 – – 2.2 – 10.6
Additions 104.3 18.4 – 1.8 – 124.5
Disposals 163.9 73.2 – 1.9 – 239.0 1
Reclassi�cations – 16.1 16.3 – – 0.2 – – 0.0
Balance as at 30 Sep 2013 1,116.1 117.4 99.5 242.3 – 1,575.3
Exchange di§erences 55.6 2.7 7.6 5.8 – 71.7
Additions due to changes in the group of consolidated
companies 10.4 – – 4.2 – 14.6 2
Additions 122.3 22.8 – 0.3 0.4 145.8
Disposals 22.6 5.5 – 0.1 – 28.2 3
Reclassi�cation as assets held for sale – 0.4 – – – – – 0.4
Reclassi�cations – 4.7 4.7 – – – –
Balance as at 30 Sep 2014 1,276.7 142.1 107.1 252.5 0.4 1,778.8
Amortisation
Balance as at 1 Oct 2012 600.1 119.0 30.3 90.1 – 839.5
Exchange di§erences – 16.3 – 3.8 – 1.4 – 1.7 – – 23.2
Amortisation for the current year 77.2 12.8 2.8 16.8 – 109.6
Impairments for the current year 11.7 2.1 – – – 13.8
Disposals 155.9 72.9 – 1.8 – 230.6 1
Reclassi�cations – 0.4 0.7 – – 0.3 – – 0.0
Balance as at 30 Sep 2013 516.4 57.9 31.7 103.1 – 709.1
Exchange di§erences 29.3 – 0.8 2.5 2.9 – 33.9
Amortisation for the current year 86.4 21.2 3.5 17.1 – 128.2
Impairments for the current year – – – – – –
Disposals 20.2 5.3 – 0.1 – 25.6 3
Reclassi�cation as assets held for sale – 0.3 – – – – – 0.3
Reclassi�cations 15.6 – 15.6 – – – –
Balance as at 30 Sep 2014 627.2 57.4 37.7 123.0 – 845.3
Carrying amounts as at 30 Sep 2013 599.7 59.5 67.8 139.2 – 866.2
Carrying amounts as at 30 Sep 2014 649.5 84.7 69.4 129.5 0.4 933.5
1 Of which no disposals due to changes in the group of consolidated companies2 Of which additions due to �rst-time consolidation of non-consolidated companies of € 0.9 m3 Of which disposals due to changes in the group of consolidated companies of € 1.2 m (historical cost) and € 1.0 m (amortisation), respectively
N O T E S Notes to the consolidated statement of §nancial position206
Self-generated software consists of computer programmes for tourism applications exclusively used internally by the Group.
Other intangible assets, consisting in particular of trademarks and customer relationships, are amortised over their useful lives.
As at the balance sheet date, the carrying amount of intangible assets subject to ownership restrictions or pledged as security totals € 112.3 m (previous year € 112.4 m).
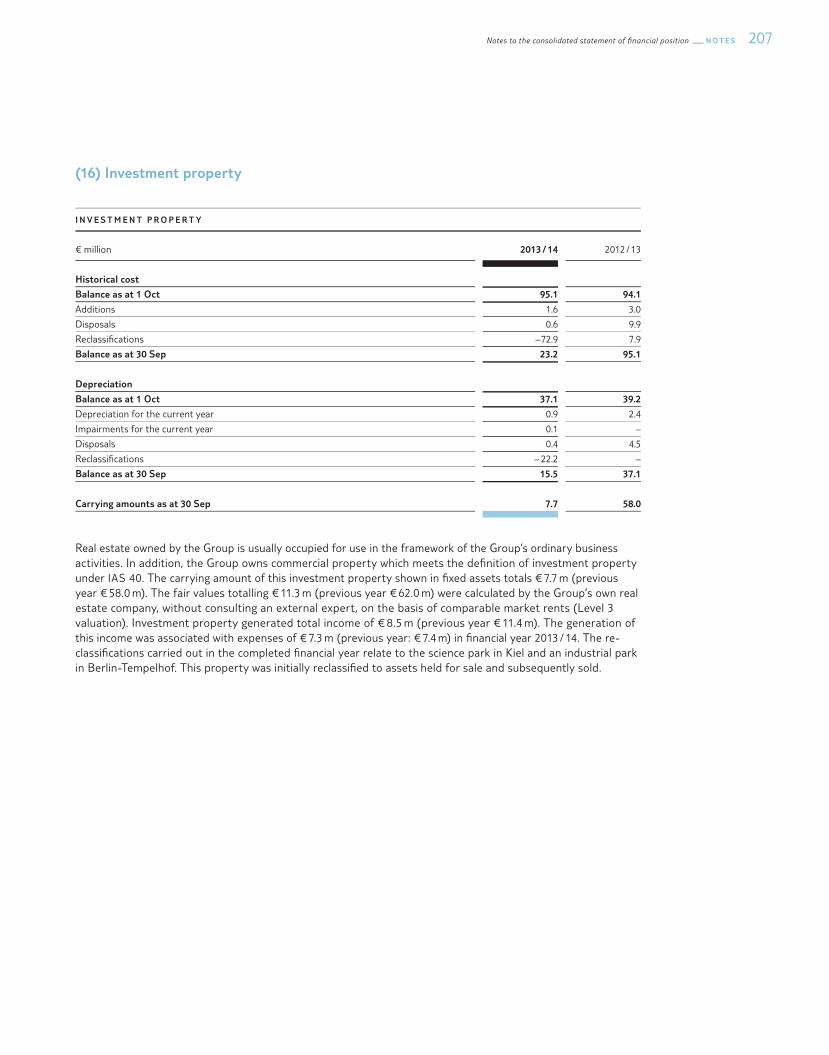
207Notes to the consolidated statement of §nancial position N O T E S
(16) Investment property
I N V E S T M E N T P R O P E R T Y
€ million 2013 / 14 2012 / 13
Historical cost
Balance as at 1 Oct 95.1 94.1
Additions 1.6 3.0
Disposals 0.6 9.9
Reclassi�cations – 72.9 7.9
Balance as at 30 Sep 23.2 95.1
Depreciation
Balance as at 1 Oct 37.1 39.2
Depreciation for the current year 0.9 2.4
Impairments for the current year 0.1 –
Disposals 0.4 4.5
Reclassi�cations – 22.2 –
Balance as at 30 Sep 15.5 37.1
Carrying amounts as at 30 Sep 7.7 58.0
Real estate owned by the Group is usually occupied for use in the framework of the Group’s ordinary business activities. In addition, the Group owns commercial property which meets the de�nition of investment property under IAS 40. The carrying amount of this investment property shown in �xed assets totals € 7.7 m (previous year € 58.0 m). The fair values totalling € 11.3 m (previous year € 62.0 m) were calculated by the Group’s own real estate company, without consulting an external expert, on the basis of comparable market rents (Level 3 valuation). Investment property generated total income of € 8.5 m (previous year € 11.4 m). The generation of this income was associated with expenses of € 7.3 m (previous year: € 7.4 m) in �nancial year 2013 / 14. The re-classi�cations carried out in the completed �nancial year relate to the science park in Kiel and an industrial park in Berlin-Tempelhof. This property was initially reclassi�ed to assets held for sale and subsequently sold.

N O T E S Notes to the consolidated statement of §nancial position208
(17) Property, plant and equipment
P R O P E R T Y, P L A N T A N D E Q U I P M E N T
€ million
Real estate
with hotels
Other real estate, land
rights and buildings incl.
buildings on third-party
properties Aircraft Ships
Machinery
and �xtures
Other plants,
operating and o¯ce
equipment revised
Assets under
construction
Payments
on account Total
Historical cost
Balance as at 1 Oct 2012 1,356.9 225.0 885.3 743.5 239.8 1,303.4 80.0 271.8 5,105.7
Exchange di§erences – 42.1 – 8.6 – 22.9 – 24.5 – 2.2 – 34.2 – 1.9 – 8.6 – 145.0
Additions due to changes in the group of
consolidated companies – 1.5 – – – 11.1 – – 12.6
Additions 26.6 6.4 225.7 43.8 6.4 89.8 74.0 170.4 643.1
Disposals 19.6 7.3 186.5 12.2 10.1 414.7 10.6 162.0 823.0 1
Reclassi�cation as assets held for sale – 6.9 – 0.4 12.6 – 1.2 – – 1.9 – – 9.0 – 6.8
Reclassi�cations 0.3 – 27.3 54.4 – 1.5 4.5 2.3 – 41.2 – 33.6 – 42.1
Balance as at 30 Sep 2013 1,315.2 189.3 968.6 747.9 238.4 955.8 100.3 229.0 4,744.5
Exchange di§erences 11.0 6.4 50.7 36.2 0.3 16.5 0.7 12.8 134.6
Additions due to changes in the group of
consolidated companies 21.5 0.8 – – – 2.3 – – 24.6 2
Additions 58.7 11.3 182.0 32.5 11.8 84.3 24.5 211.3 616.4
Disposals 13.9 4.0 51.0 23.6 0.7 56.4 1.7 229.4 380.7 3
Reclassi�cation as assets held for sale – 74.1 – 17.5 – – – 2.0 – 12.6 – – – 106.2
Reclassi�cations 14.7 45.9 10.0 – 4.6 7.2 – 0.9 – 58.6 – 2.0 11.7
Balance as at 30 Sep 2014 1,333.1 232.2 1,160.3 788.4 255.0 989.0 65.2 221.7 5,044.9
Depreciation
Balance as at 1 Oct 2012 401.3 65.6 560.0 281.0 160.4 986.1 – – 2,454.4
Exchange di§erences – 12.4 – 0.9 – 8.1 – 8.9 – 1.6 – 22.6 – – – 54.5
Depreciation for the current year 34.7 2.4 70.2 38.5 14.2 104.0 – – 264.0
Impairments for the current year – 15.9 9.1 – 0.6 3.5 – – 29.1
Disposals 14.6 3.9 164.5 6.9 10.4 410.9 – – 611.21
Reclassi�cation as assets held for sale – 1.3 – 12.9 – 0.7 – – 1.3 – – 9.6
Reclassi�cations – – 22.3 – 2.5 – 4.2 2.1 – 2.0 – – – 28.9
Balance as at 30 Sep 2013 407.7 56.8 477.1 298.8 165.3 656.8 – – 2,062.5
Exchange di§erences 10.1 1.7 15.0 14.3 0.4 8.0 – – 49.5
Depreciation for the current year 34.1 4.3 76.7 44.2 13.2 83.8 – – 256.3
Impairments for the current year – – 0.1 18.2 – 3.2 – – 21.5
Disposals 7.8 2.6 44.3 16.5 0.7 49.5 – – 121.4 3
Reclassi�cation as assets held for sale – 54.3 – 10.5 – – – 1.8 – 11.2 – – – 77.8
Reclassi�cations – 6.4 30.1 – – 3.4 4.4 – 7.0 – – 17.7
Balance as at 30 Sep 2014 383.4 79.8 524.6 355.6 180.8 684.1 – – 2,208.3
Carrying amounts as at 30 Sep 2013 907.5 132.5 491.5 449.1 73.1 299.0 100.3 229.0 2,682.0
Carrying amounts as at 30 Sep 2014 949.7 152.4 635.7 432.8 74.2 304.9 65.2 221.7 2,836.6
1 Of which no disposals due to changes in the group of consolidated companies2 Of which additions due to �rst-time consolidation of non-consolidated companies of € 0.3 m3 Of which disposals due to changes in the group of consolidated companies of € 0.3 m (historical cost) and € 0.2 m (depreciation), respectively
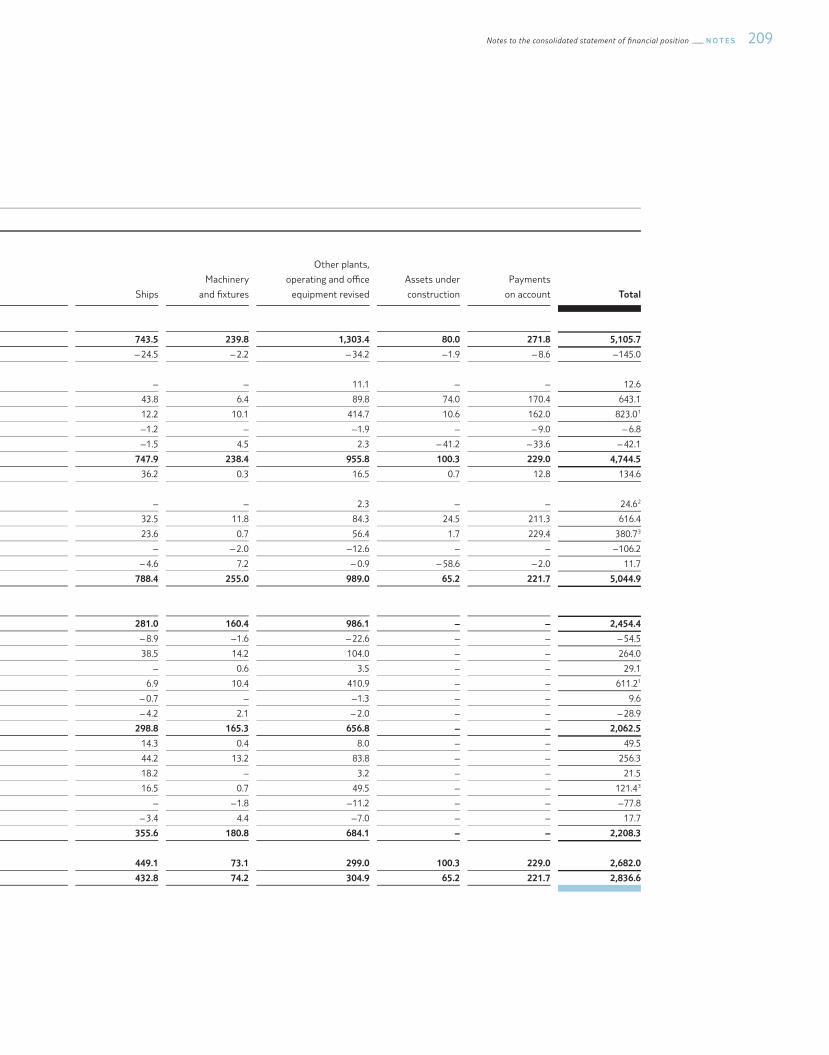
209Notes to the consolidated statement of §nancial position N O T E S
(17) Property, plant and equipment
P R O P E R T Y, P L A N T A N D E Q U I P M E N T
€ million
Real estate
with hotels
Other real estate, land
rights and buildings incl.
buildings on third-party
properties Aircraft Ships
Machinery
and �xtures
Other plants,
operating and o¯ce
equipment revised
Assets under
construction
Payments
on account Total
Historical cost
Balance as at 1 Oct 2012 1,356.9 225.0 885.3 743.5 239.8 1,303.4 80.0 271.8 5,105.7
Exchange di§erences – 42.1 – 8.6 – 22.9 – 24.5 – 2.2 – 34.2 – 1.9 – 8.6 – 145.0
Additions due to changes in the group of
consolidated companies – 1.5 – – – 11.1 – – 12.6
Additions 26.6 6.4 225.7 43.8 6.4 89.8 74.0 170.4 643.1
Disposals 19.6 7.3 186.5 12.2 10.1 414.7 10.6 162.0 823.0 1
Reclassi�cation as assets held for sale – 6.9 – 0.4 12.6 – 1.2 – – 1.9 – – 9.0 – 6.8
Reclassi�cations 0.3 – 27.3 54.4 – 1.5 4.5 2.3 – 41.2 – 33.6 – 42.1
Balance as at 30 Sep 2013 1,315.2 189.3 968.6 747.9 238.4 955.8 100.3 229.0 4,744.5
Exchange di§erences 11.0 6.4 50.7 36.2 0.3 16.5 0.7 12.8 134.6
Additions due to changes in the group of
consolidated companies 21.5 0.8 – – – 2.3 – – 24.6 2
Additions 58.7 11.3 182.0 32.5 11.8 84.3 24.5 211.3 616.4
Disposals 13.9 4.0 51.0 23.6 0.7 56.4 1.7 229.4 380.7 3
Reclassi�cation as assets held for sale – 74.1 – 17.5 – – – 2.0 – 12.6 – – – 106.2
Reclassi�cations 14.7 45.9 10.0 – 4.6 7.2 – 0.9 – 58.6 – 2.0 11.7
Balance as at 30 Sep 2014 1,333.1 232.2 1,160.3 788.4 255.0 989.0 65.2 221.7 5,044.9
Depreciation
Balance as at 1 Oct 2012 401.3 65.6 560.0 281.0 160.4 986.1 – – 2,454.4
Exchange di§erences – 12.4 – 0.9 – 8.1 – 8.9 – 1.6 – 22.6 – – – 54.5
Depreciation for the current year 34.7 2.4 70.2 38.5 14.2 104.0 – – 264.0
Impairments for the current year – 15.9 9.1 – 0.6 3.5 – – 29.1
Disposals 14.6 3.9 164.5 6.9 10.4 410.9 – – 611.21
Reclassi�cation as assets held for sale – 1.3 – 12.9 – 0.7 – – 1.3 – – 9.6
Reclassi�cations – – 22.3 – 2.5 – 4.2 2.1 – 2.0 – – – 28.9
Balance as at 30 Sep 2013 407.7 56.8 477.1 298.8 165.3 656.8 – – 2,062.5
Exchange di§erences 10.1 1.7 15.0 14.3 0.4 8.0 – – 49.5
Depreciation for the current year 34.1 4.3 76.7 44.2 13.2 83.8 – – 256.3
Impairments for the current year – – 0.1 18.2 – 3.2 – – 21.5
Disposals 7.8 2.6 44.3 16.5 0.7 49.5 – – 121.4 3
Reclassi�cation as assets held for sale – 54.3 – 10.5 – – – 1.8 – 11.2 – – – 77.8
Reclassi�cations – 6.4 30.1 – – 3.4 4.4 – 7.0 – – 17.7
Balance as at 30 Sep 2014 383.4 79.8 524.6 355.6 180.8 684.1 – – 2,208.3
Carrying amounts as at 30 Sep 2013 907.5 132.5 491.5 449.1 73.1 299.0 100.3 229.0 2,682.0
Carrying amounts as at 30 Sep 2014 949.7 152.4 635.7 432.8 74.2 304.9 65.2 221.7 2,836.6
1 Of which no disposals due to changes in the group of consolidated companies2 Of which additions due to �rst-time consolidation of non-consolidated companies of € 0.3 m3 Of which disposals due to changes in the group of consolidated companies of € 0.3 m (historical cost) and € 0.2 m (depreciation), respectively
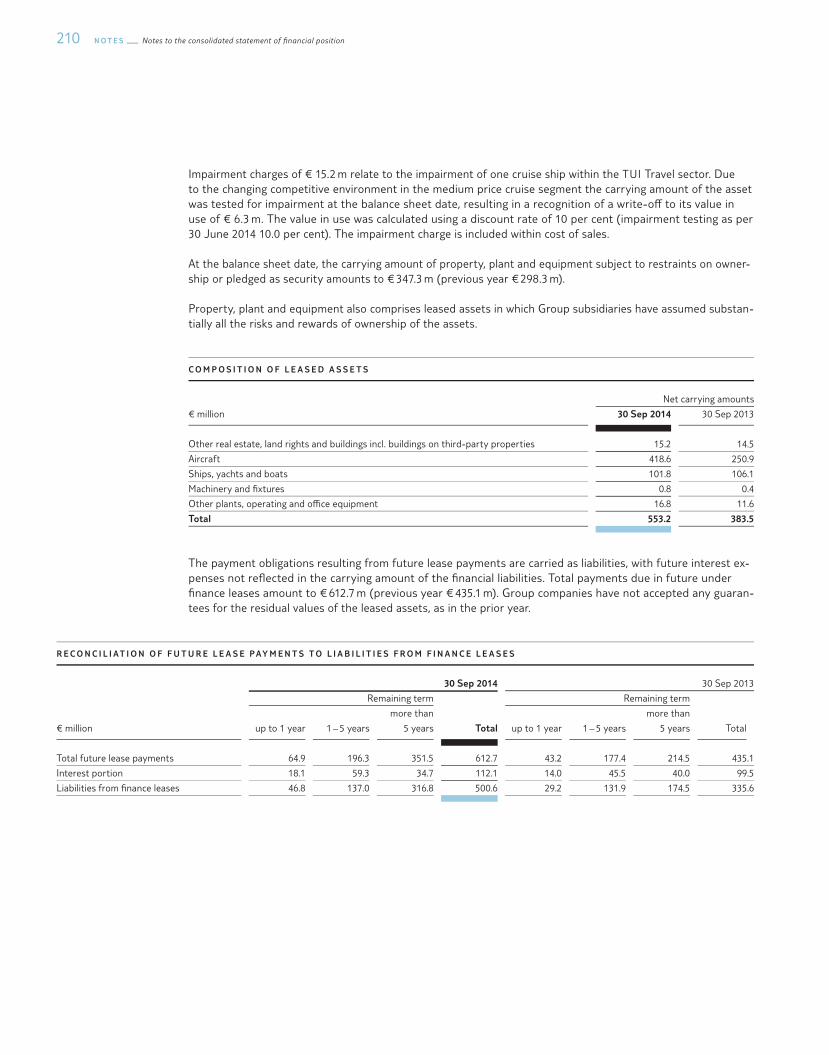
N O T E S Notes to the consolidated statement of §nancial position210
Impairment charges of € 15.2 m relate to the impairment of one cruise ship within the TUI Travel sector. Due to the changing competitive environment in the medium price cruise segment the carrying amount of the asset was tested for impairment at the balance sheet date, resulting in a recognition of a write-o§ to its value in use of € 6.3 m. The value in use was calculated using a discount rate of 10 per cent (impairment testing as per 30 June 2014 10.0 per cent). The impairment charge is included within cost of sales.
At the balance sheet date, the carrying amount of property, plant and equipment subject to restraints on owner-ship or pledged as security amounts to € 347.3 m (previous year € 298.3 m).
Property, plant and equipment also comprises leased assets in which Group subsidiaries have assumed substan-tially all the risks and rewards of ownership of the assets.
C O M P O S I T I O N O F L E A S E D A S S E T S
Net carrying amounts
€ million 30 Sep 2014 30 Sep 2013
Other real estate, land rights and buildings incl. buildings on third-party properties 15.2 14.5
Aircraft 418.6 250.9
Ships, yachts and boats 101.8 106.1
Machinery and �xtures 0.8 0.4
Other plants, operating and o¯ce equipment 16.8 11.6
Total 553.2 383.5
The payment obligations resulting from future lease payments are carried as liabilities, with future interest ex-penses not re®ected in the carrying amount of the �nancial liabilities. Total payments due in future under �nance leases amount to € 612.7 m (previous year € 435.1 m). Group companies have not accepted any guaran-tees for the residual values of the leased assets, as in the prior year.
R E C O N C I L I AT I O N O F F U T U R E L E A S E P AY M E N T S T O L I A B I L I T I E S F R O M F I N A N C E L E A S E S
30 Sep 2014 30 Sep 2013
Remaining term Remaining term
€ million up to 1 year 1 – 5 years
more than
5 years Total up to 1 year 1 – 5 years
more than
5 years Total
Total future lease payments 64.9 196.3 351.5 612.7 43.2 177.4 214.5 435.1
Interest portion 18.1 59.3 34.7 112.1 14.0 45.5 40.0 99.5
Liabilities from �nance leases 46.8 137.0 316.8 500.6 29.2 131.9 174.5 335.6
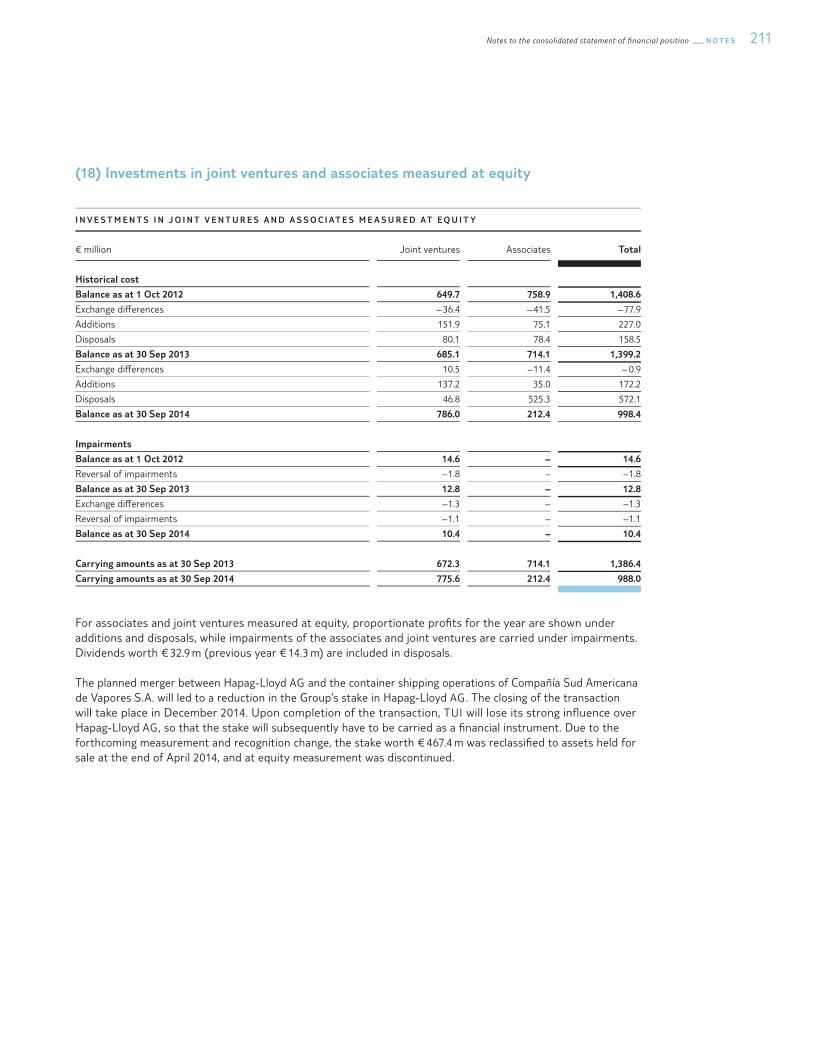
211Notes to the consolidated statement of §nancial position N O T E S
(18) Investments in joint ventures and associates measured at equity
I N V E S T M E N T S I N J O I N T V E N T U R E S A N D A S S O C I AT E S M E A S U R E D AT E Q U I T Y
€ million Joint ventures Associates Total
Historical cost
Balance as at 1 Oct 2012 649.7 758.9 1,408.6
Exchange di§erences – 36.4 – 41.5 – 77.9
Additions 151.9 75.1 227.0
Disposals 80.1 78.4 158.5
Balance as at 30 Sep 2013 685.1 714.1 1,399.2
Exchange di§erences 10.5 – 11.4 – 0.9
Additions 137.2 35.0 172.2
Disposals 46.8 525.3 572.1
Balance as at 30 Sep 2014 786.0 212.4 998.4
Impairments
Balance as at 1 Oct 2012 14.6 – 14.6
Reversal of impairments – 1.8 – – 1.8
Balance as at 30 Sep 2013 12.8 – 12.8
Exchange di§erences – 1.3 – – 1.3
Reversal of impairments – 1.1 – – 1.1
Balance as at 30 Sep 2014 10.4 – 10.4
Carrying amounts as at 30 Sep 2013 672.3 714.1 1,386.4
Carrying amounts as at 30 Sep 2014 775.6 212.4 988.0
For associates and joint ventures measured at equity, proportionate pro�ts for the year are shown under additions and disposals, while impairments of the associates and joint ventures are carried under impairments. Dividends worth € 32.9 m (previous year € 14.3 m) are included in disposals.
The planned merger between Hapag-Lloyd AG and the container shipping operations of Compañía Sud Americana de Vapores S.A. will led to a reduction in the Group’s stake in Hapag-Lloyd AG. The closing of the transaction will take place in December 2014. Upon completion of the transaction, TUI will lose its strong in®uence over Hapag-Lloyd AG, so that the stake will subsequently have to be carried as a �nancial instrument. Due to the forthcoming measurement and recognition change, the stake worth € 467.4 m was reclassi�ed to assets held for sale at the end of April 2014, and at equity measurement was discontinued.
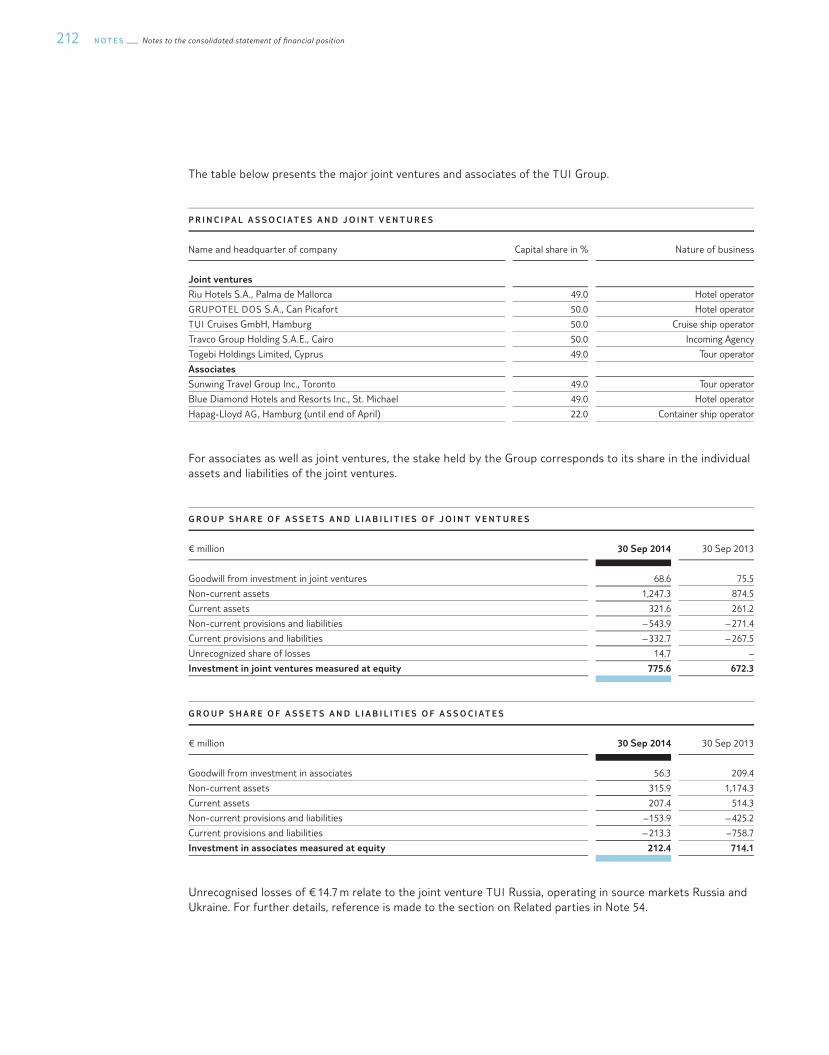
N O T E S Notes to the consolidated statement of §nancial position212
The table below presents the major joint ventures and associates of the TUI Group.
P R I N C I P A L A S S O C I AT E S A N D J O I N T V E N T U R E S
Name and headquarter of company Capital share in % Nature of business
Joint ventures
Riu Hotels S.A., Palma de Mallorca 49.0 Hotel operator
GRUPOTEL DOS S.A., Can Picafort 50.0 Hotel operator
TUI Cruises GmbH, Hamburg 50.0 Cruise ship operator
Travco Group Holding S.A.E., Cairo 50.0 Incoming Agency
Togebi Holdings Limited, Cyprus 49.0 Tour operator
Associates
Sunwing Travel Group Inc., Toronto 49.0 Tour operator
Blue Diamond Hotels and Resorts Inc., St. Michael 49.0 Hotel operator
Hapag-Lloyd AG, Hamburg (until end of April) 22.0 Container ship operator
For associates as well as joint ventures, the stake held by the Group corresponds to its share in the individual assets and liabilities of the joint ventures.
G R O U P S H A R E O F A S S E T S A N D L I A B I L I T I E S O F J O I N T V E N T U R E S
€ million 30 Sep 2014 30 Sep 2013
Goodwill from investment in joint ventures 68.6 75.5
Non-current assets 1,247.3 874.5
Current assets 321.6 261.2
Non-current provisions and liabilities – 543.9 – 271.4
Current provisions and liabilities – 332.7 – 267.5
Unrecognized share of losses 14.7 –
Investment in joint ventures measured at equity 775.6 672.3
G R O U P S H A R E O F A S S E T S A N D L I A B I L I T I E S O F A S S O C I AT E S
€ million 30 Sep 2014 30 Sep 2013
Goodwill from investment in associates 56.3 209.4
Non-current assets 315.9 1,174.3
Current assets 207.4 514.3
Non-current provisions and liabilities – 153.9 – 425.2
Current provisions and liabilities – 213.3 – 758.7
Investment in associates measured at equity 212.4 714.1
Unrecognised losses of € 14.7 m relate to the joint venture TUI Russia, operating in source markets Russia and Ukraine. For further details, reference is made to the section on Related parties in Note 54.
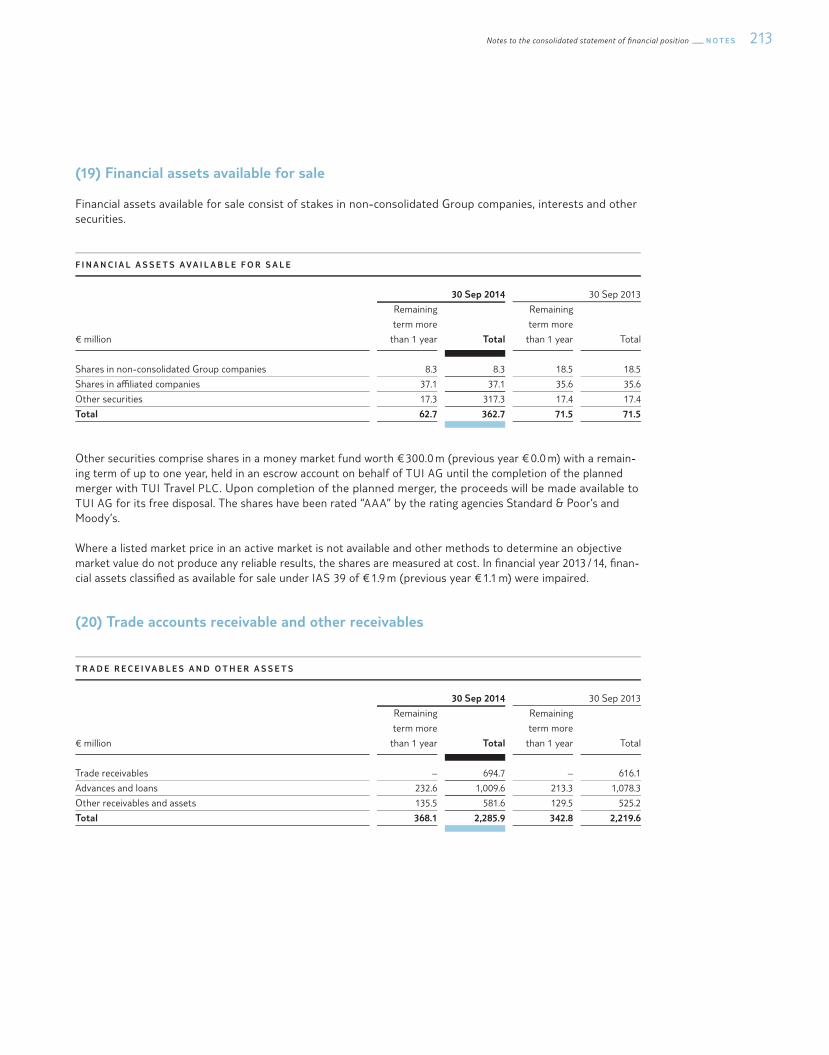
213Notes to the consolidated statement of §nancial position N O T E S
(19) Financial assets available for sale
Financial assets available for sale consist of stakes in non-consolidated Group companies, interests and other securities.
F I N A N C I A L A S S E T S A V A I L A B L E F O R S A L E
30 Sep 2014 30 Sep 2013
€ million
Remaining
term more
than 1 year Total
Remaining
term more
than 1 year Total
Shares in non-consolidated Group companies 8.3 8.3 18.5 18.5
Shares in a¯liated companies 37.1 37.1 35.6 35.6
Other securities 17.3 317.3 17.4 17.4
Total 62.7 362.7 71.5 71.5
Other securities comprise shares in a money market fund worth € 300.0 m (previous year € 0.0 m) with a remain-ing term of up to one year, held in an escrow account on behalf of TUI AG until the completion of the planned merger with TUI Travel PLC. Upon completion of the planned merger, the proceeds will be made available to TUI AG for its free disposal. The shares have been rated “AAA” by the rating agencies Standard & Poor’s and Moody’s.
Where a listed market price in an active market is not available and other methods to determine an objective market value do not produce any reliable results, the shares are measured at cost. In �nancial year 2013 / 14, �nan-cial assets classi�ed as available for sale under IAS 39 of € 1.9 m (previous year € 1.1 m) were impaired.
(20) Trade accounts receivable and other receivables
T R A D E R E C E I V A B L E S A N D O T H E R A S S E T S
30 Sep 2014 30 Sep 2013
€ million
Remaining
term more
than 1 year Total
Remaining
term more
than 1 year Total
Trade receivables – 694.7 – 616.1
Advances and loans 232.6 1,009.6 213.3 1,078.3
Other receivables and assets 135.5 581.6 129.5 525.2
Total 368.1 2,285.9 342.8 2,219.6
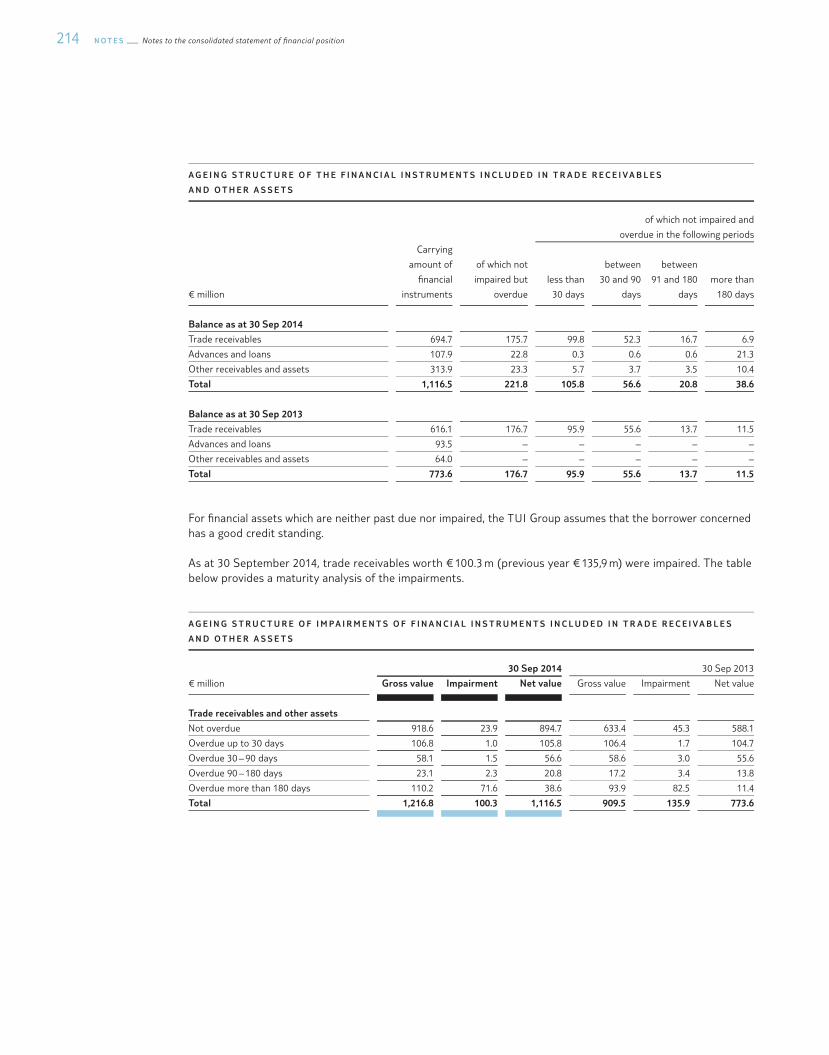
N O T E S Notes to the consolidated statement of §nancial position214
A G E I N G S T R U C T U R E O F T H E F I N A N C I A L I N S T R U M E N T S I N C L U D E D I N T R A D E R E C E I V A B L E S
A N D O T H E R A S S E T S
of which not impaired and
overdue in the following periods
€ million
Carrying
amount of
�nancial
instruments
of which not
impaired but
overdue
less than
30 days
between
30 and 90
days
between
91 and 180
days
more than
180 days
Balance as at 30 Sep 2014
Trade receivables 694.7 175.7 99.8 52.3 16.7 6.9
Advances and loans 107.9 22.8 0.3 0.6 0.6 21.3
Other receivables and assets 313.9 23.3 5.7 3.7 3.5 10.4
Total 1,116.5 221.8 105.8 56.6 20.8 38.6
Balance as at 30 Sep 2013
Trade receivables 616.1 176.7 95.9 55.6 13.7 11.5
Advances and loans 93.5 – – – – –
Other receivables and assets 64.0 – – – – –
Total 773.6 176.7 95.9 55.6 13.7 11.5
For �nancial assets which are neither past due nor impaired, the TUI Group assumes that the borrower concerned has a good credit standing.
As at 30 September 2014, trade receivables worth € 100.3 m (previous year € 135,9 m) were impaired. The table below provides a maturity analysis of the impairments.
A G E I N G S T R U C T U R E O F I M P A I R M E N T S O F F I N A N C I A L I N S T R U M E N T S I N C L U D E D I N T R A D E R E C E I V A B L E S
A N D O T H E R A S S E T S
30 Sep 2014 30 Sep 2013
€ million Gross value Impairment Net value Gross value Impairment Net value
Trade receivables and other assets
Not overdue 918.6 23.9 894.7 633.4 45.3 588.1
Overdue up to 30 days 106.8 1.0 105.8 106.4 1.7 104.7
Overdue 30 – 90 days 58.1 1.5 56.6 58.6 3.0 55.6
Overdue 90 – 180 days 23.1 2.3 20.8 17.2 3.4 13.8
Overdue more than 180 days 110.2 71.6 38.6 93.9 82.5 11.4
Total 1,216.8 100.3 1,116.5 909.5 135.9 773.6
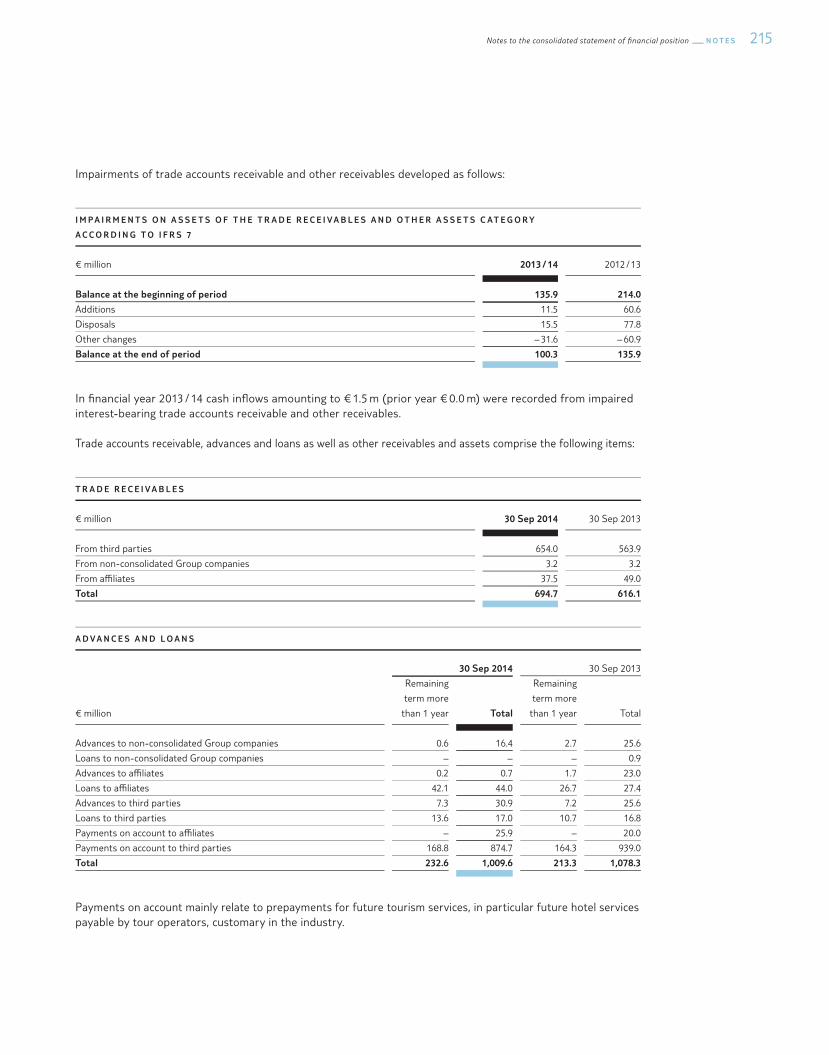
215Notes to the consolidated statement of §nancial position N O T E S
Impairments of trade accounts receivable and other receivables developed as follows:
I M P A I R M E N T S O N A S S E T S O F T H E T R A D E R E C E I V A B L E S A N D O T H E R A S S E T S C AT E G O R Y
A C C O R D I N G T O I F R S 7
€ million 2013 / 14 2012 / 13
Balance at the beginning of period 135.9 214.0
Additions 11.5 60.6
Disposals 15.5 77.8
Other changes – 31.6 – 60.9
Balance at the end of period 100.3 135.9
In �nancial year 2013 / 14 cash in®ows amounting to € 1.5 m (prior year € 0.0 m) were recorded from impaired interest-bearing trade accounts receivable and other receivables.
Trade accounts receivable, advances and loans as well as other receivables and assets comprise the following items:
T R A D E R E C E I V A B L E S
€ million 30 Sep 2014 30 Sep 2013
From third parties 654.0 563.9
From non-consolidated Group companies 3.2 3.2
From a¯liates 37.5 49.0
Total 694.7 616.1
A D V A N C E S A N D L O A N S
30 Sep 2014 30 Sep 2013
€ million
Remaining
term more
than 1 year Total
Remaining
term more
than 1 year Total
Advances to non-consolidated Group companies 0.6 16.4 2.7 25.6
Loans to non-consolidated Group companies – – – 0.9
Advances to a¯liates 0.2 0.7 1.7 23.0
Loans to a¯liates 42.1 44.0 26.7 27.4
Advances to third parties 7.3 30.9 7.2 25.6
Loans to third parties 13.6 17.0 10.7 16.8
Payments on account to a¯liates – 25.9 – 20.0
Payments on account to third parties 168.8 874.7 164.3 939.0
Total 232.6 1,009.6 213.3 1,078.3
Payments on account mainly relate to prepayments for future tourism services, in particular future hotel services payable by tour operators, customary in the industry.
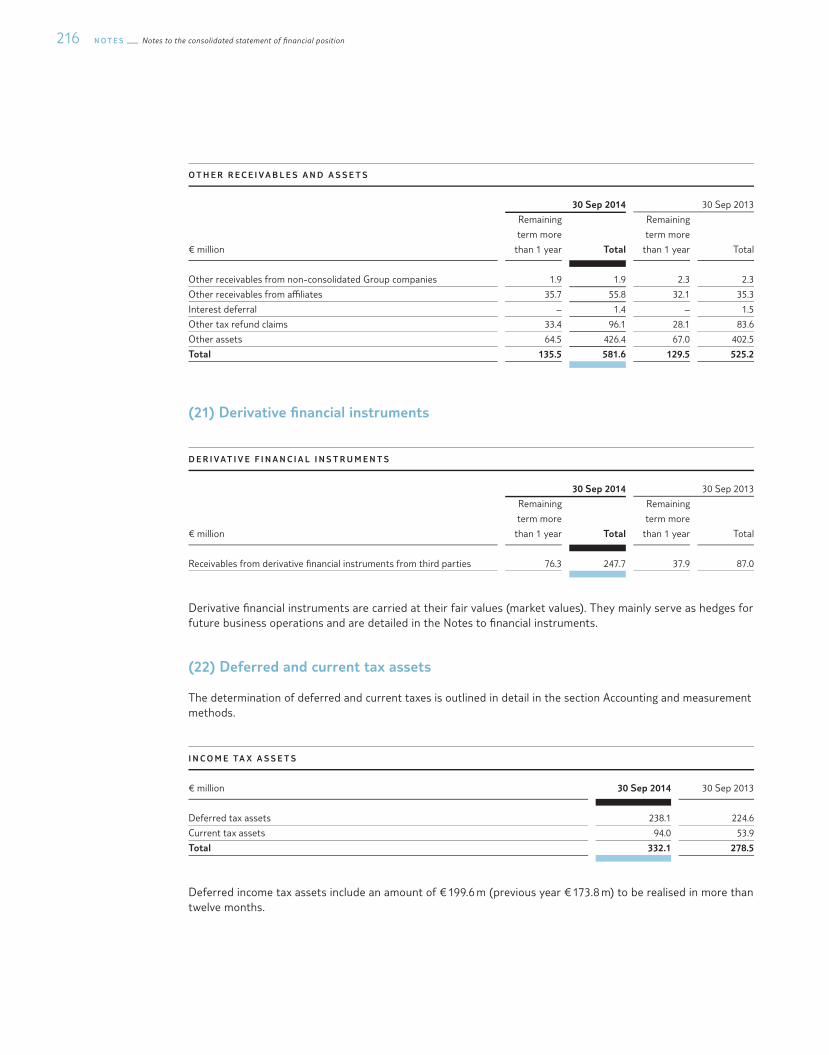
N O T E S Notes to the consolidated statement of §nancial position216
O T H E R R E C E I V A B L E S A N D A S S E T S
30 Sep 2014 30 Sep 2013
€ million
Remaining
term more
than 1 year Total
Remaining
term more
than 1 year Total
Other receivables from non-consolidated Group companies 1.9 1.9 2.3 2.3
Other receivables from a¯liates 35.7 55.8 32.1 35.3
Interest deferral – 1.4 – 1.5
Other tax refund claims 33.4 96.1 28.1 83.6
Other assets 64.5 426.4 67.0 402.5
Total 135.5 581.6 129.5 525.2
(21) Derivative �nancial instruments
D E R I V AT I V E F I N A N C I A L I N S T R U M E N T S
30 Sep 2014 30 Sep 2013
€ million
Remaining
term more
than 1 year Total
Remaining
term more
than 1 year Total
Receivables from derivative �nancial instruments from third parties 76.3 247.7 37.9 87.0
Derivative �nancial instruments are carried at their fair values (market values). They mainly serve as hedges for future business operations and are detailed in the Notes to �nancial instruments.
(22) Deferred and current tax assets
The determination of deferred and current taxes is outlined in detail in the section Accounting and measurement methods.
I N C O M E TA X A S S E T S
€ million 30 Sep 2014 30 Sep 2013
Deferred tax assets 238.1 224.6
Current tax assets 94.0 53.9
Total 332.1 278.5
Deferred income tax assets include an amount of € 199.6 m (previous year € 173.8 m) to be realised in more than twelve months.
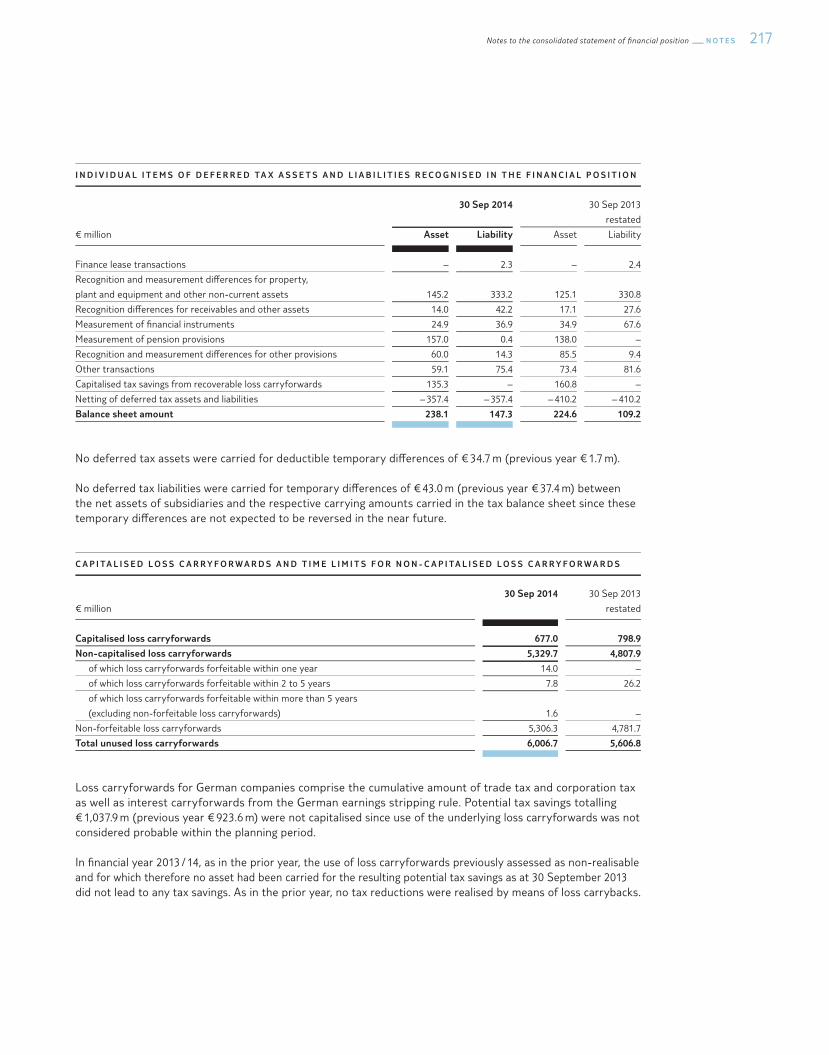
217Notes to the consolidated statement of §nancial position N O T E S
I N D I V I D U A L I T E M S O F D E F E R R E D TA X A S S E T S A N D L I A B I L I T I E S R E C O G N I S E D I N T H E F I N A N C I A L P O S I T I O N
30 Sep 2014 30 Sep 2013
restated
€ million Asset Liability Asset Liability
Finance lease transactions – 2.3 – 2.4
Recognition and measurement di§erences for property,
plant and equipment and other non-current assets 145.2 333.2 125.1 330.8
Recognition di§erences for receivables and other assets 14.0 42.2 17.1 27.6
Measurement of �nancial instruments 24.9 36.9 34.9 67.6
Measurement of pension provisions 157.0 0.4 138.0 –
Recognition and measurement di§erences for other provisions 60.0 14.3 85.5 9.4
Other transactions 59.1 75.4 73.4 81.6
Capitalised tax savings from recoverable loss carryforwards 135.3 – 160.8 –
Netting of deferred tax assets and liabilities – 357.4 – 357.4 – 410.2 – 410.2
Balance sheet amount 238.1 147.3 224.6 109.2
No deferred tax assets were carried for deductible temporary di§erences of € 34.7 m (previous year € 1.7 m).
No deferred tax liabilities were carried for temporary di§erences of € 43.0 m (previous year € 37.4 m) between the net assets of subsidiaries and the respective carrying amounts carried in the tax balance sheet since these temporary di§erences are not expected to be reversed in the near future.
C A P I TA L I S E D L O S S C A R R Y F O R W A R D S A N D T I M E L I M I T S F O R N O N - C A P I TA L I S E D L O S S C A R R Y F O R W A R D S
€ million
30 Sep 2014 30 Sep 2013
restated
Capitalised loss carryforwards 677.0 798.9
Non-capitalised loss carryforwards 5,329.7 4,807.9
of which loss carryforwards forfeitable within one year 14.0 –
of which loss carryforwards forfeitable within 2 to 5 years 7.8 26.2
of which loss carryforwards forfeitable within more than 5 years
(excluding non-forfeitable loss carryforwards) 1.6 –
Non-forfeitable loss carryforwards 5,306.3 4,781.7
Total unused loss carryforwards 6,006.7 5,606.8
Loss carryforwards for German companies comprise the cumulative amount of trade tax and corporation tax as well as interest carryforwards from the German earnings stripping rule. Potential tax savings totalling € 1,037.9 m (previous year € 923.6 m) were not capitalised since use of the underlying loss carryforwards was not considered probable within the planning period.
In �nancial year 2013 / 14, as in the prior year, the use of loss carryforwards previously assessed as non-realisable and for which therefore no asset had been carried for the resulting potential tax savings as at 30 September 2013 did not lead to any tax savings. As in the prior year, no tax reductions were realised by means of loss carrybacks.
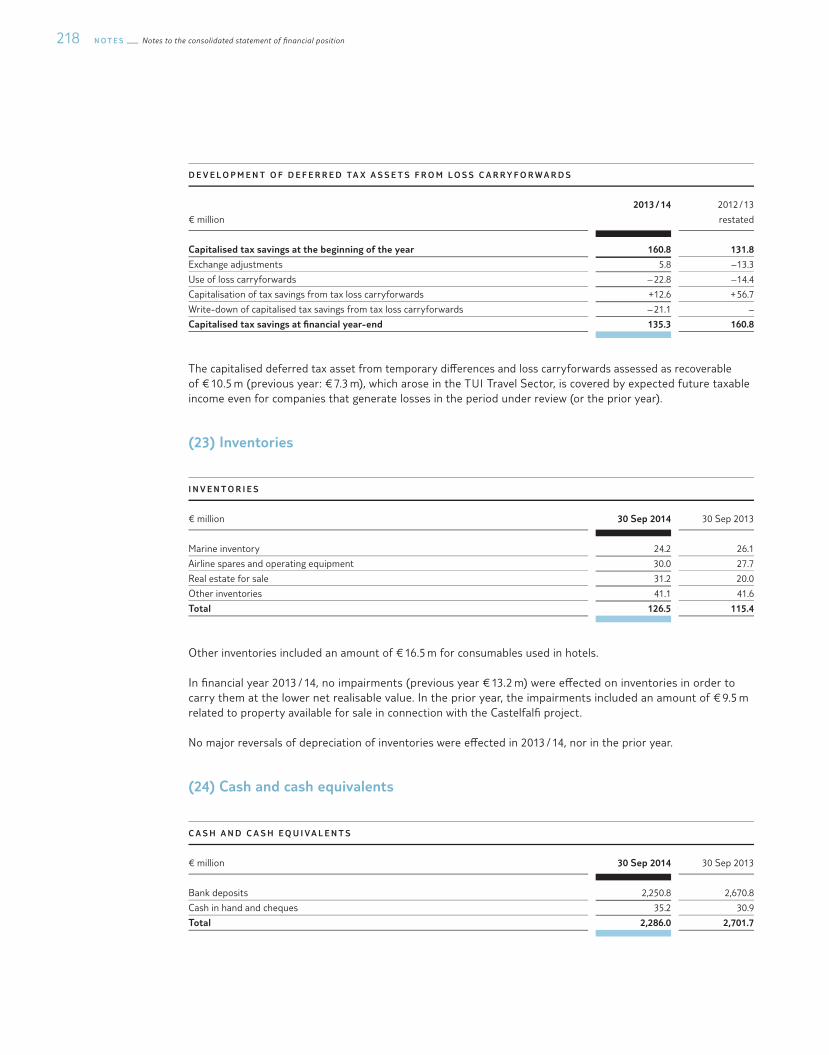
N O T E S Notes to the consolidated statement of §nancial position218
D E V E L O P M E N T O F D E F E R R E D TA X A S S E T S F R O M L O S S C A R R Y F O R W A R D S
€ million
2013 / 14 2012 / 13
restated
Capitalised tax savings at the beginning of the year 160.8 131.8
Exchange adjustments 5.8 – 13.3
Use of loss carryforwards – 22.8 – 14.4
Capitalisation of tax savings from tax loss carryforwards + 12.6 + 56.7
Write-down of capitalised tax savings from tax loss carryforwards – 21.1 –
Capitalised tax savings at �nancial year-end 135.3 160.8
The capitalised deferred tax asset from temporary di§erences and loss carryforwards assessed as recoverable of € 10.5 m (previous year: € 7.3 m), which arose in the TUI Travel Sector, is covered by expected future taxable income even for companies that generate losses in the period under review (or the prior year).
(23) Inventories
I N V E N T O R I E S
€ million 30 Sep 2014 30 Sep 2013
Marine inventory 24.2 26.1
Airline spares and operating equipment 30.0 27.7
Real estate for sale 31.2 20.0
Other inventories 41.1 41.6
Total 126.5 115.4
Other inventories included an amount of € 16.5 m for consumables used in hotels.
In �nancial year 2013 / 14, no impairments (previous year € 13.2 m) were e§ected on inventories in order to carry them at the lower net realisable value. In the prior year, the impairments included an amount of € 9.5 m related to property available for sale in connection with the Castelfal� project.
No major reversals of depreciation of inventories were e§ected in 2013 / 14, nor in the prior year.
(24) Cash and cash equivalents
C A S H A N D C A S H E Q U I V A L E N T S
€ million 30 Sep 2014 30 Sep 2013
Bank deposits 2,250.8 2,670.8
Cash in hand and cheques 35.2 30.9
Total 2,286.0 2,701.7

219Notes to the consolidated statement of §nancial position N O T E S
The decrease in cash and cash equivalents is primarily attributable to the net presentation of certain balances in banks resulting from a cash pool, which were carried on a gross basis not netted against short-term current account credits of this cash pool in the prior year. This balance sheet reduction does not a§ect the Group’s net �nancial position.
At 30 September 2014, cash and cash equivalents of € 180.3 m (previous year € 175.4 m) were subject to restraints on disposal. They included an amount of € 118.2 m for cash collateral received, which was deposited in a Belgian subsidiary by Belgian tax authorities in the past �nancial year in the framework of long-standing litigation over VAT refunds for the years 2001 to 2011 without inference of guilt, the purpose being to interrupt the accrual of interest for both parties. In order to collateralise a potential repayment, the Belgian government was granted a bank guarantee. Due to the bank guarantee, TUI ’s ability to dispose of the cash and cash equivalents has been restricted.
(25) Assets held for sale
A S S E T S H E L D F O R S A L E
€ million 30 Sep 2014 30 Sep 2013
Investment 467.4 –
Property and hotel facilities 13.0 6.6
Other assets 2.9 5.0
Total 483.3 11.6
The planned merger between Hapag-Lloyd AG and the container shipping operations of Compañía Sud Americana de Vapores S.A. will result in a reduction in the Group’s stake in Hapag-Lloyd AG. The closing of the trans-action will take place in December 2014. Upon completion of the transaction, TUI will lose its strong in®uence over Hapag-Lloyd AG, so that the stake will subsequently have to be carried as a �nancial instrument. Due to the forthcoming measurement and recognition change, the stake worth € 467.4 m was reclassi�ed to assets held for sale at the end of April 2014.
Property and hotel complexes mainly comprise a hotel facility in Gran Canaria and a hotel complex in Bulgaria, which are held for sale.
In the �nancial year under review, property and hotel complexes were reclassi�ed to assets held for sale and sold in the course of the year. These assets include, in particular, an industrial park in Berlin-Tempelhof, the science park in Kiel and two hotel companies in Switzerland and Austria.
The accumulated expenses and income in connection with assets held for sale, directly carried in equity, total € – 45.7 m.
(26) Subscribed capital
The subscribed capital of TUI AG consists of no-par value shares, each representing an identical share in the capital stock. The proportionate share in the capital stock per no-par value share is around € 2.56. Since the switch in July 2005, the shares have been registered shares, whose owners have been listed by name in the share register.
The subscribed capital of TUI AG has been registered in the commercial registers of the district courts of Berlin- Charlottenburg and Hanover. In the �nancial year under review, it rose by a total of € 87.4 m to around € 732.6 m due to the issue of 99,800 shares resulting from the issue of employee shares and due to conversions of bonds
N O T E S Notes to the consolidated statement of §nancial position220
into 34,085,773 shares under the 2009 / 14 and 2011 / 16 convertible bonds. Subscribed capital thus consisted of 286,561,143 shares at the end of the �nancial year.
The Annual General Meeting on 12 February 2014 authorised the Executive Board of TUI AG to acquire own shares of an amount of up to 10 % of the capital stock. The authorisation will expire on 11 August 2015. The author-isation to acquire own shares has not been used to date.
CO N D I T I O N A L C A P I TA L
The Annual General Meetings of 7 May 2008 and 13 May 2009 had created conditional capital for the issue of bonds of € 100.0 m each and authorised the Company to issue bonds. The issue of bonds with conversion options and warrants as well as pro�t-sharing rights and income bonds (with and without �xed terms) under the two above-mentioned authorisations was limited to a total nominal amount of € 1.0 bn and expired on 6 May 2013 and 12 May 2014, respectively.
Further conditional capital for the issue of bonds of € 120.0 m was resolved at the Annual General Meeting on 15 February 2012. The authorisation to issue bonds with conversion options and warrants as well as pro�t- sharing rights and income bonds (with and without �xed terms) has been limited to a total nominal amount of € 1.0 bn and will mature on 14 February 2017.
Using the conditional capital of 13 May 2009, TUI AG issued an uncollateralised, non-subordinated convertible bond of € 217.8 m on 17 November 2009, maturing on 17 November 2014. The bond was issued in denominations of nominal values of € 56.30. The current conversion price is € 5.5645 per no-par value share due to the cash dividend paid on 13 February 2014. The convertible bond can thus be converted into a maximum of 39,116,600 shares if the conditional capital is fully used. The bonds, carrying an interest coupon of 5.50 % per annum, were issued at par. The bond is traded on �ve German stock exchanges. By 30 September 2014, 3,415,839 bonds had been converted into 34,554,834 new shares in TUI AG (including 34,084,104 bonds in the �nancial year under review).
Using the conditional capital of 7 May 2008, TUI AG issued an uncollateralised non-subordinated convertible bond of € 339.0 m on 24 March 2011, maturing on 24 March 2016. The bond was issued in denominations of nominal values of € 59.26. The conversion price is € 11.7127 per non-par value share due to the cash dividend paid on 13 February 2014. The convertible bond can thus be converted into a maximum of 28,939,860 shares. The bonds, carrying an interest coupon of 2.75 % p. a., were issued at par. The bond is traded on �ve German stock ex-changes. By 30 September 2014, 336 bonds had been converted into 1,684 new shares (including 1,669 shares in the �nancial year under review) in TUI AG.
Taking account of the conversions, TUI AG had total conditional capital of around € 231.7 m as at 30 Septem-ber 2014.
AU T H O R I S E D C A P I TA L
The Annual General Meeting of 9 February 2011 resolved to create additional authorised capital of € 246.0 m for the issue of new shares against cash contribution. The authorisation for this authorised capital will expire on 8 February 2016.
The Annual General Meeting of 13 February 2013 resolved to issue new registered shares against cash contribution for up to a maximum of € 64.5 m. This authorisation will expire on 12 February 2018.
The Annual General Meeting of 13 February 2013 also resolved new authorised capital for the issue of employee shares worth € 10.0 m. The Executive Board of TUI AG has been authorised to use this authorised capital in one or several transactions to issue employee shares against cash contribution by 12 February 2018. 99,800 new employee shares were issued in the completed �nancial year so that authorised capital totals around € 9.7 m at the balance sheet date.
221Notes to the consolidated statement of §nancial position N O T E S
Unused authorised capital thus totals around € 320.2 m at the balance sheet date (around € 320.5 m as at 30 September 2013).
(27) Capital reserves
The capital reserves comprise transfers of premiums. In addition, amounts entitling the holders to acquire shares in TUI AG in the framework of bonds issued for conversion options and warrants have to be transferred to the capital reserves if the conversion options and warrants have to be classi�ed as equity instruments in accordance with IAS 32. Premiums from the issue of shares due to the exercise of conversion options and warrants are also transferred to the capital reserve.
Borrowing costs for the issue of conversion options and warrants and for the capital increase by means of an issue of new shares against cash contribution were eliminated against the transfers to the capital reserves result-ing from these transactions.
The capital reserves rose by a total of € 98.6 m to € 1,056.3 m due to the issue of employee shares and the con-version of TUI AG bonds into shares.
(28) Revenue reserves
In the completed �nancial year, TUI AG paid a dividend of € 0.15 per no-par value share to its shareholders; the total amount paid was around € 37.8 m. Moreover, the interest paid on the hybrid capital issued by TUI AG has to be carried as a dividend in accordance with IFRS rules.
In the framework of long-term incentive programmes, TUI Travel PLC operates stock option plans serviced with shares for its employees. Disclosures on these long-term incentive programmes are outlined under Note 43 in the chapter on Share-based payments in accordance with IFRS 2.
In October 2009, TUI Travel PLC issued a convertible bond with a nominal value of £ 350.0 m maturing in October 2014. Due to conversions of bonds, equity rose by a total of € 465.7 m, including an amount of € 271.9 m for revenue reserves, with the remainder related to non-controlling interests in equity.
The acquisitions of non-controlling interests carried for the period under review relate, in particular, to the acqui-sition of own shares by TUI Travel PLC in order to use the same number of shares for its share award pro-gramme. The stake held by TUI AG in TUI Travel PLC therefore did not change. The consideration transferred totalled € 39.4 m. TUI Travel also acquired additional shares in two smaller consolidated companies for a con-sideration of € 2.0 m. Overall, equity therefore declined by € 41.4 m, including an amount of € 22.7 m for revenue reserves in line with TUI AG’s stake in TUI Travel PLC.
The conversion of convertible bonds of TUI Travel PLC resulted in an increase in the number of TUI Travel shares issued. As the number of shares held by TUI AG remained constant, the stake held by TUI AG declined accordingly. An amount of € – 12.3 m was therefore transferred from revenue reserves to non-controlling interests.
Foreign exchange di§erences comprise di§erences from the translation of the �nancial statements of foreign subsidiaries as well as di§erences from the translation of goodwill denominated in foreign currencies.
N O T E S Notes to the consolidated statement of §nancial position222
The proportion of gains and losses from hedges used as e§ective hedges of future cash ®ows is carried in equity in other comprehensive income outside pro�t and loss. A reversal of this provision through pro�t and loss takes place in the same period in which the hedged item has an e§ect on pro�t and loss or is no longer assessed as probable.
The revaluation of pension obligations (in particular actuarial gains and losses) is also carried in other income in equity outside pro�t and loss.
The revaluation reserve formed in accordance with IAS 27 (old version) in the framework of step acquisitions of companies is retained until the date of deconsolidation of the company concerned. In accordance with revised IAS 27, requiring prospective application, no new revaluation reserves are formed for step acquisitions since the changes in the fair values of the assets and liabilities of an acquired company arising in between the individual acquisition dates are taken through pro�t and loss based on the stake which had not yet triggered consolidation of the company concerned.
(29) Use of Group pro�t available for distribution
In accordance with the German Stock Corporation Act, the Annual General Meeting decides about the use of the pro�t available for distribution carried in TUI AG’s commercial-law annual �nancial statements. A proposal will be submitted to the Annual General Meeting to use the pro�t available for distribution for the �nancial year under review of € 161.3 m to pay a dividend of € 0.33 per no-par value share and carry the amount of € 66.7 m remaining after deduction of the dividend total of € 94.6 m forward on new account. The �nal dividend total will depend on the number of dividend-bearing no-par value shares at the date on which the resolution regarding the use of Group pro�t available for distribution is adopted by the Annual General Meeting.
(30) Hybrid capital
In accordance with IAS 32, the subordinated hybrid capital issued by TUI AG in December of �nancial year 2005 with a nominal volume of € 300.0 m constitutes Group equity. The borrowing costs of € 8.5 m were deducted from the hybrid capital outside pro�t and loss, taking account of deferred taxes. Dividend entitlements of the hybrid capital investors are deferred as other �nancial liabilities until the payment date.
(31) Non-controlling interests
Non-controlling interests mainly relate to companies of TUI Travel PLC and TUI Hotels & Resorts, in par-ticular the RIUSA II Group. Non-controlling interests declined due to dividend payments, most of which related to TUI Travel PLC and RIUSA II S.A.
(32) Pension provisions and similar obligations
A number of de�ned contribution plans and de�ned bene�t pension plans are operated for Group employees. Pension obligations vary, re®ecting the di§erent legal, �scal and economic conditions in each country of operation, and usually depend on employees’ length of service and pay levels. All de�ned contribution plans are funded by the payment of contributions to external insurance companies or funds, whilst de�ned bene�t plans entail the formation of provisions within the Company or investments in funds outside the Company.
223Notes to the consolidated statement of §nancial position N O T E S
German employees enjoy bene�ts from a statutory de�ned contribution plan paying pensions as a function of employees’ income and the contributions paid in. Several additional industry pension organisations exist for companies of the TUI Group. Once the contributions to the state-run pension plans and private pension insurance organisations have been paid, the Company has no further payment obligations. The main private pension fund is MER-Pensionskasse VVaG, organising German travel companies, and Aegon Levensverzekering N.V., operating the de�ned contribution pension plans for the main Dutch subsidiaries of the TUI Group. Contributions paid are expensed for the respective period. In the period under review, the expenses for all de�ned contribution plans totalled € 70.3 m (previous year € 65.9 m).
Apart from these de�ned contribution pension plans, the TUI Group operates de�ned bene�t plans, in particular in Germany and the UK. By far the largest pension plans are operated by the Group’s tour operators in the UK, accounting for a proportion of 74.0 % (previous year 74.1 %) of the Group’s total obligations at the balance sheet date. German plans account for a further 21.6 % (previous year 20.0 %).
In the UK, the following major pension schemes in which pension payments are linked to �nal salary and length of service are operated. The �nal remuneration to be taken into account is capped.
M AT E R I A L D E F I N E D B E N E F I T P L A N S I N G R E AT B R I TA I N
Scheme name Status
Britannia Airways Limited Superannuation and Life Assurance Scheme closed
TUI Pension Scheme (UK) closed
Thomson Airways Pension Scheme closed
Almost all de�ned bene�t plans in the UK are funded externally. Under UK law, the employer is obliged to ensure su¯cient funding so that plan assets cover the pension payments to be made and the administrative costs of the funds. The pension funds are managed by independent trustees. The trustees comprise independent members but also bene�ciaries of the plan and employer representatives. The trustees are responsible for the invest-ment of fund assets, taking account of the interests of plan members, but they also negotiate the level of the con-tributions to the fund to be paid by the employers, which constitute minimum contributions to the fund. To this end, actuarial valuations are made every two years by actuaries commissioned by the trustees. These valuations serve as a basis to determine the annual contributions to be paid to the fund in order to cover any shortfalls in coverage, last de�ned in September 2013. On top of a �xed annual contribution, a certain percentage of the pensionable remuneration of the plan members has to be paid to the scheme. In addition, certain growth criteria have been de�ned, requiring further payments if these criteria are exceeded.
By contrast, the de�ned bene�t plans in Germany are funded by means of provisions. The obligations entail pay-ments of company pensions when the bene�ciaries reach the legal retirement age. The amount of the pension paid usually depends on the remuneration received by the sta§ member at the retirement date. The pension obli-gations regularly also comprise surviving dependants’ bene�ts and invalidity bene�ts.
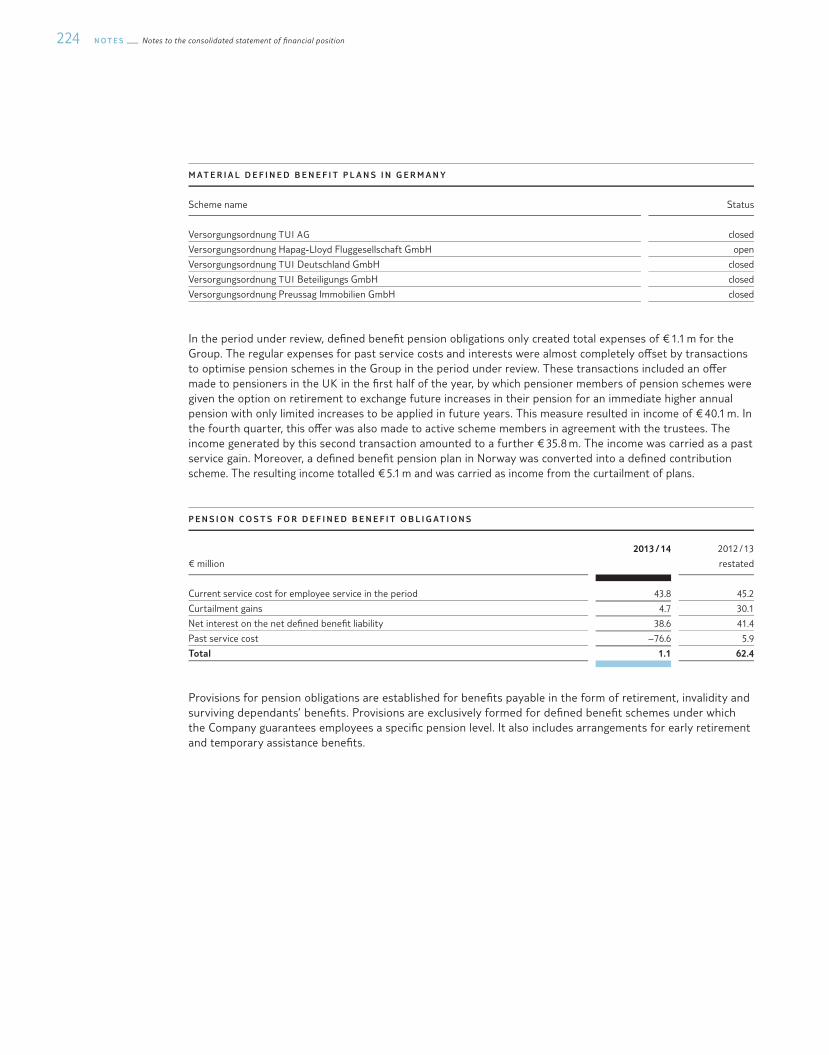
N O T E S Notes to the consolidated statement of §nancial position224
M AT E R I A L D E F I N E D B E N E F I T P L A N S I N G E R M A N Y
Scheme name Status
Versorgungsordnung TUI AG closed
Versorgungsordnung Hapag-Lloyd Fluggesellschaft GmbH open
Versorgungsordnung TUI Deutschland GmbH closed
Versorgungsordnung TUI Beteiligungs GmbH closed
Versorgungsordnung Preussag Immobilien GmbH closed
In the period under review, de�ned bene�t pension obligations only created total expenses of € 1.1 m for the Group. The regular expenses for past service costs and interests were almost completely o§set by transactions to optimise pension schemes in the Group in the period under review. These transactions included an o§er made to pensioners in the UK in the �rst half of the year, by which pensioner members of pension schemes were given the option on retirement to exchange future increases in their pension for an immediate higher annual pension with only limited increases to be applied in future years. This measure resulted in income of € 40.1 m. In the fourth quarter, this o§er was also made to active scheme members in agreement with the trustees. The income generated by this second transaction amounted to a further € 35.8 m. The income was carried as a past service gain. Moreover, a de�ned bene�t pension plan in Norway was converted into a de�ned contribution scheme. The resulting income totalled € 5.1 m and was carried as income from the curtailment of plans.
P E N S I O N C O S T S F O R D E F I N E D B E N E F I T O B L I G AT I O N S
€ million
2013 / 14 2012 / 13
restated
Current service cost for employee service in the period 43.8 45.2
Curtailment gains 4.7 30.1
Net interest on the net de�ned bene�t liability 38.6 41.4
Past service cost – 76.6 5.9
Total 1.1 62.4
Provisions for pension obligations are established for bene�ts payable in the form of retirement, invalidity and surviving dependants’ bene�ts. Provisions are exclusively formed for de�ned bene�t schemes under which the Company guarantees employees a speci�c pension level. It also includes arrangements for early retirement and temporary assistance bene�ts.
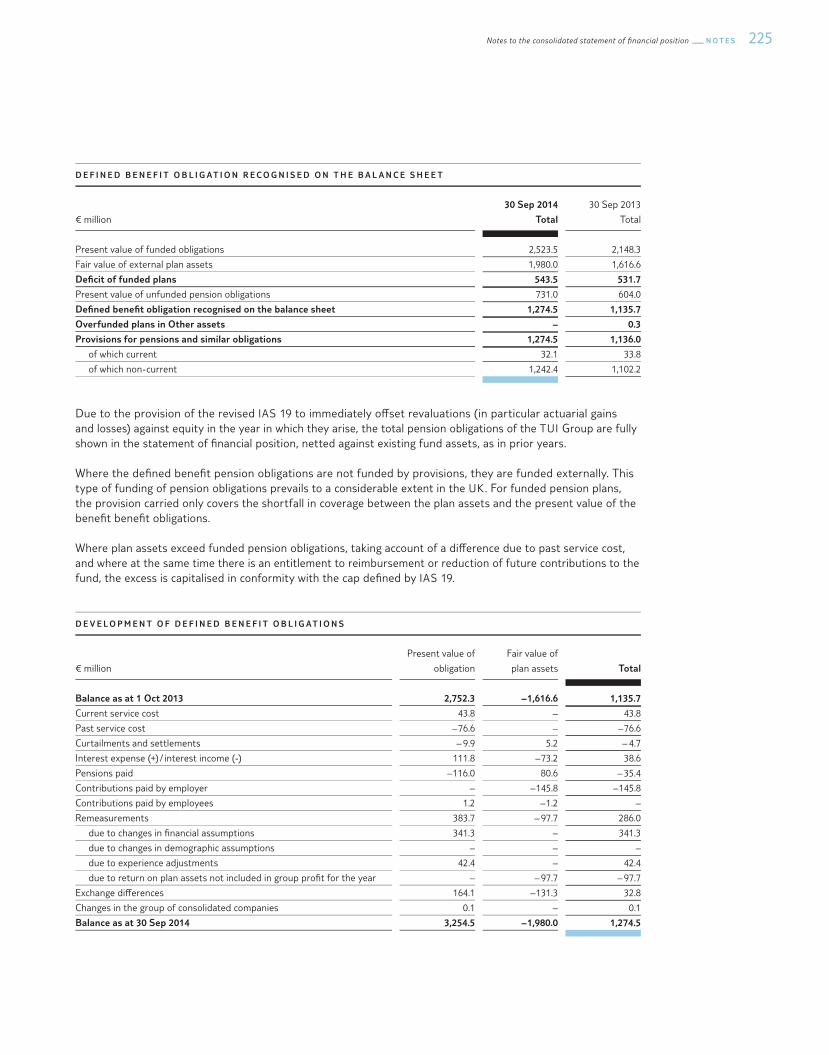
225Notes to the consolidated statement of §nancial position N O T E S
D E F I N E D B E N E F I T O B L I G AT I O N R E C O G N I S E D O N T H E B A L A N C E S H E E T
€ million
30 Sep 2014
Total
30 Sep 2013
Total
Present value of funded obligations 2,523.5 2,148.3
Fair value of external plan assets 1,980.0 1,616.6
De�cit of funded plans 543.5 531.7
Present value of unfunded pension obligations 731.0 604.0
De�ned bene�t obligation recognised on the balance sheet 1,274.5 1,135.7
Overfunded plans in Other assets – 0.3
Provisions for pensions and similar obligations 1,274.5 1,136.0
of which current 32.1 33.8
of which non-current 1,242.4 1,102.2
Due to the provision of the revised IAS 19 to immediately o§set revaluations (in particular actuarial gains and losses) against equity in the year in which they arise, the total pension obligations of the TUI Group are fully shown in the statement of �nancial position, netted against existing fund assets, as in prior years.
Where the de�ned bene�t pension obligations are not funded by provisions, they are funded externally. This type of funding of pension obligations prevails to a considerable extent in the UK. For funded pension plans, the provision carried only covers the shortfall in coverage between the plan assets and the present value of the bene�t bene�t obligations.
Where plan assets exceed funded pension obligations, taking account of a di§erence due to past service cost, and where at the same time there is an entitlement to reimbursement or reduction of future contributions to the fund, the excess is capitalised in conformity with the cap de�ned by IAS 19.
D E V E L O P M E N T O F D E F I N E D B E N E F I T O B L I G AT I O N S
€ million
Present value of
obligation
Fair value of
plan assets Total
Balance as at 1 Oct 2013 2,752.3 – 1,616.6 1,135.7
Current service cost 43.8 – 43.8
Past service cost – 76.6 – – 76.6
Curtailments and settlements – 9.9 5.2 – 4.7
Interest expense (+) / interest income (-) 111.8 – 73.2 38.6
Pensions paid – 116.0 80.6 – 35.4
Contributions paid by employer – – 145.8 – 145.8
Contributions paid by employees 1.2 – 1.2 –
Remeasurements 383.7 – 97.7 286.0
due to changes in �nancial assumptions 341.3 – 341.3
due to changes in demographic assumptions – – –
due to experience adjustments 42.4 – 42.4
due to return on plan assets not included in group pro�t for the year – – 97.7 – 97.7
Exchange di§erences 164.1 – 131.3 32.8
Changes in the group of consolidated companies 0.1 – 0.1
Balance as at 30 Sep 2014 3,254.5 – 1,980.0 1,274.5
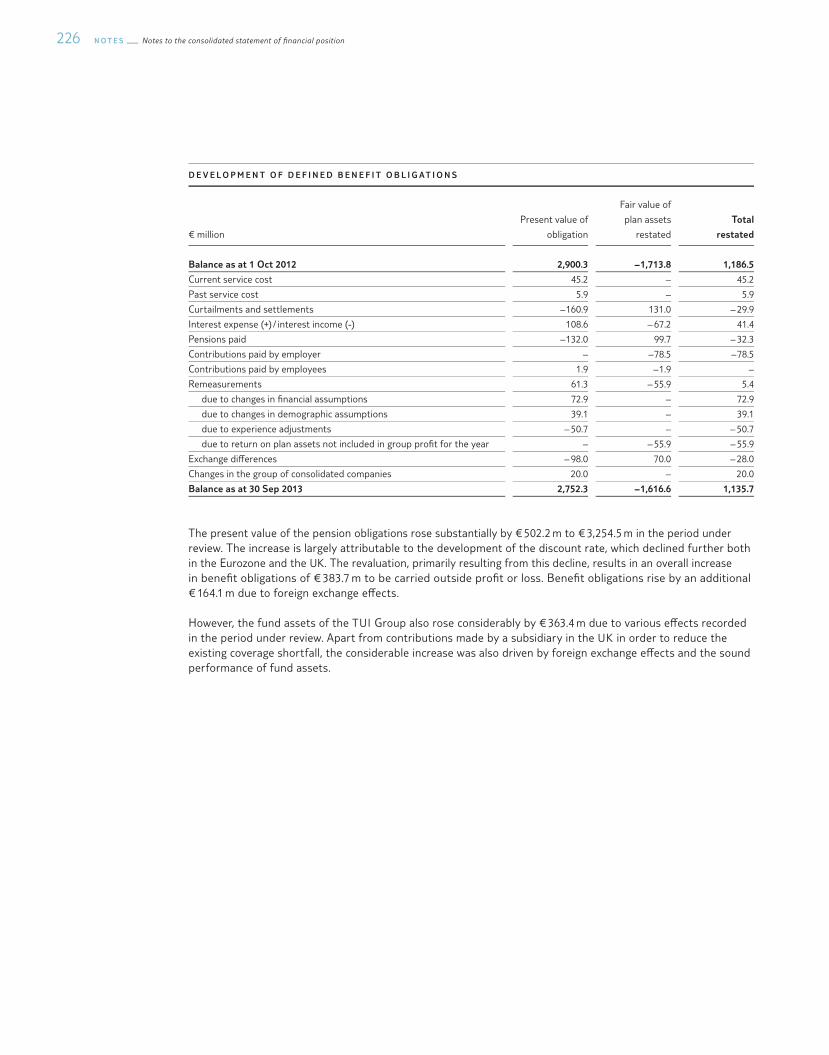
N O T E S Notes to the consolidated statement of §nancial position226
D E V E L O P M E N T O F D E F I N E D B E N E F I T O B L I G AT I O N S
€ million
Present value of
obligation
Fair value of
plan assets
restated
Total
restated
Balance as at 1 Oct 2012 2,900.3 – 1,713.8 1,186.5
Current service cost 45.2 – 45.2
Past service cost 5.9 – 5.9
Curtailments and settlements – 160.9 131.0 – 29.9
Interest expense (+) / interest income (-) 108.6 – 67.2 41.4
Pensions paid – 132.0 99.7 – 32.3
Contributions paid by employer – – 78.5 – 78.5
Contributions paid by employees 1.9 – 1.9 –
Remeasurements 61.3 – 55.9 5.4
due to changes in �nancial assumptions 72.9 – 72.9
due to changes in demographic assumptions 39.1 – 39.1
due to experience adjustments – 50.7 – – 50.7
due to return on plan assets not included in group pro�t for the year – – 55.9 – 55.9
Exchange di§erences – 98.0 70.0 – 28.0
Changes in the group of consolidated companies 20.0 – 20.0
Balance as at 30 Sep 2013 2,752.3 – 1,616.6 1,135.7
The present value of the pension obligations rose substantially by € 502.2 m to € 3,254.5 m in the period under review. The increase is largely attributable to the development of the discount rate, which declined further both in the Eurozone and the UK. The revaluation, primarily resulting from this decline, results in an overall increase in bene�t obligations of € 383.7 m to be carried outside pro�t or loss. Bene�t obligations rise by an additional € 164.1 m due to foreign exchange e§ects.
However, the fund assets of the TUI Group also rose considerably by € 363.4 m due to various e§ects recorded in the period under review. Apart from contributions made by a subsidiary in the UK in order to reduce the existing coverage shortfall, the considerable increase was also driven by foreign exchange e§ects and the sound performance of fund assets.
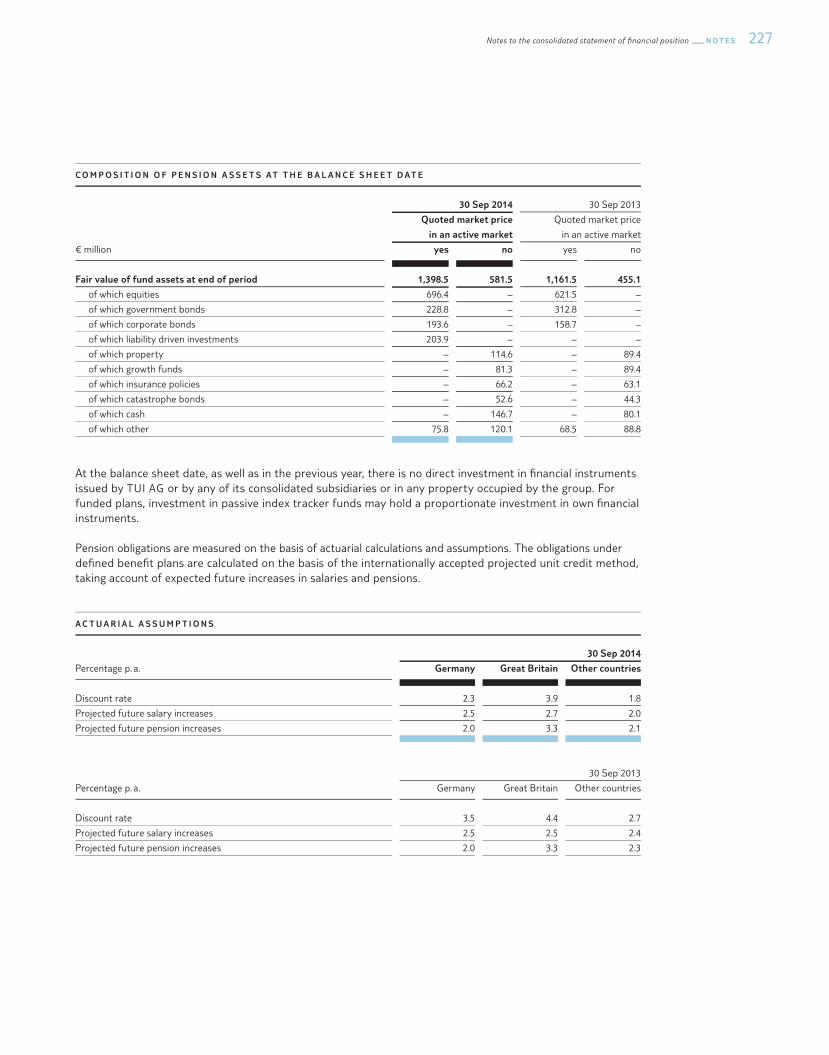
227Notes to the consolidated statement of §nancial position N O T E S
C O M P O S I T I O N O F P E N S I O N A S S E T S AT T H E B A L A N C E S H E E T D AT E
30 Sep 2014 30 Sep 2013
Quoted market price
in an active market
Quoted market price
in an active market
€ million yes no yes no
Fair value of fund assets at end of period 1,398.5 581.5 1,161.5 455.1
of which equities 696.4 – 621.5 –
of which government bonds 228.8 – 312.8 –
of which corporate bonds 193.6 – 158.7 –
of which liability driven investments 203.9 – – –
of which property – 114.6 – 89.4
of which growth funds – 81.3 – 89.4
of which insurance policies – 66.2 – 63.1
of which catastrophe bonds – 52.6 – 44.3
of which cash – 146.7 – 80.1
of which other 75.8 120.1 68.5 88.8
At the balance sheet date, as well as in the previous year, there is no direct investment in �nancial instruments issued by TUI AG or by any of its consolidated subsidiaries or in any property occupied by the group. For funded plans, investment in passive index tracker funds may hold a proportionate investment in own �nancial instruments.
Pension obligations are measured on the basis of actuarial calculations and assumptions. The obligations under de�ned bene�t plans are calculated on the basis of the internationally accepted projected unit credit method, taking account of expected future increases in salaries and pensions.
A C T U A R I A L A S S U M P T I O N S
30 Sep 2014
Percentage p. a. Germany Great Britain Other countries
Discount rate 2.3 3.9 1.8
Projected future salary increases 2.5 2.7 2.0
Projected future pension increases 2.0 3.3 2.1
30 Sep 2013
Percentage p. a. Germany Great Britain Other countries
Discount rate 3.5 4.4 2.7
Projected future salary increases 2.5 2.5 2.4
Projected future pension increases 2.0 3.3 2.3

N O T E S Notes to the consolidated statement of §nancial position228
Determination of the interest rate applicable in discounting the provision for pensions is based on an index for corporate bonds adjusted for securities already downgraded and under observation by rating agencies as well as subordinate bonds in order to meet the criterion for high quality bonds required under IAS 19 (bonds with a rating of AA or higher). In order to cover a correspondingly broad market, an index based on shorter-terms bonds is used (e.g. iBoxx € Corporates AA 7 – 10 for the Eurozone). The resulting yield structure is extrapolated on the basis of the yield curves for almost risk-free bonds, taking account of an appropriate risk mark-up re®ecting the term of the obligation.
Actuarial calculations for companies abroad are based on speci�c parameters for each country concerned.
Apart from the parameters described above, a further key assumption relates to life expectancy. In Germany, the Heubeck reference tables 2005G are used to determine life expectancy. In the UK, the S1NxA base tables are used; they are adjusted to future expected increases on the basis of the CMI 2013. The pension adjustment formulae depend strongly on the pension scheme concerned. Apart from �xed rates of increase, there are also a number of in®ation-linked pension adjustment mechanisms in di§erent countries.
Changes in the key actuarial assumptions mentioned above would lead to the changes in de�ned bene�t obli-gations presented below. The methodology used to determine sensitivity corresponds to the method used to calculate the de�ned bene�t obligation. The assumptions were amended in isolation each time; actual inter-dependencies between the assumptions were not taken into account. The e§ect of the increase in life expectancy by one year is calculated by means of a reduction in mortality due to the use of the Heubeck tables 2005G for pension plans in Germany. In the UK, an extra year is added to the life expectancy determined on the basis of the mortality tables.
S E N S I T I V I T Y O F T H E D E F I N E D B E N E F I T O B L I G AT I O N D U E T O C H A N G E D A C T U A R I A L A S S U M P T I O N S
30 Sep 2014
€ million + 50 Basis points – 50 Basis points
Discount rate – 287.6 + 331.5
Salary increase + 20.0 – 18.7
Pension increase + 96.8 – 78.4
+ 1 year
Life expectancy + 107.7
The weighted average duration of the de�ned bene�t obligations totalled 18.9 years for the overall Group. In the UK, the weighted duration was 20.7 years, while it only stood at 15.8 years in Germany.
Fund assets are determined on the basis of the fair values of the funds invested as at 30 September 2014. The interest rate used to determine the interest income from the assets of external funds is identical with the discount rate used for the de�ned bene�t obligation.
For the forthcoming �nancial year, the companies of the TUI Group are expected to contribute around € 108.8 m to the pension schemes and pay pensions worth € 32.1 m for unfunded plans. For funded schemes, payments to the recipients are fully made from fund assets to that the TUI Group does not record a cash out®ow as a result.
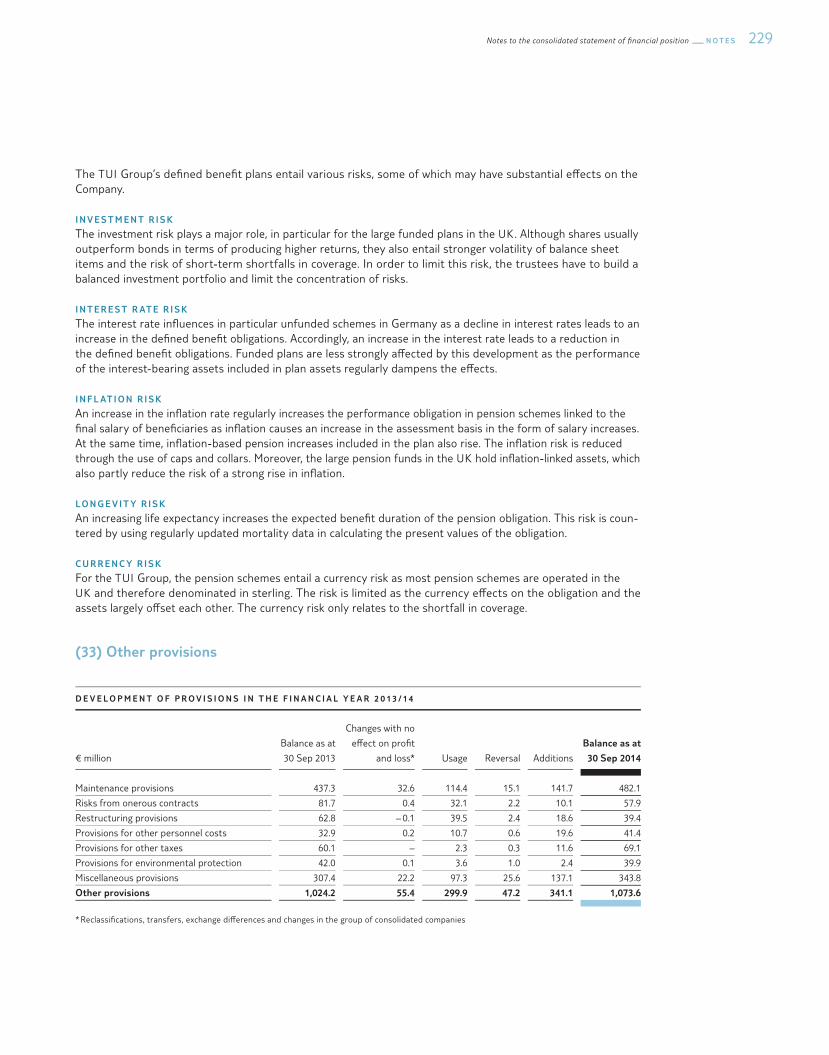
229Notes to the consolidated statement of §nancial position N O T E S
The TUI Group’s de�ned bene�t plans entail various risks, some of which may have substantial e§ects on the Company.
I N V E S T M E N T R I S K
The investment risk plays a major role, in particular for the large funded plans in the UK. Although shares usually outperform bonds in terms of producing higher returns, they also entail stronger volatility of balance sheet items and the risk of short-term shortfalls in coverage. In order to limit this risk, the trustees have to build a balanced investment portfolio and limit the concentration of risks.
I N T E R E S T R AT E R I S K
The interest rate in®uences in particular unfunded schemes in Germany as a decline in interest rates leads to an increase in the de�ned bene�t obligations. Accordingly, an increase in the interest rate leads to a reduction in the de�ned bene�t obligations. Funded plans are less strongly a§ected by this development as the performance of the interest-bearing assets included in plan assets regularly dampens the e§ects.
I N F L AT I O N R I S K
An increase in the in®ation rate regularly increases the performance obligation in pension schemes linked to the �nal salary of bene�ciaries as in®ation causes an increase in the assessment basis in the form of salary increases. At the same time, in®ation-based pension increases included in the plan also rise. The in®ation risk is reduced through the use of caps and collars. Moreover, the large pension funds in the UK hold in®ation-linked assets, which also partly reduce the risk of a strong rise in in®ation.
L O N G E V I T Y R I S K
An increasing life expectancy increases the expected bene�t duration of the pension obligation. This risk is coun-tered by using regularly updated mortality data in calculating the present values of the obligation.
C U R R E N C Y R I S K
For the TUI Group, the pension schemes entail a currency risk as most pension schemes are operated in the UK and therefore denominated in sterling. The risk is limited as the currency e§ects on the obligation and the assets largely o§set each other. The currency risk only relates to the shortfall in coverage.
(33) Other provisions
D E V E L O P M E N T O F P R O V I S I O N S I N T H E F I N A N C I A L Y E A R 2 0 13 / 1 4
€ million
Balance as at
30 Sep 2013
Changes with no
e§ect on pro�t
and loss* Usage Reversal Additions
Balance as at
30 Sep 2014
Maintenance provisions 437.3 32.6 114.4 15.1 141.7 482.1
Risks from onerous contracts 81.7 0.4 32.1 2.2 10.1 57.9
Restructuring provisions 62.8 – 0.1 39.5 2.4 18.6 39.4
Provisions for other personnel costs 32.9 0.2 10.7 0.6 19.6 41.4
Provisions for other taxes 60.1 – 2.3 0.3 11.6 69.1
Provisions for environmental protection 42.0 0.1 3.6 1.0 2.4 39.9
Miscellaneous provisions 307.4 22.2 97.3 25.6 137.1 343.8
Other provisions 1,024.2 55.4 299.9 47.2 341.1 1,073.6
* Reclassi�cations, transfers, exchange di§erences and changes in the group of consolidated companies
N O T E S Notes to the consolidated statement of §nancial position230
O T H E R P R OV I S I O N S
Provisions for external maintenance primarily relate to contractual maintenance, overhaul and repair requirements for aircraft, engines and speci�c components from aircraft charter contracts. The measurement of these pro-visions is based on the expected cost of the next maintenance event, estimated on the basis of current prices, expected price increases and manufacturers’ data sheets. In line with the arrangements of the individual con-tracts and the aircraft model concerned, additions are e§ected on a prorated basis in relation to ®ight hours, the number of ®ights or the length of the complete maintenance cycle.
Provisions for onerous losses decreased in the current �nancial year, above all due to the intended use of these provisions.
The restructuring provisions relate, in particular, to restructuring projects in the TUI Travel Sector for subsidiaries in France and Germany for which detailed, formal restructuring plans were drawn up and communicated to the parties concerned. The restructuring provisions carried at the balance sheet date of € 39.4 m (previous year € 62.8 m) largely relate to bene�ts for employees in connection with the termination of employment contracts.
Provisions for personnel costs comprise provisions for jubilee bene�ts as well as provisions for share-based payment schemes with cash compensation in accordance with IFRS 2. Information on these long-term incentive programmes is presented under Note 43 in the chapter on Share-based payments in accordance with IFRS 2.
The provisions for environmental protection measures primarily relate to public-law obligations to remediate sites contaminated with legacy waste from former mining and metallurgical activities. Estimating the future cost of remediating contaminated sites entails many uncertainties, which may also impact the amount of provisions. The measurement is based on assumptions about future costs derived from empirical values, conclusions from environmental expert reports and the legal assessment of the Group as well as the expected duration of the remediation measures. Unwinding these obligations under environmental law takes a long time and constitutes a technically complex process. Accordingly, there are considerable uncertainties about the actual timeframe and the speci�c amount of expenses required so that actual costs may exceed the provisions carried.
Where the di§erence between the present value and the settlement value of a provision is material for the meas-urement of a non-current provision as at the balance sheet date, the provision has to be recognised at its present value in accordance with IAS 37. The discount rate to be applied should take account of the speci�c risks of the provision and of future price increases. This criterion applies to some items contained in the TUI Group’s other provisions. Additions to other provisions comprise an interest portion of € 5.9 m (previous year € 5.2 m), recog-nised as interest expenses.
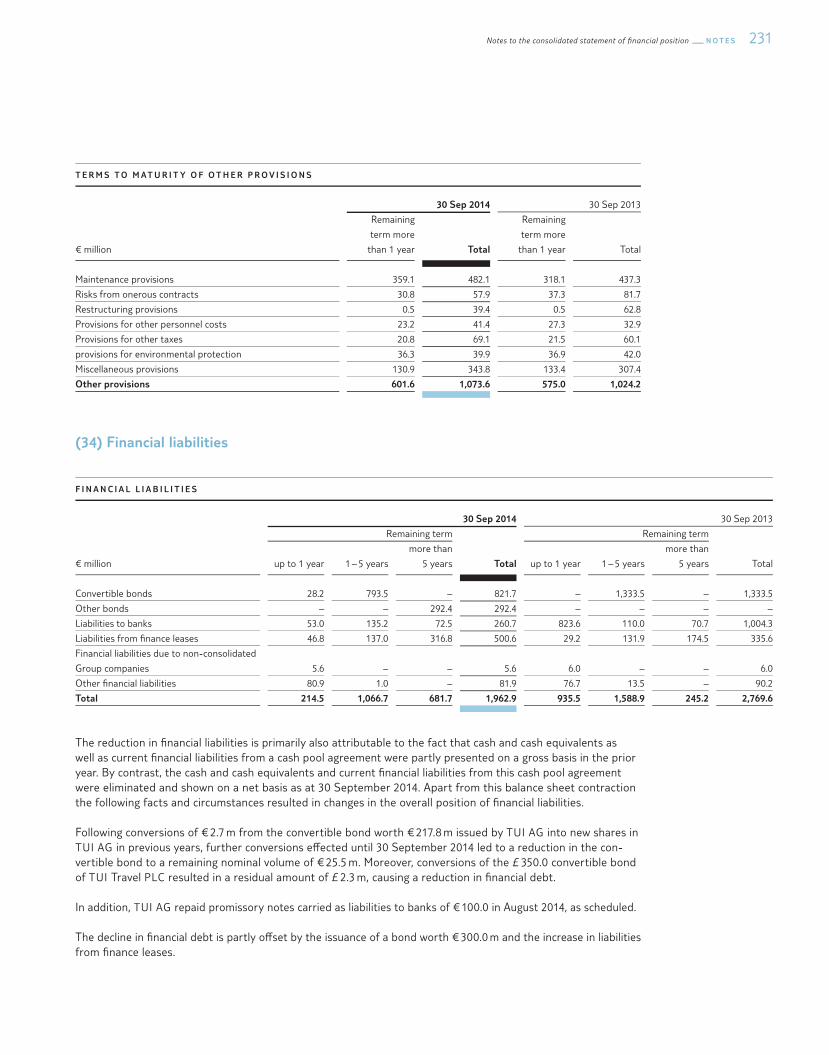
231Notes to the consolidated statement of §nancial position N O T E S
T E R M S T O M AT U R I T Y O F O T H E R P R O V I S I O N S
30 Sep 2014 30 Sep 2013
€ million
Remaining
term more
than 1 year Total
Remaining
term more
than 1 year Total
Maintenance provisions 359.1 482.1 318.1 437.3
Risks from onerous contracts 30.8 57.9 37.3 81.7
Restructuring provisions 0.5 39.4 0.5 62.8
Provisions for other personnel costs 23.2 41.4 27.3 32.9
Provisions for other taxes 20.8 69.1 21.5 60.1
provisions for environmental protection 36.3 39.9 36.9 42.0
Miscellaneous provisions 130.9 343.8 133.4 307.4
Other provisions 601.6 1,073.6 575.0 1,024.2
(34) Financial liabilities
F I N A N C I A L L I A B I L I T I E S
30 Sep 2014 30 Sep 2013
Remaining term Remaining term
€ million up to 1 year 1 – 5 years
more than
5 years Total up to 1 year 1 – 5 years
more than
5 years Total
Convertible bonds 28.2 793.5 – 821.7 – 1,333.5 – 1,333.5
Other bonds – – 292.4 292.4 – – – –
Liabilities to banks 53.0 135.2 72.5 260.7 823.6 110.0 70.7 1,004.3
Liabilities from �nance leases 46.8 137.0 316.8 500.6 29.2 131.9 174.5 335.6
Financial liabilities due to non-consolidated
Group companies 5.6 – – 5.6 6.0 – – 6.0
Other �nancial liabilities 80.9 1.0 – 81.9 76.7 13.5 – 90.2
Total 214.5 1,066.7 681.7 1,962.9 935.5 1,588.9 245.2 2,769.6
The reduction in �nancial liabilities is primarily also attributable to the fact that cash and cash equivalents as well as current �nancial liabilities from a cash pool agreement were partly presented on a gross basis in the prior year. By contrast, the cash and cash equivalents and current �nancial liabilities from this cash pool agreement were eliminated and shown on a net basis as at 30 September 2014. Apart from this balance sheet contraction the following facts and circumstances resulted in changes in the overall position of �nancial liabilities.
Following conversions of € 2.7 m from the convertible bond worth € 217.8 m issued by TUI AG into new shares in TUI AG in previous years, further conversions e§ected until 30 September 2014 led to a reduction in the con-vertible bond to a remaining nominal volume of € 25.5 m. Moreover, conversions of the £ 350.0 convertible bond of TUI Travel PLC resulted in a residual amount of £ 2.3 m, causing a reduction in �nancial debt.
In addition, TUI AG repaid promissory notes carried as liabilities to banks of € 100.0 in August 2014, as scheduled.
The decline in �nancial debt is partly o§set by the issuance of a bond worth € 300.0 m and the increase in liabilities from �nance leases.

N O T E S Notes to the consolidated statement of §nancial position232
F A I R V A L U E S A N D C A R R Y I N G A M O U N T S O F T H E B O N D S I S S U E D ( 3 0 S E P 2 0 1 4 )
30 Sep 2014 30 Sep 2013
€ million Issuer
Volume
initial
Volume
outstanding
Interest rate
% p. a.
Stock
market
value
Carrying
amount
Stock
market
value
Carrying
amount
convertible
bond 2009 / 14 TUI AG 217.8 25.5 5.500 54.3 25.2 371.5 196.0
convertible
bond 2011 / 16 TUI AG 339.0 338.9 2.750 388.7 317.1 360.4 303.6
bond 2014 / 19 TUI AG 300.0 300.0 4.500 306.0 292.4 – –
convertible
bond 2009 / 14 TUI Travel PLC GBP 350.0 GBP 2.3 6.000 GBP 2.3 3.0 GBP 404.2 402.2
convertible
bond 2010 / 17 TUI Travel PLC GBP 400.0 GBP 400.0 4.900 GBP 474.4 476.4 GBP 475.0 431.7
Total 1,114.1 1,333.5
hybrid capital
2005 / -- TUI AG 300.0 300.0
3M EURIBOR
plus 7.300 308.2 294.8 303.8 294.8
On 17 November 2009, TUI AG issued a �ve-year convertible bond worth € 217.8 m. This bond carries a �xed- interest coupon of 5.5 % per annum. It was issued in denominations of € 56.30. The current conversion price is € 5.5645 per no-par value share. The nominal volume outstanding as per the reporting date totalled € 25.5 m.
A second convertible bond was issued on 24 March 2011 by TUI AG with a nominal value of € 339.0 m. The bond carries a �xed-interest coupon of 2.75 % per annum and will mature on 24 March 2016. It was issued in denominations of € 59.26. The current conversion price is € 11.7127 per share.
On 26 September 2014, TUI AG issued a �xed-interest bond with a coupon of 4.5 % p. a. with a nominal volume of € 300.0 m. The bond was issued in denominations of € 100,000 each. It will mature on 1 October 2019.
On 1 October 2009, TUI Travel PLC issued a convertible bond with a nominal value of £ 350.0 m with a �xed- interest coupon of 6.0 % per annum and a conversion price of £ 3.493 per no-par value share. It will mature in October 2014. The bond was issued in denominations of £ 100,000. Following the end of the conversion period, the outstanding volume of the bond as at 30 September 2014 is £ 2.3 m.
On 22 April 2010, TUI Travel PLC issued another convertible bond. It has a nominal volume of £ 400.0 m and denominations of £ 100,000. At a �xed-interest coupon of 4.9 %, it will mature in April 2017. The conversion price of £ 3.8234 per share remains valid.
The debt component of the convertible bonds was carried at present value upon issuance, taking account of an interest rate in line with market rates, and is increased by the interest portion for the period at every balance sheet date in accordance with the internationally customary e§ective interest method.
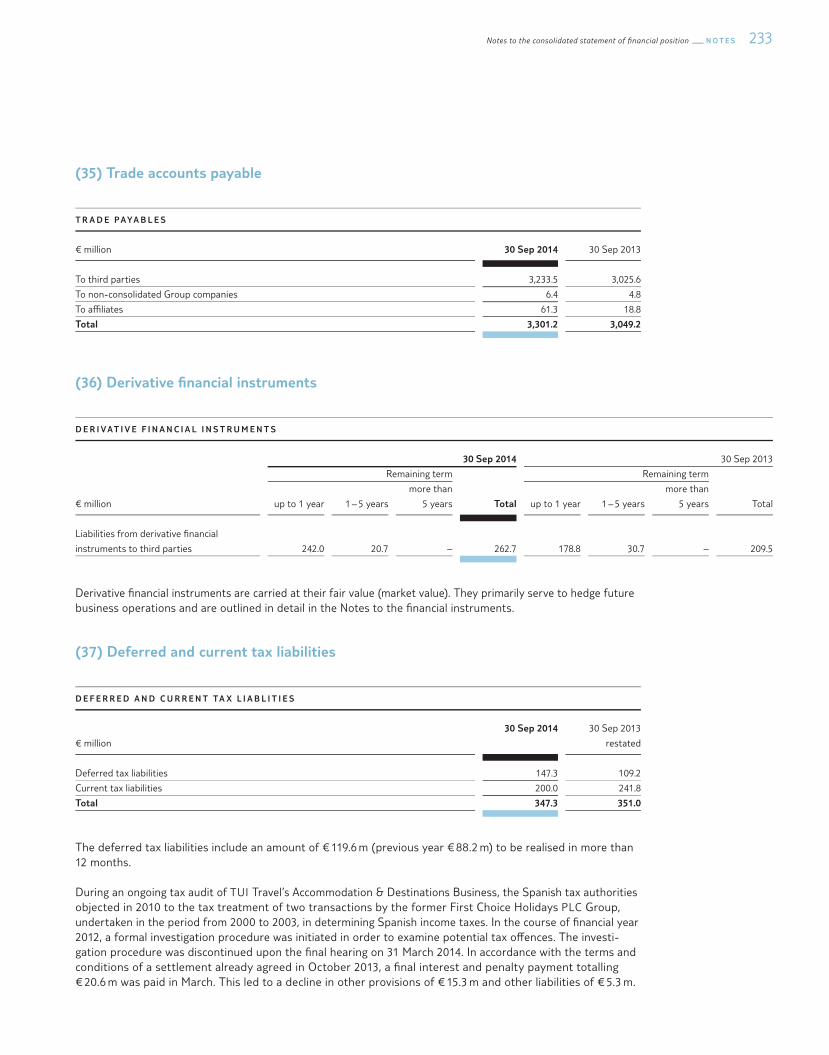
233Notes to the consolidated statement of §nancial position N O T E S
(35) Trade accounts payable
T R A D E P AYA B L E S
€ million 30 Sep 2014 30 Sep 2013
To third parties 3,233.5 3,025.6
To non-consolidated Group companies 6.4 4.8
To a¯liates 61.3 18.8
Total 3,301.2 3,049.2
(36) Derivative �nancial instruments
D E R I V AT I V E F I N A N C I A L I N S T R U M E N T S
30 Sep 2014 30 Sep 2013
Remaining term Remaining term
€ million up to 1 year 1 – 5 years
more than
5 years Total up to 1 year 1 – 5 years
more than
5 years Total
Liabilities from derivative �nancial
instruments to third parties 242.0 20.7 – 262.7 178.8 30.7 – 209.5
Derivative �nancial instruments are carried at their fair value (market value). They primarily serve to hedge future business operations and are outlined in detail in the Notes to the �nancial instruments.
(37) Deferred and current tax liabilities
D E F E R R E D A N D C U R R E N T TA X L I A B L I T I E S
€ million
30 Sep 2014 30 Sep 2013
restated
Deferred tax liabilities 147.3 109.2
Current tax liabilities 200.0 241.8
Total 347.3 351.0
The deferred tax liabilities include an amount of € 119.6 m (previous year € 88.2 m) to be realised in more than 12 months.
During an ongoing tax audit of TUI Travel’s Accommodation & Destinations Business, the Spanish tax authorities objected in 2010 to the tax treatment of two transactions by the former First Choice Holidays PLC Group, undertaken in the period from 2000 to 2003, in determining Spanish income taxes. In the course of �nancial year 2012, a formal investigation procedure was initiated in order to examine potential tax o§ences. The investi-gation procedure was discontinued upon the �nal hearing on 31 March 2014. In accordance with the terms and conditions of a settlement already agreed in October 2013, a �nal interest and penalty payment totalling € 20.6 m was paid in March. This led to a decline in other provisions of € 15.3 m and other liabilities of € 5.3 m.
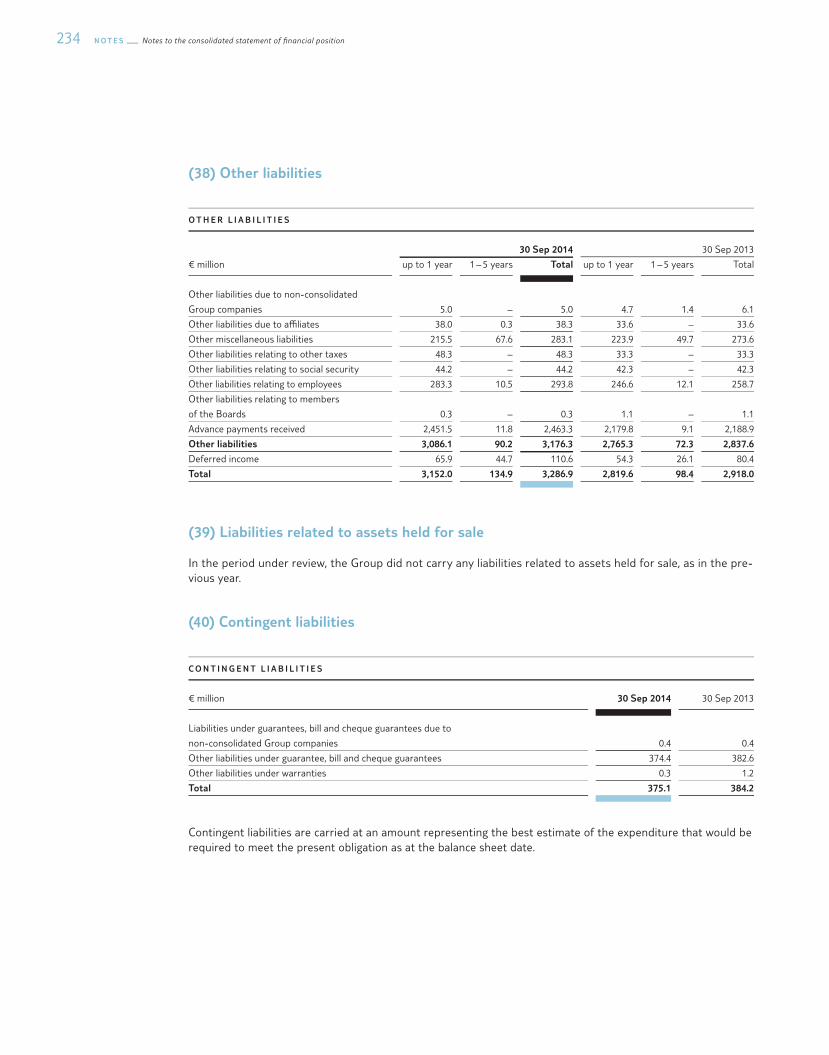
N O T E S Notes to the consolidated statement of §nancial position234
(38) Other liabilities
O T H E R L I A B I L I T I E S
30 Sep 2014 30 Sep 2013
€ million up to 1 year 1 – 5 years Total up to 1 year 1 – 5 years Total
Other liabilities due to non-consolidated
Group companies 5.0 – 5.0 4.7 1.4 6.1
Other liabilities due to a¯liates 38.0 0.3 38.3 33.6 – 33.6
Other miscellaneous liabilities 215.5 67.6 283.1 223.9 49.7 273.6
Other liabilities relating to other taxes 48.3 – 48.3 33.3 – 33.3
Other liabilities relating to social security 44.2 – 44.2 42.3 – 42.3
Other liabilities relating to employees 283.3 10.5 293.8 246.6 12.1 258.7
Other liabilities relating to members
of the Boards 0.3 – 0.3 1.1 – 1.1
Advance payments received 2,451.5 11.8 2,463.3 2,179.8 9.1 2,188.9
Other liabilities 3,086.1 90.2 3,176.3 2,765.3 72.3 2,837.6
Deferred income 65.9 44.7 110.6 54.3 26.1 80.4
Total 3,152.0 134.9 3,286.9 2,819.6 98.4 2,918.0
(39) Liabilities related to assets held for sale
In the period under review, the Group did not carry any liabilities related to assets held for sale, as in the pre-vious year.
(40) Contingent liabilities
C O N T I N G E N T L I A B I L I T I E S
€ million 30 Sep 2014 30 Sep 2013
Liabilities under guarantees, bill and cheque guarantees due to
non-consolidated Group companies 0.4 0.4
Other liabilities under guarantee, bill and cheque guarantees 374.4 382.6
Other liabilities under warranties 0.3 1.2
Total 375.1 384.2
Contingent liabilities are carried at an amount representing the best estimate of the expenditure that would be required to meet the present obligation as at the balance sheet date.

235Notes to the consolidated statement of §nancial position N O T E S
Liabilities under warranties are all contractual liabilities to third parties not to be classi�ed as guarantees and going beyond the typical scope of the business and the industry.
Contingent liabilities as at 30 September 2014 are above all attributable to the granting of guarantees for the bene�t of Hapag-Lloyd AG and TUI Cruises GmbH for collateralised ship �nancing schemes.
In the course of �nancial year 2011 / 12, the German tax administration issued a decree on the interpretation of the trade tax rate, changed with e§ect from �nancial year 2008. This decree, only binding for the tax adminis-tration, may be interpreted as indicating that expenses of German tour operators for the purchase of hotel beds are not fully deductible in determining the basis for the assessment of trade tax. In 2013 the tax administration clari�ed its view and informed TUI of its opinion that the rules of the decree are applicable to tourism activities of tour operators in Germany. TUI does not share that view, in particular as hotel purchasing contracts are mixed contracts also covering catering, cleaning, entertaining guests and other services characterising the pur-chased service.
As the Group has concluded many di§erent contracts to purchase the same service, quantifying this risk in the event the tax administration enforces its view entails a strong element of uncertainty. As a result, there is a broad range of potential outcomes. Should TUI enforce its own legal interpretation, there is no risk.
Should TUI fail to do so, a risk of around € 113 m (previous year € 96 m) might arise for the period since 2008.
(41) Litigation
Neither TUI AG nor any of its subsidiaries have been involved in pending or foreseeable court or arbitration pro-ceedings which might have a signi�cant impact on their economic position as at 30 September 2014. This also applies to actions claiming warranty, repayment or any other compensation brought forward in connection with the divestment of subsidiaries and businesses over the past few years.
In 1999, the operator of the container terminal in Zeebrugge in Belgium �led an action for damages against CP Ships Ltd. – still part of TUI AG – and several of its subsidiaries due to an alleged breach of contract in con-nection with switching the Belgian port of call from Zeebrugge to Antwerp. Following �rst oral proceedings in September 2013, the court ruled against two subsidiaries of CP Ships Ltd in October 2013 and dismissed the action against all other defendants (including CP Ships Ltd.). Both parties have appealed so that the action is now only pending against the two subsidiaries of CP Ships LTD and CP Ships Ltd. itself. Moreover, the CP Ships companies would have rights of recourse against solvent third parties in the event of a �nal judgment.
As in previous years, the respective Group companies formed adequate provisions, partly covered by expected insurance bene�ts, to cover all potential �nancial charges from court or arbitration proceedings. Overall, the future �nancial position is therefore unlikely to be substantially a§ected by such charges.
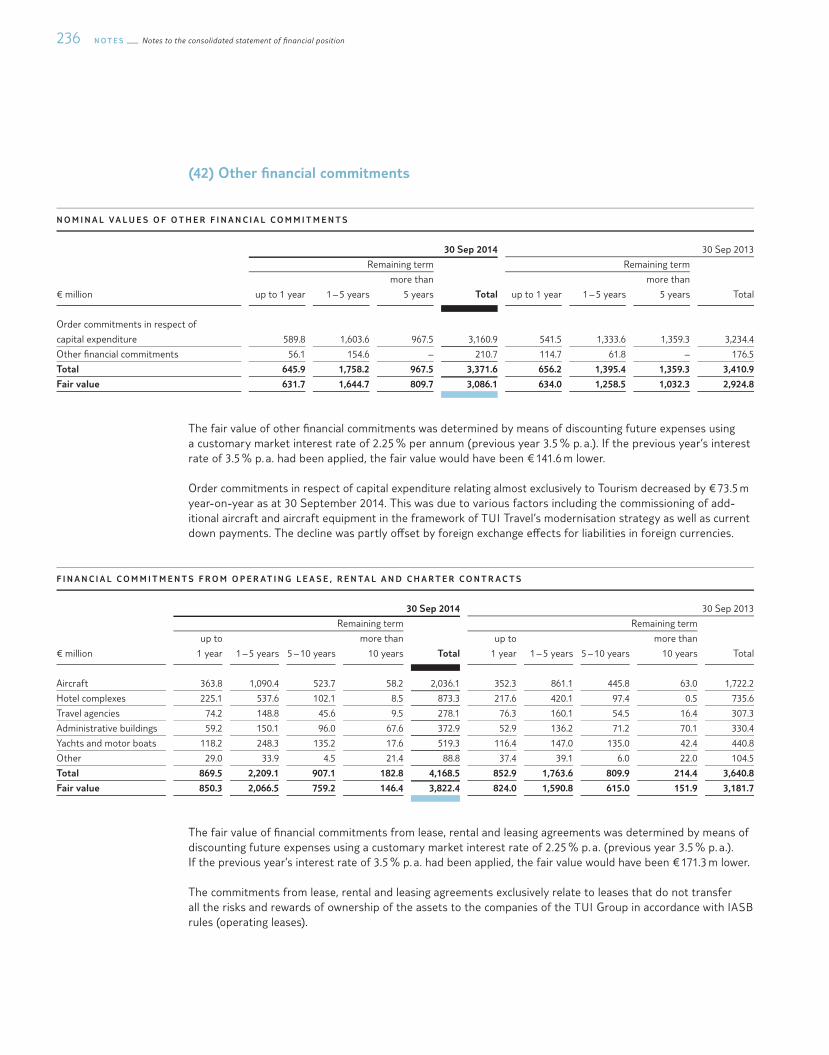
N O T E S Notes to the consolidated statement of §nancial position236
(42) Other �nancial commitments
N O M I N A L V A L U E S O F O T H E R F I N A N C I A L C O M M I T M E N T S
30 Sep 2014 30 Sep 2013
Remaining term Remaining term
€ million up to 1 year 1 – 5 years
more than
5 years Total up to 1 year 1 – 5 years
more than
5 years Total
Order commitments in respect of
capital expenditure 589.8 1,603.6 967.5 3,160.9 541.5 1,333.6 1,359.3 3,234.4
Other �nancial commitments 56.1 154.6 – 210.7 114.7 61.8 – 176.5
Total 645.9 1,758.2 967.5 3,371.6 656.2 1,395.4 1,359.3 3,410.9
Fair value 631.7 1,644.7 809.7 3,086.1 634.0 1,258.5 1,032.3 2,924.8
The fair value of other �nancial commitments was determined by means of discounting future expenses using a customary market interest rate of 2.25 % per annum (previous year 3.5 % p. a.). If the previous year’s interest rate of 3.5 % p. a. had been applied, the fair value would have been € 141.6 m lower.
Order commitments in respect of capital expenditure relating almost exclusively to Tourism decreased by € 73.5 m year-on-year as at 30 September 2014. This was due to various factors including the commissioning of add-itional aircraft and aircraft equipment in the framework of TUI Travel’s modernisation strategy as well as current down payments. The decline was partly o§set by foreign exchange e§ects for liabilities in foreign currencies.
F I N A N C I A L C O M M I T M E N T S F R O M O P E R AT I N G L E A S E , R E N TA L A N D C H A R T E R C O N T R A C T S
30 Sep 2014 30 Sep 2013
Remaining term Remaining term
€ million
up to
1 year 1 – 5 years 5 – 10 years
more than
10 years Total
up to
1 year 1 – 5 years 5 – 10 years
more than
10 years Total
Aircraft 363.8 1,090.4 523.7 58.2 2,036.1 352.3 861.1 445.8 63.0 1,722.2
Hotel complexes 225.1 537.6 102.1 8.5 873.3 217.6 420.1 97.4 0.5 735.6
Travel agencies 74.2 148.8 45.6 9.5 278.1 76.3 160.1 54.5 16.4 307.3
Administrative buildings 59.2 150.1 96.0 67.6 372.9 52.9 136.2 71.2 70.1 330.4
Yachts and motor boats 118.2 248.3 135.2 17.6 519.3 116.4 147.0 135.0 42.4 440.8
Other 29.0 33.9 4.5 21.4 88.8 37.4 39.1 6.0 22.0 104.5
Total 869.5 2,209.1 907.1 182.8 4,168.5 852.9 1,763.6 809.9 214.4 3,640.8
Fair value 850.3 2,066.5 759.2 146.4 3,822.4 824.0 1,590.8 615.0 151.9 3,181.7
The fair value of �nancial commitments from lease, rental and leasing agreements was determined by means of discounting future expenses using a customary market interest rate of 2.25 % p. a. (previous year 3.5 % p. a.). If the previous year’s interest rate of 3.5 % p. a. had been applied, the fair value would have been € 171.3 m lower.
The commitments from lease, rental and leasing agreements exclusively relate to leases that do not transfer all the risks and rewards of ownership of the assets to the companies of the TUI Group in accordance with IASB rules (operating leases).

237Notes to the consolidated statement of §nancial position N O T E S
As a rule, operating leases for aircraft do not include a purchase option. Current lease payments usually do not include any maintenance costs. The basic lease term is usually around 5 years on average.
The increase in commitments as against 30 September 2013 results above all from the commissioning of several aircraft and extensions of contracts for hotels and cruise ships in the TUI Travel Sector.
(43) Share-based payments in accordance with IFRS 2
M U LT I - A N N UA L B O N U S PAY M E N T
The long-term incentive programme for Board members is based on phantom shares and has a general term of four years. All Board members have their individual target amount �xed in their service contract; it is translated annually into phantom shares on the basis of the average price of TUI AG shares. The average share price is determined on the basis of the twenty days prior to the beginning of any �nancial year. The entitlement under the long-term incentive programme arises upon completion of the four-year performance period, and this occurred for the �rst time following the completion of �nancial year 2012 / 13.
Upon the completion of the four-year period, the degree of target achievement is determined by comparing the change in total shareholder return (TSR) at TUI AG with the change in the Dow Jones Stoxx 600 Travel & Leisure index. If the degree of target achievement is less than 25 % of the reference value, no phantom shares are granted. If the degree of target achievement exceeds 25 %, it is multiplied by the number of phantom stocks granted; however, a cap of 175 % applies. At the end of the four-year performance period, the number of phantom stocks determined in this way is multiplied by the average price of TUI AG shares (20 trading days), and the resulting amount is paid out in cash. The maximum amount payable under the long-term incentive pro-gramme has been capped for each individual.
If the condition mentioned above is met and upon expiry of the performance period, the awards are automat-ically exercised. If the conditions are not met, the awards are forfeited. For individual plan participants, the lock-up period will be restricted to the period until the end of the service relationship if they leave the Company.
The fair value of the phantom stocks granted in the completed �nancial year is carried as remuneration for the current �nancial year based on a degree of target achievement of 100 %.
S TO C K O P T I O N P L A N
Bonuses are granted to Group executives entitled to receive a bonus; the bonuses are also translated into phantom shares in TUI AG on the basis of an average share price. For Executive Board members, the stock option plan was terminated upon the introduction of the multi-annual bonus.
The phantom shares are calculated on the basis of Group earnings before taxes and amortisation of goodwill (underlying EBTA). The translation into phantom stocks is based on the average stock price of the TUI share on the 20 trading days following the Supervisory Board meeting at which the annual �nancial statements are ap-proved. The number of phantom stocks granted in a �nancial year is therefore only determined in the subsequent year. Following a lock-up period of two years, the individual bene�ciaries are free to exercise their right to cash payment from this bonus within three years. Following signi�cant corporate news, the entitlements have to be exercised within de�ned timeframes. The lock-up period is not applicable if a bene�ciary leaves the Com-pany; in that case, the entitlements have to be exercised in the next time window. The level of the cash payment depends on the average stock price of the TUI share over a period of 20 trading days after the exercise date. There are no absolute or relative return or stock price targets. A cap has been agreed for exceptional, unforeseen developments. Since the strike price is € 0 and the incentive programme does not entail a vesting period, the fair value corresponds to the intrinsic value and hence the market price at the balance sheet date. Accordingly, the fair value of the obligation is determined by multiplying the number of phantom shares with the stock price at the respective reporting date.
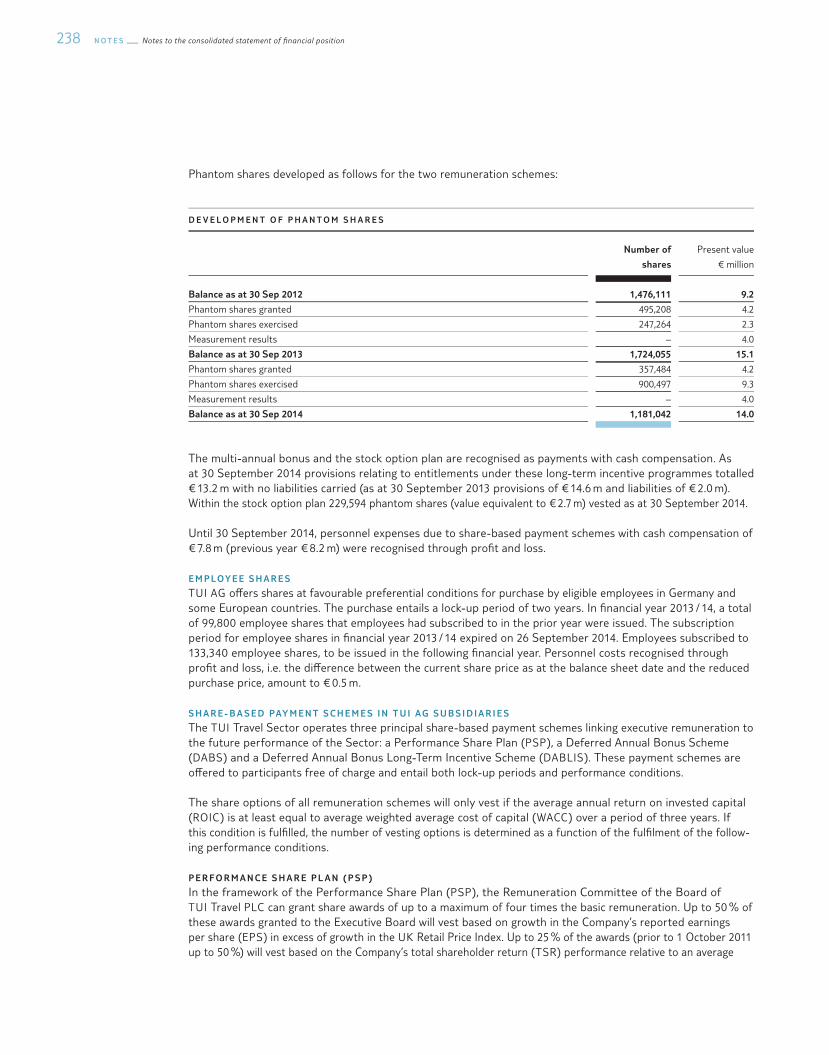
N O T E S Notes to the consolidated statement of §nancial position238
Phantom shares developed as follows for the two remuneration schemes:
D E V E L O P M E N T O F P H A N T O M S H A R E S
Number of
shares
Present value
€ million
Balance as at 30 Sep 2012 1,476,111 9.2
Phantom shares granted 495,208 4.2
Phantom shares exercised 247,264 2.3
Measurement results – 4.0
Balance as at 30 Sep 2013 1,724,055 15.1
Phantom shares granted 357,484 4.2
Phantom shares exercised 900,497 9.3
Measurement results – 4.0
Balance as at 30 Sep 2014 1,181,042 14.0
The multi-annual bonus and the stock option plan are recognised as payments with cash compensation. As at 30 September 2014 provisions relating to entitlements under these long-term incentive programmes totalled € 13.2 m with no liabilities carried (as at 30 September 2013 provisions of € 14.6 m and liabilities of € 2.0 m). Within the stock option plan 229,594 phantom shares (value equivalent to € 2.7 m) vested as at 30 September 2014.
Until 30 September 2014, personnel expenses due to share-based payment schemes with cash compensation of € 7.8 m (previous year € 8.2 m) were recognised through pro�t and loss.
E M P L OY E E S H A R E S
TUI AG o§ers shares at favourable preferential conditions for purchase by eligible employees in Germany and some European countries. The purchase entails a lock-up period of two years. In �nancial year 2013 / 14, a total of 99,800 employee shares that employees had subscribed to in the prior year were issued. The subscription period for employee shares in �nancial year 2013 / 14 expired on 26 September 2014. Employees subscribed to 133,340 employee shares, to be issued in the following �nancial year. Personnel costs recognised through pro�t and loss, i.e. the di§erence between the current share price as at the balance sheet date and the reduced purchase price, amount to € 0.5 m.
S H A R E - B A S E D PAY M E N T S C H E M E S I N T U I AG S U B S I D I A R I E S
The TUI Travel Sector operates three principal share-based payment schemes linking executive remuneration to the future performance of the Sector: a Performance Share Plan (PSP), a Deferred Annual Bonus Scheme (DABS) and a Deferred Annual Bonus Long-Term Incentive Scheme (DABLIS). These payment schemes are o§ered to participants free of charge and entail both lock-up periods and performance conditions.
The share options of all remuneration schemes will only vest if the average annual return on invested capital (ROIC) is at least equal to average weighted average cost of capital (WACC) over a period of three years. If this condition is ful�lled, the number of vesting options is determined as a function of the ful�lment of the follow-ing performance conditions.
P E R F O R M A N C E S H A R E P L A N ( P S P )
In the framework of the Performance Share Plan (PSP), the Remuneration Committee of the Board of TUI Travel PLC can grant share awards of up to a maximum of four times the basic remuneration. Up to 50 % of these awards granted to the Executive Board will vest based on growth in the Company’s reported earnings per share (EPS) in excess of growth in the UK Retail Price Index. Up to 25 % of the awards (prior to 1 October 2011 up to 50 %) will vest based on the Company’s total shareholder return (TSR) performance relative to an average
239Notes to the consolidated statement of §nancial position N O T E S
of the TSR performance of an index of other capital market-oriented travel and tourism companies. Likewise, up to 25 % of the awards vest if the Company’s average return on invested capital (ROIC) meets prede�ned targets.
D E F E R R E D A N N UA L B O N U S S C H E M E ( DA B S )
Under the Deferred Annual Bonus Scheme (DABS), half the annual variable compensation of the Executive Board members is deferred into share-based awards. Matching awards may be o§ered as additional bonuses by the Remuneration Committee of the Board of TUI Travel PLC. Matching awards are limited to four times the deferred amount. The awards granted under this scheme vest upon completion of a three-year period at the earliest.
Up to 50 % of the granted awards (prior to 1 October 2011 up to 75 %) will vest based on growth in earnings per share (EPS) relative to the UK Retail Price Index (RPI). 25 % of the awards will vest based on total shareholder return (TSR) performance relative to the TSR performance of other capital market-oriented travel and tourism companies. Likewise, up to 25 % of the awards will vest if the average return on invested capital (ROIC) meets certain targets.
D E F E R R E D A N N UA L B O N U S L O N G -T E R M I N C E N T I V E S C H E M E ( DA B L I S )
The Deferred Annual Bonus Long-Term Incentive Scheme (DABLIS) is for executive sta§ (except for the Executive Board) and requires a 25 % deferral of any annual variable compensation into shares. The Remuneration Com-mittee of the Board of TUI Travel PLC may grant further share awards as additional bonuses. Matching shares are limited to four times the deferred amount. The earliest point for the shares to be eligible for release is similarly at the end of a three-year period.
Up to 50 % of the awards will vest based on achievement of certain EBITA targets. Up to 25 % of awards will vest based on the earnings per share (EPS) performance relative to the UK Retail Price Index and up to 25 % based on the Total Shareholder Return (TSR) performance in relation to the TSR performance of other capital market-oriented travel and tourism companies.
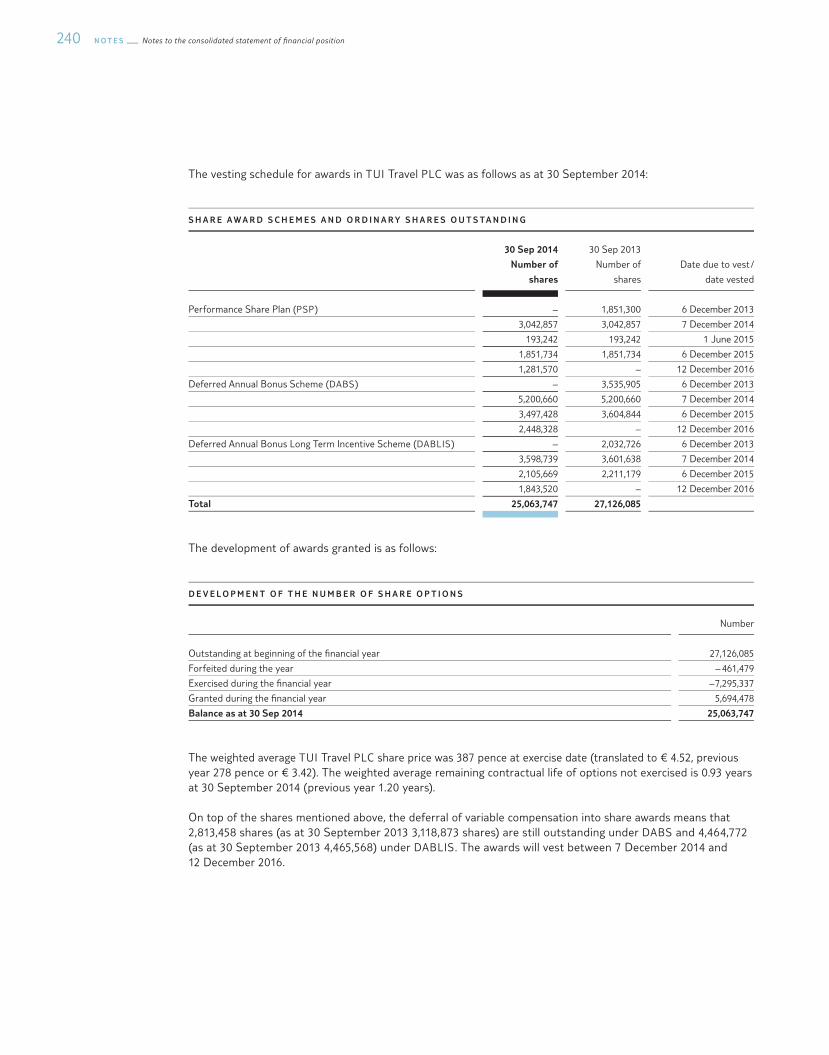
N O T E S Notes to the consolidated statement of §nancial position240
The vesting schedule for awards in TUI Travel PLC was as follows as at 30 September 2014:
S H A R E A W A R D S C H E M E S A N D O R D I N A R Y S H A R E S O U T S TA N D I N G
30 Sep 2014
Number of
shares
30 Sep 2013
Number of
shares
Date due to vest /
date vested
Performance Share Plan (PSP) – 1,851,300 6 December 2013
3,042,857 3,042,857 7 December 2014
193,242 193,242 1 June 2015
1,851,734 1,851,734 6 December 2015
1,281,570 – 12 December 2016
Deferred Annual Bonus Scheme (DABS) – 3,535,905 6 December 2013
5,200,660 5,200,660 7 December 2014
3,497,428 3,604,844 6 December 2015
2,448,328 – 12 December 2016
Deferred Annual Bonus Long Term Incentive Scheme (DABLIS) – 2,032,726 6 December 2013
3,598,739 3,601,638 7 December 2014
2,105,669 2,211,179 6 December 2015
1,843,520 – 12 December 2016
Total 25,063,747 27,126,085
The development of awards granted is as follows:
D E V E L O P M E N T O F T H E N U M B E R O F S H A R E O P T I O N S
Number
Outstanding at beginning of the �nancial year 27,126,085
Forfeited during the year – 461,479
Exercised during the �nancial year – 7,295,337
Granted during the �nancial year 5,694,478
Balance as at 30 Sep 2014 25,063,747
The weighted average TUI Travel PLC share price was 387 pence at exercise date (translated to € 4.52, previous year 278 pence or € 3.42). The weighted average remaining contractual life of options not exercised is 0.93 years at 30 September 2014 (previous year 1.20 years).
On top of the shares mentioned above, the deferral of variable compensation into share awards means that 2,813,458 shares (as at 30 September 2013 3,118,873 shares) are still outstanding under DABS and 4,464,772 (as at 30 September 2013 4,465,568) under DABLIS. The awards will vest between 7 December 2014 and 12 December 2016.
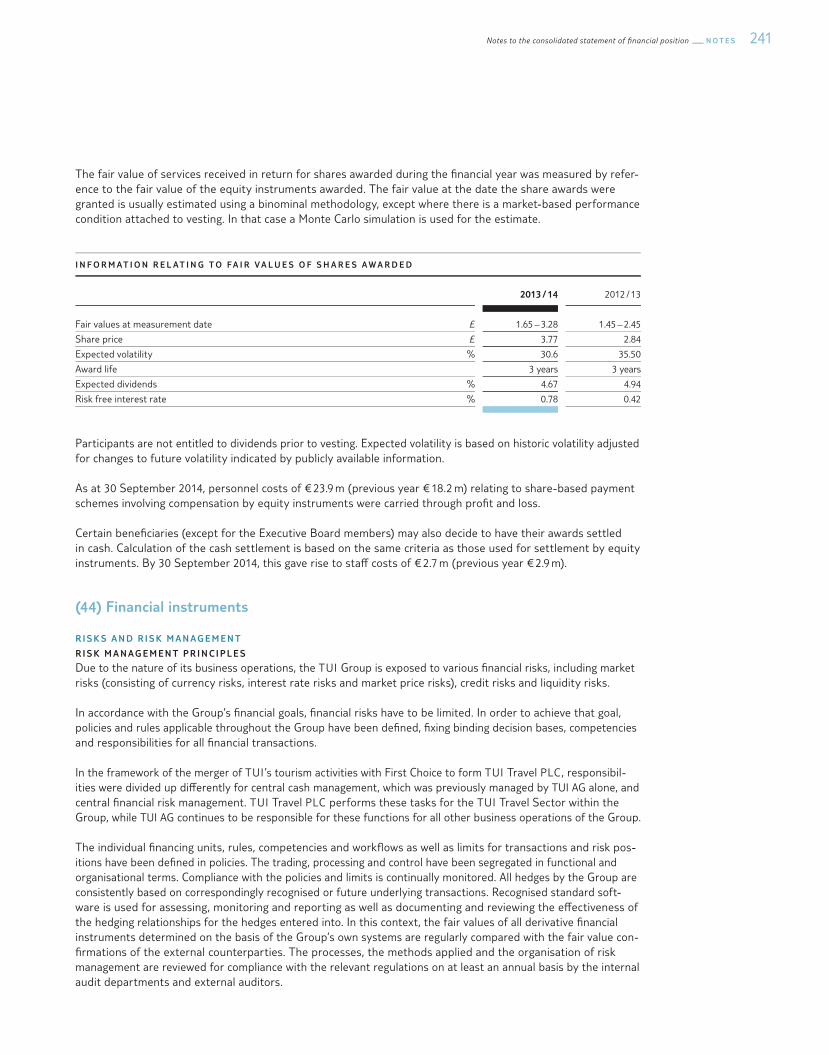
241Notes to the consolidated statement of §nancial position N O T E S
The fair value of services received in return for shares awarded during the �nancial year was measured by refer-ence to the fair value of the equity instruments awarded. The fair value at the date the share awards were granted is usually estimated using a binominal methodology, except where there is a market-based performance condition attached to vesting. In that case a Monte Carlo simulation is used for the estimate.
I N F O R M AT I O N R E L AT I N G T O F A I R V A L U E S O F S H A R E S A W A R D E D
2013 / 14 2012 / 13
Fair values at measurement date £ 1.65 – 3.28 1.45 – 2.45
Share price £ 3.77 2.84
Expected volatility % 30.6 35.50
Award life 3 years 3 years
Expected dividends % 4.67 4.94
Risk free interest rate % 0.78 0.42
Participants are not entitled to dividends prior to vesting. Expected volatility is based on historic volatility adjusted for changes to future volatility indicated by publicly available information.
As at 30 September 2014, personnel costs of € 23.9 m (previous year € 18.2 m) relating to share-based payment schemes involving compensation by equity instruments were carried through pro�t and loss.
Certain bene�ciaries (except for the Executive Board members) may also decide to have their awards settled in cash. Calculation of the cash settlement is based on the same criteria as those used for settlement by equity instruments. By 30 September 2014, this gave rise to sta§ costs of € 2.7 m (previous year € 2.9 m).
(44) Financial instruments
R I S K S A N D R I S K M A N AG E M E N T
R I S K M A N AG E M E N T P R I N C I P L E S
Due to the nature of its business operations, the TUI Group is exposed to various �nancial risks, including market risks (consisting of currency risks, interest rate risks and market price risks), credit risks and liquidity risks.
In accordance with the Group’s �nancial goals, �nancial risks have to be limited. In order to achieve that goal, policies and rules applicable throughout the Group have been de�ned, �xing binding decision bases, competencies and responsibilities for all �nancial transactions.
In the framework of the merger of TUI ’s tourism activities with First Choice to form TUI Travel PLC, responsibil-ities were divided up di§erently for central cash management, which was previously managed by TUI AG alone, and central �nancial risk management. TUI Travel PLC performs these tasks for the TUI Travel Sector within the Group, while TUI AG continues to be responsible for these functions for all other business operations of the Group.
The individual �nancing units, rules, competencies and work®ows as well as limits for transactions and risk pos-itions have been de�ned in policies. The trading, processing and control have been segregated in functional and organisational terms. Compliance with the policies and limits is continually monitored. All hedges by the Group are consistently based on correspondingly recognised or future underlying transactions. Recognised standard soft-ware is used for assessing, monitoring and reporting as well as documenting and reviewing the e§ectiveness of the hedging relationships for the hedges entered into. In this context, the fair values of all derivative �nancial instruments determined on the basis of the Group’s own systems are regularly compared with the fair value con-�rmations of the external counterparties. The processes, the methods applied and the organisation of risk management are reviewed for compliance with the relevant regulations on at least an annual basis by the internal audit departments and external auditors.
N O T E S Notes to the consolidated statement of §nancial position242
Within the TUI Group, �nancial risks primarily arise from cash ®ows in foreign currencies, fuel requirements ( jet fuel and bunker oil) and �nancing via the money and capital markets. In order to limit the risks from changes in exchange rates, market prices and interest rates for underlying transactions, TUI uses derivative over-the-counter �nancial instruments. These are primarily �xed-price transactions. In addition, TUI also uses options and structured products. Use of derivative �nancial instruments is con�ned to internally �xed limits and other regulations. The instruments used always have to be controllable with the respective entity’s own (human resources, organisational and systems) resources. The transactions are concluded on an arm’s length basis with contracting counterparties operating in the �nancial sector, whose counterparty risk is regularly monitored. Foreign exchange translation risks from the consolidation of Group companies not preparing their accounts in euros are not hedged.
Accounting and measurement of �nancial instruments is in line with IAS 39.
M A R K E T R I S K
Market risks result in ®uctuations in earnings, equity and cash ®ows. In order to limit or eliminate these risks, the TUI Group has developed various hedging strategies, including the use of derivative �nancial instruments.
According to IFRS 7, market risks have to be presented using sensitivity analyses showing the e§ects of hypo-thetical changes in relevant risk variables on pro�t or loss and equity. The e§ects for the period are determined by relating the hypothetical changes in risk variables to the portfolio of primary and derivative �nancial instru-ments as at the balance sheet date. Care is taken to ensure that the respective portfolio as at the balance sheet date is representative for the �nancial year.
The analyses of the TUI Group’s risk reduction activities outlined below and the amounts determined using sen-sitivity analyses represent hypothetical and thus uncertain disclosures entailing risks. Due to unforeseeable developments in the global �nancial markets, actual results may deviate substantially from the disclosures pro-vided. The risk analysis methods used must not be considered a projection of future events or losses, since the TUI Group is also exposed to risks of a non-�nancial or non-quanti�able nature. These risks primarily include souvereign, business and legal risks not covered by the following presentation of risks.
C U R R E N C Y R I S K
The business operations of the TUI Group’s companies generate payments denominated in foreign currencies, which are not always matched by congruent payments with equivalent terms in the same currency. Using potential netting e§ects (netting of payments made and received in the same currency with identical or similar terms), the TUI Group enters into appropriate hedges with external counterparties in order to protect its pro�t margin from exchange rate-related ®uctuations.
Within the TUI Group, risks from exchange rate ®uctuations of more than 20 currencies are hedged, with the largest hedging volumes relating to US dollars, euros and pound sterling. The Eurozone limits the currency risk from transactions in the key tourist destinations to Group companies whose functional currency is not the euro. The Tourism Segment is mainly a§ected by changes in the value of the US dollar and the euro, the latter predominantly a§ecting the TUI tour operators in the UK and the Nordic countries. In tourism operations, payments in US dollars primarily relate to the procurement of services in non-European destinations, purchases of jet fuel and ship fuel and aircraft purchases or charter.
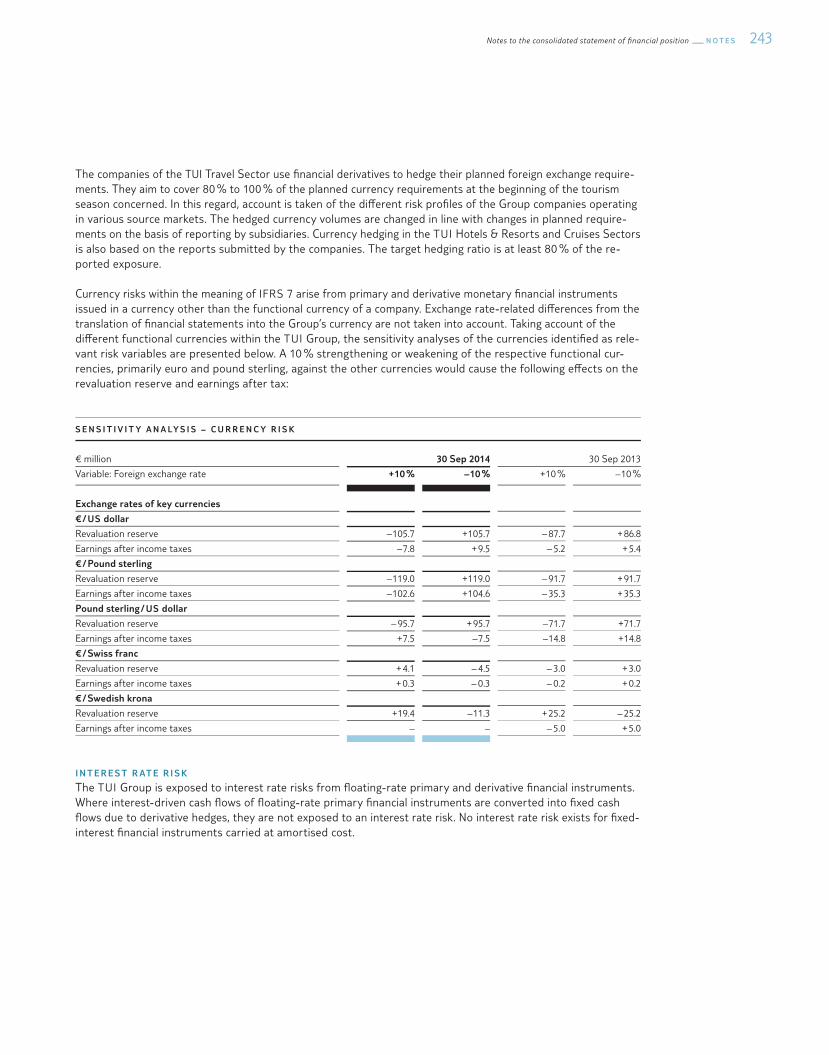
243Notes to the consolidated statement of §nancial position N O T E S
The companies of the TUI Travel Sector use �nancial derivatives to hedge their planned foreign exchange require-ments. They aim to cover 80 % to 100 % of the planned currency requirements at the beginning of the tourism season concerned. In this regard, account is taken of the di§erent risk pro�les of the Group companies operating in various source markets. The hedged currency volumes are changed in line with changes in planned require-ments on the basis of reporting by subsidiaries. Currency hedging in the TUI Hotels & Resorts and Cruises Sectors is also based on the reports submitted by the companies. The target hedging ratio is at least 80 % of the re-ported exposure.
Currency risks within the meaning of IFRS 7 arise from primary and derivative monetary �nancial instruments issued in a currency other than the functional currency of a company. Exchange rate-related di§erences from the translation of �nancial statements into the Group’s currency are not taken into account. Taking account of the di§erent functional currencies within the TUI Group, the sensitivity analyses of the currencies identi�ed as rele-vant risk variables are presented below. A 10 % strengthening or weakening of the respective functional cur-rencies, primarily euro and pound sterling, against the other currencies would cause the following e§ects on the revaluation reserve and earnings after tax:
S E N S I T I V I T Y A N A LY S I S – C U R R E N C Y R I S K
€ million 30 Sep 2014 30 Sep 2013
Variable: Foreign exchange rate + 10 % – 10 % + 10 % – 10 %
Exchange rates of key currencies
€ / US dollar
Revaluation reserve – 105.7 + 105.7 – 87.7 + 86.8
Earnings after income taxes – 7.8 + 9.5 – 5.2 + 5.4
€ / Pound sterling
Revaluation reserve – 119.0 + 119.0 – 91.7 + 91.7
Earnings after income taxes – 102.6 + 104.6 – 35.3 + 35.3
Pound sterling / US dollar
Revaluation reserve – 95.7 + 95.7 – 71.7 + 71.7
Earnings after income taxes + 7.5 – 7.5 – 14.8 + 14.8
€ / Swiss franc
Revaluation reserve + 4.1 – 4.5 – 3.0 + 3.0
Earnings after income taxes + 0.3 – 0.3 – 0.2 + 0.2
€ / Swedish krona
Revaluation reserve + 19.4 – 11.3 + 25.2 – 25.2
Earnings after income taxes – – – 5.0 + 5.0
I N T E R E S T R AT E R I S K
The TUI Group is exposed to interest rate risks from ®oating-rate primary and derivative �nancial instruments. Where interest-driven cash ®ows of ®oating-rate primary �nancial instruments are converted into �xed cash ®ows due to derivative hedges, they are not exposed to an interest rate risk. No interest rate risk exists for �xed- interest �nancial instruments carried at amortised cost.
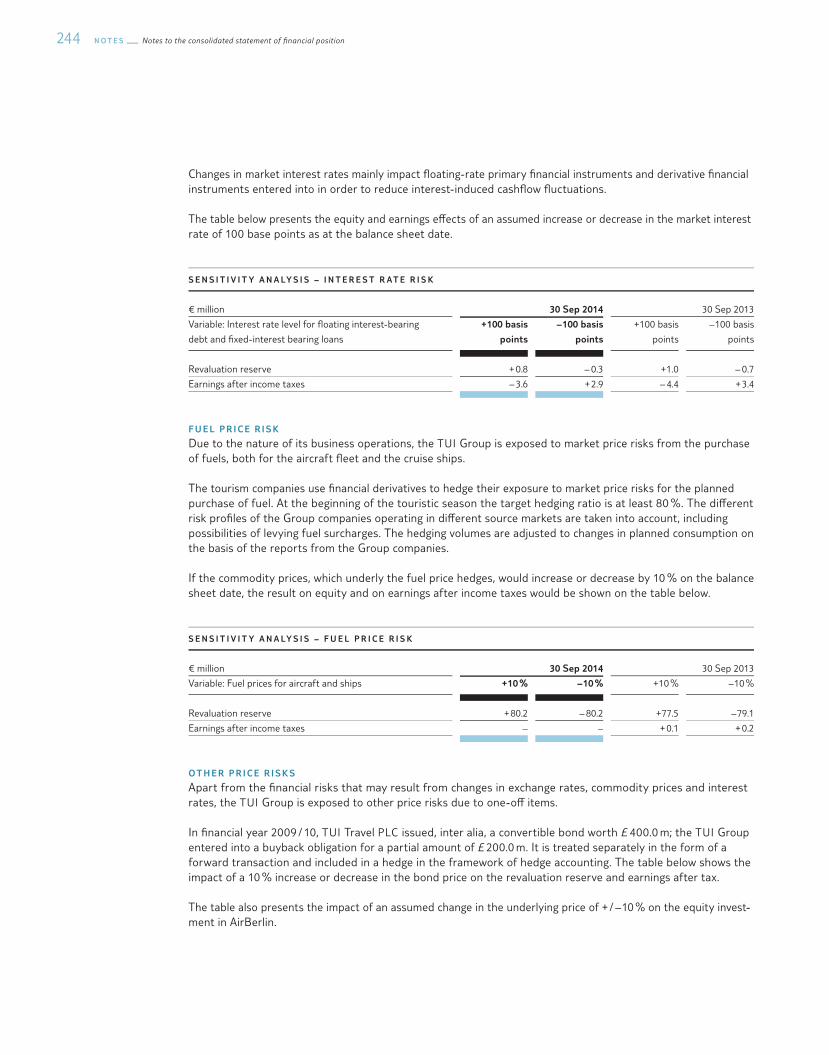
N O T E S Notes to the consolidated statement of §nancial position244
Changes in market interest rates mainly impact ®oating-rate primary �nancial instruments and derivative �nancial instruments entered into in order to reduce interest-induced cash®ow ®uctuations.
The table below presents the equity and earnings e§ects of an assumed increase or decrease in the market interest rate of 100 base points as at the balance sheet date.
S E N S I T I V I T Y A N A LY S I S – I N T E R E S T R AT E R I S K
€ million 30 Sep 2014 30 Sep 2013
Variable: Interest rate level for ®oating interest-bearing
debt and �xed-interest bearing loans
+ 100 basis
points
– 100 basis
points
+ 100 basis
points
– 100 basis
points
Revaluation reserve + 0.8 – 0.3 + 1.0 – 0.7
Earnings after income taxes – 3.6 + 2.9 – 4.4 + 3.4
F U E L P R I C E R I S K
Due to the nature of its business operations, the TUI Group is exposed to market price risks from the purchase of fuels, both for the aircraft ®eet and the cruise ships.
The tourism companies use �nancial derivatives to hedge their exposure to market price risks for the planned purchase of fuel. At the beginning of the touristic season the target hedging ratio is at least 80 %. The di§erent risk pro�les of the Group companies operating in di§erent source markets are taken into account, including possibilities of levying fuel surcharges. The hedging volumes are adjusted to changes in planned consumption on the basis of the reports from the Group companies.
If the commodity prices, which underly the fuel price hedges, would increase or decrease by 10 % on the balance sheet date, the result on equity and on earnings after income taxes would be shown on the table below.
S E N S I T I V I T Y A N A LY S I S – F U E L P R I C E R I S K
€ million 30 Sep 2014 30 Sep 2013
Variable: Fuel prices for aircraft and ships + 10 % – 10 % + 10 % – 10 %
Revaluation reserve + 80.2 – 80.2 + 77.5 – 79.1
Earnings after income taxes – – + 0.1 + 0.2
O T H E R P R I C E R I S K S
Apart from the �nancial risks that may result from changes in exchange rates, commodity prices and interest rates, the TUI Group is exposed to other price risks due to one-o§ items.
In �nancial year 2009 / 10, TUI Travel PLC issued, inter alia, a convertible bond worth £ 400.0 m; the TUI Group entered into a buyback obligation for a partial amount of £ 200.0 m. It is treated separately in the form of a forward transaction and included in a hedge in the framework of hedge accounting. The table below shows the impact of a 10 % increase or decrease in the bond price on the revaluation reserve and earnings after tax.
The table also presents the impact of an assumed change in the underlying price of + / – 10 % on the equity invest-ment in AirBerlin.

245Notes to the consolidated statement of §nancial position N O T E S
S E N S I T I V I T Y A N A LY S I S – O T H E R P R I C E R I S K S
€ million 30 Sep 2014 30 Sep 2013
Variable: Other market values, cash ®ows + 10 % – 10 % + 10 % – 10 %
Revaluation reserve + 14.1 – 17.0 + 14.3 – 14.3
Earnings after income taxes – – – –
Equity – Available for sale �nancial instruments + 0.4 – 0.4 + 0.6 – 0.6
The funds from the bond issued in September 2014 and invested in a money market fund would have an e§ect of € + 2.1 m / € – 2.1 m on equity if the listed price changed by + / – 1 % on the balance sheet date.
For the sensitivity analysis of the indirect shareholding in National Air Tra¯c Services (NATS), reference is made to the comments on the development of the value of Level 3 �nancial instruments.
C R E D I T R I S K
The credit risk in non-derivative �nancial instruments results from the risk of counterparties defaulting on their contractual payment obligations.
Maximum credit risk exposure corresponds in particular to the total of the recognised carrying amounts of the �nancial assets (including derivative �nancial instruments with positive market values). It also relates to the granting of �nancial guarantees for the discharge of liabilities. Details concerning the guarantees at the balance sheet date are presented in Note 40. Legally enforceable possibilities of netting �nancial assets and liabilities are taken into account. Credit risks are reviewed closely on conclusion of the contract and continually monitored thereafter so as to be able to swiftly respond to potential impairments in a counterparty’s solvency. Responsibility for handling the credit risk is always held by the respective Group companies of the TUI Group.
Since the TUI Group operates in many di§erent business areas and regions, signi�cant credit risk concentrations of receivables from and loans to speci�c debtors or groups of debtors are not to be expected. A signi�cant concentration of credit risks related to speci�c countries is not to be expected either. The maximum credit risk is reduced by collateral held and other credit enhancements of € 1.1 m (previous year € 1.1 m). Collateral held relates exclusively to �nancial assets of the category trade receivables and other assets. The collateral mainly com-prises collateral for �nancial receivables granted and maturing in more than one year and / or with a volume of more than € 1 m. Rights in rem, directly enforceable guarantees, bank guarantees and comfort letters are used as collateral.
Identi�able credit risks of individual receivables are covered by means of corresponding bad debt allowances. In addition, portfolios are impaired based on empirical values. An analysis of the aging structure of the category trade receivables and other assets is presented in Note 20.
At the balance sheet date, there were no �nancial assets that would be past due or impaired unless the terms and conditions of the contract had been renegotiated, neither in �nancial year 2013 / 14 nor in 2012 / 13.
Credit management also covers the TUI Group’s derivative �nancial instruments. The maximum credit risk for deriva-tive �nancial instruments entered into is limited to the total of all positive market values of these instruments since in the event of counterparty default asset losses would only be incurred up to that amount. Since derivative �nancial instruments are concluded with di§erent debtors, credit risk exposure is reduced. The speci�c credit risks of individual counterparties are taken into account in determining the fair values of derivative �nancial instru-ments. In addition, the counterparty risk is continually monitored and controlled using internal bank limits.
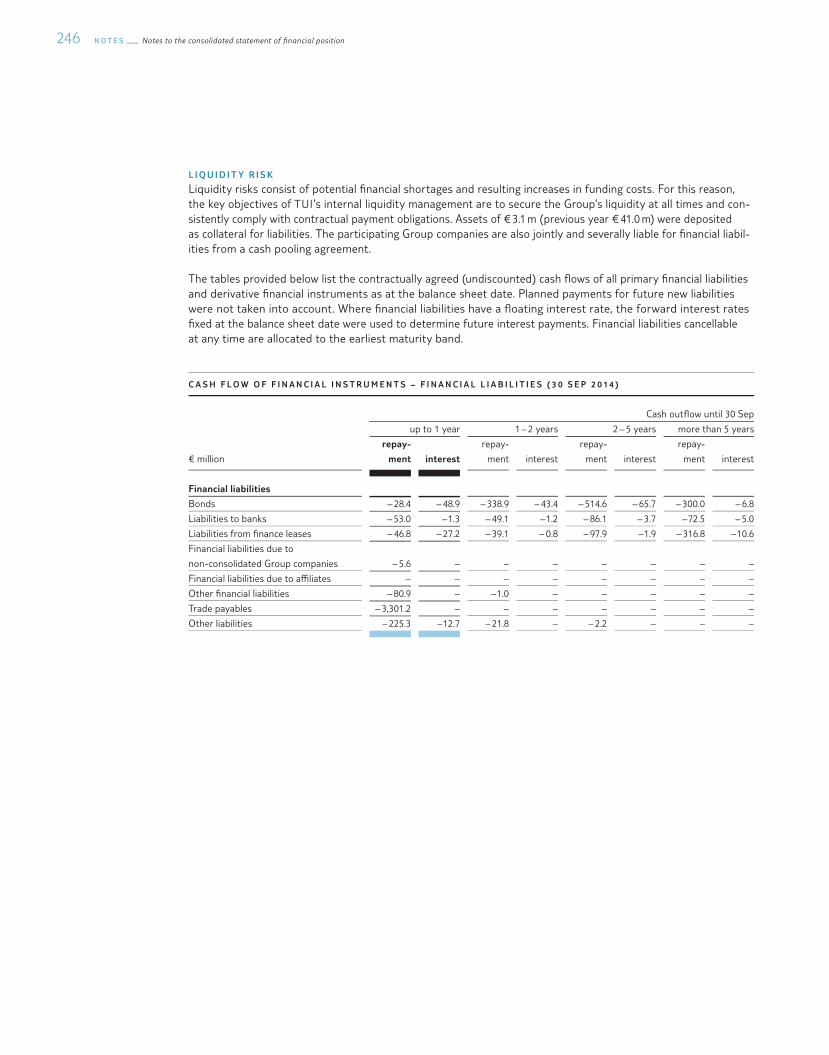
N O T E S Notes to the consolidated statement of §nancial position246
L I Q U I D I T Y R I S K
Liquidity risks consist of potential �nancial shortages and resulting increases in funding costs. For this reason, the key objectives of TUI ’s internal liquidity management are to secure the Group’s liquidity at all times and con-sistently comply with contractual payment obligations. Assets of € 3.1 m (previous year € 41.0 m) were deposited as collateral for liabilities. The participating Group companies are also jointly and severally liable for �nancial liabil-ities from a cash pooling agreement.
The tables provided below list the contractually agreed (undiscounted) cash ®ows of all primary �nancial liabilities and derivative �nancial instruments as at the balance sheet date. Planned payments for future new liabilities were not taken into account. Where �nancial liabilities have a ®oating interest rate, the forward interest rates �xed at the balance sheet date were used to determine future interest payments. Financial liabilities cancellable at any time are allocated to the earliest maturity band.
C A S H F L O W O F F I N A N C I A L I N S T R U M E N T S – F I N A N C I A L L I A B I L I T I E S ( 3 0 S E P 2 0 1 4 )
Cash out®ow until 30 Sep
up to 1 year 1 – 2 years 2 – 5 years more than 5 years
€ million
repay-
ment interest
repay-
ment interest
repay-
ment interest
repay-
ment interest
Financial liabilities
Bonds – 28.4 – 48.9 – 338.9 – 43.4 – 514.6 – 65.7 – 300.0 – 6.8
Liabilities to banks – 53.0 – 1.3 – 49.1 – 1.2 – 86.1 – 3.7 – 72.5 – 5.0
Liabilities from �nance leases – 46.8 – 27.2 – 39.1 – 0.8 – 97.9 – 1.9 – 316.8 – 10.6
Financial liabilities due to
non-consolidated Group companies – 5.6 – – – – – – –
Financial liabilities due to a¯liates – – – – – – – –
Other �nancial liabilities – 80.9 – – 1.0 – – – – –
Trade payables – 3,301.2 – – – – – – –
Other liabilities – 225.3 – 12.7 – 21.8 – – 2.2 – – –

247Notes to the consolidated statement of §nancial position N O T E S
C A S H F L O W O F F I N A N C I A L I N S T R U M E N T S – F I N A N C I A L L I A B I L I T I E S ( 3 0 S E P 2 0 13 )
Cash out®ow until 30 Sep
up to 1 year 1 – 2 years 2 – 5 years more than 5 years
€ million
repay-
ment interest
repay-
ment interest
repay-
ment interest
repay-
ment interest
Financial liabilities
Bonds – – 69.8 – 577.1 – 63.8 – 817.4 – 51.6 – –
Liabilities to banks – 828.5 – 16.9 – 32.0 – 1.9 – 73.2 – 4.2 – 70.7 – 5.1
Liabilities from �nance leases – 29.2 – 0.1 – 35.5 – – 96.4 – – 174.5 –
Other �nancial liabilities – 102.4 – 25.6 – – – – – –
Trade payables – 3,049.2 – – – – – – –
Other liabilities – 218.9 – – 6.3 – – 12.1 – 1.4 – 11.8 –
C A S H F L O W O F D E R I V AT I V E F I N A N C I A L I N S T R U M E N T S ( 3 0 S E P 2 0 1 4 )
Cash in- / out®ow until 30 Sep
€ million up to 1 year 1 – 2 years 2 – 5 years
more than
5 years
Derivative �nancial instruments
Hedging transactions – in®ows + 6,177.2 + 753.0 + 34.6 –
Hedging transactions – out®ows – 6,222.3 – 731.6 – 31.3 –
Other derivative �nancial instruments – in®ows + 3,103.1 + 27.3 – –
Other derivative �nancial instruments – out®ows – 3,134.2 – 27.2 – 0.8 –
C A S H F L O W O F D E R I V AT I V E F I N A N C I A L I N S T R U M E N T S ( 3 0 S E P 2 0 13 )
Cash in- / out®ow until 30 Sep
€ million up to 1 year 1 – 2 years 2 – 5 years
more than
5 years
Derivative �nancial instruments
Hedging transactions – in®ows + 6,172.5 + 1,102.4 + 29.1 –
Hedging transactions – out®ows – 6,275.8 – 1,128.9 – 29.7 –
Other derivative �nancial instruments – in®ows + 3,363.2 + 206.4 – –
Other derivative �nancial instruments – out®ows – 3,407.7 – 209.4 – 0.2 –
D E R I VAT I V E F I N A N C I A L I N S T R U M E N T S A N D H E D G E S
S T R AT E G Y A N D G OA L S
In accordance with the TUI Group’s implementing regulations, derivatives are allowed to be used if they are based on underlying recognised assets or liabilities, �rm commitments or forecasted transactions. Hedge accounting is based on the rules of IAS 39, in particular in the context of hedging forecasted transactions. In the �nancial year under review, hedges primarily consisted of cash ®ow hedges.

N O T E S Notes to the consolidated statement of §nancial position248
Derivative �nancial instruments in the form of �xed-price transactions and options are used to prevent currency, interest rate and fuel risks.
C A S H F L O W H E D G E S
As at 30 September 2014, derivative instruments existed to hedge cash ®ows in foreign currencies with maturities of up to three years (previous year up to three years). The listed fuel price hedges had terms of up to four years (previous year up to three years). In order to hedge TUI AG’s ®oating-rate interest payment obligations in connection with the funding to purchase part of a convertible bond issued by TUI Travel PLC, interest hedges with a term of up to two years (previous year up to three years) were concluded in �nancial years 2010 / 11 and 2012 / 13.
In accounting for derivatives of cash ®ow hedges, the e§ective portion of the cumulative changes in market values is carried in the revaluation reserve outside pro�t and loss until the underlying transaction occurs. It is carried in the income statement through pro�t and loss when the hedged item is executed. In the �nancial year under review, income of € 150.6 m (previous year expenses of € 10.3 m) for currency hedges and derivative �nancial instruments used as price hedges were carried in the cost of sales. Expenses of € 0.7 m (previous year of € 0.7 m) were carried in the �nancial result for interest hedges. Income of € 0.1 m (previous year expenses of € 2.4 m) were carried for the ine§ective portion of the cash ®ow hedges.
N O M I N A L A M O U N T S O F D E R I V AT I V E F I N A N C I A L I N S T R U M E N T S U S E D
30 Sep 2014 30 Sep 2013
Remaining term Remaining term
€ million
up to
1 year
more than
1 year Total
up to
1 year
more than
1 year Total
Interest rate hedges
Caps – 225.6 225.6 59.8 222.0 281.8
Swaps 25.0 90.0 115.0 59.8 90.9 150.7
Currency hedges
Forwards 9,155.9 799.4 9,955.3 9,387.2 1,060.2 10,447.4
Options 4.0 – 4.0 39.2 – 39.2
Collected forwards 204.6 18.4 223.0 179.1 110.9 290.0
Commodity hedges
Swaps 1,041.2 283.9 1,325.1 1,011.2 212.5 1,223.7
Options 3.0 – 3.0 31.1 – 31.1
Other �nancial instruments – 193.0 193.0 – 179.4 179.4
The nominal amounts correspond to the total of all purchase or sale amounts or the contract values of the transactions.
FA I R VA L U E S O F D E R I VAT I V E F I N A N C I A L I N S T R U M E N T S
The fair values of derivative �nancial instruments correspond to the market values. The market price determined for all derivative �nancial instruments is the price that would be received to sell an asset or paid to transfer a liability in an orderly transaction between market participants at the measurement date. A description of the determination of the fair values of derivative �nancial instruments is provided in the context of the presen-tation of the classi�cation of �nancial instruments measured at fair value.
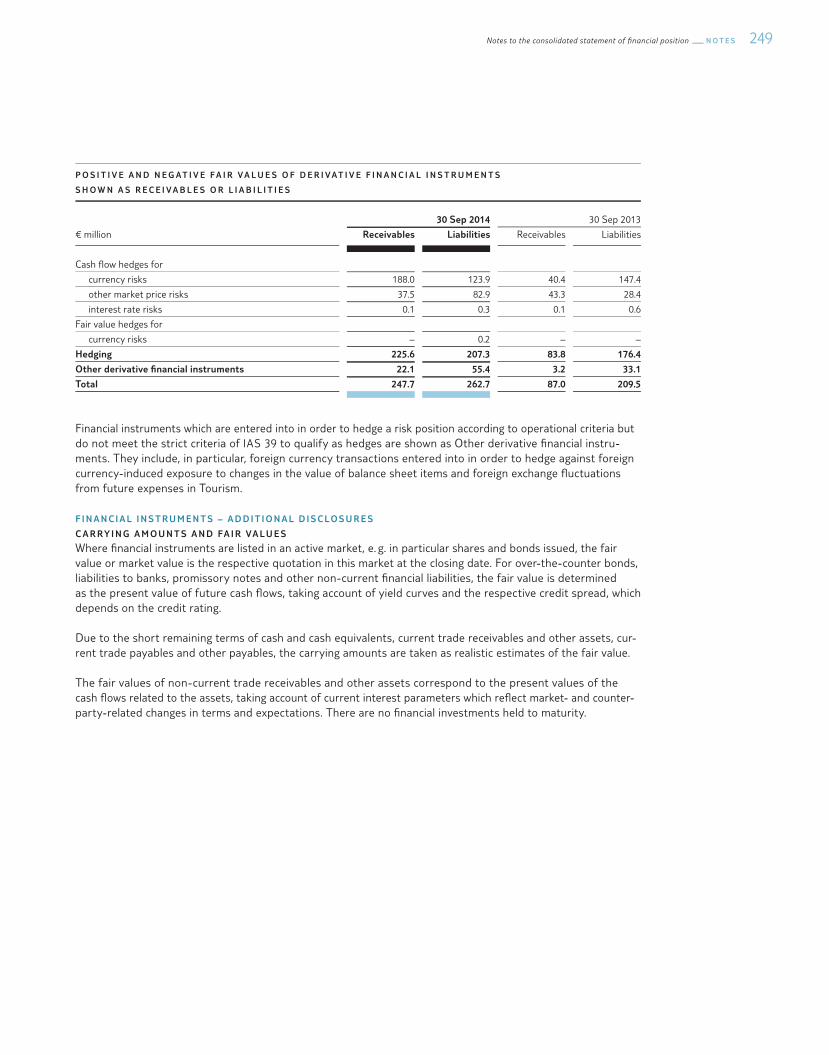
249Notes to the consolidated statement of §nancial position N O T E S
P O S I T I V E A N D N E G AT I V E F A I R V A L U E S O F D E R I V AT I V E F I N A N C I A L I N S T R U M E N T S
S H O W N A S R E C E I V A B L E S O R L I A B I L I T I E S
30 Sep 2014 30 Sep 2013
€ million Receivables Liabilities Receivables Liabilities
Cash ®ow hedges for
currency risks 188.0 123.9 40.4 147.4
other market price risks 37.5 82.9 43.3 28.4
interest rate risks 0.1 0.3 0.1 0.6
Fair value hedges for
currency risks – 0.2 – –
Hedging 225.6 207.3 83.8 176.4
Other derivative �nancial instruments 22.1 55.4 3.2 33.1
Total 247.7 262.7 87.0 209.5
Financial instruments which are entered into in order to hedge a risk position according to operational criteria but do not meet the strict criteria of IAS 39 to qualify as hedges are shown as Other derivative �nancial instru-ments. They include, in particular, foreign currency transactions entered into in order to hedge against foreign currency-induced exposure to changes in the value of balance sheet items and foreign exchange ®uctuations from future expenses in Tourism.
F I N A N C I A L I N S T R U M E N T S – A D D I T I O N A L D I S C L O S U R E S
C A R RY I N G A M O U N T S A N D FA I R VA L U E S
Where �nancial instruments are listed in an active market, e. g. in particular shares and bonds issued, the fair value or market value is the respective quotation in this market at the closing date. For over-the-counter bonds, liabilities to banks, promissory notes and other non-current �nancial liabilities, the fair value is determined as the present value of future cash ®ows, taking account of yield curves and the respective credit spread, which depends on the credit rating.
Due to the short remaining terms of cash and cash equivalents, current trade receivables and other assets, cur-rent trade payables and other payables, the carrying amounts are taken as realistic estimates of the fair value.
The fair values of non-current trade receivables and other assets correspond to the present values of the cash ®ows related to the assets, taking account of current interest parameters which re®ect market- and counter-party-related changes in terms and expectations. There are no �nancial investments held to maturity.
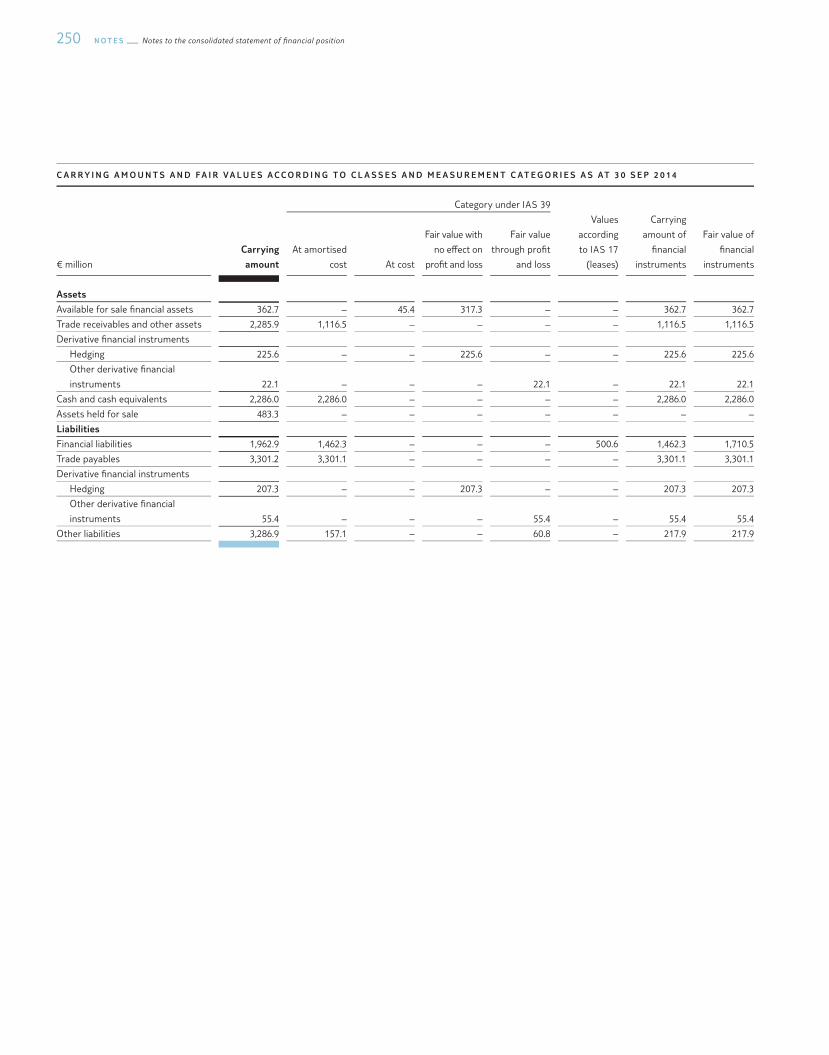
N O T E S Notes to the consolidated statement of §nancial position250
C A R R Y I N G A M O U N T S A N D F A I R V A L U E S A C C O R D I N G T O C L A S S E S A N D M E A S U R E M E N T C AT E G O R I E S A S AT 3 0 S E P 2 0 1 4
Category under IAS 39
€ million
Carrying
amount
At amortised
cost At cost
Fair value with
no e§ect on
pro�t and loss
Fair value
through pro�t
and loss
Values
according
to IAS 17
(leases)
Carrying
amount of
�nancial
instruments
Fair value of
�nancial
instruments
Assets
Available for sale �nancial assets 362.7 – 45.4 317.3 – – 362.7 362.7
Trade receivables and other assets 2,285.9 1,116.5 – – – – 1,116.5 1,116.5
Derivative �nancial instruments
Hedging 225.6 – – 225.6 – – 225.6 225.6
Other derivative �nancial
instruments 22.1 – – – 22.1 – 22.1 22.1
Cash and cash equivalents 2,286.0 2,286.0 – – – – 2,286.0 2,286.0
Assets held for sale 483.3 – – – – – – –
Liabilities
Financial liabilities 1,962.9 1,462.3 – – – 500.6 1,462.3 1,710.5
Trade payables 3,301.2 3,301.1 – – – – 3,301.1 3,301.1
Derivative �nancial instruments
Hedging 207.3 – – 207.3 – – 207.3 207.3
Other derivative �nancial
instruments 55.4 – – – 55.4 – 55.4 55.4
Other liabilities 3,286.9 157.1 – – 60.8 – 217.9 217.9
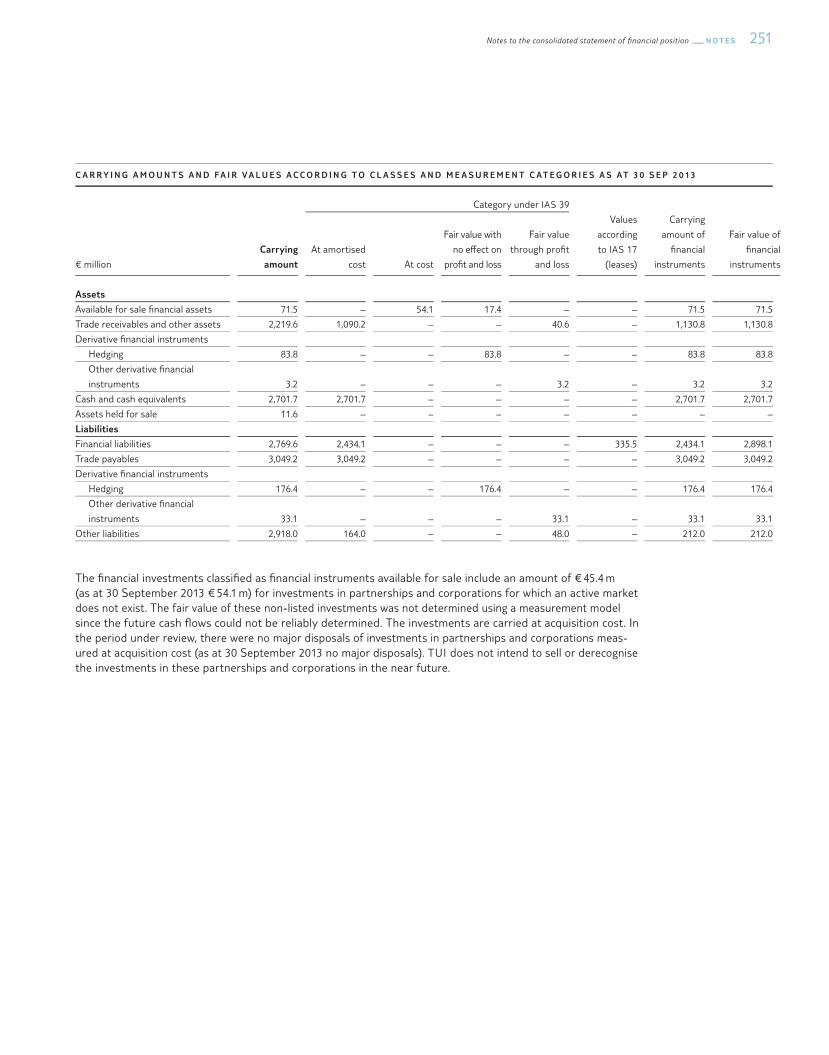
251Notes to the consolidated statement of §nancial position N O T E S
C A R R Y I N G A M O U N T S A N D F A I R V A L U E S A C C O R D I N G T O C L A S S E S A N D M E A S U R E M E N T C AT E G O R I E S A S AT 3 0 S E P 2 0 13
Category under IAS 39
€ million
Carrying
amount
At amortised
cost At cost
Fair value with
no e§ect on
pro�t and loss
Fair value
through pro�t
and loss
Values
according
to IAS 17
(leases)
Carrying
amount of
�nancial
instruments
Fair value of
�nancial
instruments
Assets
Available for sale �nancial assets 71.5 – 54.1 17.4 – – 71.5 71.5
Trade receivables and other assets 2,219.6 1,090.2 – – 40.6 – 1,130.8 1,130.8
Derivative �nancial instruments
Hedging 83.8 – – 83.8 – – 83.8 83.8
Other derivative �nancial
instruments 3.2 – – – 3.2 – 3.2 3.2
Cash and cash equivalents 2,701.7 2,701.7 – – – – 2,701.7 2,701.7
Assets held for sale 11.6 – – – – – – –
Liabilities
Financial liabilities 2,769.6 2,434.1 – – – 335.5 2,434.1 2,898.1
Trade payables 3,049.2 3,049.2 – – – – 3,049.2 3,049.2
Derivative �nancial instruments
Hedging 176.4 – – 176.4 – – 176.4 176.4
Other derivative �nancial
instruments 33.1 – – – 33.1 – 33.1 33.1
Other liabilities 2,918.0 164.0 – – 48.0 – 212.0 212.0
The �nancial investments classi�ed as �nancial instruments available for sale include an amount of € 45.4 m (as at 30 September 2013 € 54.1 m) for investments in partnerships and corporations for which an active market does not exist. The fair value of these non-listed investments was not determined using a measurement model since the future cash ®ows could not be reliably determined. The investments are carried at acquisition cost. In the period under review, there were no major disposals of investments in partnerships and corporations meas-ured at acquisition cost (as at 30 September 2013 no major disposals). TUI does not intend to sell or derecognise the investments in these partnerships and corporations in the near future.
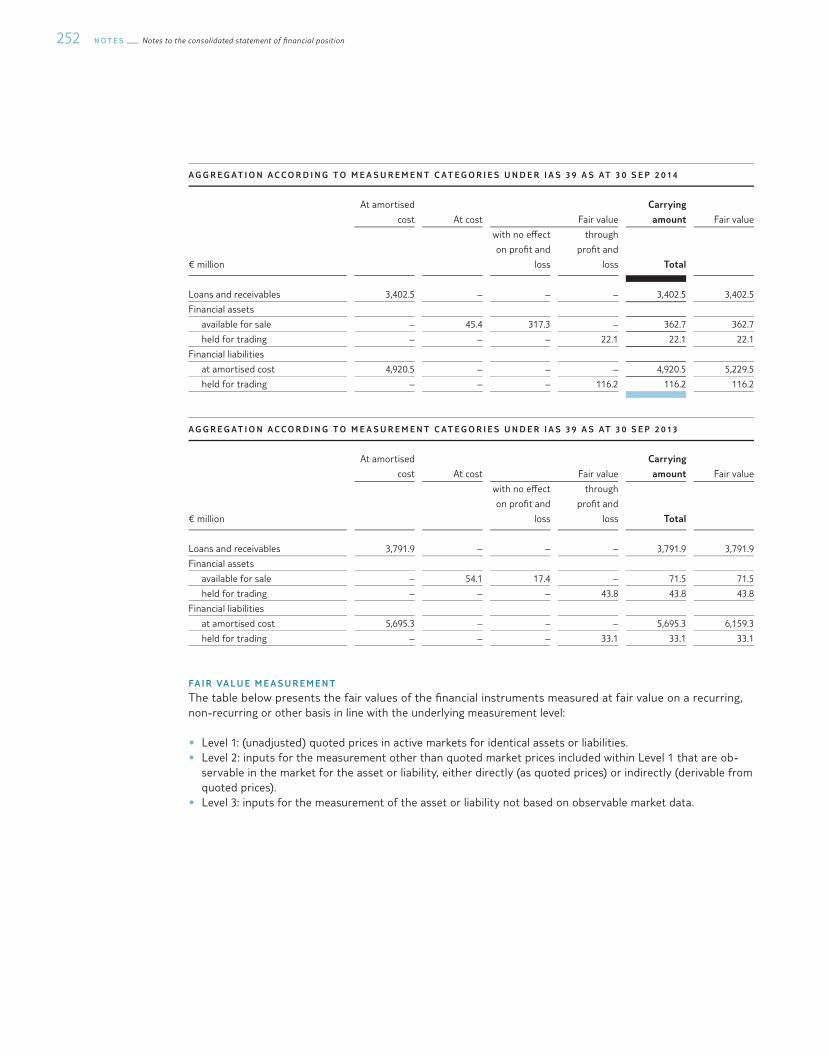
N O T E S Notes to the consolidated statement of §nancial position252
A G G R E G AT I O N A C C O R D I N G T O M E A S U R E M E N T C AT E G O R I E S U N D E R I A S 3 9 A S AT 3 0 S E P 2 0 1 4
At amortised
cost At cost Fair value
Carrying
amount Fair value
€ million
with no e§ect
on pro�t and
loss
through
pro�t and
loss Total
Loans and receivables 3,402.5 – – – 3,402.5 3,402.5
Financial assets
available for sale – 45.4 317.3 – 362.7 362.7
held for trading – – – 22.1 22.1 22.1
Financial liabilities
at amortised cost 4,920.5 – – – 4,920.5 5,229.5
held for trading – – – 116.2 116.2 116.2
A G G R E G AT I O N A C C O R D I N G T O M E A S U R E M E N T C AT E G O R I E S U N D E R I A S 3 9 A S AT 3 0 S E P 2 0 13
At amortised
cost At cost Fair value
Carrying
amount Fair value
€ million
with no e§ect
on pro�t and
loss
through
pro�t and
loss Total
Loans and receivables 3,791.9 – – – 3,791.9 3,791.9
Financial assets
available for sale – 54.1 17.4 – 71.5 71.5
held for trading – – – 43.8 43.8 43.8
Financial liabilities
at amortised cost 5,695.3 – – – 5,695.3 6,159.3
held for trading – – – 33.1 33.1 33.1
FA I R VA L U E M E A S U R E M E N T
The table below presents the fair values of the �nancial instruments measured at fair value on a recurring, non-recurring or other basis in line with the underlying measurement level:
• Level 1: (unadjusted) quoted prices in active markets for identical assets or liabilities. • Level 2: inputs for the measurement other than quoted market prices included within Level 1 that are ob-
servable in the market for the asset or liability, either directly (as quoted prices) or indirectly (derivable from quoted prices).
• Level 3: inputs for the measurement of the asset or liability not based on observable market data.
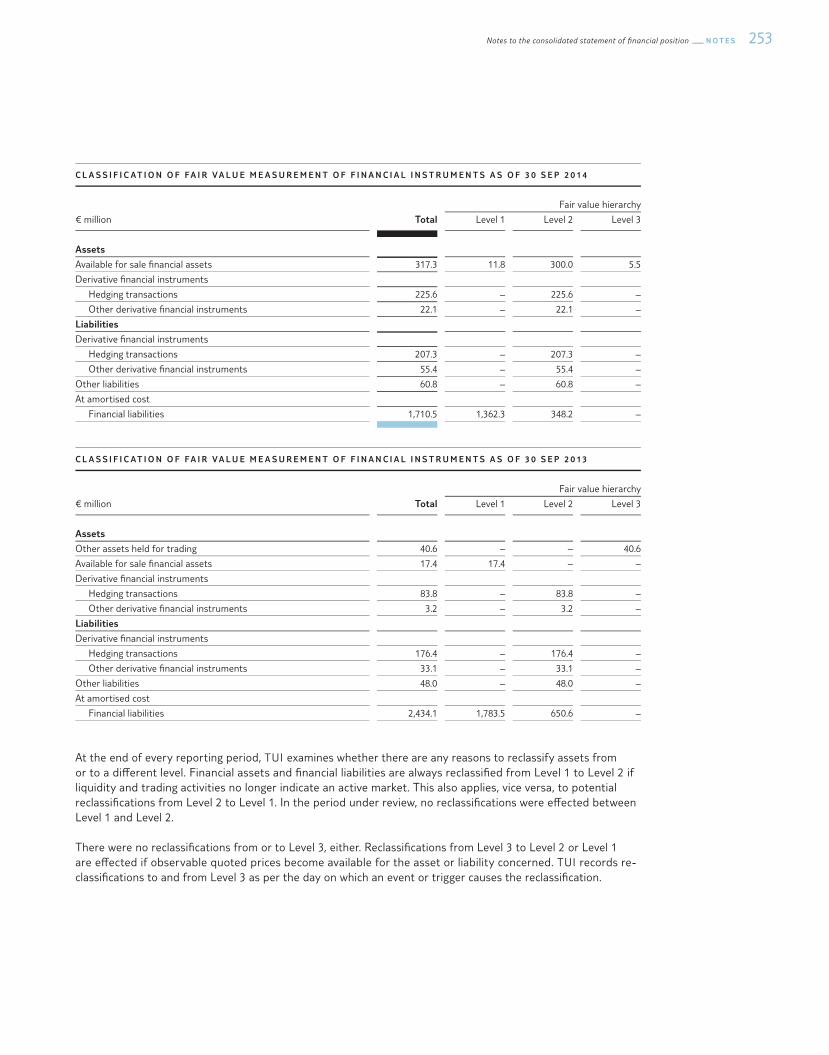
253Notes to the consolidated statement of §nancial position N O T E S
C L A S S I F I C AT I O N O F F A I R V A L U E M E A S U R E M E N T O F F I N A N C I A L I N S T R U M E N T S A S O F 3 0 S E P 2 0 1 4
Fair value hierarchy
€ million Total Level 1 Level 2 Level 3
Assets
Available for sale �nancial assets 317.3 11.8 300.0 5.5
Derivative �nancial instruments
Hedging transactions 225.6 – 225.6 –
Other derivative �nancial instruments 22.1 – 22.1 –
Liabilities
Derivative �nancial instruments
Hedging transactions 207.3 – 207.3 –
Other derivative �nancial instruments 55.4 – 55.4 –
Other liabilities 60.8 – 60.8 –
At amortised cost
Financial liabilities 1,710.5 1,362.3 348.2 –
C L A S S I F I C AT I O N O F F A I R V A L U E M E A S U R E M E N T O F F I N A N C I A L I N S T R U M E N T S A S O F 3 0 S E P 2 0 13
Fair value hierarchy
€ million Total Level 1 Level 2 Level 3
Assets
Other assets held for trading 40.6 – – 40.6
Available for sale �nancial assets 17.4 17.4 – –
Derivative �nancial instruments
Hedging transactions 83.8 – 83.8 –
Other derivative �nancial instruments 3.2 – 3.2 –
Liabilities
Derivative �nancial instruments
Hedging transactions 176.4 – 176.4 –
Other derivative �nancial instruments 33.1 – 33.1 –
Other liabilities 48.0 – 48.0 –
At amortised cost
Financial liabilities 2,434.1 1,783.5 650.6 –
At the end of every reporting period, TUI examines whether there are any reasons to reclassify assets from or to a di§erent level. Financial assets and �nancial liabilities are always reclassi�ed from Level 1 to Level 2 if liquidity and trading activities no longer indicate an active market. This also applies, vice versa, to potential reclassi�cations from Level 2 to Level 1. In the period under review, no reclassi�cations were e§ected between Level 1 and Level 2.
There were no reclassi�cations from or to Level 3, either. Reclassi�cations from Level 3 to Level 2 or Level 1 are e§ected if observable quoted prices become available for the asset or liability concerned. TUI records re-classi�cations to and from Level 3 as per the day on which an event or trigger causes the reclassi�cation.
N O T E S Notes to the consolidated statement of §nancial position254
L E V E L 1 F I N A N C I A L I N S T R U M E N T S :
The fair value of �nancial instruments for which an active market exists is based on quoted prices at the reporting date. An active market exists if quoted prices are readily and regularly available from an exchange, dealer, broker, pricing service or regulatory agency and these prices represent actual and regularly occurring market transactions on an arm’s length basis. These �nancial instruments are classi�ed as Level 1. The fair values correspond to the nominal amounts multiplied by the quoted prices at the reporting date. Level 1 �nancial instruments primarily comprise shares in listed companies classi�ed as available for sale and bonds issued classi�ed as �nancial li-abilities at amortised cost.
L E V E L 2 F I N A N C I A L I N S T R U M E N T S :
The fair values of �nancial instruments not traded in an active market, e.g. over-the-counter (OTC) derivatives, are determined by means of speci�c valuation techniques. These valuation techniques make maximum use of observable market data and minimise the use of Group-speci�c assumptions. If all essential inputs for the determination of the fair value of an instrument are observable, the instrument is classi�ed as Level 2.
If one or several key inputs are not based on observable market data, the instrument is classi�ed as Level 3.
The following speci�c valuation techniques are used to measure �nancial instruments:
• For over-the-counter bonds, liabilities to banks, promissory notes and other non-current �nancial liabilities, the fair value is determined as the present value of future cash ®ows, taking account of yield curves and the respective credit spread, which depends on the credit rating
• The fair value of over-the-counter derivatives is determined by means of appropriate calculation methods, e. g. by discounting the expected future cash ®ows. The forward prices of forward transactions are based on the spot or cash prices, taking account of forward premiums and discounts. The calculation of the fair values of options concluded for currency options is based on the Black & Scholes model and the Turnbull & Wakeman model for optional fuel hedges. The fair values determined on the basis of the Group’s own systems are regu-larly compared with fair value con�rmations of the external counterparties.
• Other valuation techniques, e.g. discounting future cash ®ows, are used to determine the fair values of other �nancial instruments.
• The fair value of over-the-counter money market funds is determinated by means of observable price quotations (net asset value).
With the exception of the investment in NATS presented below, the fair values resulting from the application of the valuation assumptions are fully allocated to Level 2.
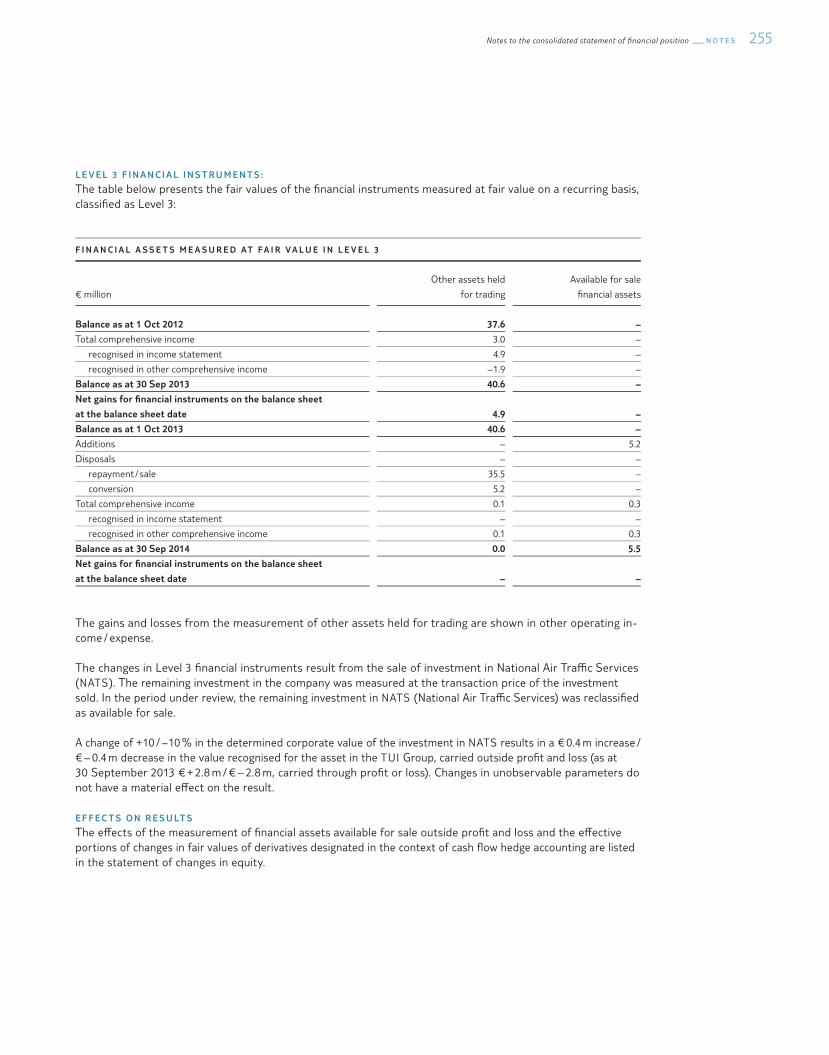
255Notes to the consolidated statement of §nancial position N O T E S
L E V E L 3 F I N A N C I A L I N S T R U M E N T S :
The table below presents the fair values of the �nancial instruments measured at fair value on a recurring basis, classi�ed as Level 3:
F I N A N C I A L A S S E T S M E A S U R E D AT F A I R V A L U E I N L E V E L 3
€ million
Other assets held
for trading
Available for sale
�nancial assets
Balance as at 1 Oct 2012 37.6 –
Total comprehensive income 3.0 –
recognised in income statement 4.9 –
recognised in other comprehensive income – 1.9 –
Balance as at 30 Sep 2013 40.6 –
Net gains for �nancial instruments on the balance sheet
at the balance sheet date 4.9 –
Balance as at 1 Oct 2013 40.6 –
Additions – 5.2
Disposals – –
repayment / sale 35.5 –
conversion 5.2 –
Total comprehensive income 0.1 0.3
recognised in income statement – –
recognised in other comprehensive income 0.1 0.3
Balance as at 30 Sep 2014 0.0 5.5
Net gains for �nancial instruments on the balance sheet
at the balance sheet date – –
The gains and losses from the measurement of other assets held for trading are shown in other operating in-come / expense.
The changes in Level 3 �nancial instruments result from the sale of investment in National Air Tra¯c Services (NATS). The remaining investment in the company was measured at the transaction price of the investment sold. In the period under review, the remaining investment in NATS (National Air Tra¯c Services) was reclassi�ed as available for sale.
A change of + 10 / – 10 % in the determined corporate value of the investment in NATS results in a € 0.4 m increase / € – 0.4 m decrease in the value recognised for the asset in the TUI Group, carried outside pro�t and loss (as at 30 September 2013 € + 2.8 m / € – 2.8 m, carried through pro�t or loss). Changes in unobservable parameters do not have a material e§ect on the result.
E F F E C T S O N R E S U LT S
The e§ects of the measurement of �nancial assets available for sale outside pro�t and loss and the e§ective portions of changes in fair values of derivatives designated in the context of cash ®ow hedge accounting are listed in the statement of changes in equity.

N O T E S Notes to the consolidated statement of §nancial position256
The net results of the �nancial instruments by measurement category according to IAS 39 are as follows:
N E T R E S U LT S O F F I N A N C I A L I N S T R U M E N T S
2013 / 14 2012 / 13
€ million
from
interest
other net
results net result
from
interest
other net
results net result
Loans and receivables 8.1 53.0 61.1 – 20.2 33.0 12.8
Available for sale �nancial assets 1.9 2.1 4.0 – 0.9 1.4 0.5
Financial assets and liabilities held for trading 10.9 – 2.0 8.9 4.9 – 5.6 – 0.7
Financial liabilities at amortised cost – 105.8 – 135.3 – 241.1 – 113.5 20.1 – 93.4
Total – 84.9 – 82.2 – 167.1 – 129.7 48.9 – 80.8
Besides interest income and interest expenses, net results primarily include results from investments, gains and losses on disposal, e§ects of fair value measurements and impairments.
Financial instruments measured at fair value outside pro�t and loss did not give rise to any commission expenses in �nancial year 2013 / 14, just as in the previous year.
N E T T I N G
The following �nancial assets and liabilities are subject to contractual netting arrangements:
O F F S E T T I N G – F I N A N C I A L A S S E T S
Related amounts not set o§ in the
balance sheet
€ million
Gross Amounts
of �nancial
assets
Gross amounts of
recognised �nancial
liabilities set o§
Net amounts of �nancial
assets presented in the
balance sheet
Financial
Instruments
Cash Collateral
received
Net
Amount
Financial assets as at 30 Sep 14
Derivative �nancial assets 247.7 – 247.7 208.4 – 39.3
Cash and cash equivalents 5,863.8 3,577.8 2,286.0 – – 2,286.0
Financial assets as at 30 Sep 13
Derivative �nancial assets 87.0 – 87.0 53.4 – 33.6
Cash and cash equivalents 5,481.9 2,780.2 2,701.7 570.0 – 2,131.7

257Notes to the consolidated statement of §nancial position N O T E S
O F F S E T T I N G – F I N A N C I A L L I A B I L I T I E S
Related amounts not set o§ in the
balance sheet
€ million
Gross Amounts
of �nancial
liabilities
Gross amounts of
recognised �nancial
assets set o§
Net amounts of �nancial
assets presented in the
balance sheet
Financial
Instruments
Cash Collateral
granted
Net
Amount
Financial liabilities as at 30 Sep 14
Derivative �nancial liabilities 262.7 – 262.7 208.4 – 54.3
Financial liabilities 5,040.0 3,577.8 1,462.2 – – 1,462.2
Financial liabilities as at 30 Sep 13
Derivative �nancial liabilities 209.5 – 209.5 53.4 – 156.1
Financial liabilities 5,214.3 2,780.2 2,434.1 587.5 – 1,846.6
Financial assets and �nancial liabilities are only netted in the balance sheet if a legally enforceable right to netting exists and the Company intends to settle on a net basis.
The contracts for �nancial instruments are based on standardised master agreements for �nancial derivatives (including ISDA Master Agreement, German master agreement for �nancial derivatives), creating a conditional right to netting contingent on de�ned future events. Under the contractual agreements all derivatives contracted with the corresponding counterparty with positive or negative fair values are netted in that case, resulting in a net receivable or payable in the amount of the balance. As this conditional right to netting is not enforceable in the course of ordinary business transactions, the derivative �nancial assets and liabilities are carried at their gross amounts in the balance sheet date at the reporting date.
Financial assets and liabilities from a cash pooling agreement of a UK subsidiary are shown on a net basis if there is a right to netting in ordinary business transactions and the Group intends to settle on a net basis.
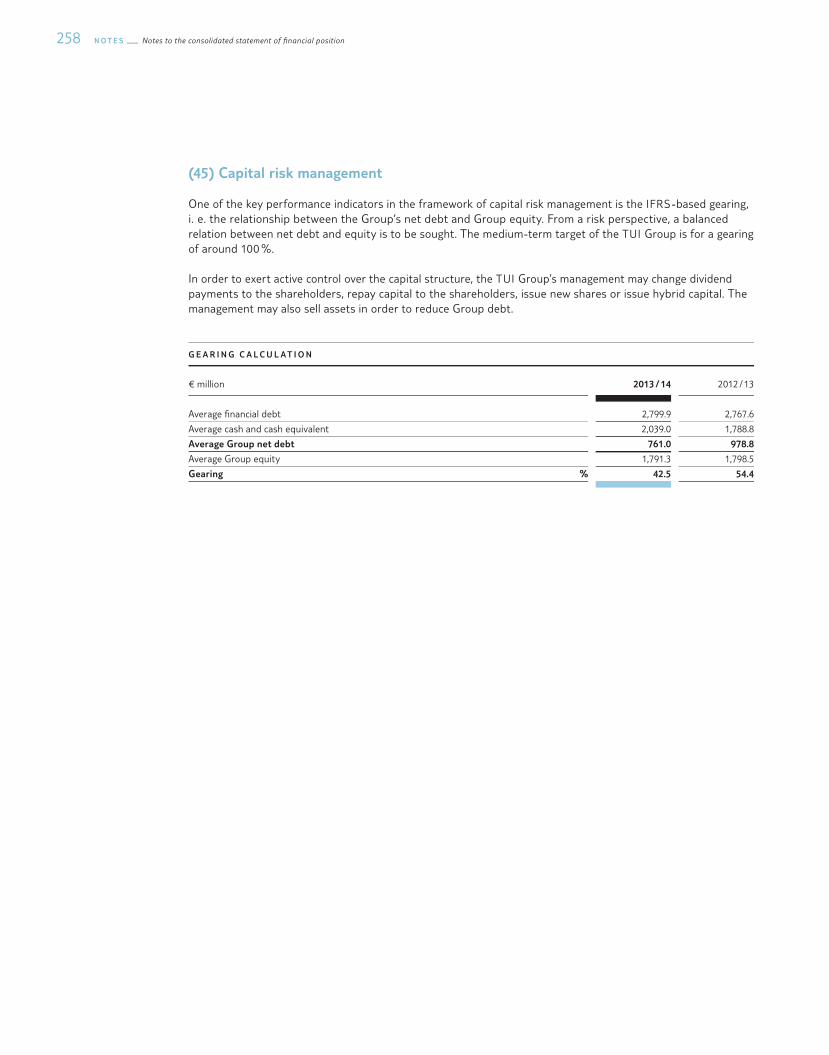
N O T E S Notes to the consolidated statement of §nancial position258
(45) Capital risk management
One of the key performance indicators in the framework of capital risk management is the IFRS-based gearing, i. e. the relationship between the Group’s net debt and Group equity. From a risk perspective, a balanced relation between net debt and equity is to be sought. The medium-term target of the TUI Group is for a gearing of around 100 %.
In order to exert active control over the capital structure, the TUI Group’s management may change dividend payments to the shareholders, repay capital to the shareholders, issue new shares or issue hybrid capital. The management may also sell assets in order to reduce Group debt.
G E A R I N G C A L C U L AT I O N
€ million 2013 / 14 2012 / 13
Average �nancial debt 2,799.9 2,767.6
Average cash and cash equivalent 2,039.0 1,788.8
Average Group net debt 761.0 978.8
Average Group equity 1,791.3 1,798.5
Gearing % 42.5 54.4
259Notes to the cash ²ow statement N O T E S
Notes to the cash ®ow statement
The cash ®ow statement shows the ®ow of cash and cash equivalents on the basis of a separate presentation of cash in®ows and out®ows from operating, investing and �nancing activities. The e§ects of changes in the group of consolidated companies are eliminated.
(46) Cash in³ow / out³ow from operating activities
Based on the Group result after tax, the cash ®ow from operating activities is derived using the indirect method. The cash in®ow from operating activities amounted to € 1,074.7 m (previous year € 875.3 m) in the period under review.
In the period under review, the cash in®ow included interest of € 22.2 m and dividends of € 35.9 m. A cash out®ow of € 189.4 m resulted from income tax payments.
(47) Cash in³ow / out³ow from investing activities
In the �nancial year under review, the cash in®ow from investing activities amounted to € 586.2 m (previous year € 444.3 m) in the period under review.
The cash ®ow from investing activities includes a cash out®ow for capital expenditure related to property, plant and equipment and intangible assets of € 475.9 m for the TUI Travel Sector and € 114.7 m for TUI Hotels & Resorts but also a cash in®ow from the sale of �xed assets of € 271.3 m for the TUI Travel Sector (primarily related to aircraft assets), and € 56.3 m from the sale of property by Central Operations.
The cash out®ow from investments in property, plant and equipment and intangible assets and the cash in®ow from corresponding divestments do not match the additions and disposals shown in the development of �xed assets, which also include non-cash investments and disposals.
In the period under review, a cash out®ow of € 30.7 m resulted from acquisitions of companies to be included in consolidation. This amount includes payments of € 8.3 m for acquisitions made in prior years. Cash and cash equivalents acquired through the acquisitions total € 6.6 m so that the total out®ow of cash amounted to € 24.1 m.
The cash out®ow for investments in other assets comprises shares in a money market fund worth € 300.0 m, held in an escrow account on behalf of TUI AG until the completion of the planned merger with TUI Travel PLC. An amount of € 48.1 m relates to capital increases in companies measured at equity and the acquisition of an associated company by the Riu Group. A cash in®ow of € 37.6 m was generated from the sale of a part of a shareholding, and an in®ow of € 13.5 m from the sale of three consolidated companies.
N O T E S Notes to the cash ²ow statement260
(48) Cash in³ow / out³ow from �nancing activities
The cash out®ow from �nancing activities totalled € 318.9 m (previous year € 620.9 m).
TUI Travel PLC fully repaid the credit facility drawn at the beginning of the reporting period in order to �nance the tourism season. The companies of the TUI Travel Sector also repaid other credits worth € 51.9 m and liabilities from �nance leases of € 31.7 m. The TUI Hotels & Resorts Sector took out loans of € 46.8 m and repaid loans worth € 80.3 m.
In August 2014, TUI AG repaid promissory notes of € 100.0 m carried as liabilities to banks as scheduled. TUI AG recorded an in®ow of € 295.1 m from the issuance of a bond after deduction of the borrowing costs paid in the period under review. Payments for credit facilities of TUI Travel PLC and TUI AG resulted in a cash out®ow of € 19.9 m. The conversions of convertible bonds of TUI AG and TUI Travel PLC in the period under re-view do not have an e§ect on the cash out®ow from �nancing activities.
A further cash out®ow of € 60.9 m relates to the interest on the hybrid capital issued by TUI AG, to be carried as a dividend in line with the IFRS rules, and dividends paid to TUI AG shareholders. In addition, dividends worth € 108.2 m were paid for non-controlling interests, in particular TUI Travel PLC and RIUSA II S.A .
A cash out®ow from capital increases of € 7.7 m relates to the costs of the capital increase in TUI AG by means of a contribution in kind, resolved in the period under review; the cash in®ow from capital increases of € 0.6 m results from the issuance of employee shares in TUI AG.
The cash out®ow from increases in stakes in consolidated companies includes an amount of € 39.4 m paid for own shares by TUI Travel PLC in order to transfer them to employees in the framework of long-term incentive programmes, and € 9.6 m spent in preparing for the acquisition of the stakes of minority shareholders of TUI Travel PLC.
An amount of € 148.0 m was used for interest payments, of which € 10.1 m were capitalised in accordance with IAS 23 and are reported within the chash ®ow from investing activities.
(49) Development of cash and cash equivalents
Cash and cash equivalents comprise all liquid funds, i.e. cash in hand, bank balances and cheques.
As certain amounts from a cash pool agreement are now also included in cash management, a reconciliation is shown from cash and cash equivalents in the cash ®ow statement to cash and cash equivalents as presented in the statement of �nancial position. The e§ect of € 587.5 m is carried as a non-cash change in cash and cash equivalents.
As at 30 September 2014, cash and cash equivalents of € 180.3 m were subject to restraints on disposal. This amount includes € 116.3 m for cash collateral received, which was deposited in an Belgian subsidiary by Belgian tax authorities in the period under review in the framework of long-standing litigation over VAT refunds for the years 2001 to 2011 without inference of guilt, the purpose being to interrupt the accrual of interest for both parties. In order to collateralise a potential repayment, the Belgian government was granted a bank guarantee. Due to the bank guarantee, TUI’s ability to dispose of the cash and cash equivalents has been restricted. The remaining restraints on disposal relate to cash and cash equivalents to be deposited due to legal or regulatory requirements.
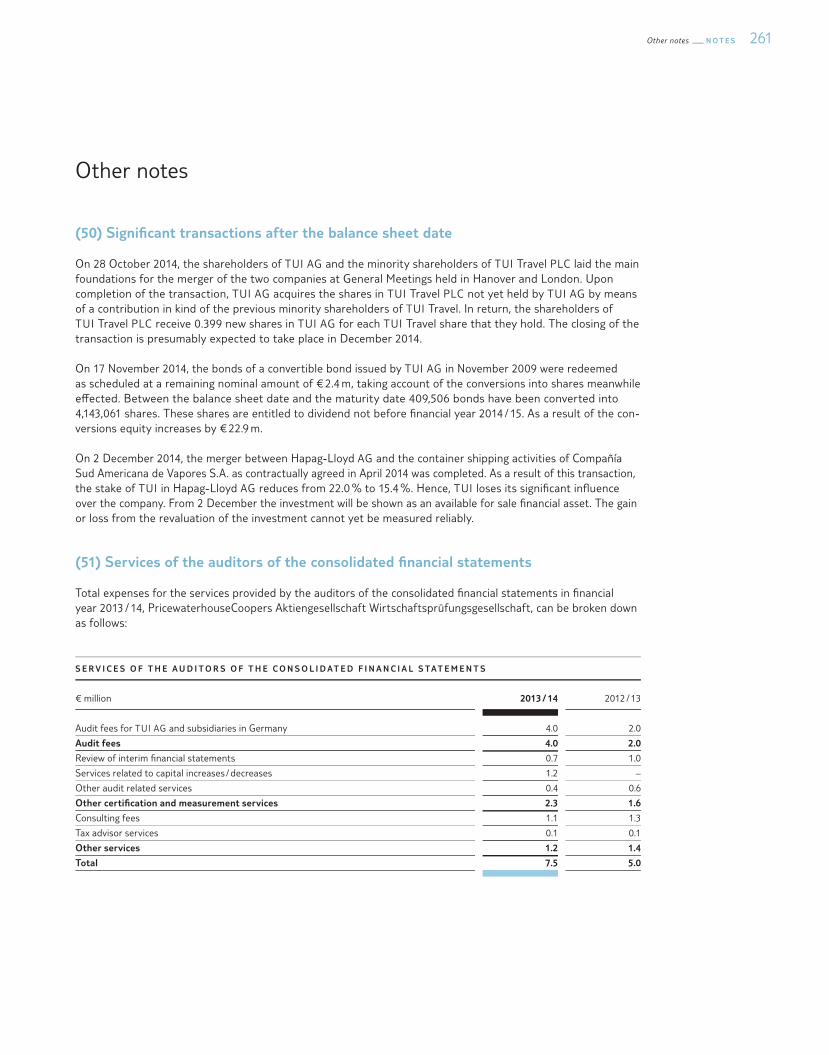
261Other notes N O T E S
Other notes
(50) Signi�cant transactions after the balance sheet date
On 28 October 2014, the shareholders of TUI AG and the minority shareholders of TUI Travel PLC laid the main foundations for the merger of the two companies at General Meetings held in Hanover and London. Upon completion of the transaction, TUI AG acquires the shares in TUI Travel PLC not yet held by TUI AG by means of a contribution in kind of the previous minority shareholders of TUI Travel. In return, the shareholders of TUI Travel PLC receive 0.399 new shares in TUI AG for each TUI Travel share that they hold. The closing of the transaction is presumably expected to take place in December 2014.
On 17 November 2014, the bonds of a convertible bond issued by TUI AG in November 2009 were redeemed as scheduled at a remaining nominal amount of € 2.4 m, taking account of the conversions into shares meanwhile e§ected. Between the balance sheet date and the maturity date 409,506 bonds have been converted into 4,143,061 shares. These shares are entitled to dividend not before �nancial year 2014 / 15. As a result of the con-versions equity increases by € 22.9 m.
On 2 December 2014, the merger between Hapag-Lloyd AG and the container shipping activities of Compañía Sud Americana de Vapores S.A. as contractually agreed in April 2014 was completed. As a result of this transaction, the stake of TUI in Hapag-Lloyd AG reduces from 22.0 % to 15.4 %. Hence, TUI loses its signi�cant in®uence over the company. From 2 December the investment will be shown as an available for sale �nancial asset. The gain or loss from the revaluation of the investment cannot yet be measured reliably.
(51) Services of the auditors of the consolidated �nancial statements
Total expenses for the services provided by the auditors of the consolidated �nancial statements in �nancial year 2013 / 14, PricewaterhouseCoopers Aktiengesellschaft Wirtschaftsprüfungsgesellschaft, can be broken down as follows:
S E R V I C E S O F T H E A U D I T O R S O F T H E C O N S O L I D AT E D F I N A N C I A L S TAT E M E N T S
€ million 2013 / 14 2012 / 13
Audit fees for TUI AG and subsidiaries in Germany 4.0 2.0
Audit fees 4.0 2.0
Review of interim �nancial statements 0.7 1.0
Services related to capital increases / decreases 1.2 –
Other audit related services 0.4 0.6
Other certi�cation and measurement services 2.3 1.6
Consulting fees 1.1 1.3
Tax advisor services 0.1 0.1
Other services 1.2 1.4
Total 7.5 5.0

N O T E S Other notes262
(52) Remuneration of Executive and Supervisory Board members
In the �nancial year under review, total remuneration paid to Executive Board members totalled € 18,398.4 thou-sand (previous year € 13,232.2 thousand).
In the framework of the long-term incentive programme, the Executive Board members received compensation of € 5,799.0 thousand (previous year € 4,051.6 thousand) for the �nancial year under review.
Pension provisions for active Executive Board members for �nancial year 2013 / 14 total € 6,626.2 thousand (previous year € 5,919.2 thousand) as at the balance sheet date.
Mr Long, based in the UK, receives his remuneration from TUI Travel PLC, �xed by its Remuneration Committee.
Total remuneration for Supervisory Board members in the �nancial year under review amounted to € 2,069.1 thou-sand (previous year € 1,719.3 thousand).
Remuneration for former Executive Board members or their surviving dependants totalled € 4,455.8 thousand (previous year € 4,002.4 thousand). Pension obligations for former Executive Board members and their surviving dependants amounted to € 69,626.6 thousand (previous year € 49,587.7 thousand) at the balance sheet date.
Disclosures of the relevant amounts for individual Board members and further details on the remuneration system are provided in the Remuneration Report included in the Management Report.
(53) Exemption from disclosure and preparation of a management report in accordance with section 264 (3) of the German Commercial Code (HGB)
The following German subsidiaries fully included in consolidation have met the condition required under section 264 (3) of the German Commercial Code and were therefore exempted from the requirement to disclose their annual �nancial statements and prepare a management report:
• DEFAG Beteiligungsverwaltungs GmbH I, Hanover• DEFAG Beteiligungsverwaltungs GmbH III , Hanover• Hapag-Lloyd Kreuzfahrten GmbH, Hamburg• Preussag Beteiligungsverwaltungs GmbH IX , Hanover• Preussag Immobilien GmbH, Salzgitter• Robinson Club GmbH, Hanover• TUI Beteiligungs GmbH, Hanover• TUI Connect GmbH, Hanover• TUI Group Services GmbH, Hanover• TUI-Hapag Beteiligungs GmbH, Hanover
(54) Related parties
Apart from the subsidiaries included in the consolidated �nancial statements, TUI AG, in carrying out its ordinary business activities, maintains indirect or direct relationships with related parties. Related parties controlled by the TUI Group or over which the TUI Group is able to exercise a signi�cant in®uence are listed in the list of share-holdings published in the electronic Federal Gazette (www.ebanz.de). Apart from pure equity investments, related parties also include companies that supply goods or provide services for TUI Group companies.
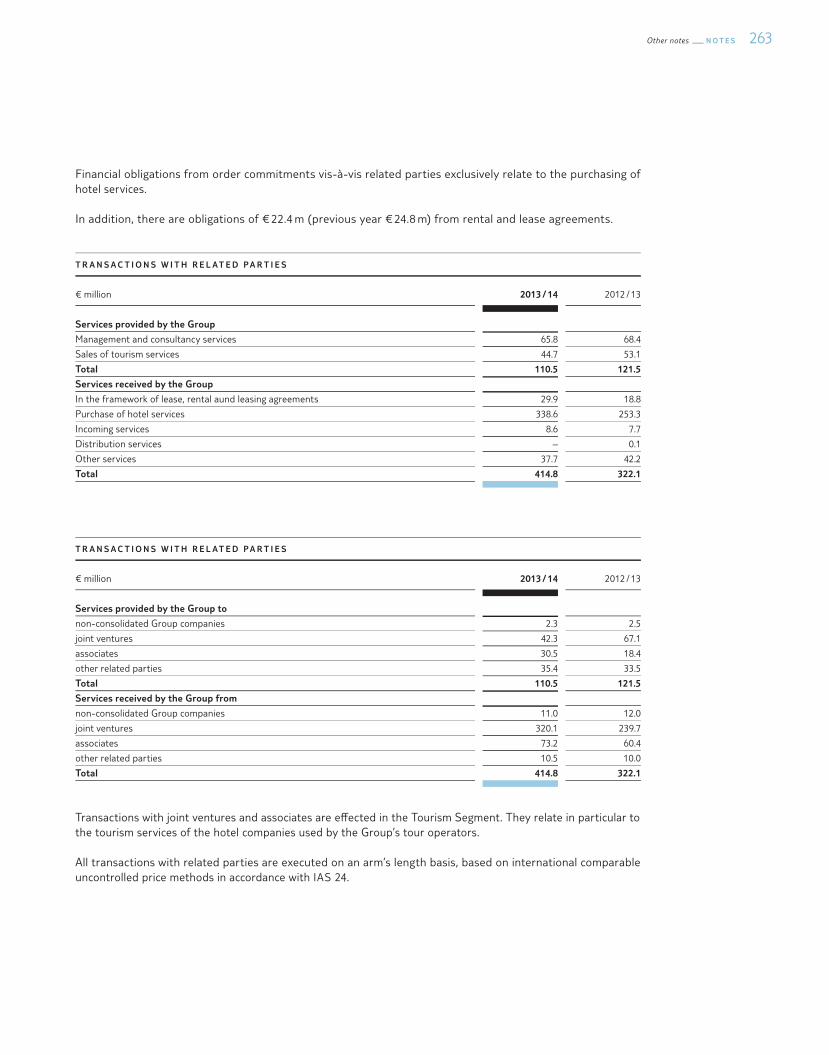
263Other notes N O T E S
Financial obligations from order commitments vis-à-vis related parties exclusively relate to the purchasing of hotel services.
In addition, there are obligations of € 22.4 m (previous year € 24.8 m) from rental and lease agreements.
T R A N S A C T I O N S W I T H R E L AT E D P A R T I E S
€ million 2013 / 14 2012 / 13
Services provided by the Group
Management and consultancy services 65.8 68.4
Sales of tourism services 44.7 53.1
Total 110.5 121.5
Services received by the Group
In the framework of lease, rental aund leasing agreements 29.9 18.8
Purchase of hotel services 338.6 253.3
Incoming services 8.6 7.7
Distribution services – 0.1
Other services 37.7 42.2
Total 414.8 322.1
T R A N S A C T I O N S W I T H R E L AT E D P A R T I E S
€ million 2013 / 14 2012 / 13
Services provided by the Group to
non-consolidated Group companies 2.3 2.5
joint ventures 42.3 67.1
associates 30.5 18.4
other related parties 35.4 33.5
Total 110.5 121.5
Services received by the Group from
non-consolidated Group companies 11.0 12.0
joint ventures 320.1 239.7
associates 73.2 60.4
other related parties 10.5 10.0
Total 414.8 322.1
Transactions with joint ventures and associates are e§ected in the Tourism Segment. They relate in particular to the tourism services of the hotel companies used by the Group’s tour operators.
All transactions with related parties are executed on an arm’s length basis, based on international comparable uncontrolled price methods in accordance with IAS 24.
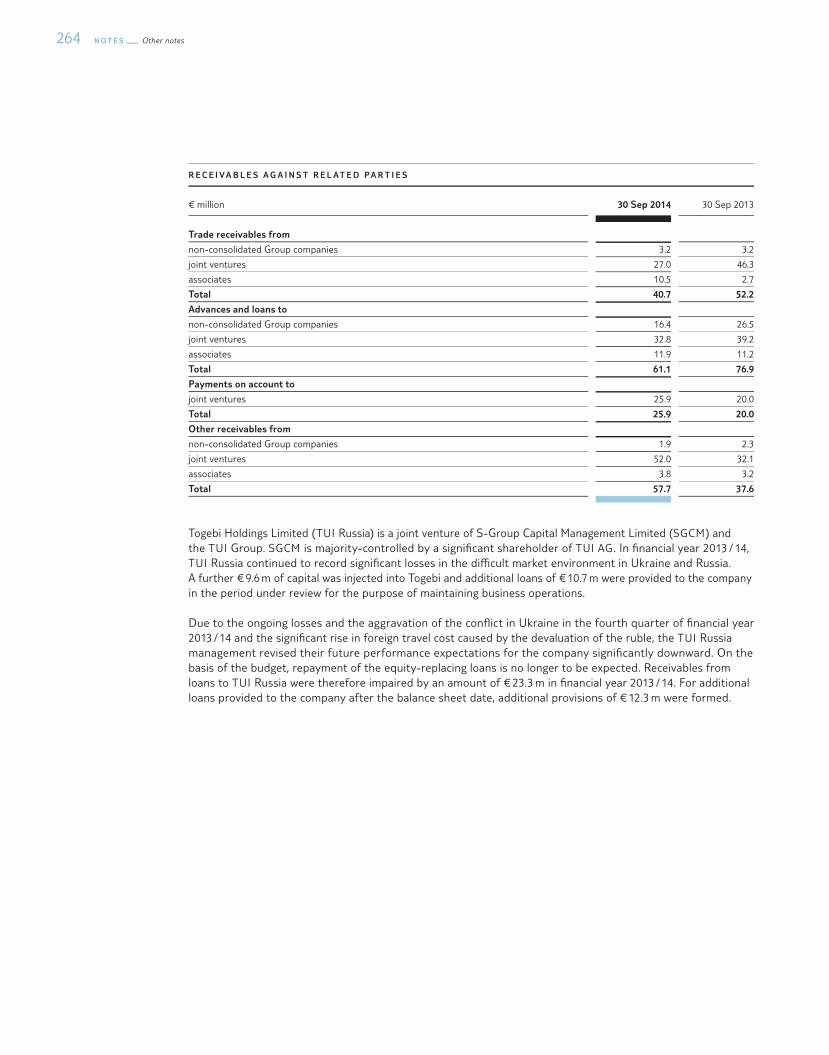
N O T E S Other notes264
R E C E I V A B L E S A G A I N S T R E L AT E D P A R T I E S
€ million 30 Sep 2014 30 Sep 2013
Trade receivables from
non-consolidated Group companies 3.2 3.2
joint ventures 27.0 46.3
associates 10.5 2.7
Total 40.7 52.2
Advances and loans to
non-consolidated Group companies 16.4 26.5
joint ventures 32.8 39.2
associates 11.9 11.2
Total 61.1 76.9
Payments on account to
joint ventures 25.9 20.0
Total 25.9 20.0
Other receivables from
non-consolidated Group companies 1.9 2.3
joint ventures 52.0 32.1
associates 3.8 3.2
Total 57.7 37.6
Togebi Holdings Limited (TUI Russia) is a joint venture of S-Group Capital Management Limited (SGCM) and the TUI Group. SGCM is majority-controlled by a signi�cant shareholder of TUI AG. In �nancial year 2013 / 14, TUI Russia continued to record signi�cant losses in the di¯cult market environment in Ukraine and Russia. A further € 9.6 m of capital was injected into Togebi and additional loans of € 10.7 m were provided to the company in the period under review for the purpose of maintaining business operations.
Due to the ongoing losses and the aggravation of the con®ict in Ukraine in the fourth quarter of �nancial year 2013 / 14 and the signi�cant rise in foreign travel cost caused by the devaluation of the ruble, the TUI Russia management revised their future performance expectations for the company signi�cantly downward. On the basis of the budget, repayment of the equity-replacing loans is no longer to be expected. Receivables from loans to TUI Russia were therefore impaired by an amount of € 23.3 m in �nancial year 2013 / 14. For additional loans provided to the company after the balance sheet date, additional provisions of € 12.3 m were formed.
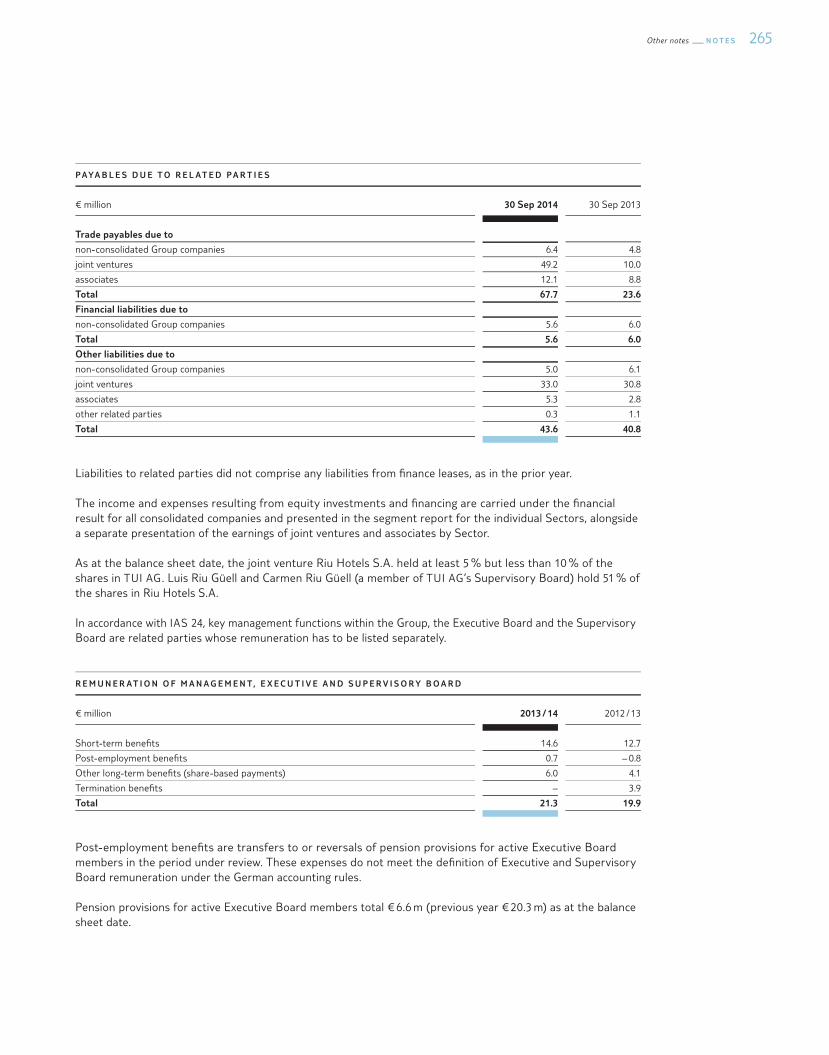
265Other notes N O T E S
P AYA B L E S D U E T O R E L AT E D P A R T I E S
€ million 30 Sep 2014 30 Sep 2013
Trade payables due to
non-consolidated Group companies 6.4 4.8
joint ventures 49.2 10.0
associates 12.1 8.8
Total 67.7 23.6
Financial liabilities due to
non-consolidated Group companies 5.6 6.0
Total 5.6 6.0
Other liabilities due to
non-consolidated Group companies 5.0 6.1
joint ventures 33.0 30.8
associates 5.3 2.8
other related parties 0.3 1.1
Total 43.6 40.8
Liabilities to related parties did not comprise any liabilities from �nance leases, as in the prior year.
The income and expenses resulting from equity investments and �nancing are carried under the �nancial result for all consolidated companies and presented in the segment report for the individual Sectors, alongside a separate presentation of the earnings of joint ventures and associates by Sector.
As at the balance sheet date, the joint venture Riu Hotels S.A. held at least 5 % but less than 10 % of the shares in TUI AG. Luis Riu Güell and Carmen Riu Güell (a member of TUI AG’s Supervisory Board) hold 51 % of the shares in Riu Hotels S.A.
In accordance with IAS 24, key management functions within the Group, the Executive Board and the Supervisory Board are related parties whose remuneration has to be listed separately.
R E M U N E R AT I O N O F M A N A G E M E N T, E X E C U T I V E A N D S U P E R V I S O R Y B O A R D
€ million 2013 / 14 2012 / 13
Short-term bene�ts 14.6 12.7
Post-employment bene�ts 0.7 – 0.8
Other long-term bene�ts (share-based payments) 6.0 4.1
Termination bene�ts – 3.9
Total 21.3 19.9
Post-employment bene�ts are transfers to or reversals of pension provisions for active Executive Board members in the period under review. These expenses do not meet the de�nition of Executive and Supervisory Board remuneration under the German accounting rules.
Pension provisions for active Executive Board members total € 6.6 m (previous year € 20.3 m) as at the balance sheet date.

N O T E S Other notes266
(55) International Financial Reporting Standards (IFRS) and Interpretations (IFRIC)
The following standards and interpretations have already been transposed into EU legislation but are only manda-tory for the TUI Group for annual �nancial statements for period beginning after 30 September 2014:
A M E N D M E N T S TO I A S 32 : F I N A N C I A L I N S T R U M E N T S – P R E S E N TAT I O N
The amendments to IAS 32, issued in December 2011, specify that �nancial assets and �nancial liabilities should be o§set in the statement of �nancial position when, and only when, the entity’s current right of set-o§ is not contingent on a future event and is legally enforceable in the normal course of business but also in the event of default, insolvency or bankruptcy of a counterparty. They also clarify that a gross settlement system is equivalent to net settlement if it has features that eliminate credit and liquidity risk, and process receivables and payables in a single settlement process. TUI does not expect the amendments to have any material e§ects on its consolidated �nancial statements.
In 2011 and 2012, the IASB issued a total of �ve new or revised standards (IFRS 10, IFRS 11, IFRS 12, IAS 27, IAS 28) on group accounting and transition guidance for the �rst-time adoption of the new IFRSs. The key contents of these provisions are outlined below.
I F R S 10 : CO N S O L I DAT E D F I N A N C I A L S TAT E M E N T S
IFRS 10 supersedes the provisions of IAS 27 Consolidated Financial Statements and Accounting for Investments in Subsidiaries, relevant for consolidated �nancial statements, and SIC-12 Consolidation – Special Purpose Entities with a uniform model to consolidate entities based on the concept of control of a parent company over a subsidiary. According to IFRS 10, control requires power over an investee, exposure to variable returns and the ability to a§ect those variable returns through power over an investee. Upon initial application, two entities will be switched from full consolidation to the equity method, as the other owners have the ability to mutually determine and direct certain relevant activities through the management and supervisory bodies. The reallocation does not have a material e§ect on the TUI Group. If IFRS 10 had been applied in �nancial year 2013 / 14, turnover would have been down by € 113.9 m, EBITA by € 3.7 m and Group pro�t by € 0.5 m.
I F R S 11 : J O I N T A R R A N G E M E N T S
IFRS 11 supersedes SIC-13 Jointly Controlled Entities – Non-Monetary Contributions by Venturers and the previous IAS 31 Interests in Joint Ventures. The standard governs the classi�cation and accounting for joint oper-ations and joint ventures. The classi�cation as a joint arrangement is e§ected based on subsidiarity in relation to control under IFRS 10. In the event of a joint arrangement, further classi�cation as either a joint operation or a joint venture depends on the rights and obligations of the partners. Accounting for jointly controlled assets is subject to the rules for joint operations, which thus continue to be recognised on a proportionate basis. By contrast, proportionate consolidation, which was admissible in the past, will now no longer apply to joint ventures under IFRS 11; they must henceforth be consolidated on the basis of the equity method alone. Upon the �rst-time adoption of the standard, three companies will be reclassi�ed as joint ventures. One of the companies has already been accounted for using the equity method. These changes in the group of consolidated companies do not have a material e§ect on TUI ’s consolidated �nancial statements. The elimi nation of propor-tionate consolidation for joint ventures does not have an impact on the TUI Group as joint ventures have already been included in the TUI Group’s consolidated �nancial statements using the equity method.
I F R S 12 : D I S C L O S U R E O F I N T E R E S T S I N O T H E R E N T I T I E S
This new standard pools the disclosure requirements regarding an entity’s interests in subsidiaries, associates, joint arrangements and unconsolidated structured entities. Some of the disclosures required under IFRS 12 go far beyond prior disclosure requirements. In particular, the type of interest, the risks associated with the interest and their impact on the Group’s net assets, �nancial position and results of operations must be made evident.
267Other notes N O T E S
A M E N D M E N T S TO I A S 2 7 : S E PA R AT E F I N A N C I A L S TAT E M E N T S
The revised IAS 27 exclusively governs accounting for interests in subsidiaries, associates and joint ventures and the associated disclosures in the notes to the separate �nancial statements of the parent or investor. The consolidation rules included in the previous version are now included in the newly issued IFRS 10. The amend-ments are of no relevance to TUI as TUI AG does not prepare IFRS-based single-entity �nancial statements according to section 325 (2a) of the German Commercial Code.
A M E N D M E N T TO I A S 2 8 : I N V E S T M E N T S I N A S S O C I AT E S A N D J O I N T V E N T U R E S
The amendments to IAS 28 were issued in June 2011 and require application of the equity method in accounting for investments in associates and joint ventures. This re®ects the TUI Group’s current accounting method. It is also clari�ed that in the event of a sale of a portion of an investment only the portion of the investment actually sold may be carried as held for sale. The remaining portion has to be accounted for using the equity method until the date as of which the investment ceases to have the form of an associate. The �rst-time application of these rules leads to a change in the recognition of the stake in container shipping line Hapag Lloyd AG. If the amend-ments to IAS 28 had already been applied in the period under review, this would have resulted in a decline in Group pro�t of around € 15.2 m and an increase in other comprehensive income of € 32.2 m. The consolidated com-prehensive income would have been € 17.0 m higher.
T R A N S I T I O N G U I DA N C E F O R I F R S 10 , I F R S 11 A N D I F R S 12
The transition guidance published in June 2012 includes relief for �rst-time adopters of the new standards. Adjusted comparative information now only has to be provided for the immediately preceding comparative period. The requirement to disclose comparative information for disclosures relating to unconsolidated structured entities for periods prior to �rst-time application of IFRS 12 has been removed.
The European Commission transposed IFRS 10, IFRS 11 and IFRS 12 as well as the revised IAS 27 and IAS 28 and the transition guidance into European legislation on 28 December 2012. Within the European Union, entities are required to apply the rules for the �rst time for �nancial years beginning on or after 1 January 2014. Due to the �rst-time adoption of IFRS 12, the disclosures in the Notes will be extended.
A M E N D M E N T S TO I F R S 10 , I F R S 12 A N D I A S 2 7 : I N V E S T M E N T E N T I T I E S
The amendments, issued in October 2012, free many investment entities from the future requirement to con-solidate the subsidiaries they control in their consolidated �nancial statements. Instead, they measure the interests held for investing at fair value. Moreover, new disclosure requirements have been introduced for invest-ment entities. These amendments are of no relevance to TUI.
I F R I C 21 : L E V I E S
This interpretation, issued by IFRIC in May 2013, sets out how and when to recognise a liability for a levy imposed by a government other than income taxes under IAS 12. It clari�es that an obligation to pay a levy is to be recognised as soon as the obligating event that triggers the payment of the levy occurs. The interpretation will not have a material e§ect on the TUI Group’s net assets, �nancial position and results of operations.
N O T E S Other notes268
Amendments, standards or interpretations issued by the IASB but not yet transposed into European legislation:
I F R S 9 : F I N A N C I A L I N S T R U M E N T S
Publication of the fourth and �nal version of this new standard in July 2014 marks the completion of the project for the accounting for �nancial instruments, launched by the International Accounting Standards Board in 2008 in response to the �nancial crisis. The new standard supersedes the provisions for the classi�cation and measurement of �nancial assets previously included in IAS 39 Financial Instruments: Recognition and Measure-ment and comprises new rules on hedge accounting. The provisions to determine impairments are replaced by the expected loss model. The standard will be e§ective for annual periods beginning on or after 1 January 2018 as announced by the IASB. The process of transposing the provisions into European legislation is currently still suspended. TUI is investigating the potential impact of the �rst-time application of the standard on the Group’s net assets, �nancial position and results of operations.
A M E N D M E N T S TO I A S 19 : D E F I N E D B E N E F I T P L A N S – E M P L OY E E CO N T R I B U T I O N S
These amendments, published in November 2013, make it clear that contributions paid by employees (or third parties) themselves for de�ned bene�t pension plans and not linked to the length of service may be recognised as a reduction in the service cost in the period in which the related service was rendered. They include, for in-stance, contributions determined as a �xed percentage of the annual remuneration. The amendments will not have a major impact on TUI ’s consolidated �nancial statements.
A N N UA L I M P R OV E M E N T S P R OJ E C T 2 0 10 – 2 0 12
In December 2013, provisions from the annual improvements project were published; they contain amendments to the following seven standards: IFRS 2, IFRS 3, IFRS 8, IFRS 13, IAS 16, IAS 38 and IAS 24. The rules include minor changes to the contents and above all clari�cations of the presentation, recognition and measurement. TUI does not expect the �rst-time application to have a material impact.
A N N UA L I M P R OV E M E N T S P R OJ E C T 2 0 11 – 2 0 13
In December 2013, provisions from the annual improvements project were published; they contain amendments to four standards, including IFRS 3, IFRS 13 and IAS 40. The rules include minor changes to the contents and above all clari�cations of the presentation, recognition and measurement. TUI does not expect the �rst-time application to have a material impact on its consolidated �nancial statements.
I F R S 14 : R E G U L ATO RY D E F E R R A L ACCO U N T S
This standard, issued in January 2014, allows �rst-time adopters of IFRSs to continue to use their current account-ing for regulatory deferral accounts. The standard is of no relevance to the TUI Group.
A M E N D M E N T S TO I F R S 11 : J O I N T A R R A N G E M E N T S
The provisions, issued in May 2014, specify how to account for the acquisition of an interest in a joint operation that constitutes a business operation within the meaning of IFRS 3. Accordingly, the acquirer has to measure identi�able assets and liabilities at fair value, recognise acquisition-related costs as expenses, recognise deferred tax assets and liabilities and capitalise any residual amounts as goodwill. The acquirer also has to observe the disclosure requirements of IFRS 3. The amendments apply prospectively. They are not expected to have a material impact on TUI ’s �nancial statements.
A M E N D M E N T S TO I A S 16 : P R O P E R T Y, P L A N T A N D E Q U I P M E N T & I A S 3 8 : I N TA N G I B L E A S S E T S
The amendments, issued in May 2014, clarify the conditions under which the use of revenue-based methods to calculate the depreciation of property, plant and equipment or amortisation of intangible assets is acceptable. The amendments are of no relevance to TUI as revenue-based depreciation and amortisation methods are not used.
269Other notes N O T E S
A M E N D M E N T S TO I A S 16 : P R O P E R T Y, P L A N T A N D E Q U I P M E N T & I A S 41 : AG R I C U LT U R E
Bearer plants that bear biological assets for more than one period without serving as an agricultural produce themselves, such as grape vines or olive trees, have this far been measured at fair value. The amendments, issued in June 2014, clarify that bearer plants will be treated as property, plant and equipment in the scope of IAS 16 in future and are to be measured at amortised cost. By contrast, the produce growing on the bearer plant will continue to be measured at fair value in accordance with IAS 41. The amendments will not have an impact on TUI ’s consolidated �nancial statements.
A M E N D M E N T S TO I A S 2 7 : S E PA R AT E F I N A N C I A L S TAT E M E N T S – E Q U I T Y M E T H O D I N S E PA R AT E F I N A N -
C I A L S TAT E M E N T S
The amendments, published in August 2014, allow using the equity method in accounting for investments in subsidiaries, jointly controlled entities and associates in separate �nancial statements. The option to measure such investments in accordance with IAS 39 or at cost is retained. The amendments are of no relevance to TUI as TUI does not prepare IFRS-based single-entity �nancial statements according to section 325 (2a) of the German Commercial Code.
A M E N D M E N T S TO I A S 2 8 : I N V E S T M E N T S I N A S S O C I AT E S A N D J O I N T V E N T U R E S
A N D I F R S 10 : CO N S O L I DAT E D F I N A N C I A L S TAT E M E N T S
The amendments, published in September 2014 clarify how the sale or contribution of assets between an investor and its associate or joint venture has to be recognised. The amendments apply on a prospective basis and will be e§ective for annual periods beginning on or after 1 January 2016. TUI is currently investigating the rules and presumes that the amendments will not have a material e§ect on the consolidated �nancial statements.
A N N UA L I M P R OV E M E N T S P R OJ E C T 2 0 12 – 2 0 14
Improvements from the Annual Improvements Project were published in September 2014. They contain amend-ments to four standards: IAS 19, IAS 34, IFRS 5, and IFRS 7. The provisions include to minor changes to the contents and, above all clari�cations of the presentation, recognition and measurement. TUI does not expect the �rst-time application of the amendments to have a material impact on its consolidated �nancial statements.
I F R S 15 : R E V E N U E F R O M CO N T R AC T S W I T H C U S TO M E R S
The standard, issued in May 2014, creates convergence of the provisions on revenue recognition comprised in various standards and interpretations this far. It also establishes a single, comprehensive framework for revenue recognition, to be applied consistently across transactions and industries, specifying the amount and point in time or period over which revenue has to be recognised. IFRS 15 replaces IAS 18 Revenue and IAS 11 Construction Contracts as well as Interpretations IFRIC 13 Customer Loyalty Programmes, IFRIC 15 Agreements for the Construction of Real Estate, IFRIC 18 Transfers of Assets from Customers and SIC 31 Revenue – Barter Trans-actions Involving Advertising Services. TUI will investigate the impact of this standard on its net assets, �nancial position and results of operations in due time.
A decision about endorsement of these amendments or these new standards by the EU is currently still pending.
N O T E S Other notes270
(56) TUI Group Shareholdings
Disclosure of the TUI Group’s shareholdings ist required under section 313 of the German Commercial Trading Act. Comparative information for the prior-year reference period is therefore not provided.
C O M P A N Y C O U N T R Y C A P I TA L S H A R E I N %
Consolidated companies
Tourism – TUI Travel
600035 B.C. LTD, Canada Canada 100
AB Caller & Sons Ltd., Crawley UK 100
Abbey International Insurance PCC Limited, Malta Malta 100
Absolut Holding Limited, Malta Malta 99.9
Absolut Insurance Limited, Guernsey Guernsey 100
Acampora Travel S.r.l., Sorrent Italy 51
Adehy Limited, Dublin Ireland 100
Advantos Brazil Operandora de Turismo LTDA , Rio de Janeiro Brazil 100
Adventure Center (First Choice) Inc, Emeryville, CA United States 100
Adventure Tours Australia Group Pty Ltd, Wayville, SA Australia 100
Adventures Worldwide Limited, Crawley UK 100
Africa Focus Tours Namibia Pty. Ltd., Windhuk Namibia 100
Air Two Thousand (Ireland) Limited, Dublin Ireland 100
Alcor Yachting SA , Geneva Switzerland 100
Alkor Yat Turizm Isletmacileri A.S., Izmir Turkey 99.7
Ambassador Tours S.A., Barcelona Spain 100
Amber Nominee GP Limited, Crawley UK 100
American Holidays (NI) Limited, Belfast UK 100
Americas Corporate Business Services, Inc., New Castle DE United States 100
AMP Management Ltd., Crawley UK 100
Antigua Charter Services, St. John's Antigua and Barbuda 100
Apart Hotel Zarevo EOOD, Varna Bulgaria 100
Aragon Tours Limited, Crawley UK 100
Arccac Eurl, Bourg St. Maurice France 100
AsiaRooms Business Services (Thailand) Co., Ltd, Bangkok Thailand 100
Asiarooms Pte Ltd, Singapore Singapore 100
ATC African Travel Concept Pty. Ltd., Cape Town South Africa 100
ATC Namibian Re®ections Pty. Ltd., Cape Town South Africa 100
atraveo GmbH, Düsseldorf Germany 74.8
Audio Tours and Travel of Hong Kong Limited, Kowloon Hong Kong 99
Australian Sports Tours Pty Ltd, Ballarat, Victoria Australia 100
B.D.S Destination Services Tours, Cairo Egypt 67
BAL Trustee Limited, Crawley UK 100
Beds on line SL , Palma de Mallorca Spain 100
Berge & Meer Touristik GmbH, Rengsdorf Germany 100
Blue Scandinavia Holding AB, Stockholm Sweden 100
Blue Travel Partner Services S.A., Santo Domingo Dominican Republic 99
Boomerang Reisen GmbH, Trier Germany 100
Boomerang Reisen Vermögensverwaltungs GmbH, Trier Germany 75
Brightspark Travel Inc, State of Delaware United States 100
Britannia Airways Limited, Crawley UK 100
Britannia Sweden AB, Stockholm Sweden 100
C & C Yacht Management Limited, Cayman Islands Cayman Islands 100
Callers-Pegasus Pension Trustee Ltd., Crawley UK 100
Callers-Pegasus Travel Service Ltd., Crawley UK 100
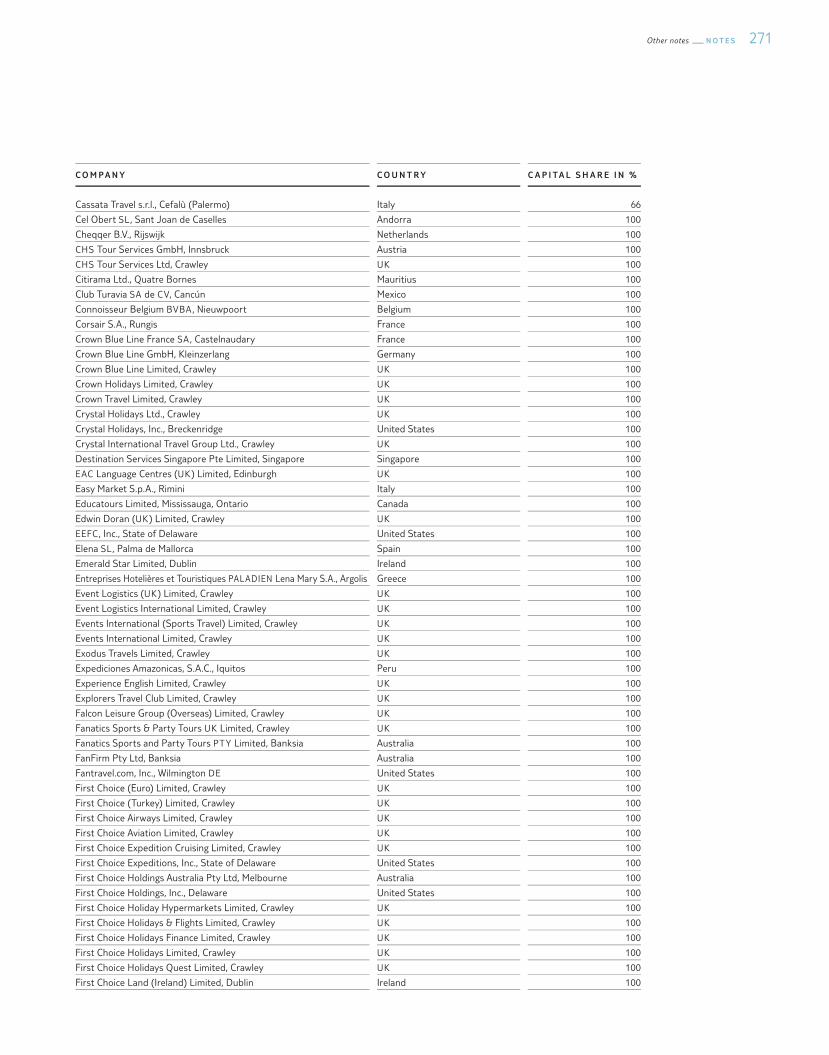
271Other notes N O T E S
C O M P A N Y C O U N T R Y C A P I TA L S H A R E I N %
Cassata Travel s.r.l., Cefalù (Palermo) Italy 66
Cel Obert SL , Sant Joan de Caselles Andorra 100
Cheqqer B.V., Rijswijk Netherlands 100
CHS Tour Services GmbH, Innsbruck Austria 100
CHS Tour Services Ltd, Crawley UK 100
Citirama Ltd., Quatre Bornes Mauritius 100
Club Turavia SA de CV, Cancún Mexico 100
Connoisseur Belgium BVBA , Nieuwpoort Belgium 100
Corsair S.A., Rungis France 100
Crown Blue Line France SA , Castelnaudary France 100
Crown Blue Line GmbH, Kleinzerlang Germany 100
Crown Blue Line Limited, Crawley UK 100
Crown Holidays Limited, Crawley UK 100
Crown Travel Limited, Crawley UK 100
Crystal Holidays Ltd., Crawley UK 100
Crystal Holidays, Inc., Breckenridge United States 100
Crystal International Travel Group Ltd., Crawley UK 100
Destination Services Singapore Pte Limited, Singapore Singapore 100
EAC Language Centres (UK) Limited, Edinburgh UK 100
Easy Market S.p.A., Rimini Italy 100
Educatours Limited, Mississauga, Ontario Canada 100
Edwin Doran (UK) Limited, Crawley UK 100
EEFC, Inc., State of Delaware United States 100
Elena SL , Palma de Mallorca Spain 100
Emerald Star Limited, Dublin Ireland 100
Entreprises Hotelières et Touristiques PALADIEN Lena Mary S.A., Argolis Greece 100
Event Logistics (UK) Limited, Crawley UK 100
Event Logistics International Limited, Crawley UK 100
Events International (Sports Travel) Limited, Crawley UK 100
Events International Limited, Crawley UK 100
Exodus Travels Limited, Crawley UK 100
Expediciones Amazonicas, S.A.C., Iquitos Peru 100
Experience English Limited, Crawley UK 100
Explorers Travel Club Limited, Crawley UK 100
Falcon Leisure Group (Overseas) Limited, Crawley UK 100
Fanatics Sports & Party Tours UK Limited, Crawley UK 100
Fanatics Sports and Party Tours PTY Limited, Banksia Australia 100
FanFirm Pty Ltd, Banksia Australia 100
Fantravel.com, Inc., Wilmington DE United States 100
First Choice (Euro) Limited, Crawley UK 100
First Choice (Turkey) Limited, Crawley UK 100
First Choice Airways Limited, Crawley UK 100
First Choice Aviation Limited, Crawley UK 100
First Choice Expedition Cruising Limited, Crawley UK 100
First Choice Expeditions, Inc., State of Delaware United States 100
First Choice Holdings Australia Pty Ltd, Melbourne Australia 100
First Choice Holdings, Inc., Delaware United States 100
First Choice Holiday Hypermarkets Limited, Crawley UK 100
First Choice Holidays & Flights Limited, Crawley UK 100
First Choice Holidays Finance Limited, Crawley UK 100
First Choice Holidays Limited, Crawley UK 100
First Choice Holidays Quest Limited, Crawley UK 100
First Choice Land (Ireland) Limited, Dublin Ireland 100
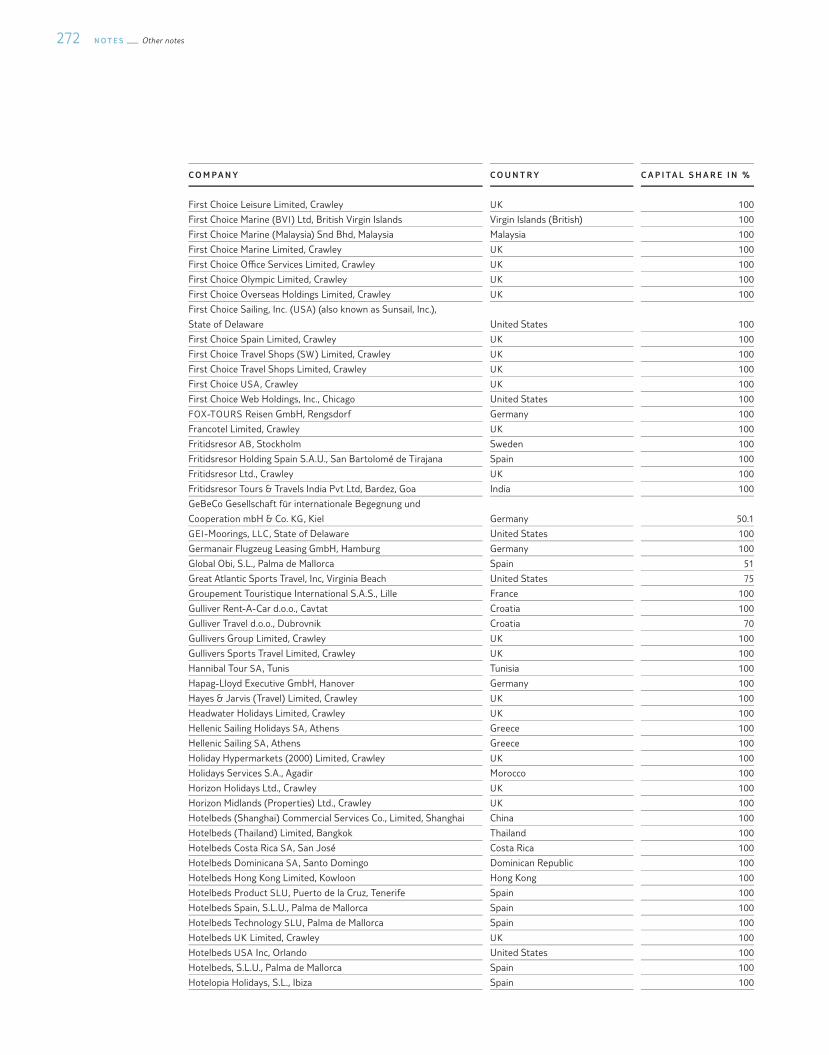
N O T E S Other notes272
C O M P A N Y C O U N T R Y C A P I TA L S H A R E I N %
First Choice Leisure Limited, Crawley UK 100
First Choice Marine (BVI) Ltd, British Virgin Islands Virgin Islands (British) 100
First Choice Marine (Malaysia) Snd Bhd, Malaysia Malaysia 100
First Choice Marine Limited, Crawley UK 100
First Choice O¯ce Services Limited, Crawley UK 100
First Choice Olympic Limited, Crawley UK 100
First Choice Overseas Holdings Limited, Crawley UK 100
First Choice Sailing, Inc. (USA) (also known as Sunsail, Inc.),
State of Delaware United States 100
First Choice Spain Limited, Crawley UK 100
First Choice Travel Shops (SW) Limited, Crawley UK 100
First Choice Travel Shops Limited, Crawley UK 100
First Choice USA , Crawley UK 100
First Choice Web Holdings, Inc., Chicago United States 100
FOX-TOURS Reisen GmbH, Rengsdorf Germany 100
Francotel Limited, Crawley UK 100
Fritidsresor AB, Stockholm Sweden 100
Fritidsresor Holding Spain S.A.U., San Bartolomé de Tirajana Spain 100
Fritidsresor Ltd., Crawley UK 100
Fritidsresor Tours & Travels India Pvt Ltd, Bardez, Goa India 100
GeBeCo Gesellschaft für internationale Begegnung und
Cooperation mbH & Co. KG, Kiel Germany 50.1
GEI-Moorings, LLC , State of Delaware United States 100
Germanair Flugzeug Leasing GmbH, Hamburg Germany 100
Global Obi, S.L., Palma de Mallorca Spain 51
Great Atlantic Sports Travel, Inc, Virginia Beach United States 75
Groupement Touristique International S.A.S., Lille France 100
Gulliver Rent-A-Car d.o.o., Cavtat Croatia 100
Gulliver Travel d.o.o., Dubrovnik Croatia 70
Gullivers Group Limited, Crawley UK 100
Gullivers Sports Travel Limited, Crawley UK 100
Hannibal Tour SA , Tunis Tunisia 100
Hapag-Lloyd Executive GmbH, Hanover Germany 100
Hayes & Jarvis (Travel) Limited, Crawley UK 100
Headwater Holidays Limited, Crawley UK 100
Hellenic Sailing Holidays SA , Athens Greece 100
Hellenic Sailing SA , Athens Greece 100
Holiday Hypermarkets (2000) Limited, Crawley UK 100
Holidays Services S.A., Agadir Morocco 100
Horizon Holidays Ltd., Crawley UK 100
Horizon Midlands (Properties) Ltd., Crawley UK 100
Hotelbeds (Shanghai) Commercial Services Co., Limited, Shanghai China 100
Hotelbeds (Thailand) Limited, Bangkok Thailand 100
Hotelbeds Costa Rica SA , San José Costa Rica 100
Hotelbeds Dominicana SA , Santo Domingo Dominican Republic 100
Hotelbeds Hong Kong Limited, Kowloon Hong Kong 100
Hotelbeds Product SLU, Puerto de la Cruz, Tenerife Spain 100
Hotelbeds Spain, S.L.U., Palma de Mallorca Spain 100
Hotelbeds Technology SLU, Palma de Mallorca Spain 100
Hotelbeds UK Limited, Crawley UK 100
Hotelbeds USA Inc, Orlando United States 100
Hotelbeds, S.L.U., Palma de Mallorca Spain 100
Hotelopia Holidays, S.L., Ibiza Spain 100
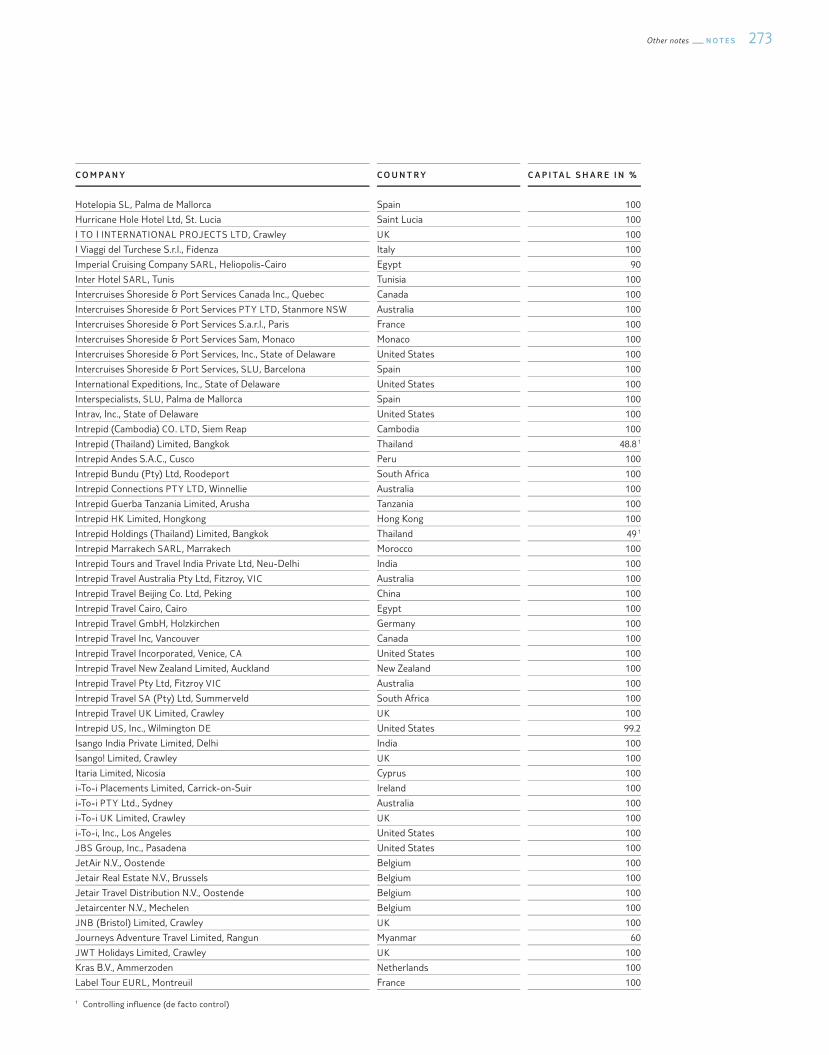
273Other notes N O T E S
C O M P A N Y C O U N T R Y C A P I TA L S H A R E I N %
Hotelopia SL , Palma de Mallorca Spain 100
Hurricane Hole Hotel Ltd, St. Lucia Saint Lucia 100
I TO I INTERNATIONAL PROJECTS LTD, Crawley UK 100
I Viaggi del Turchese S.r.l., Fidenza Italy 100
Imperial Cruising Company SARL, Heliopolis-Cairo Egypt 90
Inter Hotel SARL, Tunis Tunisia 100
Intercruises Shoreside & Port Services Canada Inc., Quebec Canada 100
Intercruises Shoreside & Port Services PTY LTD, Stanmore NSW Australia 100
Intercruises Shoreside & Port Services S.a.r.l., Paris France 100
Intercruises Shoreside & Port Services Sam, Monaco Monaco 100
Intercruises Shoreside & Port Services, Inc., State of Delaware United States 100
Intercruises Shoreside & Port Services, SLU, Barcelona Spain 100
International Expeditions, Inc., State of Delaware United States 100
Interspecialists, SLU, Palma de Mallorca Spain 100
Intrav, Inc., State of Delaware United States 100
Intrepid (Cambodia) CO. LTD, Siem Reap Cambodia 100
Intrepid (Thailand) Limited, Bangkok Thailand 48.8 1
Intrepid Andes S.A.C., Cusco Peru 100
Intrepid Bundu (Pty) Ltd, Roodeport South Africa 100
Intrepid Connections PTY LTD, Winnellie Australia 100
Intrepid Guerba Tanzania Limited, Arusha Tanzania 100
Intrepid HK Limited, Hongkong Hong Kong 100
Intrepid Holdings (Thailand) Limited, Bangkok Thailand 49 1
Intrepid Marrakech SARL, Marrakech Morocco 100
Intrepid Tours and Travel India Private Ltd, Neu-Delhi India 100
Intrepid Travel Australia Pty Ltd, Fitzroy, VIC Australia 100
Intrepid Travel Beijing Co. Ltd, Peking China 100
Intrepid Travel Cairo, Cairo Egypt 100
Intrepid Travel GmbH, Holzkirchen Germany 100
Intrepid Travel Inc, Vancouver Canada 100
Intrepid Travel Incorporated, Venice, CA United States 100
Intrepid Travel New Zealand Limited, Auckland New Zealand 100
Intrepid Travel Pty Ltd, Fitzroy VIC Australia 100
Intrepid Travel SA (Pty) Ltd, Summerveld South Africa 100
Intrepid Travel UK Limited, Crawley UK 100
Intrepid US, Inc., Wilmington DE United States 99.2
Isango India Private Limited, Delhi India 100
Isango! Limited, Crawley UK 100
Itaria Limited, Nicosia Cyprus 100
i-To-i Placements Limited, Carrick-on-Suir Ireland 100
i-To-i PTY Ltd., Sydney Australia 100
i-To-i UK Limited, Crawley UK 100
i-To-i, Inc., Los Angeles United States 100
JBS Group, Inc., Pasadena United States 100
JetAir N.V., Oostende Belgium 100
Jetair Real Estate N.V., Brussels Belgium 100
Jetair Travel Distribution N.V., Oostende Belgium 100
Jetaircenter N.V., Mechelen Belgium 100
JNB (Bristol) Limited, Crawley UK 100
Journeys Adventure Travel Limited, Rangun Myanmar 60
JWT Holidays Limited, Crawley UK 100
Kras B.V., Ammerzoden Netherlands 100
Label Tour EURL, Montreuil France 100
1 Controlling in®uence (de facto control)
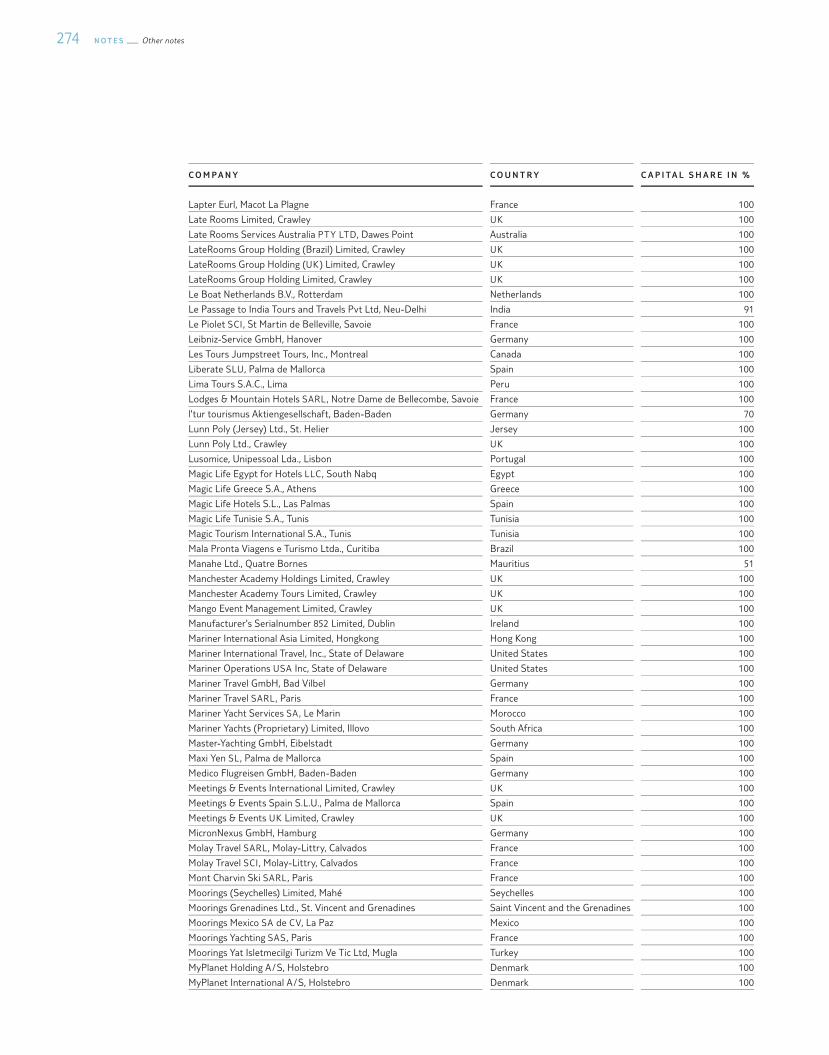
N O T E S Other notes274
C O M P A N Y C O U N T R Y C A P I TA L S H A R E I N %
Lapter Eurl, Macot La Plagne France 100
Late Rooms Limited, Crawley UK 100
Late Rooms Services Australia PTY LTD, Dawes Point Australia 100
LateRooms Group Holding (Brazil) Limited, Crawley UK 100
LateRooms Group Holding (UK) Limited, Crawley UK 100
LateRooms Group Holding Limited, Crawley UK 100
Le Boat Netherlands B.V., Rotterdam Netherlands 100
Le Passage to India Tours and Travels Pvt Ltd, Neu-Delhi India 91
Le Piolet SCI , St Martin de Belleville, Savoie France 100
Leibniz-Service GmbH, Hanover Germany 100
Les Tours Jumpstreet Tours, Inc., Montreal Canada 100
Liberate SLU, Palma de Mallorca Spain 100
Lima Tours S.A.C., Lima Peru 100
Lodges & Mountain Hotels SARL, Notre Dame de Bellecombe, Savoie France 100
l'tur tourismus Aktiengesellschaft, Baden-Baden Germany 70
Lunn Poly (Jersey) Ltd., St. Helier Jersey 100
Lunn Poly Ltd., Crawley UK 100
Lusomice, Unipessoal Lda., Lisbon Portugal 100
Magic Life Egypt for Hotels LLC , South Nabq Egypt 100
Magic Life Greece S.A., Athens Greece 100
Magic Life Hotels S.L., Las Palmas Spain 100
Magic Life Tunisie S.A., Tunis Tunisia 100
Magic Tourism International S.A., Tunis Tunisia 100
Mala Pronta Viagens e Turismo Ltda., Curitiba Brazil 100
Manahe Ltd., Quatre Bornes Mauritius 51
Manchester Academy Holdings Limited, Crawley UK 100
Manchester Academy Tours Limited, Crawley UK 100
Mango Event Management Limited, Crawley UK 100
Manufacturer's Serialnumber 852 Limited, Dublin Ireland 100
Mariner International Asia Limited, Hongkong Hong Kong 100
Mariner International Travel, Inc., State of Delaware United States 100
Mariner Operations USA Inc, State of Delaware United States 100
Mariner Travel GmbH, Bad Vilbel Germany 100
Mariner Travel SARL, Paris France 100
Mariner Yacht Services SA , Le Marin Morocco 100
Mariner Yachts (Proprietary) Limited, Illovo South Africa 100
Master-Yachting GmbH, Eibelstadt Germany 100
Maxi Yen SL , Palma de Mallorca Spain 100
Medico Flugreisen GmbH, Baden-Baden Germany 100
Meetings & Events International Limited, Crawley UK 100
Meetings & Events Spain S.L.U., Palma de Mallorca Spain 100
Meetings & Events UK Limited, Crawley UK 100
MicronNexus GmbH, Hamburg Germany 100
Molay Travel SARL, Molay-Littry, Calvados France 100
Molay Travel SCI , Molay-Littry, Calvados France 100
Mont Charvin Ski SARL, Paris France 100
Moorings (Seychelles) Limited, Mahé Seychelles 100
Moorings Grenadines Ltd., St. Vincent and Grenadines Saint Vincent and the Grenadines 100
Moorings Mexico SA de CV, La Paz Mexico 100
Moorings Yachting SAS, Paris France 100
Moorings Yat Isletmecilgi Turizm Ve Tic Ltd, Mugla Turkey 100
MyPlanet Holding A / S, Holstebro Denmark 100
MyPlanet International A / S, Holstebro Denmark 100
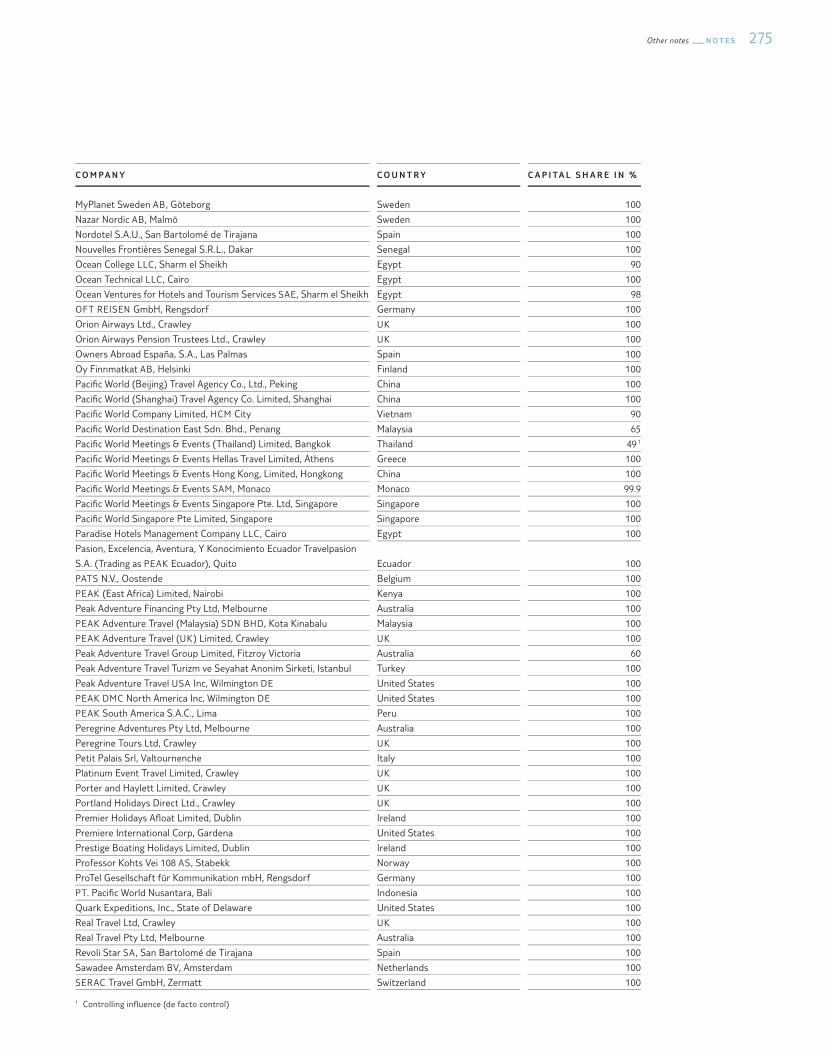
275Other notes N O T E S
C O M P A N Y C O U N T R Y C A P I TA L S H A R E I N %
MyPlanet Sweden AB, Göteborg Sweden 100
Nazar Nordic AB, Malmö Sweden 100
Nordotel S.A.U., San Bartolomé de Tirajana Spain 100
Nouvelles Frontières Senegal S.R.L., Dakar Senegal 100
Ocean College LLC , Sharm el Sheikh Egypt 90
Ocean Technical LLC , Cairo Egypt 100
Ocean Ventures for Hotels and Tourism Services SAE, Sharm el Sheikh Egypt 98
OFT REISEN GmbH, Rengsdorf Germany 100
Orion Airways Ltd., Crawley UK 100
Orion Airways Pension Trustees Ltd., Crawley UK 100
Owners Abroad España, S.A., Las Palmas Spain 100
Oy Finnmatkat AB, Helsinki Finland 100
Paci�c World (Beijing) Travel Agency Co., Ltd., Peking China 100
Paci�c World (Shanghai) Travel Agency Co. Limited, Shanghai China 100
Paci�c World Company Limited, HCM City Vietnam 90
Paci�c World Destination East Sdn. Bhd., Penang Malaysia 65
Paci�c World Meetings & Events (Thailand) Limited, Bangkok Thailand 49 1
Paci�c World Meetings & Events Hellas Travel Limited, Athens Greece 100
Paci�c World Meetings & Events Hong Kong, Limited, Hongkong China 100
Paci�c World Meetings & Events SAM, Monaco Monaco 99.9
Paci�c World Meetings & Events Singapore Pte. Ltd, Singapore Singapore 100
Paci�c World Singapore Pte Limited, Singapore Singapore 100
Paradise Hotels Management Company LLC , Cairo Egypt 100
Pasion, Excelencia, Aventura, Y Konocimiento Ecuador Travelpasion
S.A. (Trading as PEAK Ecuador), Quito Ecuador 100
PATS N.V., Oostende Belgium 100
PEAK (East Africa) Limited, Nairobi Kenya 100
Peak Adventure Financing Pty Ltd, Melbourne Australia 100
PEAK Adventure Travel (Malaysia) SDN BHD, Kota Kinabalu Malaysia 100
PEAK Adventure Travel (UK) Limited, Crawley UK 100
Peak Adventure Travel Group Limited, Fitzroy Victoria Australia 60
Peak Adventure Travel Turizm ve Seyahat Anonim Sirketi, Istanbul Turkey 100
Peak Adventure Travel USA Inc, Wilmington DE United States 100
PEAK DMC North America Inc, Wilmington DE United States 100
PEAK South America S.A.C., Lima Peru 100
Peregrine Adventures Pty Ltd, Melbourne Australia 100
Peregrine Tours Ltd, Crawley UK 100
Petit Palais Srl, Valtournenche Italy 100
Platinum Event Travel Limited, Crawley UK 100
Porter and Haylett Limited, Crawley UK 100
Portland Holidays Direct Ltd., Crawley UK 100
Premier Holidays A®oat Limited, Dublin Ireland 100
Premiere International Corp, Gardena United States 100
Prestige Boating Holidays Limited, Dublin Ireland 100
Professor Kohts Vei 108 AS, Stabekk Norway 100
ProTel Gesellschaft für Kommunikation mbH, Rengsdorf Germany 100
PT. Paci�c World Nusantara, Bali Indonesia 100
Quark Expeditions, Inc., State of Delaware United States 100
Real Travel Ltd, Crawley UK 100
Real Travel Pty Ltd, Melbourne Australia 100
Revoli Star SA , San Bartolomé de Tirajana Spain 100
Sawadee Amsterdam BV, Amsterdam Netherlands 100
SERAC Travel GmbH, Zermatt Switzerland 100
1 Controlling in®uence (de facto control)
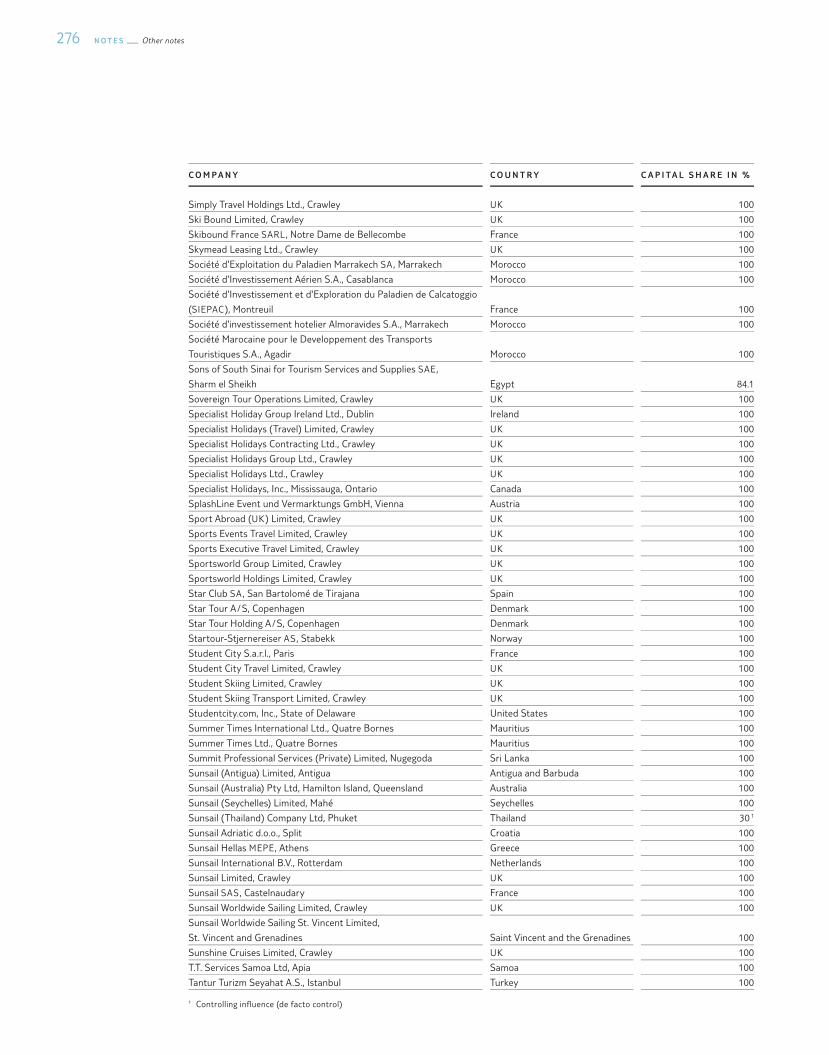
N O T E S Other notes276
C O M P A N Y C O U N T R Y C A P I TA L S H A R E I N %
Simply Travel Holdings Ltd., Crawley UK 100
Ski Bound Limited, Crawley UK 100
Skibound France SARL, Notre Dame de Bellecombe France 100
Skymead Leasing Ltd., Crawley UK 100
Société d'Exploitation du Paladien Marrakech SA , Marrakech Morocco 100
Société d'Investissement Aérien S.A., Casablanca Morocco 100
Société d'Investissement et d'Exploration du Paladien de Calcatoggio
(SIEPAC), Montreuil France 100
Société d'investissement hotelier Almoravides S.A., Marrakech Morocco 100
Société Marocaine pour le Developpement des Transports
Touristiques S.A., Agadir Morocco 100
Sons of South Sinai for Tourism Services and Supplies SAE,
Sharm el Sheikh Egypt 84.1
Sovereign Tour Operations Limited, Crawley UK 100
Specialist Holiday Group Ireland Ltd., Dublin Ireland 100
Specialist Holidays (Travel) Limited, Crawley UK 100
Specialist Holidays Contracting Ltd., Crawley UK 100
Specialist Holidays Group Ltd., Crawley UK 100
Specialist Holidays Ltd., Crawley UK 100
Specialist Holidays, Inc., Mississauga, Ontario Canada 100
SplashLine Event und Vermarktungs GmbH, Vienna Austria 100
Sport Abroad (UK) Limited, Crawley UK 100
Sports Events Travel Limited, Crawley UK 100
Sports Executive Travel Limited, Crawley UK 100
Sportsworld Group Limited, Crawley UK 100
Sportsworld Holdings Limited, Crawley UK 100
Star Club SA , San Bartolomé de Tirajana Spain 100
Star Tour A / S, Copenhagen Denmark 100
Star Tour Holding A / S, Copenhagen Denmark 100
Startour-Stjernereiser AS, Stabekk Norway 100
Student City S.a.r.l., Paris France 100
Student City Travel Limited, Crawley UK 100
Student Skiing Limited, Crawley UK 100
Student Skiing Transport Limited, Crawley UK 100
Studentcity.com, Inc., State of Delaware United States 100
Summer Times International Ltd., Quatre Bornes Mauritius 100
Summer Times Ltd., Quatre Bornes Mauritius 100
Summit Professional Services (Private) Limited, Nugegoda Sri Lanka 100
Sunsail (Antigua) Limited, Antigua Antigua and Barbuda 100
Sunsail (Australia) Pty Ltd, Hamilton Island, Queensland Australia 100
Sunsail (Seychelles) Limited, Mahé Seychelles 100
Sunsail (Thailand) Company Ltd, Phuket Thailand 30 1
Sunsail Adriatic d.o.o., Split Croatia 100
Sunsail Hellas MEPE, Athens Greece 100
Sunsail International B.V., Rotterdam Netherlands 100
Sunsail Limited, Crawley UK 100
Sunsail SAS, Castelnaudary France 100
Sunsail Worldwide Sailing Limited, Crawley UK 100
Sunsail Worldwide Sailing St. Vincent Limited,
St. Vincent and Grenadines Saint Vincent and the Grenadines 100
Sunshine Cruises Limited, Crawley UK 100
T.T. Services Samoa Ltd, Apia Samoa 100
Tantur Turizm Seyahat A.S., Istanbul Turkey 100
1 Controlling in®uence (de facto control)
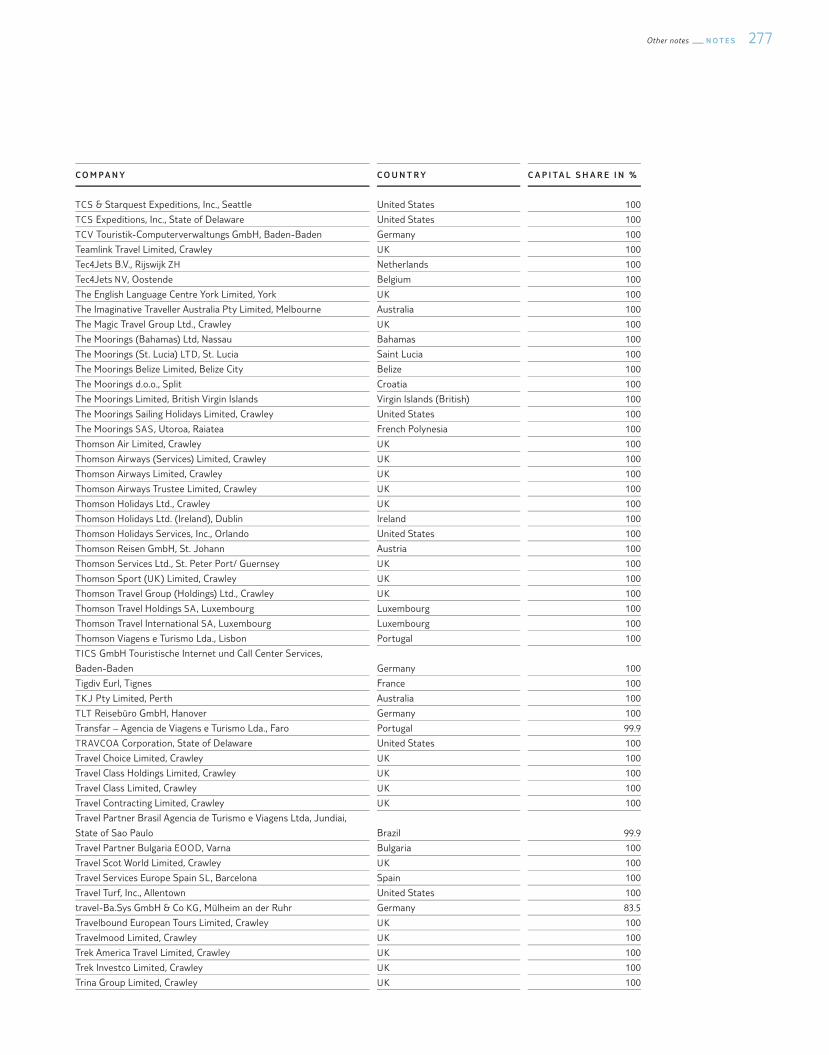
277Other notes N O T E S
C O M P A N Y C O U N T R Y C A P I TA L S H A R E I N %
TCS & Starquest Expeditions, Inc., Seattle United States 100
TCS Expeditions, Inc., State of Delaware United States 100
TCV Touristik-Computerverwaltungs GmbH, Baden-Baden Germany 100
Teamlink Travel Limited, Crawley UK 100
Tec4Jets B.V., Rijswijk ZH Netherlands 100
Tec4Jets NV, Oostende Belgium 100
The English Language Centre York Limited, York UK 100
The Imaginative Traveller Australia Pty Limited, Melbourne Australia 100
The Magic Travel Group Ltd., Crawley UK 100
The Moorings (Bahamas) Ltd, Nassau Bahamas 100
The Moorings (St. Lucia) LTD, St. Lucia Saint Lucia 100
The Moorings Belize Limited, Belize City Belize 100
The Moorings d.o.o., Split Croatia 100
The Moorings Limited, British Virgin Islands Virgin Islands (British) 100
The Moorings Sailing Holidays Limited, Crawley United States 100
The Moorings SAS, Utoroa, Raiatea French Polynesia 100
Thomson Air Limited, Crawley UK 100
Thomson Airways (Services) Limited, Crawley UK 100
Thomson Airways Limited, Crawley UK 100
Thomson Airways Trustee Limited, Crawley UK 100
Thomson Holidays Ltd., Crawley UK 100
Thomson Holidays Ltd. (Ireland), Dublin Ireland 100
Thomson Holidays Services, Inc., Orlando United States 100
Thomson Reisen GmbH, St. Johann Austria 100
Thomson Services Ltd., St. Peter Port/ Guernsey UK 100
Thomson Sport (UK) Limited, Crawley UK 100
Thomson Travel Group (Holdings) Ltd., Crawley UK 100
Thomson Travel Holdings SA , Luxembourg Luxembourg 100
Thomson Travel International SA , Luxembourg Luxembourg 100
Thomson Viagens e Turismo Lda., Lisbon Portugal 100
TICS GmbH Touristische Internet und Call Center Services,
Baden-Baden Germany 100
Tigdiv Eurl, Tignes France 100
TKJ Pty Limited, Perth Australia 100
TLT Reisebüro GmbH, Hanover Germany 100
Transfar – Agencia de Viagens e Turismo Lda., Faro Portugal 99.9
TRAVCOA Corporation, State of Delaware United States 100
Travel Choice Limited, Crawley UK 100
Travel Class Holdings Limited, Crawley UK 100
Travel Class Limited, Crawley UK 100
Travel Contracting Limited, Crawley UK 100
Travel Partner Brasil Agencia de Turismo e Viagens Ltda, Jundiai,
State of Sao Paulo Brazil 99.9
Travel Partner Bulgaria EOOD, Varna Bulgaria 100
Travel Scot World Limited, Crawley UK 100
Travel Services Europe Spain SL , Barcelona Spain 100
Travel Turf, Inc., Allentown United States 100
travel-Ba.Sys GmbH & Co KG, Mülheim an der Ruhr Germany 83.5
Travelbound European Tours Limited, Crawley UK 100
Travelmood Limited, Crawley UK 100
Trek America Travel Limited, Crawley UK 100
Trek Investco Limited, Crawley UK 100
Trina Group Limited, Crawley UK 100
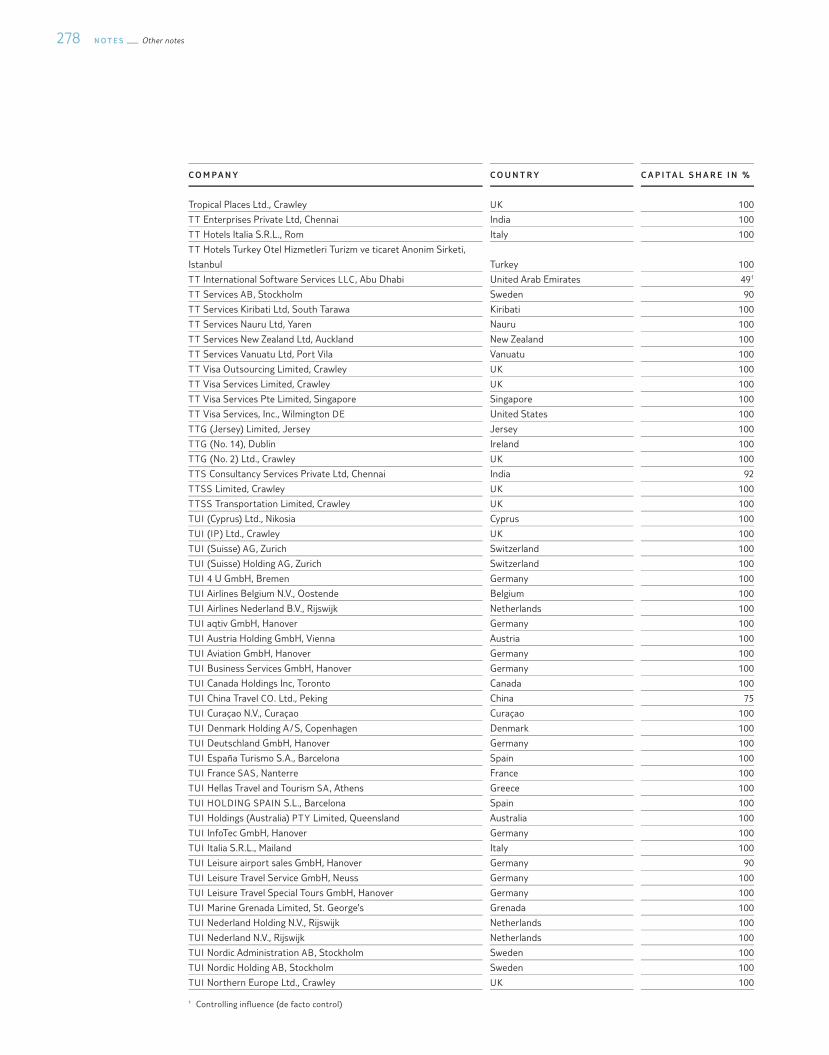
N O T E S Other notes278
C O M P A N Y C O U N T R Y C A P I TA L S H A R E I N %
Tropical Places Ltd., Crawley UK 100
TT Enterprises Private Ltd, Chennai India 100
TT Hotels Italia S.R.L., Rom Italy 100
TT Hotels Turkey Otel Hizmetleri Turizm ve ticaret Anonim Sirketi,
Istanbul Turkey 100
TT International Software Services LLC , Abu Dhabi United Arab Emirates 49 1
TT Services AB, Stockholm Sweden 90
TT Services Kiribati Ltd, South Tarawa Kiribati 100
TT Services Nauru Ltd, Yaren Nauru 100
TT Services New Zealand Ltd, Auckland New Zealand 100
TT Services Vanuatu Ltd, Port Vila Vanuatu 100
TT Visa Outsourcing Limited, Crawley UK 100
TT Visa Services Limited, Crawley UK 100
TT Visa Services Pte Limited, Singapore Singapore 100
TT Visa Services, Inc., Wilmington DE United States 100
TTG (Jersey) Limited, Jersey Jersey 100
TTG (No. 14), Dublin Ireland 100
TTG (No. 2) Ltd., Crawley UK 100
TTS Consultancy Services Private Ltd, Chennai India 92
TTSS Limited, Crawley UK 100
TTSS Transportation Limited, Crawley UK 100
TUI (Cyprus) Ltd., Nikosia Cyprus 100
TUI (IP) Ltd., Crawley UK 100
TUI (Suisse) AG, Zurich Switzerland 100
TUI (Suisse) Holding AG, Zurich Switzerland 100
TUI 4 U GmbH, Bremen Germany 100
TUI Airlines Belgium N.V., Oostende Belgium 100
TUI Airlines Nederland B.V., Rijswijk Netherlands 100
TUI aqtiv GmbH, Hanover Germany 100
TUI Austria Holding GmbH, Vienna Austria 100
TUI Aviation GmbH, Hanover Germany 100
TUI Business Services GmbH, Hanover Germany 100
TUI Canada Holdings Inc, Toronto Canada 100
TUI China Travel CO. Ltd., Peking China 75
TUI Curaçao N.V., Curaçao Curaçao 100
TUI Denmark Holding A / S, Copenhagen Denmark 100
TUI Deutschland GmbH, Hanover Germany 100
TUI España Turismo S.A., Barcelona Spain 100
TUI France SAS, Nanterre France 100
TUI Hellas Travel and Tourism SA , Athens Greece 100
TUI HOLDING SPAIN S.L., Barcelona Spain 100
TUI Holdings (Australia) PTY Limited, Queensland Australia 100
TUI InfoTec GmbH, Hanover Germany 100
TUI Italia S.R.L., Mailand Italy 100
TUI Leisure airport sales GmbH, Hanover Germany 90
TUI Leisure Travel Service GmbH, Neuss Germany 100
TUI Leisure Travel Special Tours GmbH, Hanover Germany 100
TUI Marine Grenada Limited, St. George's Grenada 100
TUI Nederland Holding N.V., Rijswijk Netherlands 100
TUI Nederland N.V., Rijswijk Netherlands 100
TUI Nordic Administration AB, Stockholm Sweden 100
TUI Nordic Holding AB, Stockholm Sweden 100
TUI Northern Europe Ltd., Crawley UK 100
1 Controlling in®uence (de facto control)
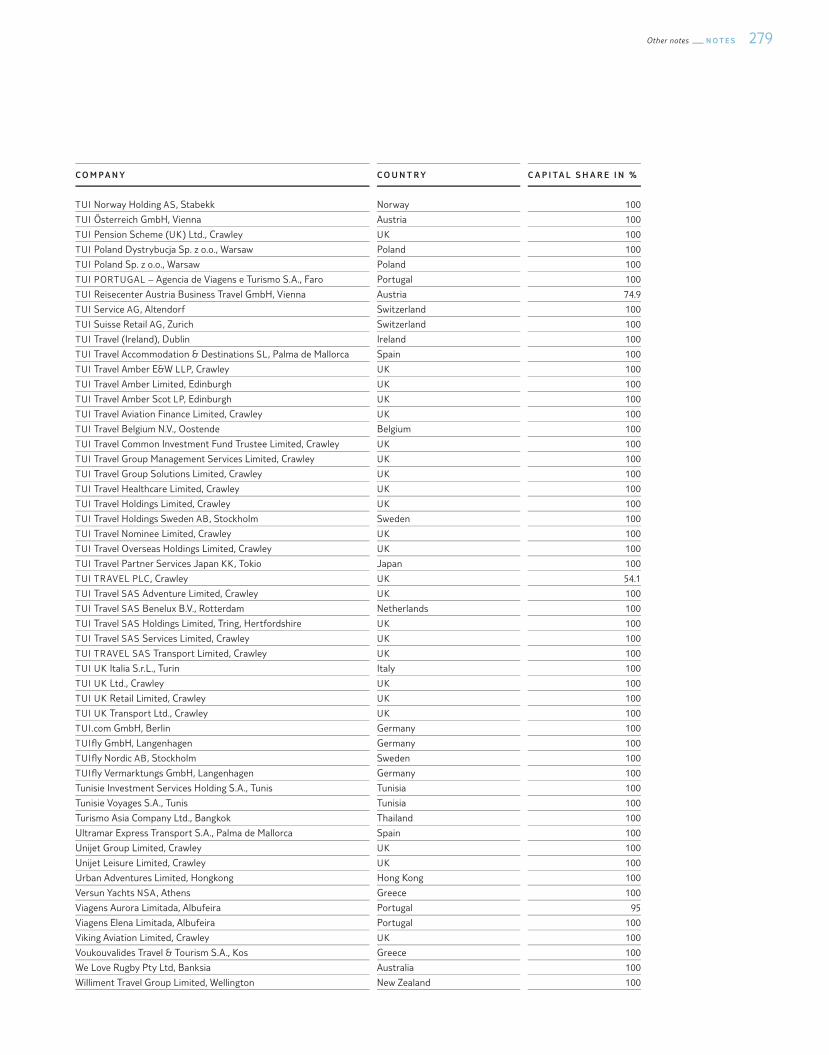
279Other notes N O T E S
C O M P A N Y C O U N T R Y C A P I TA L S H A R E I N %
TUI Norway Holding AS, Stabekk Norway 100
TUI Österreich GmbH, Vienna Austria 100
TUI Pension Scheme (UK) Ltd., Crawley UK 100
TUI Poland Dystrybucja Sp. z o.o., Warsaw Poland 100
TUI Poland Sp. z o.o., Warsaw Poland 100
TUI PORTUGAL – Agencia de Viagens e Turismo S.A., Faro Portugal 100
TUI Reisecenter Austria Business Travel GmbH, Vienna Austria 74.9
TUI Service AG, Altendorf Switzerland 100
TUI Suisse Retail AG, Zurich Switzerland 100
TUI Travel (Ireland), Dublin Ireland 100
TUI Travel Accommodation & Destinations SL , Palma de Mallorca Spain 100
TUI Travel Amber E&W LLP, Crawley UK 100
TUI Travel Amber Limited, Edinburgh UK 100
TUI Travel Amber Scot LP, Edinburgh UK 100
TUI Travel Aviation Finance Limited, Crawley UK 100
TUI Travel Belgium N.V., Oostende Belgium 100
TUI Travel Common Investment Fund Trustee Limited, Crawley UK 100
TUI Travel Group Management Services Limited, Crawley UK 100
TUI Travel Group Solutions Limited, Crawley UK 100
TUI Travel Healthcare Limited, Crawley UK 100
TUI Travel Holdings Limited, Crawley UK 100
TUI Travel Holdings Sweden AB, Stockholm Sweden 100
TUI Travel Nominee Limited, Crawley UK 100
TUI Travel Overseas Holdings Limited, Crawley UK 100
TUI Travel Partner Services Japan KK , Tokio Japan 100
TUI TRAVEL PLC, Crawley UK 54.1
TUI Travel SAS Adventure Limited, Crawley UK 100
TUI Travel SAS Benelux B.V., Rotterdam Netherlands 100
TUI Travel SAS Holdings Limited, Tring, Hertfordshire UK 100
TUI Travel SAS Services Limited, Crawley UK 100
TUI TRAVEL SAS Transport Limited, Crawley UK 100
TUI UK Italia S.r.L., Turin Italy 100
TUI UK Ltd., Crawley UK 100
TUI UK Retail Limited, Crawley UK 100
TUI UK Transport Ltd., Crawley UK 100
TUI.com GmbH, Berlin Germany 100
TUI®y GmbH, Langenhagen Germany 100
TUI®y Nordic AB, Stockholm Sweden 100
TUI®y Vermarktungs GmbH, Langenhagen Germany 100
Tunisie Investment Services Holding S.A., Tunis Tunisia 100
Tunisie Voyages S.A., Tunis Tunisia 100
Turismo Asia Company Ltd., Bangkok Thailand 100
Ultramar Express Transport S.A., Palma de Mallorca Spain 100
Unijet Group Limited, Crawley UK 100
Unijet Leisure Limited, Crawley UK 100
Urban Adventures Limited, Hongkong Hong Kong 100
Versun Yachts NSA , Athens Greece 100
Viagens Aurora Limitada, Albufeira Portugal 95
Viagens Elena Limitada, Albufeira Portugal 100
Viking Aviation Limited, Crawley UK 100
Voukouvalides Travel & Tourism S.A., Kos Greece 100
We Love Rugby Pty Ltd, Banksia Australia 100
Williment Travel Group Limited, Wellington New Zealand 100
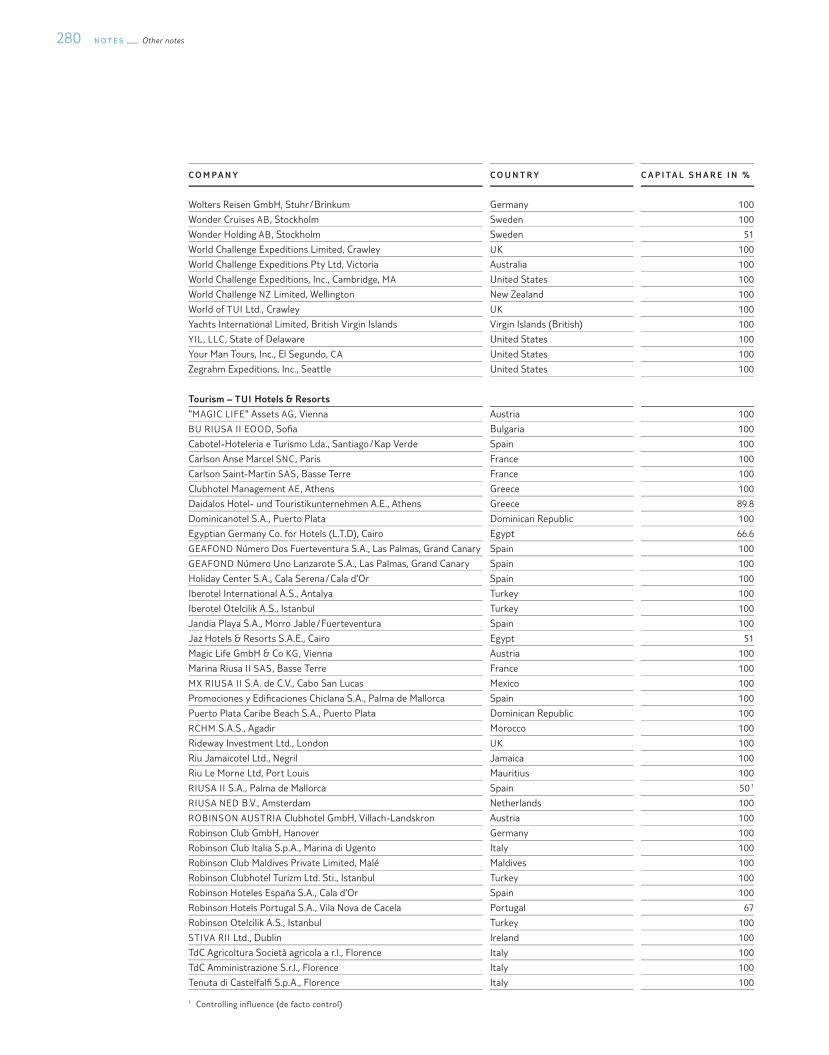
N O T E S Other notes280
C O M P A N Y C O U N T R Y C A P I TA L S H A R E I N %
Wolters Reisen GmbH, Stuhr / Brinkum Germany 100
Wonder Cruises AB, Stockholm Sweden 100
Wonder Holding AB, Stockholm Sweden 51
World Challenge Expeditions Limited, Crawley UK 100
World Challenge Expeditions Pty Ltd, Victoria Australia 100
World Challenge Expeditions, Inc., Cambridge, MA United States 100
World Challenge NZ Limited, Wellington New Zealand 100
World of TUI Ltd., Crawley UK 100
Yachts International Limited, British Virgin Islands Virgin Islands (British) 100
YIL , LLC , State of Delaware United States 100
Your Man Tours, Inc., El Segundo, CA United States 100
Zegrahm Expeditions, Inc., Seattle United States 100
Tourism – TUI Hotels & Resorts
"MAGIC LIFE" Assets AG, Vienna Austria 100
BU RIUSA II EOOD, So�a Bulgaria 100
Cabotel-Hoteleria e Turismo Lda., Santiago / Kap Verde Spain 100
Carlson Anse Marcel SNC, Paris France 100
Carlson Saint-Martin SAS, Basse Terre France 100
Clubhotel Management AE, Athens Greece 100
Daidalos Hotel- und Touristikunternehmen A.E., Athens Greece 89.8
Dominicanotel S.A., Puerto Plata Dominican Republic 100
Egyptian Germany Co. for Hotels (L.T.D), Cairo Egypt 66.6
GEAFOND Número Dos Fuerteventura S.A., Las Palmas, Grand Canary Spain 100
GEAFOND Número Uno Lanzarote S.A., Las Palmas, Grand Canary Spain 100
Holiday Center S.A., Cala Serena / Cala d'Or Spain 100
Iberotel International A.S., Antalya Turkey 100
Iberotel Otelcilik A.S., Istanbul Turkey 100
Jandia Playa S.A., Morro Jable / Fuerteventura Spain 100
Jaz Hotels & Resorts S.A.E., Cairo Egypt 51
Magic Life GmbH & Co KG, Vienna Austria 100
Marina Riusa II SAS, Basse Terre France 100
MX RIUSA II S.A. de C.V., Cabo San Lucas Mexico 100
Promociones y Edi�caciones Chiclana S.A., Palma de Mallorca Spain 100
Puerto Plata Caribe Beach S.A., Puerto Plata Dominican Republic 100
RCHM S.A.S., Agadir Morocco 100
Rideway Investment Ltd., London UK 100
Riu Jamaicotel Ltd., Negril Jamaica 100
Riu Le Morne Ltd, Port Louis Mauritius 100
RIUSA II S.A., Palma de Mallorca Spain 50 1
RIUSA NED B.V., Amsterdam Netherlands 100
ROBINSON AUSTRIA Clubhotel GmbH, Villach-Landskron Austria 100
Robinson Club GmbH, Hanover Germany 100
Robinson Club Italia S.p.A., Marina di Ugento Italy 100
Robinson Club Maldives Private Limited, Malé Maldives 100
Robinson Clubhotel Turizm Ltd. Sti., Istanbul Turkey 100
Robinson Hoteles España S.A., Cala d'Or Spain 100
Robinson Hotels Portugal S.A., Vila Nova de Cacela Portugal 67
Robinson Otelcilik A.S., Istanbul Turkey 100
STIVA RII Ltd., Dublin Ireland 100
TdC Agricoltura Società agricola a r.l., Florence Italy 100
TdC Amministrazione S.r.l., Florence Italy 100
Tenuta di Castelfal� S.p.A., Florence Italy 100
1 Controlling in®uence (de facto control)
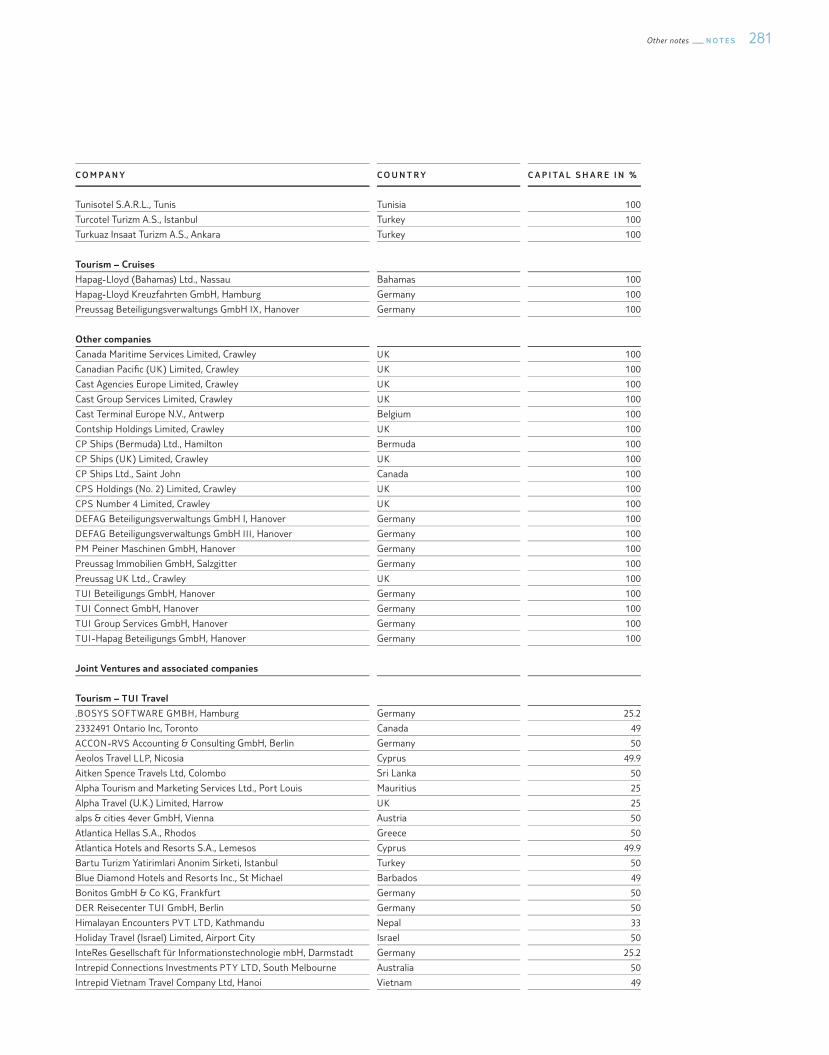
281Other notes N O T E S
C O M P A N Y C O U N T R Y C A P I TA L S H A R E I N %
Tunisotel S.A.R.L., Tunis Tunisia 100
Turcotel Turizm A.S., Istanbul Turkey 100
Turkuaz Insaat Turizm A.S., Ankara Turkey 100
Tourism – Cruises
Hapag-Lloyd (Bahamas) Ltd., Nassau Bahamas 100
Hapag-Lloyd Kreuzfahrten GmbH, Hamburg Germany 100
Preussag Beteiligungsverwaltungs GmbH IX , Hanover Germany 100
Other companies
Canada Maritime Services Limited, Crawley UK 100
Canadian Paci�c (UK) Limited, Crawley UK 100
Cast Agencies Europe Limited, Crawley UK 100
Cast Group Services Limited, Crawley UK 100
Cast Terminal Europe N.V., Antwerp Belgium 100
Contship Holdings Limited, Crawley UK 100
CP Ships (Bermuda) Ltd., Hamilton Bermuda 100
CP Ships (UK) Limited, Crawley UK 100
CP Ships Ltd., Saint John Canada 100
CPS Holdings (No. 2) Limited, Crawley UK 100
CPS Number 4 Limited, Crawley UK 100
DEFAG Beteiligungsverwaltungs GmbH I, Hanover Germany 100
DEFAG Beteiligungsverwaltungs GmbH III , Hanover Germany 100
PM Peiner Maschinen GmbH, Hanover Germany 100
Preussag Immobilien GmbH, Salzgitter Germany 100
Preussag UK Ltd., Crawley UK 100
TUI Beteiligungs GmbH, Hanover Germany 100
TUI Connect GmbH, Hanover Germany 100
TUI Group Services GmbH, Hanover Germany 100
TUI-Hapag Beteiligungs GmbH, Hanover Germany 100
Joint Ventures and associated companies
Tourism – TUI Travel
.BOSYS SOFTWARE GMBH, Hamburg Germany 25.2
2332491 Ontario Inc, Toronto Canada 49
ACCON-RVS Accounting & Consulting GmbH, Berlin Germany 50
Aeolos Travel LLP, Nicosia Cyprus 49.9
Aitken Spence Travels Ltd, Colombo Sri Lanka 50
Alpha Tourism and Marketing Services Ltd., Port Louis Mauritius 25
Alpha Travel (U.K.) Limited, Harrow UK 25
alps & cities 4ever GmbH, Vienna Austria 50
Atlantica Hellas S.A., Rhodos Greece 50
Atlantica Hotels and Resorts S.A., Lemesos Cyprus 49.9
Bartu Turizm Yatirimlari Anonim Sirketi, Istanbul Turkey 50
Blue Diamond Hotels and Resorts Inc., St Michael Barbados 49
Bonitos GmbH & Co KG, Frankfurt Germany 50
DER Reisecenter TUI GmbH, Berlin Germany 50
Himalayan Encounters PVT LTD, Kathmandu Nepal 33
Holiday Travel (Israel) Limited, Airport City Israel 50
InteRes Gesellschaft für Informationstechnologie mbH, Darmstadt Germany 25.2
Intrepid Connections Investments PTY LTD, South Melbourne Australia 50
Intrepid Vietnam Travel Company Ltd, Hanoi Vietnam 49
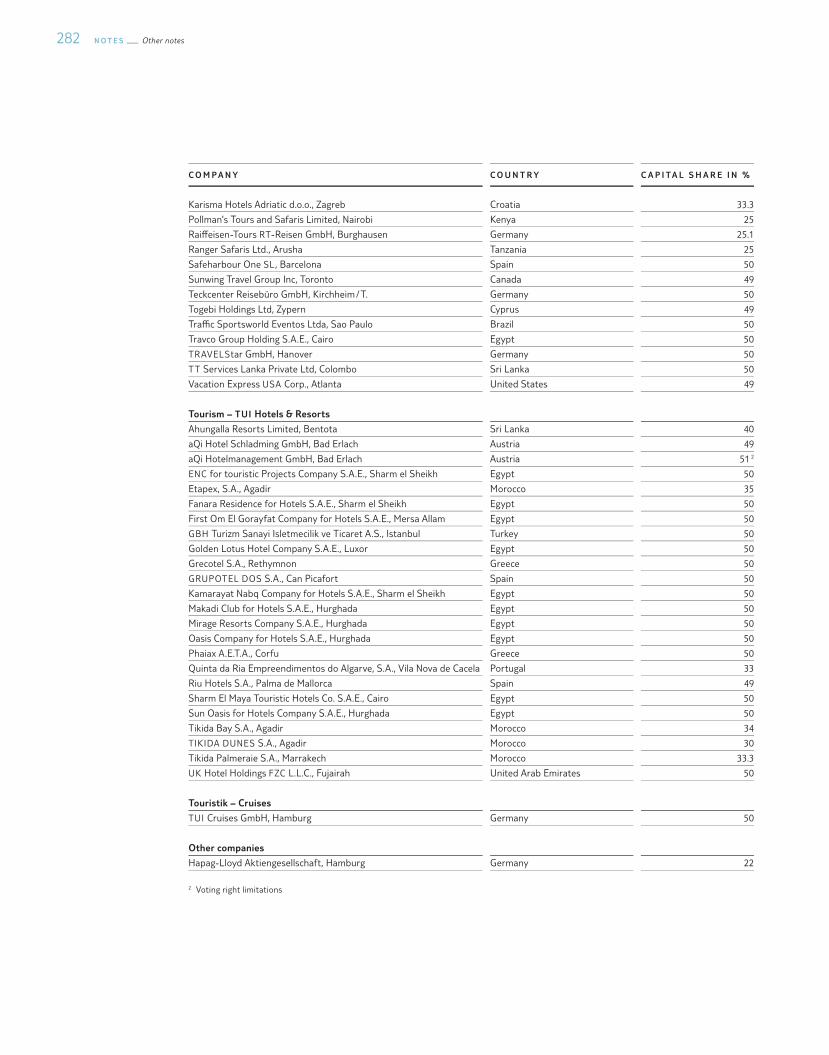
N O T E S Other notes282
C O M P A N Y C O U N T R Y C A P I TA L S H A R E I N %
Karisma Hotels Adriatic d.o.o., Zagreb Croatia 33.3
Pollman's Tours and Safaris Limited, Nairobi Kenya 25
Rai§eisen-Tours RT-Reisen GmbH, Burghausen Germany 25.1
Ranger Safaris Ltd., Arusha Tanzania 25
Safeharbour One SL , Barcelona Spain 50
Sunwing Travel Group Inc, Toronto Canada 49
Teckcenter Reisebüro GmbH, Kirchheim / T. Germany 50
Togebi Holdings Ltd, Zypern Cyprus 49
Tra¯c Sportsworld Eventos Ltda, Sao Paulo Brazil 50
Travco Group Holding S.A.E., Cairo Egypt 50
TRAVELStar GmbH, Hanover Germany 50
TT Services Lanka Private Ltd, Colombo Sri Lanka 50
Vacation Express USA Corp., Atlanta United States 49
Tourism – TUI Hotels & Resorts
Ahungalla Resorts Limited, Bentota Sri Lanka 40
aQi Hotel Schladming GmbH, Bad Erlach Austria 49
aQi Hotelmanagement GmbH, Bad Erlach Austria 51 2
ENC for touristic Projects Company S.A.E., Sharm el Sheikh Egypt 50
Etapex, S.A., Agadir Morocco 35
Fanara Residence for Hotels S.A.E., Sharm el Sheikh Egypt 50
First Om El Gorayfat Company for Hotels S.A.E., Mersa Allam Egypt 50
GBH Turizm Sanayi Isletmecilik ve Ticaret A.S., Istanbul Turkey 50
Golden Lotus Hotel Company S.A.E., Luxor Egypt 50
Grecotel S.A., Rethymnon Greece 50
GRUPOTEL DOS S.A., Can Picafort Spain 50
Kamarayat Nabq Company for Hotels S.A.E., Sharm el Sheikh Egypt 50
Makadi Club for Hotels S.A.E., Hurghada Egypt 50
Mirage Resorts Company S.A.E., Hurghada Egypt 50
Oasis Company for Hotels S.A.E., Hurghada Egypt 50
Phaiax A.E.T.A., Corfu Greece 50
Quinta da Ria Empreendimentos do Algarve, S.A., Vila Nova de Cacela Portugal 33
Riu Hotels S.A., Palma de Mallorca Spain 49
Sharm El Maya Touristic Hotels Co. S.A.E., Cairo Egypt 50
Sun Oasis for Hotels Company S.A.E., Hurghada Egypt 50
Tikida Bay S.A., Agadir Morocco 34
TIKIDA DUNES S.A., Agadir Morocco 30
Tikida Palmeraie S.A., Marrakech Morocco 33.3
UK Hotel Holdings FZC L.L.C., Fujairah United Arab Emirates 50
Touristik – Cruises
TUI Cruises GmbH, Hamburg Germany 50
Other companies
Hapag-Lloyd Aktiengesellschaft, Hamburg Germany 22
2 Voting right limitations
283Responsibility statement by management
R E S P O N S I B I L I T Y S TAT E M E N T BY M A N A G E M E N T
To the best of our knowledge, and in accordance with the applicable reporting principles, the consolidated �nancial statements give a true and fair view of the net assets, �nancial position and results of operations of the Group, and the Group Management Report includes a fair review of the development and performance of the business and the position of the Group, together with a description of the principal opportunities and risks associated with the expected development of the Group.
Hanover, 8 December 2014
The Executive Board
Joussen Baier Long
284 Independent Auditors’ Report
I N D E P E N D E N T A U D I TO R ’ S R E P O R T
To TUI AG, Berlin and Hanover
R E P O R T O N T H E CO N S O L I DAT E D F I N A N C I A L S TAT E M E N T S
We have audited the accompanying consolidated �nancial statements of TUI AG, Berlin and Hanover, and its subsidiaries, which comprise the consolidated statement of �nancial position, the consolidated income state-ment, the consolidated statement of comprehensive income, the consolidated statement of changes in equity, the consolidated statement of cash ®ows and the notes to the consolidated �nancial statements for the busi-ness year from 1 October 2013 to 30 September 2014.
B OA R D O F M A N AG I N G D I R E C TO R S ’ R E S P O N S I B I L I T Y F O R T H E CO N S O L I DAT E D F I N A N C I A L S TAT E M E N T S
The Board of Managing Directors of TUI AG, Berlin and Hanover, is responsible for the preparation of these consolidated �nancial statements. This responsibility includes that these consolidated �nancial statements are prepared in accordance with International Financial Reporting Standards, as adopted by the EU, and the addi-tional requirements of German commercial law pursuant to § (Article) 315a Abs. (paragraph) 1 HGB (“Handels-gesetzbuch”: German Commercial Code) and that these consolidated �nancial statements give a true and fair view of the net assets, �nancial position and results of operations of the group in accordance with these require-ments. The Board of Managing Directors is also responsible for the internal controls as the Board of Managing Directors determines are necessary to enable the preparation of consolidated �nancial statements that are free from material misstatement, whether due to fraud or error.
AU D I TO R ’ S R E S P O N S I B I L I T Y
Our responsibility is to express an opinion on these consolidated �nancial statements based on our audit. We conducted our audit in accordance with § 317 HGB and German generally accepted standards for the audit of �nancial statements promulgated by the Institut der Wirtschaftsprüfer (Institute of Public Auditors in Ger-many) (IDW) and additionally observed the International Standards on Auditing (ISA). Accordingly, we are required to comply with ethical requirements and plan and perform the audit to obtain reasonable assurance about whether the consolidated �nancial statements are free from material misstatement.
An audit involves performing audit procedures to obtain audit evidence about the amounts and disclosures in the consolidated �nancial statements. The selection of audit procedures depends on the auditor’s professional judgment. This includes the assessment of the risks of material misstatement of the consolidated �nancial statements, whether due to fraud or error. In assessing those risks, the auditor considers the internal control system relevant to the entity’s preparation of consolidated �nancial statements that give a true and fair view. The aim of this is to plan and perform audit procedures that are appropriate in the given circumstances, but not for the purpose of expressing an opinion on the e§ectiveness of the group’s internal control system. An audit also includes evaluating the appropriateness of accounting policies used and the reasonableness of accounting estimates made by the Board of Managing Directors, as well as evaluating the overall presentation of the con-solidated �nancial statements.
We believe that the audit evidence we have obtained is su¯cient and appropriate to provide a basis for our audit opinion.
285Independent Auditors’ Report
AU D I T O P I N I O N
According to § 322 Abs. 3 Satz (sentence) 1 HGB, we state that our audit of the consolidated �nancial statements has not led to any reservations.
In our opinion based on the �ndings of our audit, the consolidated �nancial statements comply, in all material respects, with IFRSs, as adopted by the EU, and the additional requirements of German commercial law pursuant to § 315a Abs. 1 HGB and give a true and fair view of the net assets and �nancial position of the Group as at 30 September 2013 as well as the results of operations for the business year then ended, in accordance with these requirements.
R E P O R T O N T H E G R O U P M A N AG E M E N T R E P O R T
We have audited the accompanying group management report, which is combined with the management report of the company, of TUI AG, Berlin and Hanover, for the business year from 1 October 2013 to 30 Septem-ber 2014. The Board of Managing Directors is of TUI AG, Berlin and Hanover, is responsible for the preparation of the combined management report in accordance with the requirements of German commercial law appli-cable pursuant to § 315a Abs. 1 HGB. We conducted our audit in accordance with § 317 Abs. 2 HGB and German generally accepted standards for the audit of the combined management report promulgated by the Institut der Wirtschaftsprüfer (Institute of Public Auditors in Germany) (IDW). Accordingly, we are required to plan and perform the audit of the combined management report to obtain reasonable assurance about whether the combined management report is consistent with the consolidated �nancial statements and the audit �ndings, as a whole provides a suitable view of the Group’s position and suitably presents the opportunities and risks of future development.
According to § 322 Abs. 3 Satz 1 HGB we state, that our audit of the combined management report has not led to any reservations.
In our opinion based on the �ndings of our audit of the consolidated �nancial statements and combined manage-ment report, the combined management report is consistent with the consolidated �nancial statements, as a whole provides a suitable view of the Group’s position and suitably presents the opportunities and risks of future development.
Hanover, 8 December 2014
PricewaterhouseCoopers Aktiengesellschaft Wirtschaftsprüfungsgesellschaft
Thomas Stieve Wirtschaftsprüfer (German Public Auditor)
Prof. Dr Mathias Schellhorn Wirtschaftsprüfer (German Public Auditor)
286 Forward-looking Statements
F O R WA R D - LO O K I N G S TAT E M E N T S
The annual report, in particular the report on expected developments included in the management report, in-cludes various forecasts and expectations as well as statements relating to the future development of the TUI Group and TUI AG. These statements are based on assumptions and estimates and may entail known and unknown risks and uncertainties. Actual development and results as well as the �nancial and asset situation may therefore di§er substantially from the expectations and assumptions made. This may be due to market ®uc-tuations, the development of world market prices for commodities, of �nancial markets and exchange rates, amendments to national and international legislation and provision or fundamental changes in the economic and political environment. TUI does not intend to and does not undertake an obligation to update or revise any forward-looking statements to adapt them to events or developments after the publication of this annual report.
Executive Board con�rmations
The statements in the section entitled Overall Assessment by the Executive Board and Report (page 140 – 146) on the Expected Development constitute pro�t forecasts published by TUI AG for the purposes of the City Code on Takeovers and Mergers. Such statements are “forward-looking statements”, which are prospective in nature. Such statements are based on current assumptions, expectations and projections about future events, and are therefore subject to known and unknown risks and uncertainties which could cause actual results to di§er materially from the future results expressed or implied by such statements.
In accordance with the City Code on Takeovers and Mergers, the members of the Executive Board (Vorstand) of TUI AG con�rm that each such pro�t estimate and pro�t forecast is valid, has been properly compiled on the basis of the assumptions stated and the basis of accounting used is consistent with TUI AG’s accounting policies. Peter Long, as CEO of TUI Travel PLC is not participating in the Executive Board (Vorstand) of TUI AG for the purposes of the possible all-share nil-premium merger with TUI Travel or the giving of these con�rmations.