03 financial ratio analyses 05
DESCRIPTION
Financial Ratio Analyses IntroductionTRANSCRIPT

Financial Statements AnalysisRatio Analyses
Dilip Thosar
July2014
Slide no. 1July 21, 2014
`̀̀̀
Any student of military strategy would tell you that in order to attack a position, you should have a ratio of approximately 3 to 1 in favor of the attacker ~Norman Schwarzkopf
You can judge whether housing price is in line with its fundamental value by considering the ratio of housing prices to rents ~Janet Yellen
Financial Statements AnalysisRatio Analysis
The Matrix
Has Information…
… Can you do business
with The Matrix ?
`̀̀̀
The Matrix
Makes a Statement …
… Can you analyze this
from The Matrix ?

Financial Statements AnalysisRatio Analyses
Dilip Thosar
July2014
Slide no. 2July 21, 2014
Analysis Of FS• Levels
– Business Unit– Company– Industry
• Trends– Forecasting: Needs, Seasonalities and Performance
• Ratios– Ratio of a financial value of a firm to
• Another financial value of the same firm
• Same financial value of another firm
• Same financial value of a previous period of the same firm
– Health. Individual, Over time, In comparison
• Benchmarks– Competitive Advantage
• Concept of “Similar Firms”
Financial Statements AnalysisRatio Analyses
Dilip Thosar
July2014
Slide no. 3July 21, 2014
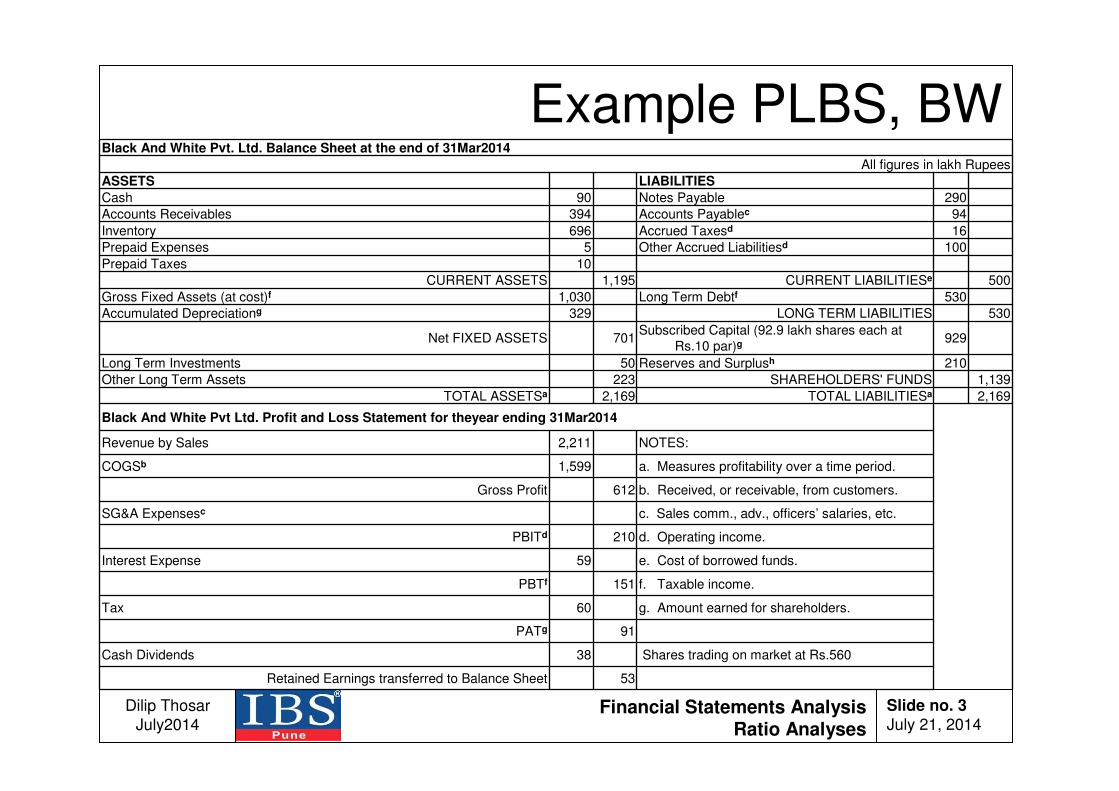
Example PLBS, BW
53Retained Earnings transferred to Balance Sheet
Shares trading on market at Rs.56038Cash Dividends
91PATg
g. Amount earned for shareholders. 60Tax
f. Taxable income.151PBTf
e. Cost of borrowed funds.59Interest Expense
d. Operating income.210PBITd
c. Sales comm., adv., officers’ salaries, etc.SG&A Expensesc
b. Received, or receivable, from customers.612Gross Profit
a. Measures profitability over a time period.1,599COGSb
NOTES:2,211Revenue by Sales
Black And White Pvt Ltd. Profit and Loss Statement for theyear ending 31Mar2014
2,169TOTAL LIABILITIESa2,169TOTAL ASSETSa
1,139SHAREHOLDERS' FUNDS223Other Long Term Assets
210Reserves and Surplush50Long Term Investments
929Subscribed Capital (92.9 lakh shares each at
Rs.10 par)g701Net FIXED ASSETS
530LONG TERM LIABILITIES329Accumulated Depreciationg
530Long Term Debtf1,030Gross Fixed Assets (at cost)f
500CURRENT LIABILITIESe1,195CURRENT ASSETS
10Prepaid Taxes
100Other Accrued Liabilitiesd5Prepaid Expenses
16Accrued Taxesd696Inventory
94Accounts Payablec394Accounts Receivables
290Notes Payable90Cash
LIABILITIESASSETS
All figures in lakh Rupees
Black And White Pvt. Ltd. Balance Sheet at the end of 31Mar2014
Financial Statements AnalysisRatio Analyses
Dilip Thosar
July2014
Slide no. 4July 21, 2014
Black And White Ltd.
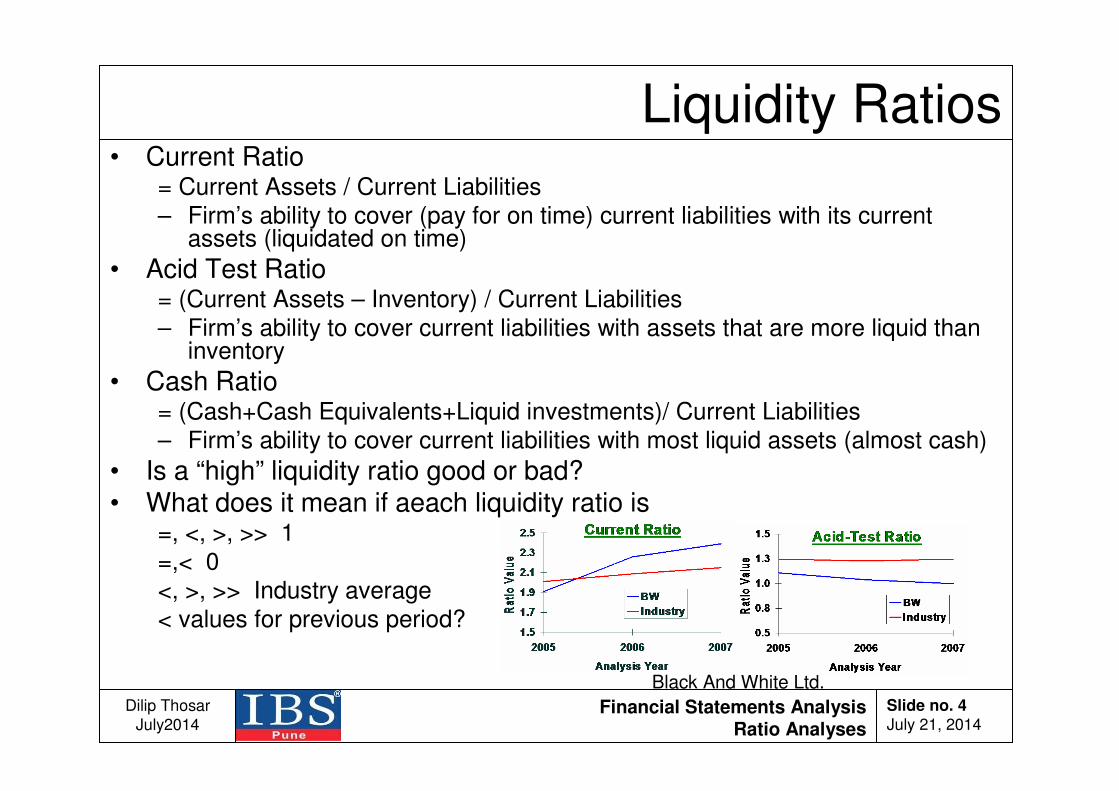
Liquidity Ratios• Current Ratio
= Current Assets / Current Liabilities
– Firm’s ability to cover (pay for on time) current liabilities with its current assets (liquidated on time)
• Acid Test Ratio= (Current Assets – Inventory) / Current Liabilities
– Firm’s ability to cover current liabilities with assets that are more liquid than inventory
• Cash Ratio= (Cash+Cash Equivalents+Liquid investments)/ Current Liabilities
– Firm’s ability to cover current liabilities with most liquid assets (almost cash)
• Is a “high” liquidity ratio good or bad?• What does it mean if aeach liquidity ratio is
=, <, >, >> 1
=,< 0
<, >, >> Industry average
< values for previous period?
Financial Statements AnalysisRatio Analyses
Dilip Thosar
July2014
Slide no. 5July 21, 2014
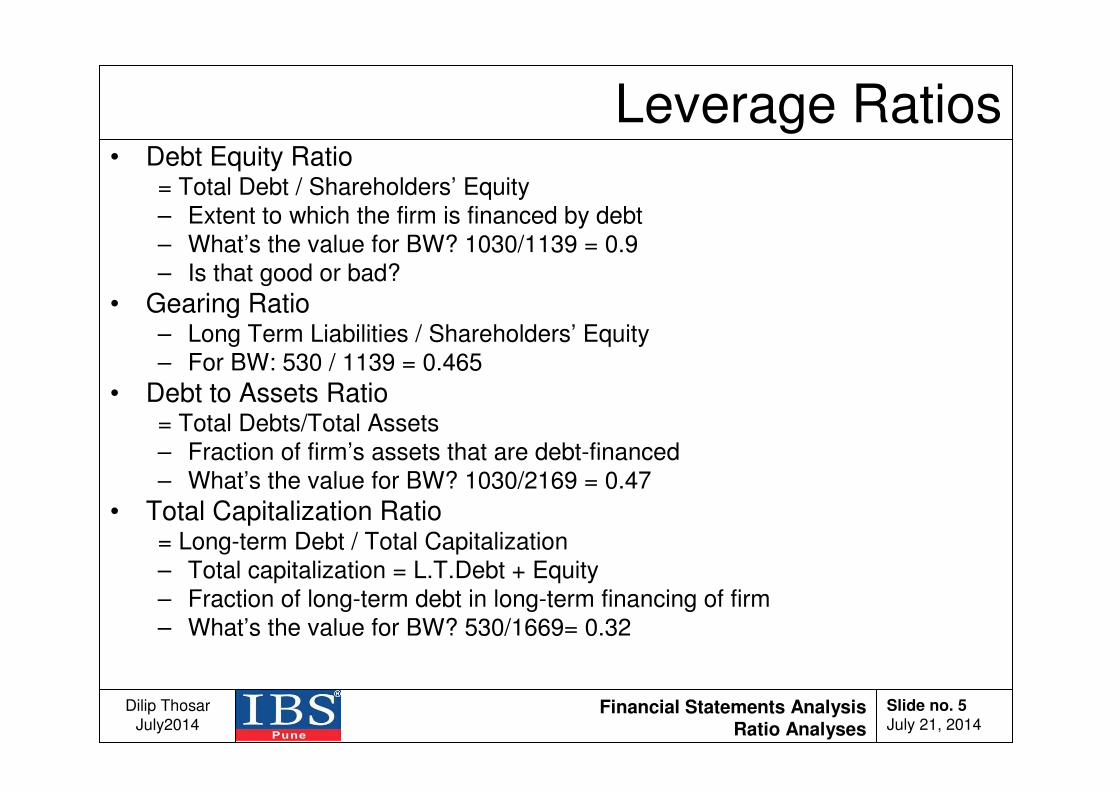
Leverage Ratios• Debt Equity Ratio
= Total Debt / Shareholders’ Equity
– Extent to which the firm is financed by debt
– What’s the value for BW? 1030/1139 = 0.9
– Is that good or bad?
• Gearing Ratio– Long Term Liabilities / Shareholders’ Equity
– For BW: 530 / 1139 = 0.465
• Debt to Assets Ratio= Total Debts/Total Assets
– Fraction of firm’s assets that are debt-financed
– What’s the value for BW? 1030/2169 = 0.47
• Total Capitalization Ratio= Long-term Debt / Total Capitalization
– Total capitalization = L.T.Debt + Equity
– Fraction of long-term debt in long-term financing of firm
– What’s the value for BW? 530/1669= 0.32
Financial Statements AnalysisRatio Analyses
Dilip Thosar
July2014
Slide no. 6July 21, 2014
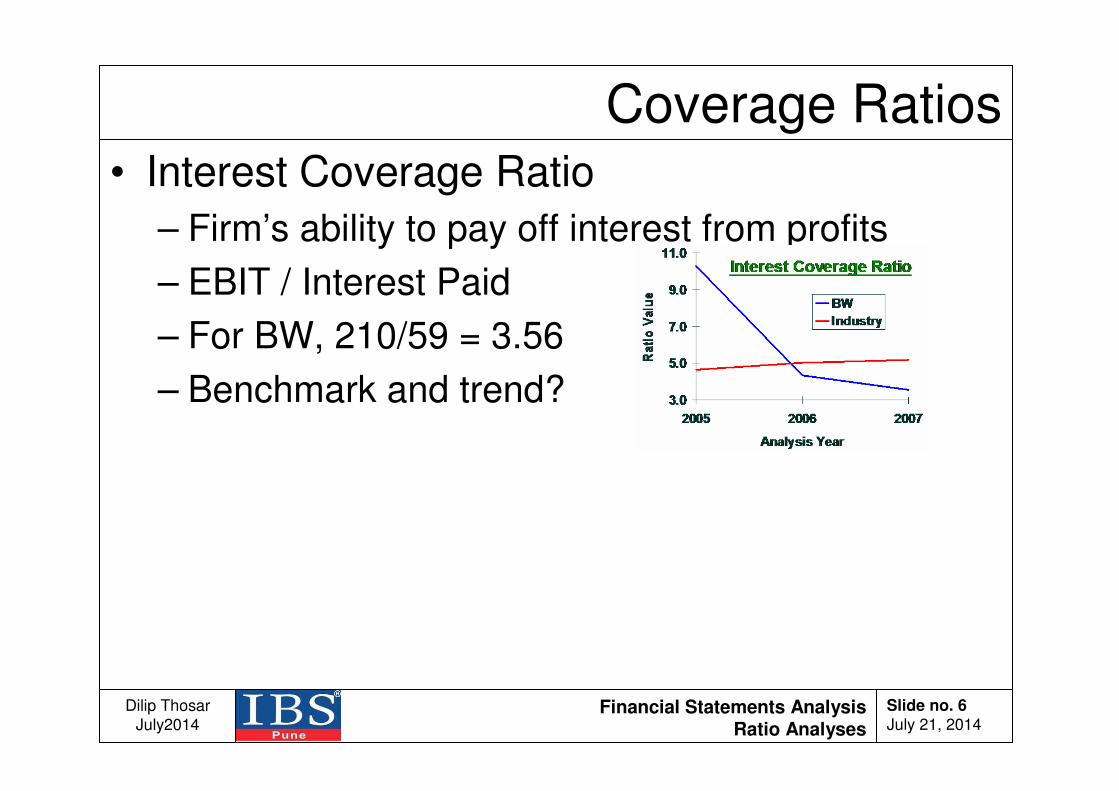
Coverage Ratios
• Interest Coverage Ratio
– Firm’s ability to pay off interest from profits
– EBIT / Interest Paid
– For BW, 210/59 = 3.56
– Benchmark and trend?

Financial Statements AnalysisRatio Analyses
Dilip Thosar
July2014
Slide no. 7July 21, 2014
Activity (Operations) Ratios• Receivable Turnover Ratio
= Credit Sales / Receivables
– Quality of receivables and collection
– Assumes all sales are on credit
– For BW, 2211/394 = 5.61
• Average Collection Period (RT in days)= Days in the Year / Receivable Turnover Ratio
– Average no. of days receivables outstanding
– For BW, 365/5.61 = 65 days
• Payable Turnover Ratio= Annual Credit Purchases / Accounts Payable
– Promptness of payment to suppliers
– For BW, 1551/94 = 16.5– Is a high PT ratio good or bad?
• Average Payment Period (PT in days)– Days in the Year / Payable Turnover
– Average number of days that payables are outstanding– For BA, 365/16.5 = 22.1 days
• Inventory Turnover Ratio= COGS/ Inventory
– Effectiveness of the inventory management practices – For BA, 1599/696 = 2.3
– Trend and Benchmark?
• Inventory in days– 365/Inventory Turnover Ratio– For BW, 365/2.3 = 158.7 (Does that look very high?)

Financial Statements AnalysisRatio Analyses
Dilip Thosar
July2014
Slide no. 8July 21, 2014
Activity Ratios … contd.• Asset Turnover Ratio
= Net Sales / Total Assets
– Effective utilization of assets to generate sales
– For BA, 2211/2169 = 1.02
– Is this a very revealing ratio?
• Fixed Asset Turnover Ratio= Net Sales / Fixed Assets
– Utilization of fixed assets to generate sales
• Capital Employed Turnover Ratio– Turnover/ Shareholders’ Equity
Financial Statements AnalysisRatio Analyses
Dilip Thosar
July2014
Slide no. 9July 21, 2014
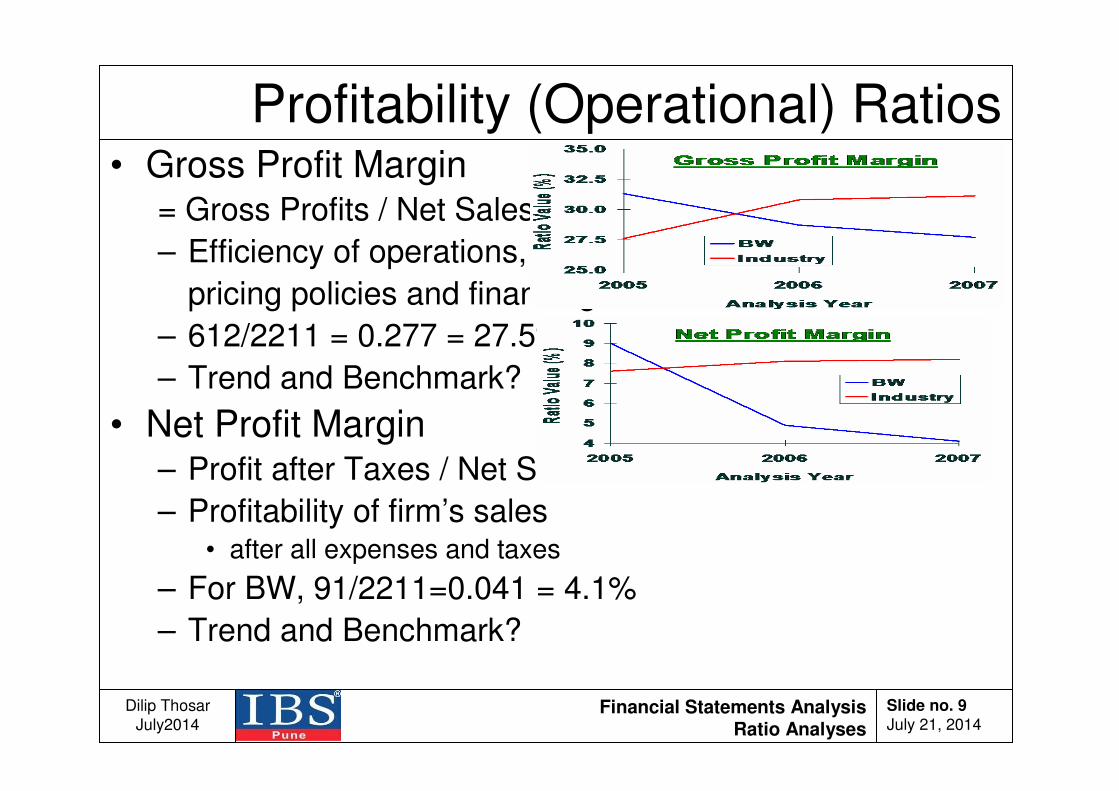
• Gross Profit Margin= Gross Profits / Net Sales
– Efficiency of operations,
pricing policies and financing
– 612/2211 = 0.277 = 27.5%
– Trend and Benchmark?
• Net Profit Margin– Profit after Taxes / Net Sales
– Profitability of firm’s sales • after all expenses and taxes
– For BW, 91/2211=0.041 = 4.1%
– Trend and Benchmark?
Profitability (Operational) Ratios
Financial Statements AnalysisRatio Analyses
Dilip Thosar
July2014
Slide no. 10July 21, 2014
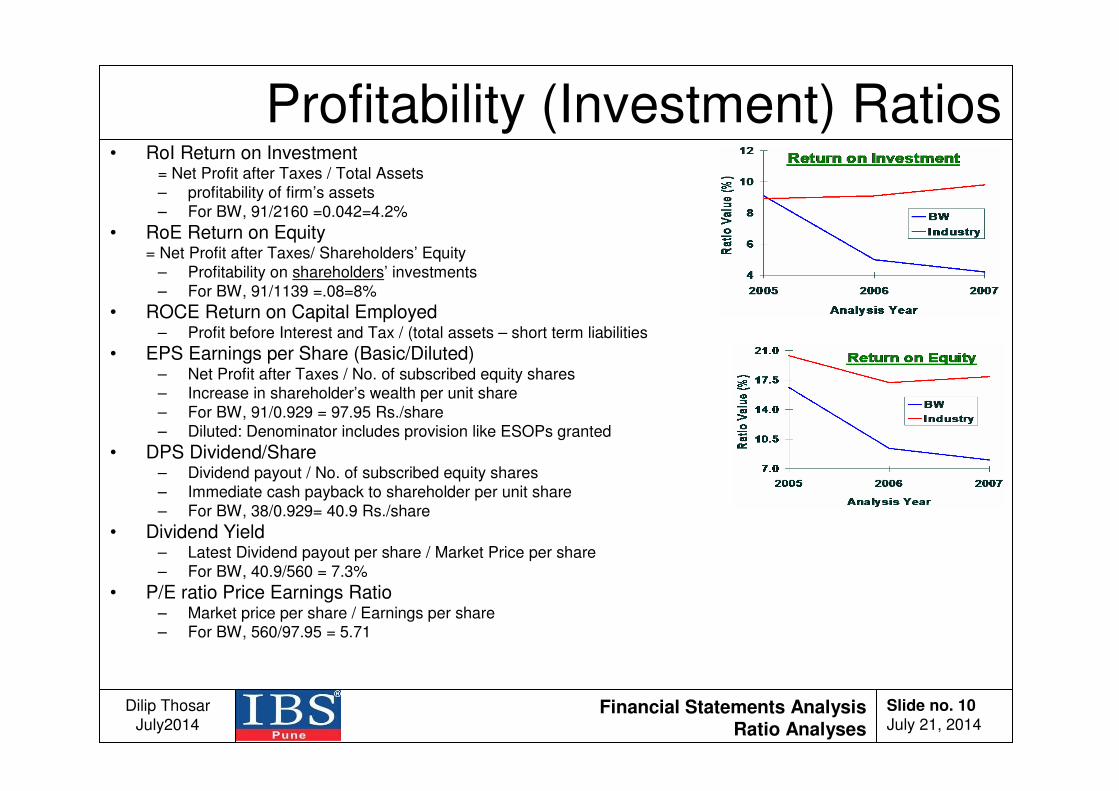
Profitability (Investment) Ratios• RoI Return on Investment
= Net Profit after Taxes / Total Assets
– profitability of firm’s assets
– For BW, 91/2160 =0.042=4.2%
• RoE Return on Equity= Net Profit after Taxes/ Shareholders’ Equity
– Profitability on shareholders’ investments
– For BW, 91/1139 =.08=8%
• ROCE Return on Capital Employed– Profit before Interest and Tax / (total assets – short term liabilities
• EPS Earnings per Share (Basic/Diluted)– Net Profit after Taxes / No. of subscribed equity shares– Increase in shareholder’s wealth per unit share
– For BW, 91/0.929 = 97.95 Rs./share
– Diluted: Denominator includes provision like ESOPs granted
• DPS Dividend/Share– Dividend payout / No. of subscribed equity shares
– Immediate cash payback to shareholder per unit share
– For BW, 38/0.929= 40.9 Rs./share
• Dividend Yield– Latest Dividend payout per share / Market Price per share
– For BW, 40.9/560 = 7.3%
• P/E ratio Price Earnings Ratio– Market price per share / Earnings per share– For BW, 560/97.95 = 5.71

Financial Statements AnalysisRatio Analyses
Dilip Thosar
July2014
Slide no. 11July 21, 2014
Investment Profitability : Du Pont Analysis• Net Profit Margin = Net Profits / Net Sales
• Asset Turnover Ratio = Net Sales / Total Assets
• Define Equity Multiplier
= Total Assets / Shareholders’ Equity
• Sales profitability X Asset Turnover Ratio * Equity Multiplier = Net Profits / Shareholders’ Equity
= RoE !
• RoI =
Net profit margin (Sales Profitability)
X Total asset turnover (Asset Usage Efficiency)
X Equity Multiplier (Debt Leverage)

Financial Statements AnalysisRatio Analyses
Dilip Thosar
July2014
Slide no. 12July 21, 2014
Performance using DuPont Analysis• ROE = (earnings before tax / sales) * (sales / assets) *
(assets / equity) * (1 – tax rate)
• ROE = Earnings after tax / Equity
= [ (EBIT/Sales) Op.efficiency
* (sales / assets) asset efficiency
- interest expense/assets interest rate
]
* (assets / equity) equity multiplier
* (1 – tax rate) effective tax retention rate
• What distinct factors affect the return on equity of a firm?
• Benchmark and trend a firm’s performance on RoE and each of those factors. Comment.

Financial Statements AnalysisRatio Analyses
Dilip Thosar
July2014
Slide no. 13July 21, 2014
Performance of BW in summary
• Inventories are too high
• Not controlling creditors (paying them too soon)
• COGS may be too high.
• Selling, general, and administrative costs too high
• Every Profitability ratios has been falling and has below the industry average in every year
• Interest coverage ratio is low

Financial Statements AnalysisRatio Analyses
Dilip Thosar
July2014
Slide no. 14July 21, 2014
Common Size Analysis
Analysis of percentage financial statements where
– all balance sheet items are divided by total
assets and
– all income statement items are divided by net
sales
• Helps show relative efficiencies
Financial Statements AnalysisRatio Analyses
Dilip Thosar
July2014
Slide no. 15July 21, 2014
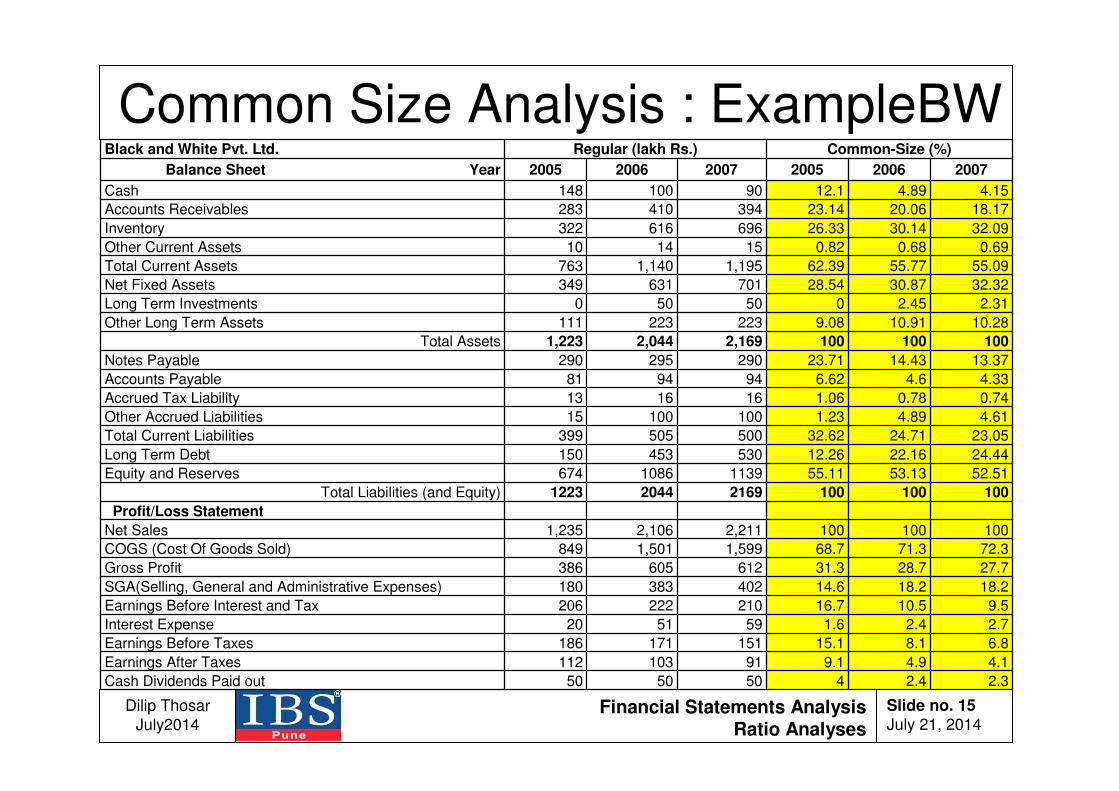
Common Size Analysis : ExampleBW
2.32.44505050Cash Dividends Paid out
4.14.99.191103112Earnings After Taxes
6.88.115.1151171186Earnings Before Taxes
2.72.41.6595120Interest Expense
9.510.516.7210222206Earnings Before Interest and Tax
18.218.214.6402383180SGA(Selling, General and Administrative Expenses)
27.728.731.3612605386Gross Profit
72.371.368.71,5991,501849COGS (Cost Of Goods Sold)
1001001002,2112,1061,235Net Sales
Profit/Loss Statement
100100100216920441223Total Liabilities (and Equity)
52.5153.1355.1111391086674Equity and Reserves
24.4422.1612.26530453150Long Term Debt
23.0524.7132.62500505399Total Current Liabilities
4.614.891.2310010015Other Accrued Liabilities
0.740.781.06161613Accrued Tax Liability
4.334.66.62949481Accounts Payable
13.3714.4323.71290295290Notes Payable
1001001002,1692,0441,223Total Assets
10.2810.919.08223223111Other Long Term Assets
2.312.45050500Long Term Investments
32.3230.8728.54701631349Net Fixed Assets
55.0955.7762.391,1951,140763Total Current Assets
0.690.680.82151410Other Current Assets
32.0930.1426.33696616322Inventory
18.1720.0623.14394410283Accounts Receivables
4.154.8912.190100148Cash
200720062005200720062005Balance Sheet Year
Common-Size (%)Regular (lakh Rs.)Black and White Pvt. Ltd.

Financial Statements AnalysisRatio Analyses
Dilip Thosar
July2014
Slide no. 16July 21, 2014
Index Analysis
• An analysis of percentage financial statements where all balance sheet or income statement figures for a base year equal 100.0 (percent) and subsequent financial statement items are expressed as percentages of their values in the base year.
Financial Statements AnalysisRatio Analyses
Dilip Thosar
July2014
Slide no. 17July 21, 2014
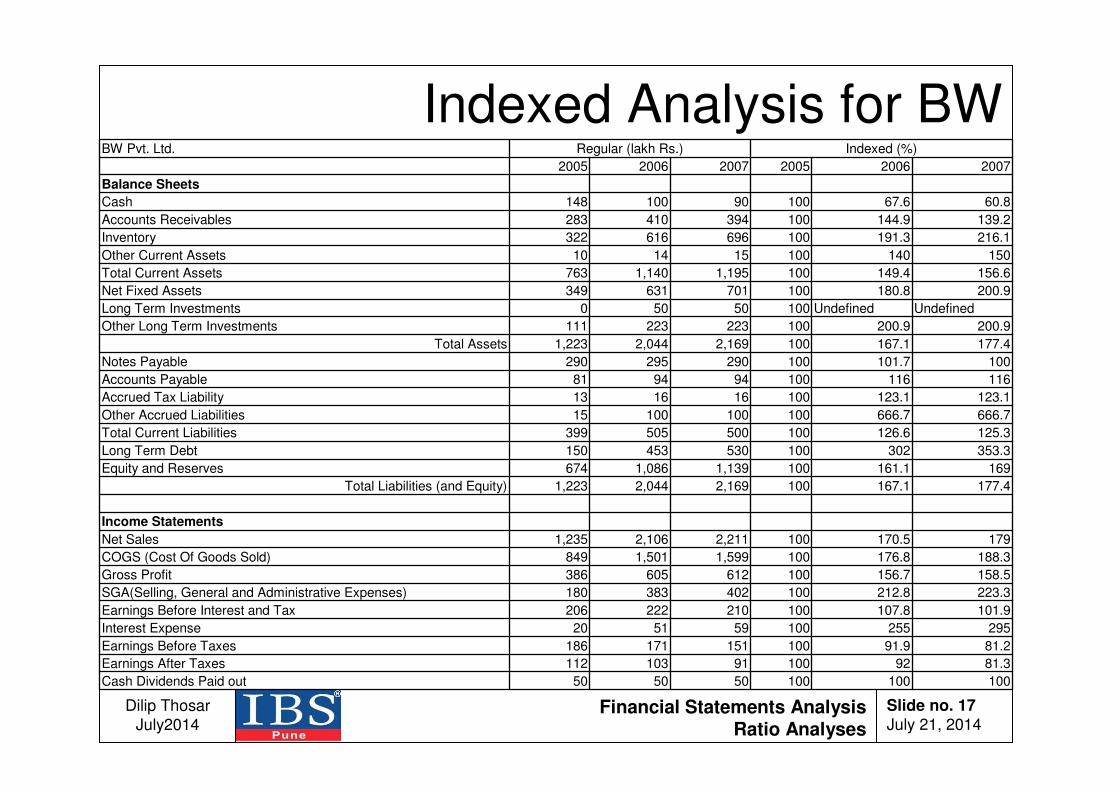
Indexed Analysis for BW
100100100505050Cash Dividends Paid out
81.39210091103112Earnings After Taxes
81.291.9100151171186Earnings Before Taxes
295255100595120Interest Expense
101.9107.8100210222206Earnings Before Interest and Tax
223.3212.8100402383180SGA(Selling, General and Administrative Expenses)
158.5156.7100612605386Gross Profit
188.3176.81001,5991,501849COGS (Cost Of Goods Sold)
179170.51002,2112,1061,235Net Sales
Income Statements
177.4167.11002,1692,0441,223Total Liabilities (and Equity)
169161.11001,1391,086674Equity and Reserves
353.3302100530453150Long Term Debt
125.3126.6100500505399Total Current Liabilities
666.7666.710010010015Other Accrued Liabilities
123.1123.1100161613Accrued Tax Liability
116116100949481Accounts Payable
100101.7100290295290Notes Payable
177.4167.11002,1692,0441,223Total Assets
200.9200.9100223223111Other Long Term Investments
UndefinedUndefined10050500Long Term Investments
200.9180.8100701631349Net Fixed Assets
156.6149.41001,1951,140763Total Current Assets
150140100151410Other Current Assets
216.1191.3100696616322Inventory
139.2144.9100394410283Accounts Receivables
60.867.610090100148Cash
Balance Sheets
200720062005200720062005
Indexed (%)Regular (lakh Rs.)BW Pvt. Ltd.

Financial Statements AnalysisRatio Analyses
Dilip Thosar
July2014
Slide no. 18July 21, 2014
Assignment 1• Using HUL Annual Reports over last 10 years,
– Analyze relevant ratios for every year
– Perform index analysis
– Perform common size analysis
– Add qualitative comments based on the relevant
highlights from Directors’ Report, Auditor’s Report and annexures.
• Submission:
– Printed Report (1-5 pages), All supporting documents
(eg. Worksheets) in soft copy.
– Use of figures from the Annual Report should be clearly referenced (eg. PL!A5/B6 )

Financial Statements AnalysisRatio Analyses
Dilip Thosar
July2014
Slide no. 19July 21, 2014
Session : Questions?