03 land use and cropping 160713 - buttecounty.neta/report/3landuse...this section summarizes...
TRANSCRIPT

Butte County 3. Land Use and Water Inventory and Analysis Cropping Patterns
3-1 June 2016
3. Land Use and Cropping Patterns This section summarizes historical and current land use and cropping patterns within Butte County. First, County-wide land use is described, with an emphasis on the valley floor area, followed by detailed land use for individual valley floor inventory units (IUs). Land use in the County over the past two decades has been evaluated based on land use surveys prepared by DWR for 1994, 1999, 2004, and 2011. For the valley floor IUs, DWR surveys and annual Butte County agricultural commissioner crop reports are used to develop annual estimates of land use. As a result, land use for the County as a whole is reported for each DWR survey, while land use for individual valley floor IUs is reported based on annual estimates. Five-year averages of general land use are reported for the IUs from 1995 to 2014, along with annual values for 2000 to 2014 for more specific irrigated agricultural land uses.
Detailed land use for the Ridge and Mountain inventory units is not reported separately as these areas are dominated by non-irrigated land and include limited irrigated agriculture or developed lands, with the exception of the Paradise area, which falls in the Ridge inventory unit.
3.1 Butte County Butte County covers approximately 1,677 square miles (1.073 million acres). The valley floor represents approximately 452,000 acres (ac) and includes approximately 234,000 ac of irrigated agriculture, 141,000 ac of non-irrigated lands, 47,000 ac of developed lands, and 30,000 ac of wetlands. The Foothill and Mountain IUs are primarily non-irrigated rangeland and forest with some development, particularly in the Paradise area and other rural communities, and represent approximately 216,000 acres and 407,000 acres, respectively. Land use based on a detailed survey conducted by the DWR Northern Region Office (NRO) in 2011 is shown in Figure 3.1.
Changes in general land use on the valley floor include relatively steady irrigated agricultural acreage1 since the mid-1990’s and a decrease in non-irrigated land2 of approximately 11,000 acres since the mid-1990’s (Figure 3.2). These decreases are balanced by an increase in developed land3 over this period, as well as a lesser increase in wetlands4.
1 Irrigated agriculture includes irrigated land in annual and perennial crops, including land temporarily idled in some years for agronomic or other reasons. 2 Non-irrigated land includes native grasses, shrubland, forest, barren land, and riparian vegetation. 3 Developed land includes urban, rural residential, and semi-agricultural areas (farmsteads, feedlots, etc.). 4 Wetlands consist of seasonal, semi-permanent, and permanent wetlands. Additionally, Thermalito Afterbay within the East Butte Inventory Unit is classified as wetlands for purposes of this report and represents approximately 4,000 acres

Butte County 3. Land Use and Water Inventory and Analysis Cropping Patterns
3-2 June 2016
Figure 3.1. Butte County Land Use, 2011 (Source: DWR).
Primary crops grown are rice and orchards, with rice representing an average of approximately 103,000 acres and orchards representing an average of approximately 93,000 acres (Figure 3.3). Almonds (38,000 acres), walnuts (34,000 acres), and prunes (11,000 acres) are the primary orchard crops, with decreases in almond and prune acreage over time offset by increases in walnuts and, to a lesser extent, other trees and vines (e.g., olives, peaches and nectarines, kiwis, pistachios, pears, and cherries) (Figure 3.4). Other than orchards and rice, crops include

Butte County 3. Land Use and Water Inventory and Analysis Cropping Patterns
3-3 June 2016
pasture and alfalfa (13,000 acres), grain (4,000 acres), and miscellaneous field and annual crops (5,000 acres) (Figure 3.5). Acreages for grain and other crops have decreased substantially over time, while pasture and alfalfa acreage has increased. On average, 16,500 acres were idle annually.
Idle ground refers to agricultural cropland land temporarily idled in some years for agronomic and economic reasons (depressed commodity prices, grading, tillage, soil amendments and fumigation, irrigation system conversion, etc.) or for temporary water transfers based on reduced consumptive use5. Rice is the primary crop that has been historically idled to temporarily generate water for transfer in the County. Between 2000 and 2014 it is estimated that approximately 16,500 ac were idle annually, on average, with average idling in the seven transfer years (2001, 2003, 2008, 2009, 2010, 2012, and 2014) of 25,000 ac and average idling in the remaining eight non-transfer years of 8,200 ac. Additional information describing participation in temporary water transfers by individual water suppliers within the County is included in the Feather River Regional Agricultural Water Management Plan (FRRAWMP) (NCWA 2014). During idling for transfer, growers may also improve their fields through grading or other agronomic activities.
Figure 3.2. Butte County Valley Floor General Land Use, 1995-2014.
5 Additional information describing temporary water transfers in California based on crop idling is available from DWR at http://www.water.ca.gov/watertransfers/. In particular, the “Water Transfer White Paper” describes current State and Federal policies regarding temporary water transfers.
236 234 234 235
148 144 141 137
26 29 30 30
42 44 47 50
0
50
100
150
200
250
300
350
400
450
500
1995-1999 2000-2004 2005-2009 2010-2014
Acre
s (Th
ousa
nds)
Irrigated Agriculture Non-Irrigated Wetlands Developed

Butte County 3. Land Use and Water Inventory and Analysis Cropping Patterns
3-4 June 2016
Figure 3.3. Butte County Valley Floor Irrigated Agricultural Land Use, 1995-2014.
Figure 3.4. Butte County Valley Floor Orchard Land Use, 1995-2014.
105 101 106 101
85 89 94 97
30 29 20 18
15 16 14 20
0
50
100
150
200
250
1995-1999 2000-2004 2005-2009 2010-2014
Acre
s (Th
ousa
nds)
Rice Orchards Other Cropland Idle Cropland
39 40 38 37
23 27 35 40
13 1311 109 99 10
0
20
40
60
80
100
120
1995-1999 2000-2004 2005-2009 2010-2014
Acre
s (Th
ousa
nds)
Almonds Walnuts Prunes Other Trees and Vines

Butte County 3. Land Use and Water Inventory and Analysis Cropping Patterns
3-5 June 2016
Figure 3.5. Butte County Valley Floor Other Crop Land Use, 1995-2014.
3.2 Vina Inventory Unit The Vina IU includes portions of Butte County within the Vina Bulletin 118 Groundwater Subbasin. The only subinventory unit (SIU) in this IU is Vina. The Vina IU covers approximately 88,000 ac and includes approximately 37,500 ac of irrigated agriculture, 36,600 ac non-irrigated lands, 13,500 ac of developed lands, and 400 ac of wetlands (Figure 3.6). Non-irrigated lands have decreased from approximately 39,000 acres in the late 1990’s to approximately 35,000 acres in the early 2010’s. This reduction is offset by increases in both irrigated agriculture and developed lands.
Primary crops grown are orchards, representing an average of 31,300 ac annually. Other crops have averaged 3,600 ac over the 15-year period from 2000 to 2014. Walnuts (13,900 ac), almonds (12,800 ac), and prunes (4,100 ac) are primary orchard crops, with other orchards making up 500 ac annually. Other crops include pasture and alfalfa (1,300 ac), grain (1,000 ac), and miscellaneous field and annual crops (1,300 ac). On average, 2,600 acres were idle annually between 2000 and 2014. Idling for temporary water transfers has not occurred in the Vina IU.
Changes in cropping between 2000 and 2014 include a modest increase in walnuts offset partially by decreases in almonds and other, non-rice crops. Annual acreages by crop are shown graphically in Figures 3.7, 3.8, and 3.9 and are provided in Table 3.1. Annual acreages for other land uses are provided in Table 3.2.
117
4 3
12
14
1311
78
43
0
5
10
15
20
25
30
35
1995-1999 2000-2004 2005-2009 2010-2014
Acre
s (Th
ousa
nds)
Grain Pasture and Alfalfa Field and Annual

Butte County 3. Land Use and Water Inventory and Analysis Cropping Patterns
3-6 June 2016
Figure 3.6. Vina General Land Use, 1995-2014.
Figure 3.7. Vina Irrigated Agricultural Land Use, 2000-2014.
36 37 37 38
39 38 37 35
0 0 1 1
12 12 13 15
0
10
20
30
40
50
60
70
80
90
100
1995-1999 2000-2004 2005-2009 2010-2014
Acre
s (Th
ousa
nds)
Irrigated Agriculture Non-Irrigated Wetlands Developed
0
5
10
15
20
25
30
35
40
45
2000 2001 2002 2003 2004 2005 2006 2007 2008 2009 2010 2011 2012 2013 2014
Acre
s (Th
ousa
nds)
Rice Orchards Other Crops Idle Cropland

Butte County 3. Land Use and Water Inventory and Analysis Cropping Patterns
3-7 June 2016
Figure 3.8. Vina Orchard Land Use, 2000-2014.
Figure 3.9. Vina Other Crop Land Use, 2000-2014.
0
5
10
15
20
25
30
35
40
2000 2001 2002 2003 2004 2005 2006 2007 2008 2009 2010 2011 2012 2013 2014
Acre
s (Th
ousa
nds)
Almonds Walnuts Prunes Other Trees and Vines
0
1
2
3
4
5
2000 2001 2002 2003 2004 2005 2006 2007 2008 2009 2010 2011 2012 2013 2014
Acre
s (Th
ousa
nds)
Grain Pasture and Alfalfa Field and Annual

Butte County 3. Land Use and Water Inventory and Analysis Cropping Patterns
3-8 June 2016
Table 3.1. Vina Irrigated Agricultural Land Use, 2000-2014.
Year Rice Almonds Walnuts Prunes
Other Trees and
Vines Grain
Pasture and
Alfalfa
Field and
Annual Idle
CroplandTotal
CroppedTotal
(w/Idle) 2000 0 14,763 10,505 4,890 478 1,089 997 2,338 1,462 35,058 36,5202001 0 13,552 10,417 4,402 498 1,229 1,097 2,176 4,150 33,370 37,5202002 0 12,628 10,652 4,152 433 1,118 1,363 1,965 5,401 32,310 37,7112003 0 13,192 11,720 3,992 438 1,219 1,464 1,551 3,586 33,576 37,1622004 0 14,178 13,116 4,283 380 952 1,727 1,116 17 35,752 35,7692005 0 13,088 13,504 3,084 475 580 1,451 1,351 4,568 33,532 38,1002006 0 12,952 14,664 4,349 423 1,053 1,534 193 1,379 35,167 36,5462007 0 13,184 14,564 4,407 433 1,131 1,445 170 1,153 35,335 36,4882008 0 11,587 13,832 4,102 649 1,123 1,301 1,968 4,392 34,562 38,9542009 0 12,615 14,935 4,410 391 1,040 1,353 450 1,587 35,194 36,7812010 0 12,304 14,460 4,332 576 843 1,238 1,667 2,856 35,422 38,2782011 0 12,370 16,213 4,236 632 1,096 1,236 1,111 123 36,893 37,0162012 0 12,100 15,604 4,027 597 1,379 1,208 976 3,185 35,892 39,0772013 0 11,917 16,945 3,715 582 887 1,121 993 1,776 36,159 37,9362014 0 11,976 16,997 2,986 537 109 1,181 1,035 3,114 34,821 37,935Min 0 11,587 10,417 2,986 380 109 997 170 17 32,310 35,769Max 0 14,763 16,997 4,890 649 1,379 1,727 2,338 5,401 36,893 39,077
Average 0 12,827 13,875 4,091 501 990 1,314 1,271 2,583 34,870 37,453

Butte County 3. Land Use and Water Inventory and Analysis Cropping Patterns
3-9 June 2016
Table 3.2. Vina Other Land Use, 2000-2014.
Year Wetlands DevelopedNon-
Irrigated Total 2000 472 12,706 38,389 51,567 2001 446 12,201 37,920 50,567 2002 444 12,141 37,791 50,376 2003 441 12,430 38,055 50,926 2004 454 12,819 39,044 52,318 2005 473 12,333 37,181 49,988 2006 547 13,230 37,765 51,541 2007 606 13,571 37,423 51,599 2008 633 13,144 35,357 49,133 2009 720 14,139 36,447 51,307 2010 757 14,046 35,007 49,810 2011 852 14,856 35,363 51,072 2012 806 14,298 33,907 49,011 2013 818 14,712 34,622 50,152 2014 815 14,689 34,649 50,152 Min 441 12,141 33,907 49,011 Max 852 14,856 39,044 52,318
Average 619 13,421 36,595 50,635

Butte County 3. Land Use and Water Inventory and Analysis Cropping Patterns
3-10 June 2016
3.3 West Butte Inventory Unit The West Butte IU includes portions of Butte County within the West Butte Bulletin 118 Groundwater Subbasin. SIUs included are Angel Slough, Durham/Dayton, Llano Seco, M&T, and Western Canal6. The West Butte IU covers approximately 94,000 ac and includes approximately 56,000 ac of irrigated agriculture, 22,000 ac of non-irrigated lands, 9,000 ac of developed lands, and 7,000 ac of wetlands (Figure 3.10). Irrigated agriculture has decreased from approximately 62,000 ac in the late 1990’s to approximately 56,000 ac in the early 2010’s. Other land uses have increased over this period.
Primary crops grown are orchards and rice, with orchards representing an average of 33,000 ac and rice representing an average of 14,000 ac for the 15-year period from 2000 to 2014. Almonds (22,000 ac), walnuts (8,000 ac), and prunes (2,000 ac) are the primary orchard crops. Other than orchards and rice, crops include pasture and alfalfa (4,600 ac), grain (1,200 ac), and miscellaneous field and annual crops (2,100 ac). Between 2000 and 2014 it is estimated that approximately 4,000 ac were idle annually, on average, with average idling in the seven transfer years (2001, 2003, 2008, 2009, 2010, 2012, and 2014) of 5,300 ac and average idling in the remaining eight non-transfer years of 2,900 ac. Additional information describing participation in temporary water transfers by individual water suppliers within the County is included in the FRRAWMP (NCWA 2014). As discussed previously in Section 3.1, idling occurs in all years due to agronomic and economic decisions by individual growers with increased idling in some years due to temporary water transfers.
Changes in cropping between 2000 and 2014 include a decrease in grain and field and annual crops and an increase in walnuts. Annual acreages by crop are shown graphically in Figures 3.11, 3.12, and 3.13 and are provided in Table 3.3. Annual acreages for other land uses are provided in Table 3.4.
6 The portion of Western Canal Water District west of Butte Creek in Butte County.

Butte County 3. Land Use and Water Inventory and Analysis Cropping Patterns
3-11 June 2016
Figure 3.10. West Butte General Land Use, 1995-2014.
Figure 3.11. West Butte Irrigated Agricultural Land Use, 2000-2014.
62 61 58 56
20 19 20 22
5 6 7 7
7 8 9 9
0
10
20
30
40
50
60
70
80
90
100
1995-1999 2000-2004 2005-2009 2010-2014
Acre
s (Th
ousa
nds)
Irrigated Agriculture Non-Irrigated Wetlands Developed
0
10
20
30
40
50
60
70
2000 2001 2002 2003 2004 2005 2006 2007 2008 2009 2010 2011 2012 2013 2014
Acre
s (Th
ousa
nds)
Rice Orchards Other Crops Idle Cropland

Butte County 3. Land Use and Water Inventory and Analysis Cropping Patterns
3-12 June 2016
Figure 3.12. West Butte Orchard Land Use, 2000-2014.
Figure 3.13. West Butte Other Crop Land Use, 2000-2014.
0
5
10
15
20
25
30
35
40
2000 2001 2002 2003 2004 2005 2006 2007 2008 2009 2010 2011 2012 2013 2014
Acre
s (Th
ousa
nds)
Almonds Walnuts Prunes Other Trees and Vines
0
2
4
6
8
10
12
14
2000 2001 2002 2003 2004 2005 2006 2007 2008 2009 2010 2011 2012 2013 2014
Acre
s (Th
ousa
nds)
Grain Pasture and Alfalfa Field and Annual

Butte County 3. Land Use and Water Inventory and Analysis Cropping Patterns
3-13 June 2016
Table 3.3. West Butte Irrigated Agricultural Land Use, 2000-2014.
Year Rice Almonds Walnuts Prunes
Other Trees and
Vines Grain
Pasture and
Alfalfa
Field and
Annual Idle
CroplandTotal
CroppedTotal
(w/Idle) 2000 14,347 23,570 5,124 2,042 899 3,151 4,808 4,806 2,089 58,747 60,8362001 11,427 22,238 5,093 1,912 821 2,805 4,671 4,904 8,311 53,871 62,1822002 13,099 20,927 5,297 1,843 720 2,288 4,927 4,488 8,812 53,588 62,4002003 12,588 22,343 6,226 1,853 707 2,357 4,659 4,097 6,568 54,829 61,3972004 14,403 24,208 7,720 2,157 574 1,309 5,952 2,030 16 58,353 58,3682005 13,271 22,017 8,194 1,521 734 656 4,715 2,265 6,748 53,373 60,1202006 14,733 22,477 8,919 2,018 612 1,085 5,282 293 2,141 55,418 57,5582007 14,740 23,007 8,646 1,965 648 1,030 4,982 337 1,449 55,355 56,8052008 13,930 20,154 8,199 1,718 998 955 4,311 3,127 6,087 53,391 59,4782009 14,661 22,153 8,842 1,780 632 706 4,524 387 2,345 53,684 56,0292010 13,593 21,601 8,627 1,677 838 469 4,114 1,799 4,285 52,718 57,0032011 15,212 21,572 9,690 1,577 914 547 4,063 669 81 54,245 54,3252012 13,602 21,401 9,277 1,442 825 760 3,982 602 4,933 51,891 56,8242013 15,207 21,059 10,283 1,391 847 455 3,631 623 1,653 53,495 55,1482014 12,810 21,131 10,251 1,119 763 58 3,859 569 4,697 50,559 55,256Min 11,427 20,154 5,093 1,119 574 58 3,631 293 16 50,559 54,325Max 15,212 24,208 10,283 2,157 998 3,151 5,952 4,904 8,812 58,747 62,400
Average 13,842 21,990 8,026 1,734 769 1,242 4,565 2,066 4,014 54,234 58,249

Butte County 3. Land Use and Water Inventory and Analysis Cropping Patterns
3-14 June 2016
Table 3.4. West Butte Other Land Use, 2000-2014.
Year Wetlands DevelopedNon-
Irrigated Total 2000 5,553 7,752 19,723 33,027 2001 5,526 7,686 18,469 31,681 2002 5,648 7,986 17,829 31,463 2003 6,166 8,492 17,808 32,466 2004 6,842 9,445 19,208 35,495 2005 6,629 8,875 18,239 33,743 2006 6,781 9,470 20,054 36,305 2007 6,816 9,554 20,688 37,058 2008 6,332 8,774 19,279 34,385 2009 6,728 9,454 21,653 37,834 2010 6,503 9,143 21,214 36,860 2011 6,899 9,617 23,023 39,538 2012 6,397 9,117 21,525 37,039 2013 6,835 9,513 22,367 38,715 2014 6,852 9,517 22,238 38,607 Min 5,526 7,686 17,808 31,463 Max 6,899 9,617 23,023 39,538
Average 6,434 8,960 20,221 35,614

Butte County 3. Land Use and Water Inventory and Analysis Cropping Patterns
3-15 June 2016
3.4 East Butte Inventory Unit The East Butte IU includes portions of Butte County within the East Butte Bulletin 118 Groundwater Subbasin. SIUs included are Biggs-West Gridley, Butte7, Butte Sink, Cherokee, Esquon, Pentz, Richvale, Thermalito, and Western Canal8. The East Butte IU covers approximately 219,000 acres and includes approximately 125,000 ac of irrigated agriculture, 58,000 ac of non-irrigated lands, 28,000 ac of wetlands9, and 15,000 ac of developed lands (Figure 3.14). Irrigated agriculture has increased from approximately 122,000 acres in the late 1990’s to approximately 125,000 acres in the early 2010’s. Other land uses have decreased over this period.
Primary crops grown are rice and orchards, with rice representing an average of 86,000 ac and orchards representing an average of 22,000 ac for the 15-year period from 2000 to 2014. Walnuts (9,600 ac), prunes (4,100 ac), and almonds (3,400 ac) are the primary orchard crops. Other than orchards and rice, crops include pasture and alfalfa (3,600 ac), grain (1,300 ac), and miscellaneous field and annual crops (1,300 ac). Between 2000 and 2014 it is estimated that approximately 9,000 ac were idle annually, on average, with average idling in the seven transfer years (2001, 2003, 2008, 2009, 2010, 2012, and 2014) of 16,300 ac and average idling in the remaining eight non-transfer years of 2,700 ac. Additional information describing participation in temporary water transfers by individual water suppliers within the County is included in the FRRAWMP (NCWA 2014). As discussed previously in Section 3.1, idling occurs in all years due to agronomic and economic decisions by individual growers with increased idling in some years due to temporary water transfers.
Changes in cropping between 2000 and 2014 include a decrease in prunes, grain, and field and annual crops and an increase in walnuts. Annual acreages by crop are shown graphically in Figures 3.15, 3.16, and 3.17 and are provided in Table 3.5. Annual acreages for other land uses are provided in Table 3.6.
7 The portion of Butte Water District in Butte County. 8 The portion of Western Canal Water District east of Butte Creek in Butte County. 9 Within the East Butte Inventory Unit, Thermalito Afterbay is classified as wetlands for purposes of this report and represents approximately 4,000 acres.

Butte County 3. Land Use and Water Inventory and Analysis Cropping Patterns
3-16 June 2016
Figure 3.14. East Butte General Land Use, 1995-2014.
Figure 3.15. East Butte Irrigated Agricultural Land Use, 2000-2014.
122 121 123 125
62 62 61 58
19 21 21 2116 15 15 15
0
50
100
150
200
250
1995-1999 2000-2004 2005-2009 2010-2014
Acre
s (Th
ousa
nds)
Irrigated Agriculture Non-Irrigated Wetlands Developed
0
20
40
60
80
100
120
140
2000 2001 2002 2003 2004 2005 2006 2007 2008 2009 2010 2011 2012 2013 2014
Acre
s (Th
ousa
nds)
Rice Orchards Other Crops Idle Cropland

Butte County 3. Land Use and Water Inventory and Analysis Cropping Patterns
3-17 June 2016
Figure 3.16. East Butte Orchard Land Use, 2000-2014.
Figure 3.17. East Butte Other Crop Land Use, 2000-2014.
0
5
10
15
20
25
30
2000 2001 2002 2003 2004 2005 2006 2007 2008 2009 2010 2011 2012 2013 2014
Acre
s (Th
ousa
nds)
Almonds Walnuts Prunes Other Trees and Vines
0
2
4
6
8
10
12
2000 2001 2002 2003 2004 2005 2006 2007 2008 2009 2010 2011 2012 2013 2014
Acre
s (Th
ousa
nds)
Grain Pasture and Alfalfa Field and Annual

Butte County 3. Land Use and Water Inventory and Analysis Cropping Patterns
3-18 June 2016
Table 3.5. East Butte Irrigated Agricultural Land Use, 2000-2014.
Year Rice Almonds Walnuts Prunes
Other Trees and
Vines Grain
Pasture and
Alfalfa
Field and
Annual Idle
CroplandTotal
CroppedTotal
(w/Idle) 2000 90,600 3,214 7,340 5,914 5,628 1,831 4,127 1,379 1,104 120,034 121,1382001 78,994 3,072 6,899 5,413 5,193 2,316 3,995 3,086 13,020 108,968 121,9882002 84,893 2,958 7,076 4,544 4,935 2,284 4,065 3,362 8,512 114,117 122,6292003 80,231 3,142 7,632 3,993 5,047 2,817 3,520 2,511 12,489 108,892 121,3812004 91,030 3,341 9,068 4,508 4,360 1,412 3,626 500 12 117,845 117,8582005 84,469 3,240 9,560 2,717 5,524 762 3,029 3,389 8,447 112,688 121,1352006 92,169 3,317 10,295 4,389 4,357 1,243 3,632 121 1,153 119,522 120,6752007 92,200 3,499 10,050 4,550 4,410 1,239 3,666 193 861 119,808 120,6692008 83,587 3,072 8,791 3,486 6,083 1,205 3,196 1,880 16,712 111,299 128,0112009 89,308 3,528 10,092 4,290 4,300 906 3,685 229 7,315 116,338 123,6532010 78,377 3,590 9,626 4,007 5,311 679 3,372 1,202 20,706 106,163 126,8692011 93,141 3,728 11,144 3,829 5,446 812 3,866 567 84 122,532 122,6152012 78,605 3,644 10,300 3,508 5,102 1,207 3,364 415 22,851 106,146 128,9962013 93,419 3,685 12,549 3,269 4,970 668 3,477 429 1,653 122,466 124,1202014 74,746 3,733 12,967 2,663 4,748 84 3,652 378 20,781 102,971 123,752Min 74,746 2,958 6,899 2,663 4,300 84 3,029 121 12 102,971 117,858Max 93,419 3,733 12,967 5,914 6,083 2,817 4,127 3,389 22,851 122,532 128,996
Average 85,718 3,384 9,559 4,072 5,027 1,298 3,618 1,309 9,047 113,986 123,033

Butte County 3. Land Use and Water Inventory and Analysis Cropping Patterns
3-19 June 2016
Table 3.6. East Butte Other Land Use, 2000-2014.
Year Wetlands DevelopedNon-
Irrigated Total 2000 20,771 16,035 61,232 98,039 2001 20,246 15,311 61,632 97,188 2002 20,059 14,914 61,575 96,548 2003 21,006 14,612 62,177 97,795 2004 21,745 15,595 63,979 101,319 2005 21,241 14,509 62,291 98,041 2006 21,464 15,027 62,011 98,502 2007 21,586 15,335 61,587 98,508 2008 20,063 13,557 57,545 91,165 2009 21,253 14,862 59,409 95,524 2010 20,585 14,392 57,331 92,308 2011 21,833 15,762 58,966 96,561 2012 20,175 14,282 55,723 90,180 2013 21,648 15,469 57,940 95,057 2014 21,748 15,574 58,101 95,424 Min 20,059 13,557 55,723 90,180 Max 21,833 16,035 63,979 101,319
Average 21,028 15,016 60,100 96,144

Butte County 3. Land Use and Water Inventory and Analysis Cropping Patterns
3-20 June 2016
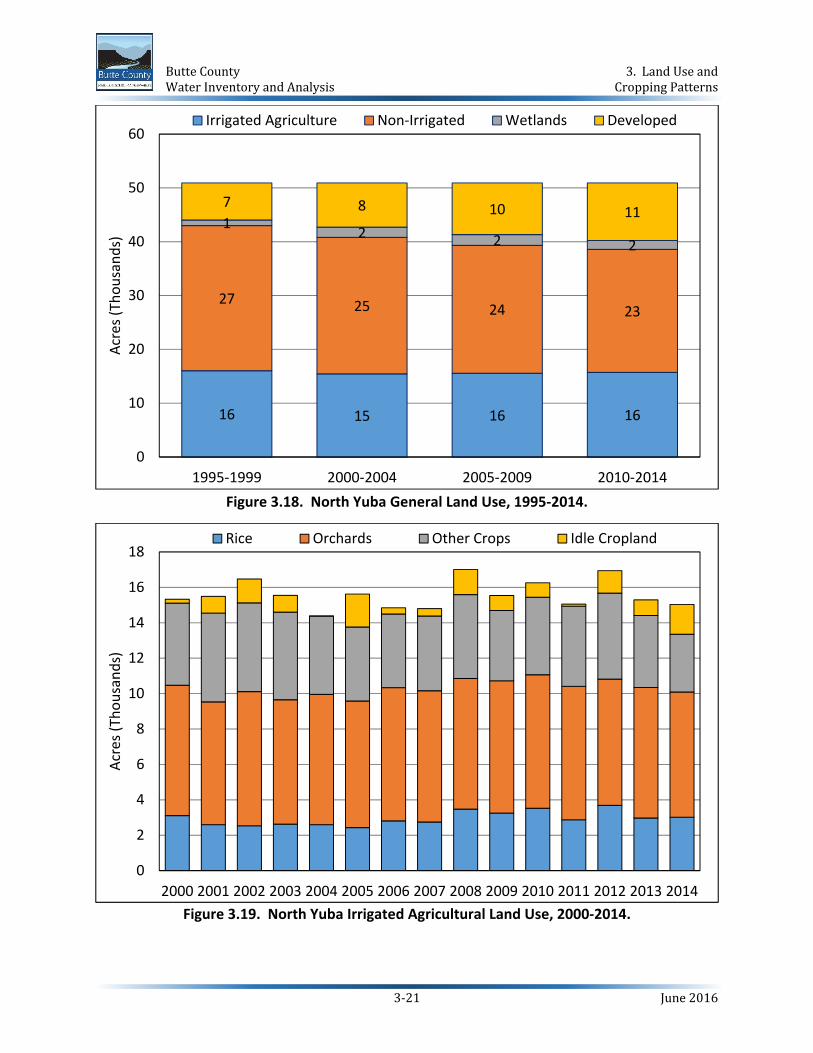
3.5 North Yuba Inventory Unit The North Yuba IU includes portions of Butte County within the North Yuba Bulletin 118 Groundwater Subbasin. The only SIU in this IU is North Yuba. The North Yuba IU covers approximately 51,000 acres and includes approximately 24,000 ac of non-irrigated lands, 16,000 ac of irrigated agriculture, 10,000 ac of developed lands, and 2,000 ac of wetlands (Figure 3.18). Non-irrigated lands have decreased from approximately 27,000 acres in the late 1990’s to approximately 23,000 acres in the early 2010’s. This reduction is offset primarily by an increase in developed lands.
Primary crops grown are orchards, representing an average of 7,300 ac annually. Other, non-rice crops have averaged 4,400 ac, and rice has averaged 3,000 ac annually over the 15-year period from 2000 to 2014. Walnuts (2,700 ac) and prunes (1,500 ac) are primary orchard crops, with other orchards (e.g., olives, peaches, pears, and cherries) making up 3,100 ac annually. Other crops include pasture and alfalfa (3,200 ac), grain (900 ac), and miscellaneous field and annual crops (400 ac). On average, 900 acres were idle annually between 2000 and 2014. Idling for temporary water transfers has not occurred in the North Yuba IU.
Changes in cropping between 2000 and 2014 include a modest increase in walnuts offset by a decrease in prunes, as well as a slight decrease in other, non-rice crops. Annual acreages by crop are shown graphically in Figures 3.19, 3.20, and 3.21 and are provided in Table 3.7. Annual acreages for other land uses are provided in Table 3.8.
Butte County 3. Land Use and Water Inventory and Analysis Cropping Patterns
3-21 June 2016
Figure 3.18. North Yuba General Land Use, 1995-2014.
Figure 3.19. North Yuba Irrigated Agricultural Land Use, 2000-2014.
16 15 16 16
27 25 24 23
1 2 2 2
7 8 10 11
0
10
20
30
40
50
60
1995-1999 2000-2004 2005-2009 2010-2014
Acre
s (Th
ousa
nds)
Irrigated Agriculture Non-Irrigated Wetlands Developed
0
2
4
6
8
10
12
14
16
18
2000 2001 2002 2003 2004 2005 2006 2007 2008 2009 2010 2011 2012 2013 2014
Acre
s (Th
ousa
nds)
Rice Orchards Other Crops Idle Cropland

Butte County 3. Land Use and Water Inventory and Analysis Cropping Patterns
3-22 June 2016
Figure 3.20. North Yuba Orchard Land Use, 2000-2014.
Figure 3.21. North Yuba Other Crop Land Use, 2000-2014.
0
1
2
3
4
5
6
7
8
2000 2001 2002 2003 2004 2005 2006 2007 2008 2009 2010 2011 2012 2013 2014
Acre
s (Th
ousa
nds)
Almonds Walnuts Prunes Other Trees and Vines
0
1
2
3
4
5
6
2000 2001 2002 2003 2004 2005 2006 2007 2008 2009 2010 2011 2012 2013 2014
Acre
s (Th
ousa
nds)
Grain Pasture and Alfalfa Field and Annual

Butte County 3. Land Use and Water Inventory and Analysis Cropping Patterns
3-23 June 2016
Table 3.7. North Yuba Irrigated Agricultural Land Use, 2000-2014.
Year Rice Almonds Walnuts Prunes
Other Trees and
Vines Grain
Pasture and
Alfalfa
Field and
Annual Idle
CroplandTotal
CroppedTotal
(w/Idle) 2000 3,112 64 2,438 1,851 3,004 961 3,510 171 219 15,111 15,3312001 2,595 56 2,388 1,785 2,707 1,075 3,619 325 939 14,551 15,4902002 2,534 54 2,415 1,553 3,553 990 3,725 301 1,351 15,125 16,4752003 2,629 62 2,560 1,495 2,907 1,074 3,573 303 946 14,603 15,5492004 2,596 74 2,876 1,540 2,868 517 3,789 117 5 14,376 14,3812005 2,430 77 2,698 1,119 3,258 399 3,354 422 1,862 13,758 15,6202006 2,813 74 2,930 1,590 2,930 720 3,393 47 352 14,496 14,8482007 2,750 77 2,800 1,643 2,890 861 3,252 109 420 14,381 14,8012008 3,477 72 2,435 1,448 3,419 1,089 2,929 723 1,412 15,592 17,0032009 3,256 82 2,687 1,648 3,049 910 2,922 138 848 14,691 15,5402010 3,525 85 2,519 1,619 3,319 863 2,755 756 818 15,440 16,2582011 2,870 90 2,717 1,594 3,141 1,086 2,756 682 116 14,936 15,0512012 3,687 87 2,610 1,478 2,955 1,614 2,638 609 1,264 15,677 16,9412013 2,976 88 2,952 1,407 2,925 927 2,454 680 885 14,407 15,2932014 3,022 93 3,006 1,151 2,819 117 2,595 549 1,685 13,352 15,036Min 2,430 54 2,388 1,119 2,707 117 2,454 47 5 13,352 14,381Max 3,687 93 3,006 1,851 3,553 1,614 3,789 756 1,862 15,677 17,003
Average 2,951 76 2,669 1,528 3,050 880 3,151 396 875 14,700 15,574

Butte County 3. Land Use and Water Inventory and Analysis Cropping Patterns
3-24 June 2016
Table 3.8. North Yuba Other Land Use, 2000-2014.
Year Wetlands DevelopedNon-
Irrigated Total 2000 1,542 7,680 26,367 35,589 2001 1,700 7,775 25,956 35,431 2002 1,842 7,887 24,715 34,445 2003 2,076 8,562 24,733 35,371 2004 2,359 9,120 25,060 36,539 2005 2,168 8,957 24,176 35,300 2006 2,144 9,557 24,371 36,072 2007 2,059 9,838 24,222 36,119 2008 1,758 9,518 22,641 33,917 2009 1,837 10,150 23,393 35,380 2010 1,663 10,234 22,764 34,662 2011 1,677 10,892 23,299 35,869 2012 1,551 10,333 22,095 33,979 2013 1,670 10,958 23,000 35,627 2014 1,685 11,089 23,110 35,884 Min 1,542 7,680 22,095 33,917 Max 2,359 11,089 26,367 36,539
Average 1,849 9,503 23,993 35,346