03southbank structure plan - co · 3.5 case study 2: borneo sporenburg, amsterdam, netherlands 3.6...
TRANSCRIPT

urban Density studyBaCkGRounD REPoRt southBank stRuCtuRE PLan03


85
03
ur
ba
n d
ens
ity
stu
dy
s o u t h B a n k S t r u c t u r e P L A ND e s i g n a n D P l a n n i n g a t A e c om
The intention of the density study is to analyse global cities that are renowned for inner city living. The case studies are intended to inform qualitative and quantitative techniques that will be applied to the thinking behind recommendations for a sustainable Southbank Structure Plan.
Global precedents have been sourced through AECOM offices in the united States, Europe, Asia and Australia. These case studies have been deliberately sourced to include a range of different urban forms with examples drawn from highly urbanised cities, such as Hong Kong and New york, along with more recent urban edge examples, such as Beddington Zero in England (also included as a benchmark carbon neutral development).
Selection of Sites
Each site had to be an inner urban development (within 2km of a CBD) and contain elements of community activity/use.
Examples of high density, low-rise were encouraged as it is the typology least understood for providing high density living, however, not at the exclusion of gaining a better, more rounded understanding of different workable urban situations. In order to facilitate direct comparisons the study area nominated for each case study is the same – 400m x 400m, that is, 16 hectares and 5 minutes walk. This also facilitated the analysis of a piece of city rather than an analysis of discrete urban developments. The intention was to research how different urban environments operate as sustainable holistic places, not just as benchmark architectural or sustainable project examples.
3.1 Introduction to the Urban Density Study3.1 Introduction to the Urban Density Study
3.2 Assessment Tools of the Urban Density Study
3.3 Test case: Melbourne CBD
3.4 Case Study 1: Coin Street, London, UK
3.5 Case Study 2: Borneo Sporenburg, Amsterdam, Netherlands
3.6 Case Study 3: Bercy, Paris, France
3.7 Case Study 4: Long Beach, LA, USA
3.8 Case Study 5: Battery Park, NYC, USA
3.9 Case Study 6: Southbank Melbourne, Australia
3.10 Case Study 7: Beddington Zero, Surrey, UK
3.11 Case Study 8: Mid Levels, Hong Kong, China
3.12 Case Study 9: Eixample, Barcelona, Spain.
3.12 Conclusions from the Urban Density Study
3.13 Recommendations for the Southbank Structure Plan
3.0 Contents of the Urban Density StudyKey Criteria
The key indicators that the study aims to identify are densities for the following criteria – population density, residential density, employment density and car parking density (to serve the residential population). This provides a quantitative appreciation of the densities achieved within different urban locations. Higher densities are associated with more sustainable urban outcomes as they provide the population capacity to support the provision of better social and infrastructure facilities and services. To gain an understanding of the relationship between the quality of life and urban density an analysis of each site is provided with themes based around the Site, the Built Form, Context and ESD as follows:
Site
An overview of the site area including land use percentages (building footprints and open space) and a brief description of the development history.
Built Form
An analysis of the existing urban form including dwelling built form typologies, building heights and setbacks, car parking distribution and typical interface arrangements to the street.
Context
An analysis of the access provided to services and infrastructure within the site and within 500m of the site area. This includes access to public transport, parks and community facilities. An analysis of water and energy sources is also incorporated to assess how each piece of city is performing environmentally.
ESD
Provides an overview of the water and energy sources servicing each study area to give a snapshot of the environmental credentials of each site.

JOBS/HA1255
PEOPLE/HA1081.6 PER DWELLING
DWELLINGS /HA 66
CARS/HA33
0M 0-5M
10+
2 12
TOWER APARTMENTS5%
65%
ON STREET
MID-RISE APARTMENTS
95%
LOW-RISE DETACHED0%
LOW-RISE ATTACHED0%
5%
90%
5%
86
s o u t h B a n k S t r u c t u r e P L A N
03u
rb
an
den
sit
y s
tud
y
D e s i g n a n D P l a n n i n g a t A e c om
3.2 Assessment Tools of the Urban Density StudyThe following definitions provide further explanation of the framework used to inform many of the assessed criteria.
BuIlT FORM
Car Parking
The percentages of car parking typologies in or around the site.
Tower Apartments
Apartment towers typically on a podium of 2-10 storeys. Apartment tower in excess of 10 stories.
Mid-rise Apartments
3-10 storey buildings, typically no podium level although nonresidential uses common at ground and first floor.
Low-rise Attached Housing
1-3 storey attached or semi-attached dwellings - typically low scale walk-ups, stacked townhouses, terraces or duplexes.
Low-rise Detached Housing
1-3 storey conventional houses.
Height Range
Heights are considered to be of low desirability at single story and at heights over 10 storeys.
Street Setback
A zero setback is an urban response and most desirable with increasing setbacks reducing in desirability.
Street Interface
The street interface was categorised into three alternate arrangements:
Active/positive interface at all building levels.
Active/positive interface at ground level with inactive floors immediately above (typically car parking).
Inactive/negative interface at ground floor.
lAND uSE
Building Footprint
The building footprint is the total area of the site occupied by built form.
Open Space
The open space is the total area of the site without built form. This is usable space and water is not included but removed from the percentages.
DENSITY
Population Density
The number of people residing per hectare within the 16 hectare site area.
1 person = 10 people/ha (An average of two people per dwelling are assumed if exact statistics are unavailable).
Residential Density
The number of dwellings per hectare. The case studies represent gross densities, that is, the total number of dwellings per hectare (inclusive of roads, waterways, public spaces etc).
1 house picture = 10 dwellings/ha
Car Density
The provision of car parks per hectare within the site area to support the resident population.
1 car picture = 10 cars/ha (An average of 1 car per two dwellings is assumed if exact statistics are unavailable).
Employment Density
The number of jobs per hectare within the site area.
The densities are illustrated in the following way to enable quick comparison between each study area.
1 person (employment) = 50 people/ha

Building Entrances
The closer the entrances are, the more street activity and liveliness is achieved.
under 10m distances between entrances is a desirable urban grain.
Any entrance further than 10m creates an environment dominated by walls, parking entrances and glazed facades lacking any interaction.
Non Residential Uses
These are purely indicative to the range of other uses in the area and not necessarily a qualitative assessment of the uses themselves.
<10M APART
85%
10-50M APART
>50M APART
10% 5%
ACCESS TO OPEN SPACE/SOCIAl AND COMMuNITy INFRASTRuCTuRENominates facilities, infrastructure and services either within the study area or within 500m walk.
Open Space
Access to small community spaces or squares provides respite from the typical street activity and traffic noise.
Access to large parks provides for play facilities and improves general environmental quality.
Education
Access to community, tertiary and higher education facilities provides an indication of the range of educational possibilities enjoyed by the immediate community and thus the likely profile of residents.
Community Facilities
Access to the general facilities that provide services to enable families to live and function at their most integrated.
SMALL PARK/SQUARE2
LARGE PARK2
CO
MM
ER
CIA
LR
ETA
ILIN
DU
ST
RIA
L
ESDMeasures the percentage of ESD components generally utilised in the area. This is broken down into water and energy.
C
E
s$
87
03
ur
ba
n d
ens
ity
stu
dy
s o u t h B a n k S t r u c t u r e P L A ND e s i g n a n D P l a n n i n g a t A e c om

buIlt FoRMsItE
88 3.3 Case Study 01 Melbourne CBD
0M
95%0-5M5%
5+M0%
HE
IGH
T R
AN
GE
(S
TOR
Ey
S)
ST
RE
ET
SE
TB
AC
K
2 12
DW
El
lIN
G T
yP
OlO
Gy
TOWER APARTMENTS5%
MID-RISE APARTMENTS
95%LOW-RISE ATTACHED0%
LOW-RISE DETACHED0%
SIT
E A
ER
IAl
1:5
,00
0
Bu
IlD
ING
FO
OT
PR
INT
11.95 ha 73%
DATE 1800S - 2009DIST. TO CBD 0KM / 0 MIN Melbourne’s CBD in its current grid form has developed over the past 170 years. It is a mixed use area, with primary uses being commercial, retail and increasingly residential. Recent local government initiatives have increased the number of residents by 850% in a 15 year period.
OP
EN
SP
AC
E
4.4 ha27%
PRIVATE OPEN SPACE 0%COMMUNAL OPEN SPACE 0%PUBLIC OPEN SPACE 27%
1:10,000
66/ha
DWELLINGS /HA 66
CARS/HA33
DE
NS
ITy
PEOPLE/HA1081.6 PER DWELLING
1255/ha
JOBS/HA1255
CA
R P
AR
KIN
G
2%
78%
AB
OV
E G
RO
UN
D
15% ON STREET
BASEMENT
5%
GR
OU
ND
88
s o u t h B a n k S t r u c t u r e P L A N
03u
rb
an
den
sit
y s
tud
y
D e s i g n a n D P l a n n i n g a t A e c om

ContExt sItE Photos
WA
TE
R S
Ou
RC
E
99% POTABLE TOWN SUPPLY0.5% STORMWATER REUSED WITHIN SITE AREA0.1% GREYWATER REUSE0.1% BLACKWATER REUSE
ST
RE
ET
IN
TE
RFA
CE
90% 5% 5%
Bu
IlD
ING
EN
TR
AN
CE
S
AC
CE
SS
TO
OP
EN
SP
AC
E
SMALL PARK/SQUARE2
LARGE PARK2
BUS 0M / 0 MIN WALK
TRAIN 0M / 0 MIN WALK
TRAM 0M / 0 MIN WALK
FERRY 800M / 10 MIN WALKAC
CE
SS
TO
Pu
Bl
IC
TR
AN
SP
OR
TA
CC
ES
S T
O S
OC
IAl
/ C
OM
Mu
NIT
y I
NF
RA
ST
Ru
CT
uR
E
0 PRIMARY SCHOOL0 SECONDARY SCHOOL4 UNIVERSITY
EN
ER
Gy
SO
uR
CE
100% GRID0% SELF GENERATED0% DISTRICT DISTRIBUTED NETWORK
E
C2 LIBRARY1 SPORTS CENTRE20 CULTURAL CENTRE / INSTITUTIONS100 CAFES / RESTAURANTS
30 MEDICAL SERVICES3 CHILDCARE
12 CONVENIENCE SHOPPINGs
10-50M APART
<10M APART >50M APART 85% 10% 5%
NO
N-R
ES
IDE
NT
IAl
uS
ES
CO
MM
ER
CIA
L
RE
TAIL
IND
US
TR
IAL s
89
03
ur
ba
n d
ens
ity
stu
dy
s o u t h B a n k S t r u c t u r e P L A ND e s i g n a n D P l a n n i n g a t A e c om

buIlt FoRMsItE
3.4 Case Study 02 Coin Street, london, uK
0M
50%0-5M
50%5+M0%
HE
IGH
T R
AN
GE
(S
TOR
Ey
S)
ST
RE
ET
SE
TB
AC
K
DW
El
lIN
G T
yP
OlO
Gy
TOWER APARTMENTS0%
MID-RISE APARTMENTS
40%
LOW-RISE ATTACHED
60%
LOW-RISE DETACHED0%
SIT
E A
ER
IAl
1:5
,00
0
Bu
IlD
ING
FO
OT
PR
INT
11.95 ha 50%
OP
EN
SP
AC
E
5.6 ha35%
PRIVATE OPEN SPACE 5%COMMUNAL OPEN SPACE 10%PUBLIC OPEN SPACE 25%
1:10,000
3 9
CA
R P
AR
KIN
G
DATE 1974 - 2009DIST. TO CBD 0 KM / 0 MIN All residential developments in Coin Street are social housing. Four housing developments in the area are each run by ‘fully-mutual’ co-operatives. Members vote on all decisions made by the cooperative and therefore have a strong involvement in the future direction of their housing area.
0% 0%
80% GR
OU
ND
AB
OV
E G
RO
UN
D
20% ON STREET
BASEMENT
100/ha
DWELLINGS/HA
CARS/HA20
DE
NS
ITy
PEOPLE/HA200
300/ha
JOBS/HA300
90
s o u t h B a n k S t r u c t u r e P L A N
03u
rb
an
den
sit
y s
tud
y
D e s i g n a n D P l a n n i n g a t A e c om

ContExt sItE Photos
WA
TE
R S
Ou
RC
E
100% POTABLE TOWN SUPPLY0% STORMWATER REUSED WITHIN SITE AREA0% GREYWATER REUSE0% BLACKWATER REUSE
Bu
IlD
ING
EN
TR
AN
CE
S
AC
CE
SS
TO
OP
EN
SP
AC
E
SMALL PARK/SQUARE6
LARGE PARK1
BUS 0M / 0 MIN WALK
TRAIN 400M / 5 MIN WALK
TRAM/METRO 400M / 5 MIN WALK
FERRY 400M / 5 MIN WALKAC
CE
SS
TO
Pu
Bl
IC
TR
AN
SP
OR
TA
CC
ES
S T
O S
OC
IAl
/ C
OM
Mu
NIT
y I
NF
RA
ST
Ru
CT
uR
E
1 PRIMARY SCHOOL1 SECONDARY SCHOOL2 UNIVERSITY
EN
ER
Gy
SO
uR
CE
80% GRID20% SELF GENERATED0% DISTRICT DISTRIBUTED NETWORK
C0 LIBRARY1 SPORTS CENTRE6 CULTURAL CENTRE / INSTITUTIONS20 CAFES / RESTAURANTS1 CHURCHES
1 MEDICAL SERVICES2 CHILDCARE
4 CONVENIENCE SHOPPING
10-50M APART
<10M APART >50M APART 95% 5% 5%
NO
N-R
ES
IDE
NT
IAl
uS
ES
CO
MM
ER
CIA
L
RE
TAIL
IND
US
TR
IAL
s
E
s
ST
RE
ET
IN
TE
RFA
CE
80% 0% 20%
91
03
ur
ba
n d
ens
ity
stu
dy
s o u t h B a n k S t r u c t u r e P L A ND e s i g n a n D P l a n n i n g a t A e c om

buIlt FoRMsItE
3.5 Case Study 03 Borneo Sporenburg, Amsterdam, Netherlands
0M
100%
0-5M50%
5+M0%
HE
IGH
T R
AN
GE
(S
TOR
Ey
S)
ST
RE
ET
SE
TB
AC
K
DW
El
lIN
G T
yP
OlO
Gy
TOWER APARTMENTS0%
MID-RISE APARTMENTS 25%
LOW-RISE DETACHED0%
LOW-RISE ATTACHED
75%
SIT
E A
ER
IAl
1:5
,00
0
Bu
IlD
ING
FO
OT
PR
INT
11.95 ha 60%
OP
EN
SP
AC
E
3.2 ha20%
PRIVATE OPEN SPACE 6%COMMUNAL OPEN SPACE 2%PUBLIC OPEN SPACE12%
1:10,000
DE
NS
ITy
3 8
CA
R P
AR
KIN
G
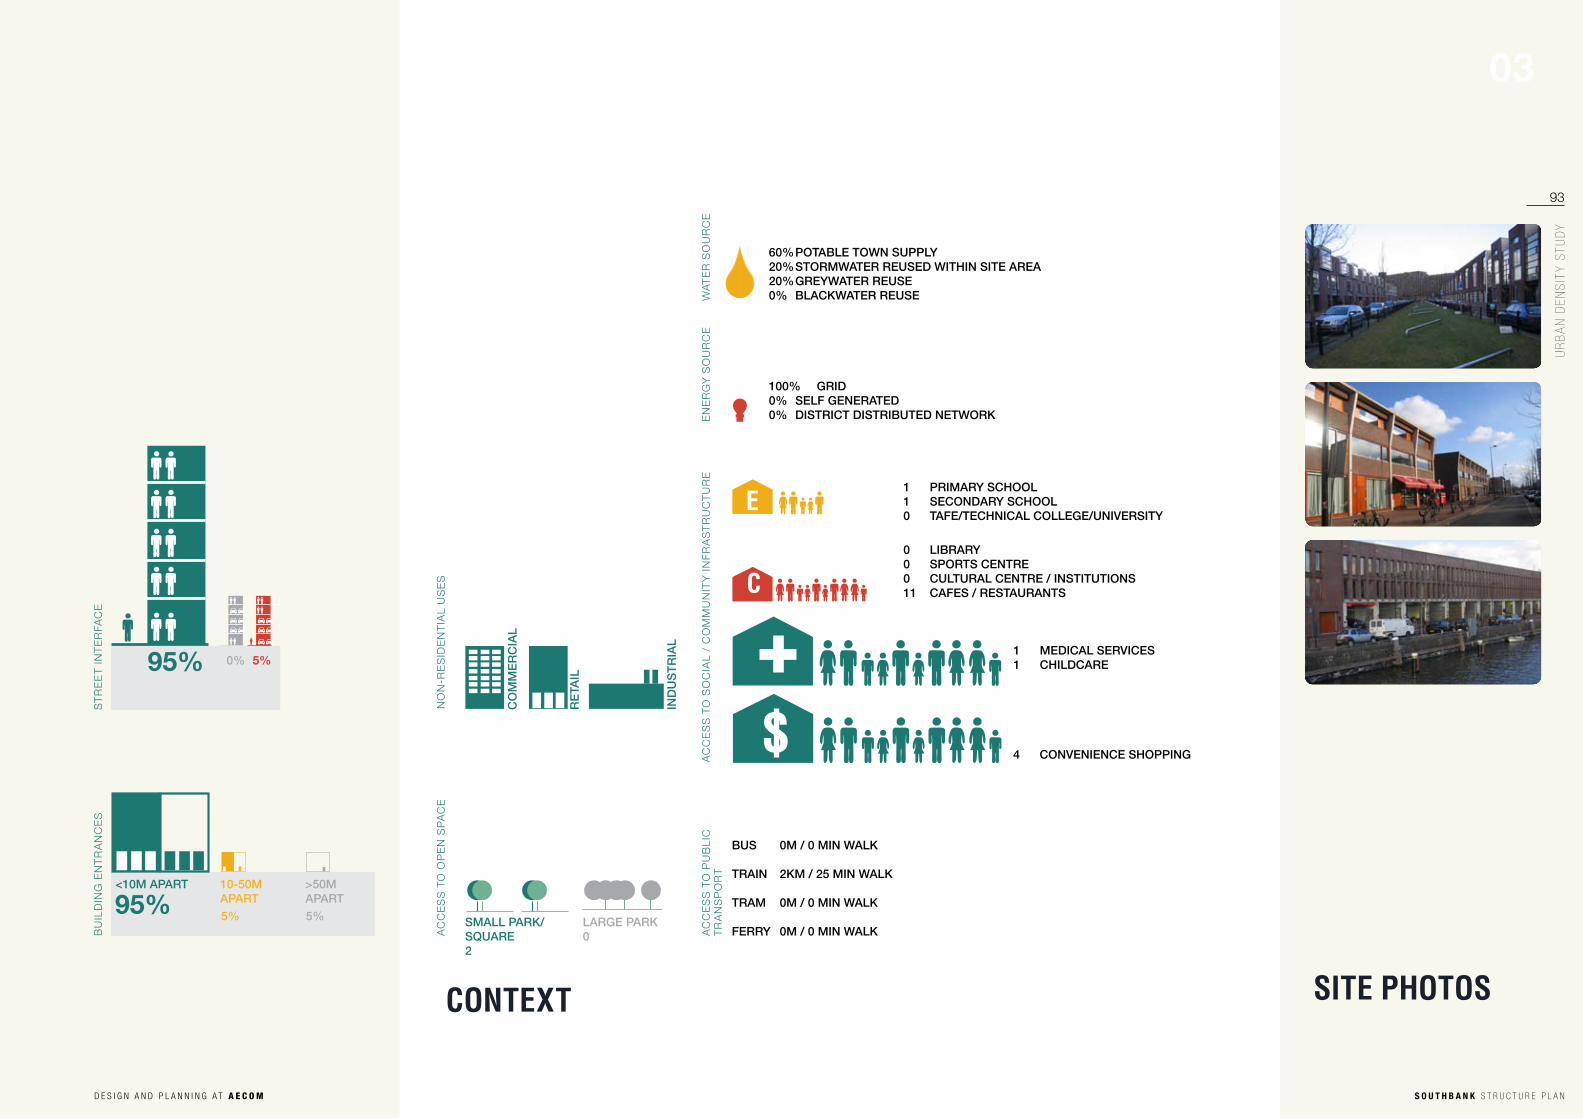
DATE 1996 - 2000DIST. TO CBD 2 KMOf the 17,000 housing units in the Eastern Docklands, those in Borneo Sporenburg are the most innovative, offering a vision of urban living tuned to an aspiration by many to live in the city’s historic core, or some place like it.
40% 0%
25% GR
OU
ND
AB
OV
E G
RO
UN
D
35% ON STREET
BASEMENT
100/ha
DWELLINGS /HA 100
CARS/HA50
PEOPLE/HA200
2.5/ha
JOBS/HA2.5
92
s o u t h B a n k S t r u c t u r e P L A N
03u
rb
an
den
sit
y s
tud
y
D e s i g n a n D P l a n n i n g a t A e c om
ContExt sItE Photos
WA
TE
R S
Ou
RC
E
60% POTABLE TOWN SUPPLY20% STORMWATER REUSED WITHIN SITE AREA20% GREYWATER REUSE0% BLACKWATER REUSE
Bu
IlD
ING
EN
TR
AN
CE
S
AC
CE
SS
TO
OP
EN
SP
AC
E
SMALL PARK/SQUARE2
LARGE PARK0
BUS 0M / 0 MIN WALK
TRAIN 2KM / 25 MIN WALK
TRAM 0M / 0 MIN WALK
FERRY 0M / 0 MIN WALKAC
CE
SS
TO
Pu
Bl
IC
TR
AN
SP
OR
TA
CC
ES
S T
O S
OC
IAl
/ C
OM
Mu
NIT
y I
NF
RA
ST
Ru
CT
uR
E
1 PRIMARY SCHOOL1 SECONDARY SCHOOL0 TAFE/TECHNICAL COLLEGE/UNIVERSITY
EN
ER
Gy
SO
uR
CE
100% GRID0% SELF GENERATED0% DISTRICT DISTRIBUTED NETWORK
C0 LIBRARY0 SPORTS CENTRE0 CULTURAL CENTRE / INSTITUTIONS11 CAFES / RESTAURANTS
E
1 MEDICAL SERVICES1 CHILDCARE
4 CONVENIENCE SHOPPING
10-50M APART
<10M APART >50M APART 95% 5% 5%
NO
N-R
ES
IDE
NT
IAl
uS
ES
CO
MM
ER
CIA
L
RE
TAIL
IND
US
TR
IAL
s
ST
RE
ET
IN
TE
RFA
CE
95% 0% 5%
93
03
ur
ba
n d
ens
ity
stu
dy
s o u t h B a n k S t r u c t u r e P L A ND e s i g n a n D P l a n n i n g a t A e c om

buIlt FoRMsItE
3.6 Case Study 04 Bercy, Paris, France
0M
100%0-5M50%
5+M0%
HE
IGH
T R
AN
GE
(S
TOR
Ey
S)
ST
RE
ET
SE
TB
AC
K
DW
El
lIN
G T
yP
OlO
Gy
TOWER APARTMENTS0%
LOW-RISE DETACHED0%
SIT
E A
ER
IAl
1:5
,00
0
Bu
IlD
ING
FO
OT
PR
INT
7.5 ha 47%
OP
EN
SP
AC
E
8.0 ha50%
PRIVATE OPEN SPACE 10%COMMUNAL OPEN SPACE 10%PUBLIC OPEN SPACE 30%
1:10,000
DE
NS
ITy
CA
R P
AR
KIN
G
Date 1997-1999
Dist. to CBD 2 km
Mixed use development with a new park, high density residential and retail, commerical and leisure facilities
7 9
LOW-RISE ATTACHED0%
MID-RISE APARTMENTS
100%
5% ON STREET
0% 0%
95% GR
OU
ND
AB
OV
E G
RO
UN
D
BASEMENT
16/haJOBS/HA16
DWELLINGS /HA 100
CARS/HA50
PEOPLE/HA200
100/ha
94
s o u t h B a n k S t r u c t u r e P L A N
03u
rb
an
den
sit
y s
tud
y
D e s i g n a n D P l a n n i n g a t A e c om

ContExt sItE Photos
WA
TE
R S
Ou
RC
E
90% POTABLE TOWN SUPPLY10% STORMWATER0% GREYWATER REUSE0% BLACKWATER REUSE
Bu
IlD
ING
EN
TR
AN
CE
S
AC
CE
SS
TO
OP
EN
SP
AC
E
SMALL PARK/SQUARE1
LARGE PARK1
BUS 0M / 0 MIN WALK
TRAIN 400M / 5 MIN WALK
TRAM 0M / 0 MIN WALK
FERRY NAAC
CE
SS
TO
Pu
Bl
IC
TR
AN
SP
OR
T
1 PRIMARY SCHOOL1 SECONDARY SCHOOL0 UNIVERSITY
EN
ER
Gy
SO
uR
CE
100% GRID0% SELF GENERATED0% DISTRICT DISTRIBUTED NETWORK
C0 LIBRARY1 SPORTS CENTRE1 CULTURAL CENTRE / INSTITUTIONS9 CAFES / RESTAURANTS
4 MEDICAL SERVICES1 CHILDCARE
12 CONVENIENCE SHOPPING
NO
N-R
ES
IDE
NT
IAl
uS
ES
CO
MM
ER
CIA
L
RE
TAIL
IND
US
TR
IAL
s
ST
RE
ET
IN
TE
RFA
CE
80% 0% 20%
AC
CE
SS
TO
SO
CIA
l /
CO
MM
uN
ITy
IN
FR
AS
TR
uC
Tu
RE
<10M APART >50M APART 95% 0%
10-50M APART 5%
E
95
03
ur
ba
n d
ens
ity
stu
dy
s o u t h B a n k S t r u c t u r e P L A ND e s i g n a n D P l a n n i n g a t A e c om

buIlt FoRMsItE
0M
80%
0-5M20%
5+M0%
HE
IGH
T R
AN
GE
(S
TOR
Ey
S)
ST
RE
ET
SE
TB
AC
K
DW
El
lIN
G T
yP
OlO
Gy
SIT
E A
ER
IAl
1:5
,00
0
Bu
IlD
ING
FO
OT
PR
INT
9.28 ha 58%
OP
EN
SP
AC
E
6.72 ha42%
PRIVATE OPEN SPACE 15%COMMUNAL OPEN SPACE 18%PUBLIC OPEN SPACE 20%
1:10,000
DATE 1880S-2009DIST. TO CBD 0 KMDowntown long Beach in its current gridded form has developed since the late 1880s. It is a mixed use area, with primary uses being commercial, retail and increasingly residential. Due to public investment and market preferences, Downtown population has increased by 32% since 1990.
TOWER APARTMENTS20%
LOW-RISE DETACHED0%
LOW-RISE ATTACHED10%
MID-RISE APARTMENTS
70%
CA
R P
AR
KIN
G
35% 50%
GR
OU
ND
AB
OV
E G
RO
UN
D
0%
BA
SE
ME
NT
15% ON STREET
3.7 Case Study 05 long Beach, California
7 30
24/ha
DWELLINGS/HA24
CARS/HA24
DE
NS
ITy
PEOPLE/HA50
92/ha
JOBS/HA92
96
s o u t h B a n k S t r u c t u r e P L A N
03u
rb
an
den
sit
y s
tud
y
D e s i g n a n D P l a n n i n g a t A e c om

ContExt sItE Photos
WA
TE
R S
Ou
RC
E
100% POTABLE TOWN SUPPLY0% STORMWATER0% GREYWATER REUSE0% BLACKWATER REUSE
Bu
IlD
ING
EN
TR
AN
CE
S
AC
CE
SS
TO
OP
EN
SP
AC
E
LARGE PARK1
BUS 60M / 1 MIN WALK
TRAIN 150M / 3 MIN WALK
TRAM NO
FERRY 600M / 8 MIN WALKAC
CE
SS
TO
Pu
Bl
IC
TR
AN
SP
OR
TA
CC
ES
S T
O S
OC
IAl
/ C
OM
Mu
NIT
y I
NF
RA
ST
Ru
CT
uR
E 5 PRIMARY SCHOOL3 SECONDARY SCHOOL3 UNIVERSITY
EN
ER
Gy
SO
uR
CE
100% GRID0% SELF GENERATED0% DISTRICT DISTRIBUTED NETWORK
C4 LIBRARY9 SPORTS CENTRE3 CULTURAL CENTRE / INSTITUTIONS30 CAFES / RESTAURANTS
E
9 MEDICAL SERVICES5 CHILDCARE
5 CONVENIENCE SHOPPING
10-50M APART
<10M APART >50M APART 50%
20% 30%
NO
N-R
ES
IDE
NT
IAl
uS
ES
CO
MM
ER
CIA
L
RE
TAIL
IND
US
TR
IAL
s
ST
RE
ET
IN
TE
RFA
CE
65% 15% 20%
SMALL PARK/SQUARE2
97
03
ur
ba
n d
ens
ity
stu
dy
s o u t h B a n k S t r u c t u r e P L A ND e s i g n a n D P l a n n i n g a t A e c om
sItE
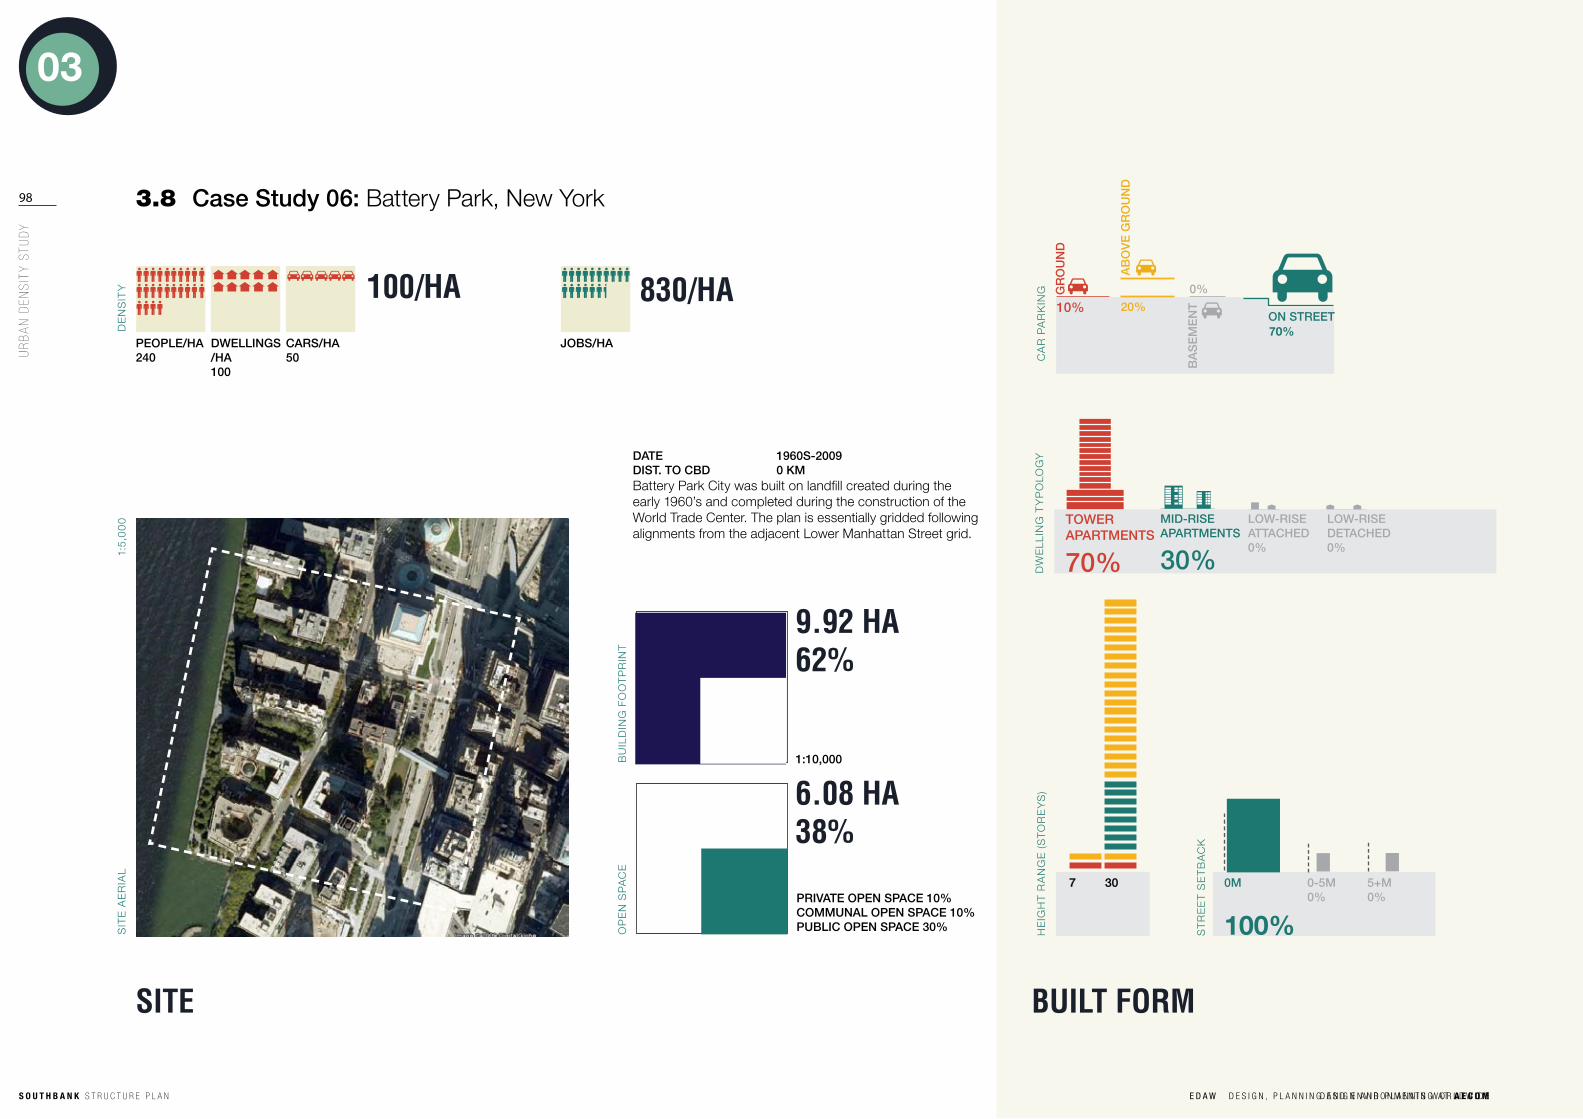
PRIVATE OPEN SPACE 10%COMMUNAL OPEN SPACE 10%PUBLIC OPEN SPACE 30%
0M
100%
0-5M0%
5+M0%
HE
IGH
T R
AN
GE
(S
TOR
Ey
S)
ST
RE
ET
SE
TB
AC
K
DW
El
lIN
G T
yP
OlO
Gy
SIT
E A
ER
IAl
1:5
,00
0
Bu
IlD
ING
FO
OT
PR
INT
9.92 ha 62%
OP
EN
SP
AC
E
6.08 ha38%
1:10,000
DATE 1960S-2009DIST. TO CBD 0 KMBattery Park City was built on landfill created during the early 1960’s and completed during the construction of the World Trade Center. The plan is essentially gridded following alignments from the adjacent lower Manhattan Street grid.
TOWER APARTMENTS
70%
LOW-RISE DETACHED0%
LOW-RISE ATTACHED0%
MID-RISE APARTMENTS
30%
7 30
CA
R P
AR
KIN
G
10% 20%
GR
OU
ND
AB
OV
E G
RO
UN
D
0%
BA
SE
ME
NT
70% ON STREET
3.8 Case Study 06: Battery Park, New york
buIlt FoRM
DE
NS
ITy 100/ha
DWELLINGS/HA 100
CARS/HA50
PEOPLE/HA240
830/haJOBS/HA
98
s o u t h B a n k S t r u c t u r e P L A N
03u
rb
an
den
sit
y s
tud
y
D e s i g n a n D P l a n n i n g a t A e c omE D AW D e s i g n , P l a n n i n g a n D e n v i r O n m e n t s w O r l D w i D e

ContExt sItE Photos
WA
TE
R S
Ou
RC
E
99% POTABLE TOWN SUPPLY1% STORMWATER0% GREYWATER REUSE0% BLACKWATER REUSE
Bu
IlD
ING
EN
TR
AN
CE
S
AC
CE
SS
TO
OP
EN
SP
AC
E
SMALL PARK/SQUARE12
LARGE PARK3
BUS 100M / 1 MIN WALK
TRAIN 200M / 2 MIN WALK
TRAM NO
FERRY 200M / 2 MIN WALKAC
CE
SS
TO
Pu
Bl
IC
TR
AN
SP
OR
TA
CC
ES
S T
O S
OC
IAl
/ C
OM
Mu
NIT
y I
NF
RA
ST
Ru
CT
uR
E 1 PRIMARY SCHOOL2 SECONDARY SCHOOL0 UNIVERSITY
EN
ER
Gy
SO
uR
CE
100% GRID0% SELF GENERATED0% DISTRICT DISTRIBUTED NETWORK
C0 LIBRARY1 SPORTS CENTRE4 CULTURAL CENTRE / INSTITUTIONS39 CAFES / RESTAURANTS
E
0 MEDICAL SERVICES6 CHILDCARE
42 CONVENIENCE SHOPPING
10-50M APART
<10M APART >50M APART 15%
80% 5%
NO
N-R
ES
IDE
NT
IAl
uS
ES
CO
MM
ER
CIA
L
RE
TAIL
IND
US
TR
IAL
s
ST
RE
ET
IN
TE
RFA
CE
90% 5% 5%
99
03
ur
ba
n d
ens
ity
stu
dy
s o u t h B a n k S t r u c t u r e P L A ND e s i g n a n D P l a n n i n g a t A e c om

buIlt FoRMsItE
0M
90%0-5M10%
5+M0%
HE
IGH
T R
AN
GE
(S
TOR
Ey
S)
ST
RE
ET
SE
TB
AC
K
1 92
DW
El
lIN
G T
yP
OlO
Gy
TOWER APARTMENTS
90%
LOW-RISE DETACHED0%
LOW-RISE ATTACHED0%
MID-RISE APARTMENTS
10%
CA
R P
AR
KIN
G 20% 60%
GR
OU
ND
AB
OV
E G
RO
UN
D
10%
BA
SE
ME
NT
10% ON STREET
3.9 Case Study 07 Southbank, Melbourne, Australia
SIT
E A
ER
IAl
1:5
,00
0
Bu
IlD
ING
FO
OT
PR
INT
8.0 ha 50%
OP
EN
SP
AC
E
8.0 ha50%
PRIVATE OPEN SPACE 0%COMMUNAL OPEN SPACE 5%PUBLIC OPEN SPACE 45%
1:10,000
DATE 1840S-2009DIST. TO CBD 0 KM
Southbank in its current form was developed in the 1980s from its pre-existing industrial use.
41/haDWELLINGS/HA41
CARS/HA41
DE
NS
ITy
PEOPLE/HA581.3 PER DWELLING
252/haJOBS/HA
100
s o u t h B a n k S t r u c t u r e P L A N
03u
rb
an
den
sit
y s
tud
y
D e s i g n a n D P l a n n i n g a t A e c om

ContExt sItE Photos
WA
TE
R S
Ou
RC
E
100% POTABLE TOWN SUPPLY0% STORMWATER0% GREYWATER REUSE0% BLACKWATER REUSE
Bu
IlD
ING
EN
TR
AN
CE
S
AC
CE
SS
TO
OP
EN
SP
AC
E
SMALL PARK/SQUARE3
LARGE PARK1
BUS 0M / 0 MIN WALK
TRAIN 400M / 5 MINS WALK
TRAM 100M / 2 MINS WALK
FERRY 800M / 10 MINS WALKAC
CE
SS
TO
Pu
Bl
IC
TR
AN
SP
OR
TA
CC
ES
S T
O S
OC
IAl
/ C
OM
Mu
NIT
y I
NF
RA
ST
Ru
CT
uR
E 0 PRIMARY SCHOOL1 SECONDARY SCHOOL1 UNIVERSITY
EN
ER
Gy
SO
uR
CE
100% GRID0% SELF GENERATED0% DISTRICT DISTRIBUTED NETWORK
C
0 LIBRARY0 SPORTS CENTRE10 CULTURAL CENTRE / INSTITUTIONS40 CAFES / RESTAURANTS
E
0 MEDICAL SERVICES0 CHILDCARE
4 CONVENIENCE SHOPPING
10-50M APART <10M APART >50M APART 20% 50% 30%
NO
N-R
ES
IDE
NT
IAl
uS
ES
CO
MM
ER
CIA
L
RE
TAIL
IND
US
TR
IAL
s
ST
RE
ET
IN
TE
RFA
CE
20% 45% 35% +
101
03
ur
ba
n d
ens
ity
stu
dy
s o u t h B a n k S t r u c t u r e P L A ND e s i g n a n D P l a n n i n g a t A e c om

buIlt FoRMsItE
0M0%
0-5M100%
5+M0%
HE
IGH
T R
AN
GE
(S
TOR
Ey
S)
ST
RE
ET
SE
TB
AC
K
SIT
E A
ER
IAl
1:5
,00
0
Bu
IlD
ING
FO
OT
PR
INT
9.92 ha 62%
OP
EN
SP
AC
E
6.08 ha38%
PRIVATE OPEN SPACE 10%COMMUNAL OPEN SPACE 10%PUBLIC OPEN SPACE 30%
1:10,000
DATE 2000DIST. TO CBD 0 KMBeddington Zero Energy Neighbourhood was developed as a prototype of a carbon neutral neighbourhood.
CA
R P
AR
KIN
G 20% 0%
GR
OU
ND
AB
OV
E G
RO
UN
D
0%
BA
SE
ME
NT
80% ON STREET
3.10 Case Study 08 Beddington Zero, Surrey, uK
3 3
DW
El
lIN
G T
yP
OlO
Gy
TOWER APARTMENTS0%
MID-RISE APARTMENTS
100%
LOW-RISE ATTACHED0%
LOW-RISE DETACHED0%
62/ha
DWELLINGS/HA62
CARS/HA15
DE
NS
ITy
PEOPLE/HA100
10/ha
JOBS/HA
102
s o u t h B a n k S t r u c t u r e P L A N
03u
rb
an
den
sit
y s
tud
y
D e s i g n a n D P l a n n i n g a t A e c om

ContExt sItE Photos
WA
TE
R S
Ou
RC
E
70% POTABLE TOWN SUPPLY15% STORMWATER15% GREYWATER REUSE0% BLACKWATER REUSE
Bu
IlD
ING
EN
TR
AN
CE
S
AC
CE
SS
TO
OP
EN
SP
AC
E
SMALL PARK/SQUARE2
LARGE PARK1
BUS 0M / 0 MIN WALK
TRAIN 600M / 7 MIN WALK
TRAM NO
FERRY NOAC
CE
SS
TO
Pu
Bl
IC
TR
AN
SP
OR
TA
CC
ES
S T
O S
OC
IAl
/ C
OM
Mu
NIT
y I
NF
RA
ST
Ru
CT
uR
E 1 PRIMARY SCHOOL0 SECONDARY SCHOOL0 UNIVERSITY
EN
ER
Gy
SO
uR
CE
50% GRID50% SELF GENERATED0% DISTRICT DISTRIBUTED NETWORK
C
0 LIBRARY2 SPORTS CENTRE2 CULTURAL CENTRE / INSTITUTIONS5 CAFES / RESTAURANTS
E
1 MEDICAL SERVICES1 CHILDCARE
3 CONVENIENCE SHOPPING
10-50M APART <10M APART >50M APART 50% 50% 0%
NO
N-R
ES
IDE
NT
IAl
uS
ES
CO
MM
ER
CIA
L
RE
TAIL
IND
US
TR
IAL
s
ST
RE
ET
IN
TE
RFA
CE
80% 0% 20%
103
03
ur
ba
n d
ens
ity
stu
dy
s o u t h B a n k S t r u c t u r e P L A ND e s i g n a n D P l a n n i n g a t A e c om

buIlt FoRMsItE
104 3.11 Case Study 09: Mid-levels, Hong Kong
0M
95%0-5M5%
5+M0%
HE
IGH
T R
AN
GE
(S
TOR
Ey
S)
ST
RE
ET
SE
TB
AC
K
10+
DW
El
lIN
G T
yP
OlO
Gy
SIT
E A
ER
IAl
1:5
,00
0
Bu
IlD
ING
FO
OT
PR
INT
9.28 ha 58%
DATE 1800S - 2009DIST. TO CBD 1.8 KM / 10 MIN The Mid levels of Hong Kong is a vibrant mixed use district within close range of the CBD, Central. Accessed via a series of covered escalators, the area contains a variety of community amenities, universities, restaurants and local grocers. It is well integrated and contains numerous open spaces.
OP
EN
SP
AC
E
4.4 ha42%
PRIVATE OPEN SPACE 3%PUBLIC SQUARE 4%PUBLIC PARKS 20%
1:10,000
DE
NS
ITy
40+
8 45
CA
R P
AR
KIN
G 15% 75%
GR
OU
ND
AB
OV
E G
RO
UN
D
5%
BA
SE
ME
NT
5% ON STREET
TOWER APARTMENTS
75%
MID-RISE APARTMENTS 25%
LOW-RISE ATTACHED0%
LOW-RISE DETACHED0%
DWELLINGS /HA118
CARS/HA15
PEOPLE/HA308
JOBS/HA45
118/ha 45/ha
104
s o u t h B a n k S t r u c t u r e P L A N
03u
rb
an
den
sit
y s
tud
y
D e s i g n a n D P l a n n i n g a t A e c om

ContExt sItE Photos
WA
TE
R S
Ou
RC
E
99% POTABLE TOWN SUPPLY0.5% STORMWATER REUSED WITHIN SITE AREA0.1% GREYWATER REUSE0.1% BLACKWATER REUSE
ST
RE
ET
IN
TE
RFA
CE
70% 25% 5%
Bu
IlD
ING
EN
TR
AN
CE
S
AC
CE
SS
TO
OP
EN
SP
AC
E
SMALL PARK/SQUARE2
LARGE PARK1
BUS 0M / 0 MIN WALK
TRAIN 0M / 0 MIN WALK
TRAM 1 KM / 12 MIN WALK
FERRY 1.2 KM / 15 MIN WALKAC
CE
SS
TO
Pu
Bl
IC
TR
AN
SP
OR
TA
CC
ES
S T
O S
OC
IAl
/ C
OM
Mu
NIT
y I
NF
RA
ST
Ru
CT
uR
E 15 PRIMARY SCHOOL8 SECONDARY SCHOOL1 UNIVERSITY
EN
ER
Gy
SO
uR
CE
100% GRID0% SELF GENERATED0% DISTRICT DISTRIBUTED NETWORK
C1 LIBRARY1 SPORTS CENTRE4 CULTURAL CENTRE / INSTITUTIONS27 CAFES / RESTAURANTS
32 MEDICAL SERVICES3 CHILDCARE
10 CONVENIENCE SHOPPINGs
>50M APART 5%
<10M APART
75%
10-50M APART
20%
NO
N-R
ES
IDE
NT
IAl
uS
ES
RE
TAIL
sIN
DU
ST
RIA
L
CO
MM
ER
CIA
LE
105
03
ur
ba
n d
ens
ity
stu
dy
s o u t h B a n k S t r u c t u r e P L A ND e s i g n a n D P l a n n i n g a t A e c om

106 3.12 Case Study 10: Eixample, Barcelona, Spain
0M
100%0-5M0%
5+M0%
HE
IGH
T R
AN
GE
(S
TOR
Ey
S)
ST
RE
ET
SE
TB
AC
K
DW
El
lIN
G T
yP
OlO
Gy
SIT
E A
ER
IAl
1:5
,00
0
Bu
IlD
ING
FO
OT
PR
INT
11.04 ha 69%
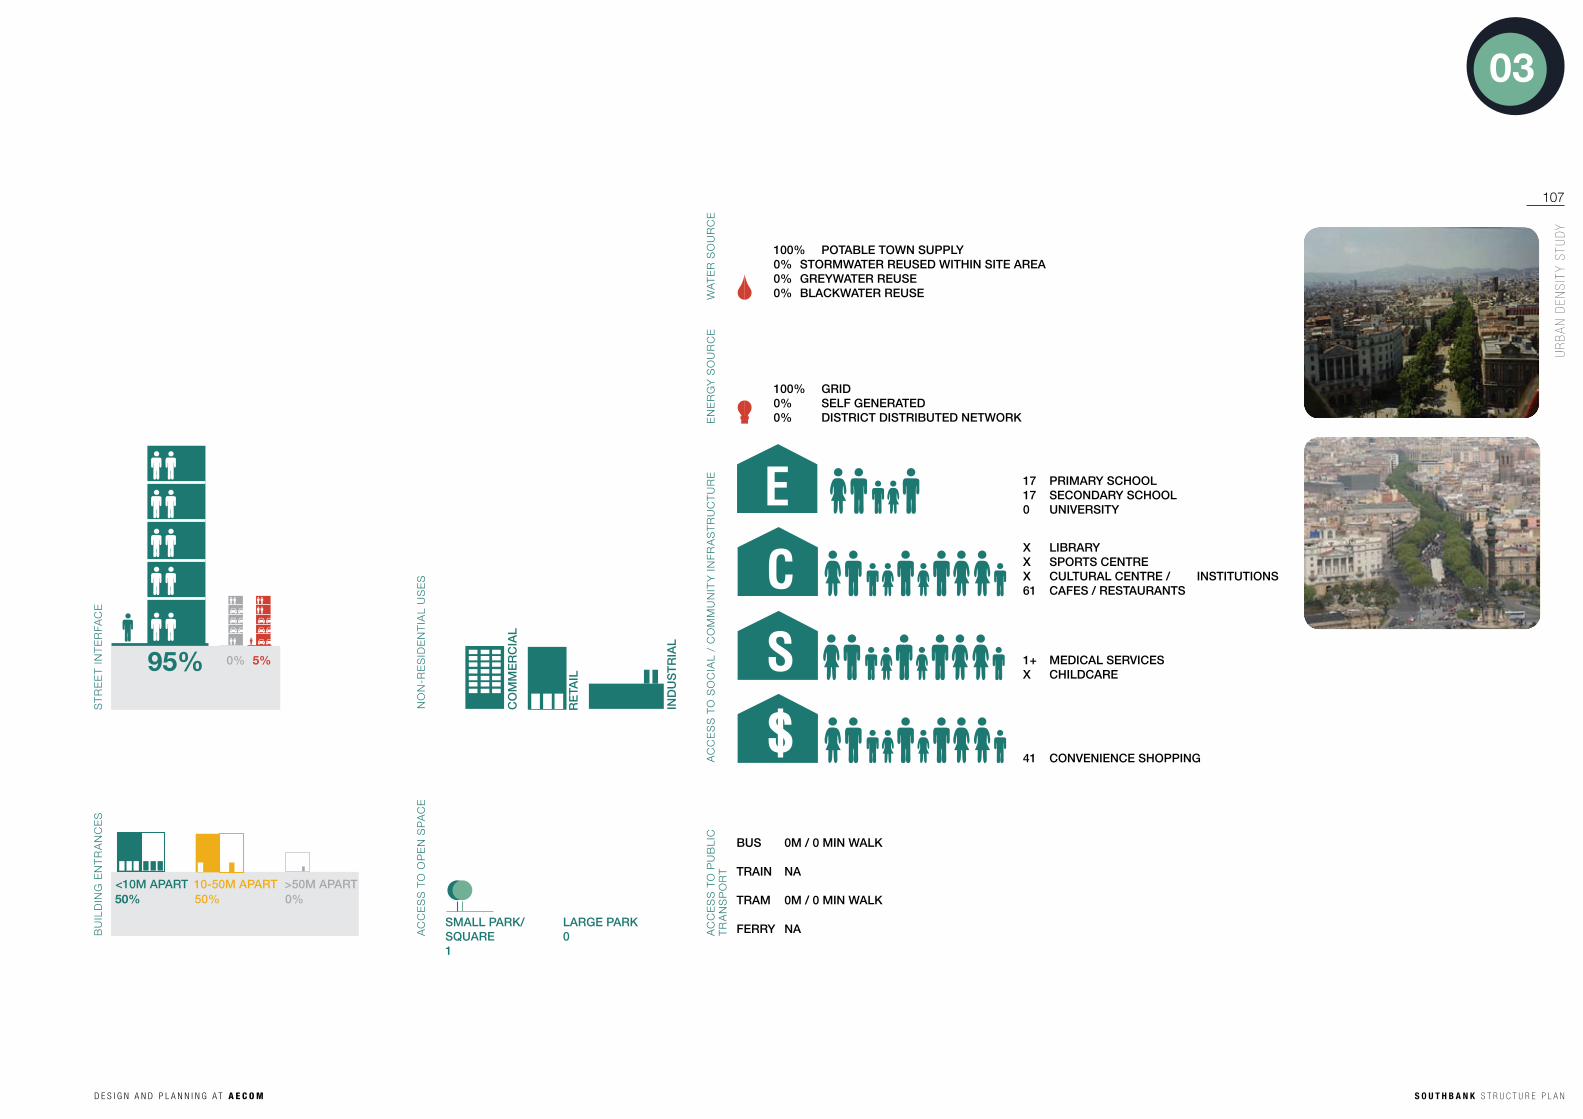
DATE 1850-1900DIST. TO CBD 2KM The Eixample district in Barcelona was designed by Cerdes as an extension to the city beyond the traditional defensible walls. The grid block layout is repeated across the 7.5 square kilometre suburb. It is Barcelona’s densest city area.
OP
EN
SP
AC
E
4.96 ha31%
PRIVATE OPEN SPACE 0%COMMUNAL OPEN SPACE 3%PUBLIC OPEN SPACE 28%
1:10,000
3 8
TOWER APARTMENTS0%
MID-RISE APARTMENTS
100%
LOW-RISE ATTACHED0%
LOW-RISE DETACHED0%
CA
R P
AR
KIN
G
40% 0%
20% GR
OU
ND
AB
OV
E G
RO
UN
D
40% ON STREET
BASEMENT
DE
NS
ITy
DWELLINGS /HA230
CARS/HA140
PEOPLE/HA351
JOBS/HA78
230/ha 78/ha
106
s o u t h B a n k S t r u c t u r e P L A N
03u
rb
an
den
sit
y s
tud
y
D e s i g n a n D P l a n n i n g a t A e c om
WA
TE
R S
Ou
RC
E
100% POTABLE TOWN SUPPLY0% STORMWATER REUSED WITHIN SITE AREA0% GREYWATER REUSE0% BLACKWATER REUSE
AC
CE
SS
TO
OP
EN
SP
AC
E
SMALL PARK/SQUARE1
LARGE PARK0
BUS 0M / 0 MIN WALK
TRAIN NA
TRAM 0M / 0 MIN WALK
FERRY NAAC
CE
SS
TO
Pu
Bl
IC
TR
AN
SP
OR
TA
CC
ES
S T
O S
OC
IAl
/ C
OM
Mu
NIT
y I
NF
RA
ST
Ru
CT
uR
E 17 PRIMARY SCHOOL17 SECONDARY SCHOOL0 UNIVERSITY
EN
ER
Gy
SO
uR
CE
100% GRID0% SELF GENERATED0% DISTRICT DISTRIBUTED NETWORK
Cx LIBRARYx SPORTS CENTREx CULTURAL CENTRE / INSTITUTIONS61 CAFES / RESTAURANTS
1+ MEDICAL SERVICESx CHILDCARE
41 CONVENIENCE SHOPPINGs
NO
N-R
ES
IDE
NT
IAl
uS
ES
s
RE
TAIL
IND
US
TR
IAL
CO
MM
ER
CIA
LE
ST
RE
ET
IN
TE
RFA
CE
95% 0% 5%
Bu
IlD
ING
EN
TR
AN
CE
S
10-50M APART <10M APART >50M APART 50% 50% 0%
107
03
ur
ba
n d
ens
ity
stu
dy
s o u t h B a n k S t r u c t u r e P L A ND e s i g n a n D P l a n n i n g a t A e c om

3.13 Conclusions from the Urban Density Case Study
50
58
308
100
351
10 lonG bEaCh, CalIFoRnIa
09 southbank, MElbouRnE
08 bEddInGton ZERo, suRREy
02 MId lEVEls, honG konG
01 EIxaMPlE, baRCElona
24
41
118
50
230
200
200
240
03 boRnEo sPoREnbuRG, aMstERdaM
03 bERCy, PaRIs
03 battERy PaRk, nEW yoRk
100
100
100
108
07 MElbouRnE Cbd 66
03 CoIn st, london100200
PoPu
latI
on
dWEl
lInG
CaRs
CaRs
/dW
EllI
nG
EMPl
oyM
Ent
thE REsultsALL DENSITIES
50
50
50
24
41
33
15
12
140
20
0.6/
0.1/
0.2/
0.5/
0.5/
0.5/
0.5/
0.2/
1.0/
1.0/24/ha
41/ha
50/ha
118/ha
230/ha
100/ha
100/ha
100/ha
66/ha
92/ha
252/ha
10/ha
45/ha
78/ha
2.5/ha
16/ha
830/ha
1255/ha
300/ha100/ha
108
s o u t h B a n k S t r u c t u r e P L A N
03u
rb
an
den
sit
y s
tud
y
D e s i g n a n D P l a n n i n g a t A e c om
The following is a summary of the case studies ordered according to residential densities.
3.13.01 Densities
DensitiesFive of the case study examples all achieved dwelling densities in the order of 100 dwellings per hectare. These included Hong Kong, Bercy, Borneo-Sporenburg, Coin Street and Battery Park. The remaining four case studies recorded densities of 66 (Melbourne), 50 (Beddington Zero), 41 (Southbank) and 24 (long Beach).
Employment densities varied greatly with four case studies exceeding 100 jobs per hectare. These were Coin Street, Battery Park, Melbourne CBD and Southbank. long Beach was within reach of this number at 92 jobs/hectare. The remaining three case studies Bercy, Borneo-Sporenburg and Beddington Zero recorded distinctly lower densities ranging from 2.5 to 16 jobs per hectare. These figures reflect the predominantly residential use of these sites.
In order to achieve a successful mixed use area, it will be important to balance sustainable residential and employment densities.
Car densities were typically difficult to determine with information on car ownership not readily available for each case study. Similarly, population data that we defined for the relatively small study areas analysed was not easily accessible. Considering the reliance on assumed ratios of car ownership and the number of residents per dwelling the recommendations drawn from this study will focus primarily on dwelling and employment densities.

Case
stu
dy
Dwel
ling
Empl
oym
ent
Dens
ityop
en s
pace
Priv
ate
Com
mun
al
Publ
ic
eixample, Barcelona 230 78 31% - 3% 28%
mid levels, Hong Kong
118 45 48% - 5% 43%
Bercy, Paris 100 16 50% 10% 10% 30%
Borneo-sporenburg 100 2.5 20% 6% 2% 12%
Coin street 100 300 35% 5% 10% 20%
Battery Park 100 830 38% - 10% 28%
melbourne CBD 66 1255 27% - - 27%
Beddington Zero 50 10 50% 10% 20% 20%
southbank 41 252 50% - 5% 45%
long Beach 24 92 42% 4% 18% 20%
Case
stu
dy
Dwel
ling
Dens
ity
Empl
oym
ent
Dens
ity
Build
ing
Foot
prin
t
eixample, Barcelona 230 78 69%
mid levels, Hong Kong 118 45 58%
Bercy, Paris 100 16 47%
Borneo-sporenburg 100 2.5 60%
Coin street 100 300 50%
Battery Park 100 830 62%
melbourne CBD 66 1255 73%
Beddington Zero 50 10 50%
southbank 41 252 50%
long Beach 24 92 58%
3.13.A BUILDING FOOTPRINT BREAKDOWN 3.13.B OPEN SPACE BREAKDOWN
109
03
ur
ba
n d
ens
ity
stu
dy
s o u t h B a n k S t r u c t u r e P L A ND e s i g n a n D P l a n n i n g a t A e c om
3.13.02 Site
Built FootprintThe building site coverage across the case studies ranged from 47% (Bercy) to 73% (Melbourne CBD). The majority of study areas were within excess of -8 percentage points of the average of 58% site coverage. Melbourne CBD and Barcelona had the highest percentage of site coverage at 73% and 69% respectively. There was no relationship evident in this study between the residential or employment densities, and building footprints.
The building coverage for Southbank was 50% which was 8 percentage points lower than the average.
Open SpaceThe area of each site attributed to open space ranged from 20% to 50%. The majority of this area in each case was provided as public space predominantly in the road corridors/transit ways but also as accessible urban parkland. Private open space accounted for a maximum of 10% of the site area (Bercy and Beddington Zero) and was not evident within Mid levels, Battery Park, Melbourne CBD, Southbank or Barcelona.
Southbank recorded the equal highest area of open space (50%) and the highest area of public open space (45%). Bercy and Beddington Zero also recorded 50% open space area followed closely by Hong Kong (48%). However a review of the aerial photographs illustrates that within Southbank a significant portion of this area is road infrastructure and not available as green community active or passive recreation areas.
MId lEVEls, honG konG
bERCy, PaRIs
EIxaMPlE, baRCElona
CoIn st, london
100
TOWER APARTMENTS0%
MID-RISE APARTMENTS
40%
LOW-RISE ATTACHED
60%
LOW-RISE DETACHED0%
boRnEo sPoREnbuRG, aMstERdaM100
TOWER APARTMENTS0%
MID-RISE APARTMENTS 25%
LOW-RISE DETACHED0%
LOW-RISE ATTACHED
75%
100
TOWER APARTMENTS0%
LOW-RISE DETACHED0%
LOW-RISE ATTACHED0%
MID-RISE APARTMENTS
100%
118
TOWER APARTMENTS
75%
MID-RISE APARTMENTS 25%
LOW-RISE ATTACHED0%
LOW-RISE DETACHED0%
230
TOWER APARTMENTS0%
MID-RISE APARTMENTS
100%
LOW-RISE ATTACHED0%
LOW-RISE DETACHED0%
01
02
03
03
03 lonG bEaCh, CalIFoRnIa
southbank, MElbouRnE
bEddInGton ZERo, suRREy
MElbouRnE Cbd
battERy PaRk, nEW yoRk
24
41
50
100
66
TOWER APARTMENTS5%
MID-RISE APARTMENTS
95%LOW-RISE ATTACHED0%
LOW-RISE DETACHED0%
TOWER APARTMENTS20%
LOW-RISE DETACHED0%
LOW-RISE ATTACHED10%
MID-RISE APARTMENTS
70%
TOWER APARTMENTS
70%
LOW-RISE DETACHED0%
LOW-RISE ATTACHED0%
MID-RISE APARTMENTS
30%
TOWER APARTMENTS
70%
LOW-RISE DETACHED0%
LOW-RISE ATTACHED0%
MID-RISE APARTMENTS
30%
TOWER APARTMENTS0%
MID-RISE APARTMENTS
100%
LOW-RISE ATTACHED0%
LOW-RISE DETACHED0%
03
07
08
09
10
110
s o u t h B a n k S t r u c t u r e P L A N
03u
rb
an
den
sit
y s
tud
y
D e s i g n a n D P l a n n i n g a t A e c om
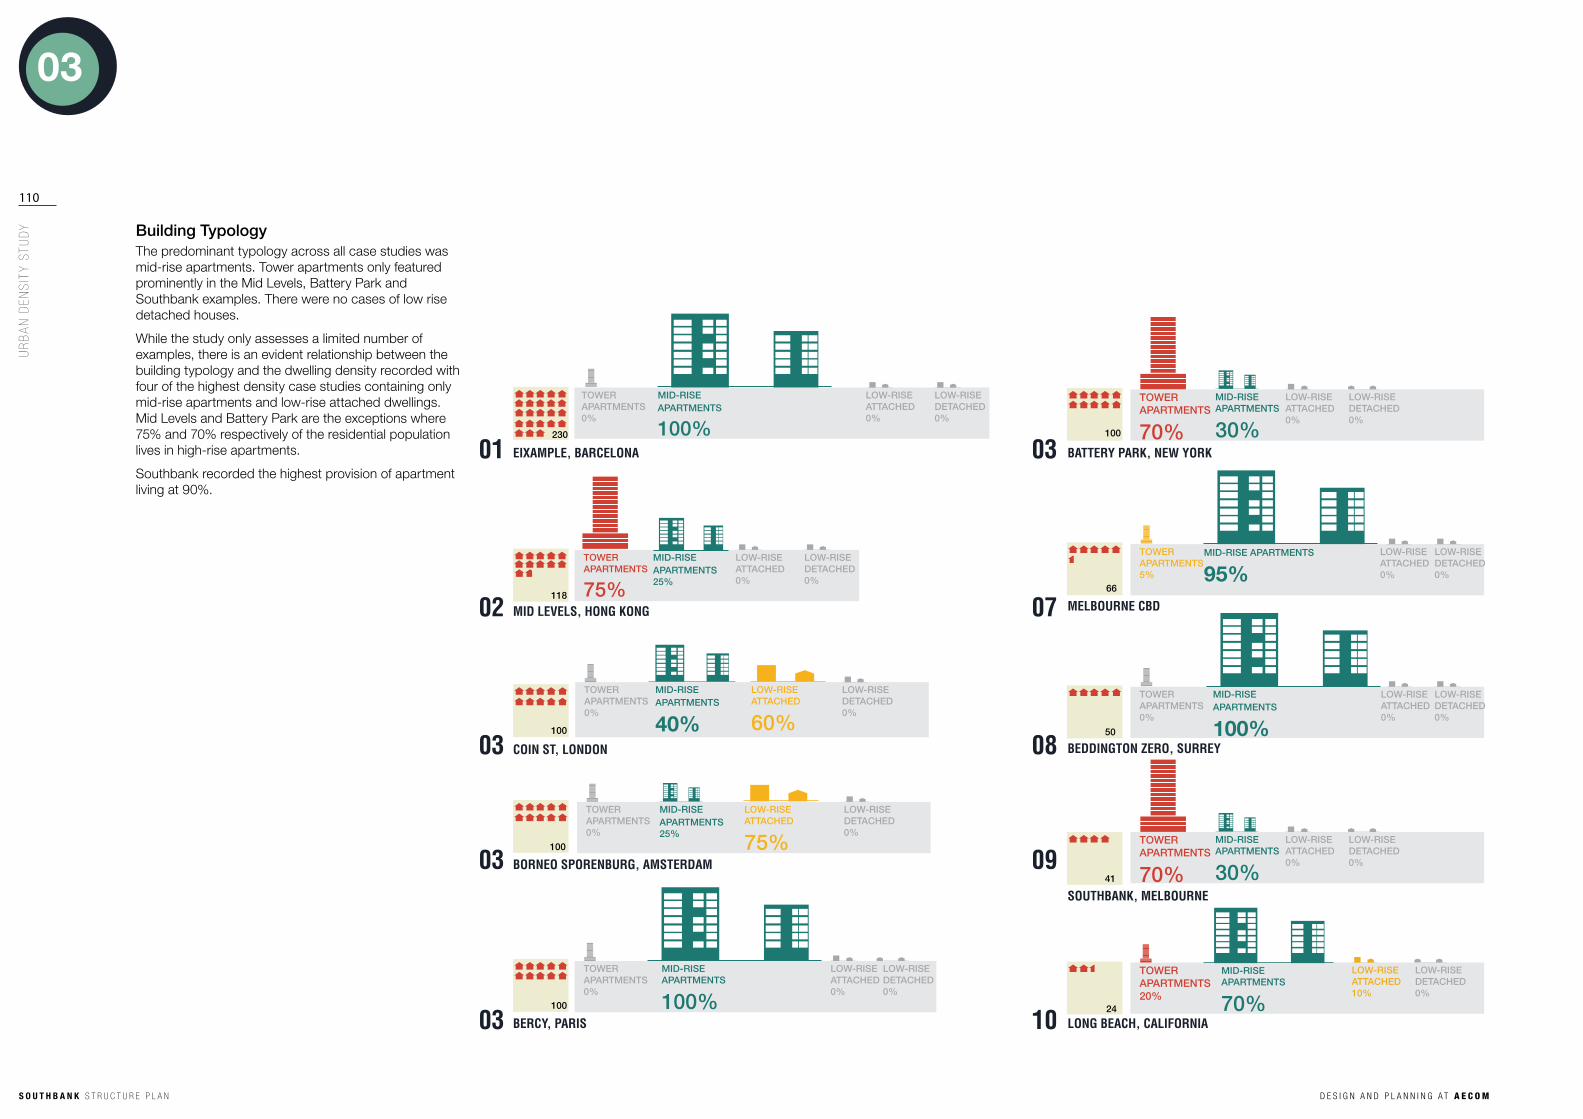
Building TypologyThe predominant typology across all case studies was mid-rise apartments. Tower apartments only featured prominently in the Mid levels, Battery Park and Southbank examples. There were no cases of low rise detached houses.
While the study only assesses a limited number of examples, there is an evident relationship between the building typology and the dwelling density recorded with four of the highest density case studies containing only mid-rise apartments and low-rise attached dwellings. Mid levels and Battery Park are the exceptions where 75% and 70% respectively of the residential population lives in high-rise apartments.
Southbank recorded the highest provision of apartment living at 90%.

lonG
bEa
Ch, C
alIF
oRnI
a
sout
hban
k, M
Elbo
uRnE
bEdd
InGt
on Z
ERo,
suR
REy
MEl
bouR
nE C
bd
MId
lEV
Els,
hon
G ko
nG
boRn
Eo s
PoRE
nbuR
G, a
Mst
ERda
M
bERC
y, P
aRIs
batt
ERy
PaRk
, nEW
yoR
k
EIxa
MPl
E, b
aRCE
lona
CoIn
st,
lon
don
2 922 123 9 3 8 7 9 7 307 30 3 38 453 8
100 100 100 244166118 50230 100
01 02 03 03 03 03 07 08 09 10 3.13.E BUILDING HEIGHT BREAKDOWN
111
03
ur
ba
n d
ens
ity
stu
dy
s o u t h B a n k S t r u c t u r e P L A ND e s i g n a n D P l a n n i n g a t A e c om
Building HeightFollowing the building typology mix, the predominant height range for buildings was 2-10 storeys. The maximum height of any dwelling was the Eureka Tower in Southbank at 92 storeys. This far surpassed the next tallest building at 42 storeys in Hong Kong. Four of the five highest dwelling density examples did not exceed 9 storeys. Higher buildings were associated with higher employment densities.
The relationship between building heights and densities is illustrated in Figure 3.13E.
Southbank has the most differentiation between building heights within the study areas with the highest and lowest building heights recorded.

MId lEVEls, honG konG
bERCy, PaRIs
CoIn st, london100
100
118
15% 75%
GR
OU
ND
AB
OV
E G
RO
UN
D
5%
BA
SE
ME
NT
5% ON STREET
5% ON STREET
0% 0%
95% GR
OU
ND
AB
OV
E G
RO
UN
D
BASEMENT
0% 0%
80% GR
OU
ND
AB
OV
E G
RO
UN
D
20% ON STREET
BASEMENT
50
15
lonG bEaCh, CalIFoRnIa
southbank, MElbouRnE
bEddInGton ZERo, suRREy
MElbouRnE Cbd
24
41
50
66
20% 0%
GR
OU
ND
AB
OV
E G
RO
UN
D
0%
BA
SE
ME
NT
80% ON STREET
20% 60%
GR
OU
ND
AB
OV
E G
RO
UN
D
10%
BA
SE
ME
NT
10% ON STREET
35% 50%
GR
OU
ND
AB
OV
E G
RO
UN
D
0%
BA
SE
ME
NT
15% ON STREET
2%
78%
AB
OV
E G
RO
UN
D
15% ON STREET
BASEMENT
5%
GR
OU
ND
24
41
33
1220
40% 0%
20% GR
OU
ND
AB
OV
E G
RO
UN
D
40% ON STREET
BASEMENT
EIxaMPlE, baRCElona230140 0.6/
0.1/
0.2/
boRnEo sPoREnbuRG, aMstERdaM100
40% 0%
25% GR
OU
ND
AB
OV
E G
RO
UN
D
35% ON STREET
BASEMENT
50 0.5/
0.5/
50
battERy PaRk, nEW yoRk100
10% 20%
GR
OU
ND
AB
OV
E G
RO
UN
D
0%
BA
SE
ME
NT
70% ON STREET
0.5/
0.2/
1.0/
1.0/
0.5/01
03
03
02
03
03
07
08
09
10
bEST
PER
foRM
ERS
>80
% P
oSIT
IvE
woR
ST P
ERfo
RMER
S >
80%
NEg
ATIv
E112
s o u t h B a n k S t r u c t u r e P L A N
03u
rb
an
den
sit
y s
tud
y
D e s i g n a n D P l a n n i n g a t A e c om
Car ParkingThere was a wide range of car parking configurations across the case studies. Five of the six sites with the highest residential densities had a significant share of their car parking located either in the basement or on-street. These two parking arrangements provide the best public realm experience as they avoid locating the inactive use of car storage at the street interface or overlooking the street.
The parking arrangements of Southbank, long Beach and Hong Kong suggest that these cities provide the worst public realm outcome with a minimum of 80% of car parking located at ground level or in multi deck car parks. The effect may be mitigated to a degree however in Hong Kong where car ownership is significantly lower that in Southbank or long Beach.
This study identifies a direct relationship between car parking arrangements and building heights as these three city examples were also those that recorded buildings exceeding 30 storeys.

0M
95%0-5M5%
5+M0%
lonG bEaCh, CalIFoRnIa
southbank, MElbouRnE
bEddInGton ZERo, suRREy
MElbouRnE Cbd
battERy PaRk, nEW yoRk
0M
80%0-5M20%
5+M0%
0M
100%0-5M0%
5+M0%
0M
90%0-5M10%
5+M0%
0M0%
0-5M100%
5+M0%
24
41
50
100
66
MId lEVEls, honG konG
bERCy, PaRIs
EIxaMPlE, baRCElona
CoIn st, london
boRnEo sPoREnbuRG, aMstERdaM
0M
50%0-5M
50%5+M0%
0M
100%0-5M50%
5+M0%
0M
100%0-5M50%
5+M0%
0M
95%0-5M5%
5+M0%
0M
100%0-5M0%
5+M0%
100
100
100
118
23001
02
03
03
03
03
07
08
09
10bEST
PER
foRM
ERS
>80
% P
oSIT
IvE
woR
ST P
ERfo
RMER
S >
80%
NEg
ATIv
E
3.13.F STREET SETBACK BREAKDOWN
113
03
ur
ba
n d
ens
ity
stu
dy
s o u t h B a n k S t r u c t u r e P L A ND e s i g n a n D P l a n n i n g a t A e c om
Street SetbackZero setbacks were the most common followed by 0-5m. Setbacks greater than 5m were not recorded in any case study.
Southbank was comparable with the remaining study areas with 90% of the building footprint with no street setback and 10% setback 0-5m.
Beddington Zero recorded the highest extent of setbacks. Considering its suburban location comparative to the other case studies this is not unexpected.

Street InterfaceThe relationship of the street interface was predominantly a mix of 65-90% active/positive interface and 5-20% inactive interface – indicating a direct interface with the street of blank walls (typically service areas) or car parking.
Southbank was the clear exception to the majority example with only 20% of the building frontage to the street recorded as an active or positive edge. A large percentage – 45% - was recorded as an active ground interface with inactive uses above – typically car parking. Similarly, a significantly larger than average percentage was recorded as inactive. This will have a significantly detrimental effect on the experience of the public realm within the study area, decreasing the perceptions of safety and enjoyment for visitors and residents.
There was no discernible relationship between active
edges and densities.
There was a direct relationship between the building heights within the study areas and the degree of activity at the street interface as illustrated in Figure 3.13.G. Hong Kong, Southbank and long Beach all had a minimum of 30% inactive edges. These examples also recorded the highest buildings (with the exception of Battery Park).
3.13.G STREET INTERFACE BREAKDOWN
90% 5% 5%
10 l
onG
bEaC
h, C
alIF
oRnI
a
09 s
outh
bank
, MEl
bouR
nE
08 b
EddI
nGto
n ZE
Ro, s
uRRE
y
07 M
Elbo
uRnE
Cbd
02 M
Id l
EVEl
s, h
onG
konG
03 b
oRnE
o sP
oREn
buRG
, aM
stER
daM
03 b
ERCy
, PaR
Is
03 b
attE
Ry P
aRk,
nEW
yoR
k
01 E
IxaM
PlE,
baR
CElo
na
03 C
oIn
st, l
ondo
n
100 100 100 244166118 50230 100
80% 0% 20% 95% 0% 5% 80% 0% 20% 65% 15% 20%90% 5% 5% 20% 45% 35%70% 25% 5%95% 0% 5% 80% 0% 20%
01 02 03 03 03 03 07 08 09 10
2 922 123 9 3 8 7 9 7 307 30 3 38 453 8
bEST
PER
foRM
ERS
>80
% P
oSIT
IvE
woR
ST P
ERfo
RMER
S >
80%
NEg
ATIv
E114
s o u t h B a n k S t r u c t u r e P L A N
03u
rb
an
den
sit
y s
tud
y
D e s i g n a n D P l a n n i n g a t A e c om

Building Entrances
The distance between building entrances indicates the grain of urban development and provides a strong indication of the intensity of different premises within the site and the built form character. Entrances that are close together (less than 10m) indicate a fine grain of development that adds diversity and interest and vibrancy to an urban area. Entrances less than 10m apart were the most common (above 50% in most case studies).
Building entrances greater than 10m were recorded against all four of the lowest residential densities. There was no clear correlation between building entrance densities and employment densities.
There is an identified relationship between the distances between entrances and building typologies. The two examples with the greatest distances recorded between building entrances were Battery Park (85% of entrances greater than 10m apart) and Southbank (80% of entrances greater than 10m apart). This suggests that these two examples incorporate a coarser urban grain. Coin Street and Beddington Zero each had approximately 50% of dwellings 10-50m apart, with none greater than 50m. Battery Park and Southbank also recorded two of the three highest percentages of tower apartments and it is possible to associate this coarser urban grain with the tower apartment typology.
3.13.H BUILDING ENTRANCES BREAKDOWN
bEST
PER
foRM
ERS
>80
% P
oSIT
IvE
woR
ST P
ERfo
RMER
S >
80%
NEg
ATIv
E
02 MId lEVEls, honG konG
03 bERCy, PaRIs
01 EIxaMPlE, baRCElona
03 CoIn st, london
03 boRnEo sPoREnbuRG, aMstERdaM
100
100
100
118
230
>50M APART 5%
<10M APART
75%
10-50M APART
20%
10-50M APART <10M APART >50M APART
80% 20% 0%
<10M APART >50M APART 95% 0%
10-50M APART 5%
10-50M APART
<10M APART >50M APART 95% 5% 5%
10-50M APART
<10M APART >50M APART 95% 5% 5%
01
02
03
03
10-50M APART <10M APART >50M APART 50% 50% 0%
10 lonG bEaCh, CalIFoRnIa
09 southbank, MElbouRnE
08 bEddInGton ZERo, suRREy
07 MElbouRnE Cbd
03 battERy PaRk, nEW yoRk
24
41
50
100
66
10-50M APART <10M APART >50M APART 20% 50% 30%
10-50M APART
<10M APART >50M APART 15%
80% 5%
10-50M APART
<10M APART >50M APART 50%
20% 30%
10-50M APART
<10M APART >50M APART 85% 15% 0%
03
07
08
09
10
03
115
03
ur
ba
n d
ens
ity
stu
dy
s o u t h B a n k S t r u c t u r e P L A ND e s i g n a n D P l a n n i n g a t A e c om

50
58
308
100
351
10 lonG bEaCh, CalIFoRnIa
09 southbank, MElbouRnE
08 bEddInGton ZERo, suRREy
02 MId lEVEls, honG konG
01 EIxaMPlE, baRCElona
24
41
118
50
230
200
200
240
03 boRnEo sPoREnbuRG, aMstERdaM
03 bERCy, PaRIs
03 battERy PaRk, nEW yoRk
100
100
100
50
50
50
24
41
108
07 MElbouRnE Cbd 66 33
15
12
140
03 CoIn st, london100 20200
PoPu
latI
on
dWEl
lInG
CaRs
CaRs
/dW
EllI
nG
EMPl
oyM
Ent
hEIG
ht
CaR
PaRk
layo
ut
stRE
Et
IntE
RFaC
E bu
IldI
nG
EntR
anCE
s
0.6/
0.1/
0.2/
0.5/
0.5/
0.5/
0.5/
0.2/
1.0/
1.0/
8
45
9
8
9
30
12
3
92
30
kEy outCoMEs: buIlt FoRMThe following table illustrates the performance of each of the case study examples in the Built Form category. The key outcomes that can be discerned from the study area:
1 Higher building footprints do not deliver higher densities than mid-rise buildings.
2 Car parking requirements are critical in achieving a high quality urban realm within higher density `areas.
3 The quality of the street interface and distribution of building entrances has a direct relationship with building height and typology.
bEST
PER
foRM
ERS
>80
% P
oSIT
IvE
woR
ST P
ERfo
RMER
S >
80%
NEg
ATIv
E116
s o u t h B a n k S t r u c t u r e P L A N
03u
rb
an
den
sit
y s
tud
y
D e s i g n a n D P l a n n i n g a t A e c om

3.13.I NON RESIDENTIAL LAND USE BREAKDOWN
RE
TAIL
IND
US
TR
IAL
CO
MM
ER
CIA
L
10 lonG bEaCh, CalIFoRnIa
09 southbank, MElbouRnE
08 bEddInGton ZERo, suRREy
07 MElbouRnE Cbd 02 MId lEVEls, honG konG
03 bERCy, PaRIs
03 battERy PaRk, nEW yoRk01 EIxaMPlE, baRCElona
03 CoIn st, london
03 boRnEo sPoREnbuRG, aMstERdaM
100
100
100
118
230
24
41
50
100
66
RE
TAIL
IND
US
TR
IAL
CO
MM
ER
CIA
L
CO
MM
ER
CIA
L
RE
TAIL
IND
US
TR
IAL
CO
MM
ER
CIA
L
RE
TAIL
IND
US
TR
IAL
CO
MM
ER
CIA
L
RE
TAIL
IND
US
TR
IAL
CO
MM
ER
CIA
L
RE
TAIL
IND
US
TR
IAL
CO
MM
ER
CIA
L
RE
TAIL
IND
US
TR
IAL
CO
MM
ER
CIA
L
RE
TAIL
IND
US
TR
IAL
CO
MM
ER
CIA
L
RE
TAIL
IND
US
TR
IAL
CO
MM
ER
CIA
L
RE
TAIL
IND
US
TR
IAL
01
02
03
03
03
03
07
08
09
10
117
03
ur
ba
n d
ens
ity
stu
dy
s o u t h B a n k S t r u c t u r e P L A ND e s i g n a n D P l a n n i n g a t A e c om
3.13.03 ContextThe context analysis provides a useful tool to assess the livability of each case study. Access to open space, employment, social and community facilities and public transport all directly contribute to the quality of life offered to residents and visitors within urban environments.
Non-Residential UsesMost of the case studies incorporated non residential uses with the exception of Borneo Sporenburg. Beddington Zero only incorporated commercial uses in addition to residential uses. These two case studies also recorded the lowest densities in employment. Only Coin Street and Southbank incorporated industrial uses within the study areas.
Southbank, along with Coin Street, recorded the greatest mix of uses within the site.

2
2
1 1 13
12
11
232
2 0
6 2 121
0
lonG
bEa
Ch, C
alIF
oRnI
a
sout
hban
k, M
Elbo
uRnE
bEdd
InGt
on Z
ERo,
suR
REy
MEl
bouR
nE C
bd
MId
lEV
Els,
hon
G ko
nG
boRn
Eo s
PoRE
nbuR
G, a
Mst
ERda
M
bERC
y, P
aRIs
batt
ERy
PaRk
, nEW
yoR
k
EIxa
MPl
E, b
aRCE
lona
CoIn
st,
lon
don
100 100 2441118 50230 66100 100
01 02 03 03 03 03 07 08 09 10 3.13.J ACCESS TO OPEN SPACE BREAKDOWN
bEST
PER
foRM
ERS
>80
% P
oSIT
IvE
woR
ST P
ERfo
RMER
S >
80%
NEg
ATIv
E118
s o u t h B a n k S t r u c t u r e P L A N
03u
rb
an
den
sit
y s
tud
y
D e s i g n a n D P l a n n i n g a t A e c om
Access to Public Open SpaceAccess to public open space was provided in all case studies however the provision of this access differed greatly. Eixample and Borneo-Sporenburg were the two examples that did not have access to a large park and provided limited access to a smaller open space area. The provision of open space in Barcelona has been compromised by the build-out of many of the internal courtyard spaces that historically provide a semi-private green space to residents.
As dwelling densities increased there was not a proportional change (negative or positive) that could be discerned. It is therefore possible to suggest that the level of amenity provided to these residents is lower than those living in lower density areas that have an equal number of open spaces.
Considering its low residential density, Southbank provided a higher than average ratio of small parks/squares per dwelling/hectare. The ratio of large parks per dwelling/hectare was on average with the other case studies. The large park Kings Domain (inc. Alexandra, Queen Victoria and Botanical Gardens) is at one end of the Southbank study area and does therefore not provide equitable access to all residents.

lonG
bEa
Ch, C
alIF
oRnI
a
sout
hban
k, M
Elbo
uRnE
bEdd
InGt
on Z
ERo,
suR
REy
MEl
bouR
nE C
bd
MId
lEV
Els,
hon
G ko
nG
boRn
Eo s
PoRE
nbuR
G, a
Mst
ERda
M
bERC
y, P
aRIs
batt
ERy
PaRk
, nEW
yoR
k
EIxa
MPl
E, b
aRCE
lona
CoIn
st,
lon
don
100 100 2441118 50230
s
sMedical Services
Childcare
66
s30
3
s12
1
2
4
s
s1
1
4
100
s
s4
1
12
s
s
9
5
5
100
s
s0
6
42
s
s0
0
4
s
s
1
1
3
32
3
10
s
s
4
2
41
Library
Sports Centre
Cultural Centre / Institutions
Cafes / Restaurants
C C2
1
20
100
0
1
6
20
C0
0
0
11
C0
1
1
9
C4
9
3
30
C0
1
4
39
C0
0
10
40
C0
1
2
5
1
1
4
27
C1
2
16
61
C
s
s
E E0
0
4
Primary School
Secondary School
University
1
1
2
E1
1
0
E1
1
0
E5
3
3
E1
2
0
E0
1
1
E1
0
0
15
8
1
E17
17
1
E
Convenience Shopping
01 02 03 03 03 03 07 08 09 10
EduCatIon
CoMMunIty
sERVICEs
shoPPInG
119
03
ur
ba
n d
ens
ity
stu
dy
s o u t h B a n k S t r u c t u r e P L A ND e s i g n a n D P l a n n i n g a t A e c om
Access to Social /Community Infrastructure: EducationThe provision of educational institutions varied across the sites and cannot be directly related to densities. A significant gap in provision is evident – particularly in primary/secondary schools where proximity to schools from residences is of greater importance than the distance between universities and residences (it can be assumed that an adult can travel more independently and therefore further than young children). In this case Melbourne CBD and Southbank recorded a distinct gap in the provision of childhood education, both not providing either a primary or secondary school. Beddington Zero was the only other example that failed to provide both levels of schooling within no secondary school within 500m of the development.
The provision of universities in the area can have a significant impact on the vibrancy of the neighbourhoods with a prevalence of affordable eateries and social venues typically collocated with university student populations. The Mid levels and Eixample both delivered a high number of schools to service the high density populations.
Access to Social /Community Infrastructure: Community FacilitiesThe provision of community facilities within each study area was mixed. The provision of public libraries was generally low as only Mid levels, Eixample, Melbourne CBD and long Beach provided this public service. The highest provision of cultural centres/institutions were found in the Eixample, Melbourne CBD and Southbank.
Southbank incorporated many large cultural venues: institutional galleries, performance spaces and an arts centre. The provision of these facilities in Eixample and Melbourne CBD are predominantly attributed to smaller scale premises, particularly small art/design galleries. Cafes/Restaurants were prevalent in all case studies, with the highest provisions associated with higher densities in employment – this was the case for Coin Street, Battery Park, Melbourne CBD, Southbank and long Beach.
Significant gaps in the provision of community infrastructure were evident in Bercy, Borneo-Sporenburg and Beddington Zero. These are predominantly residential developments that do not exhibit a high level of social infrastructure amenity.
Southbank does not provide either a public library or sports facility. In relation to its residential density it offers a high degree of access to participation in cultural events.
Access to Social /Community Infrastructure: Social ServicesAccess to social services is low in most examples considering the residential densities recorded, with the exception of Mid levels, with the same reason as discussed above. Further investigative research would be useful to break down the provision of medical services – Melbourne CBD records a high provision of medical facilities, however as the CBD of a state capital this is to be expected as it will provide a range of specialist services only found here within Victoria.
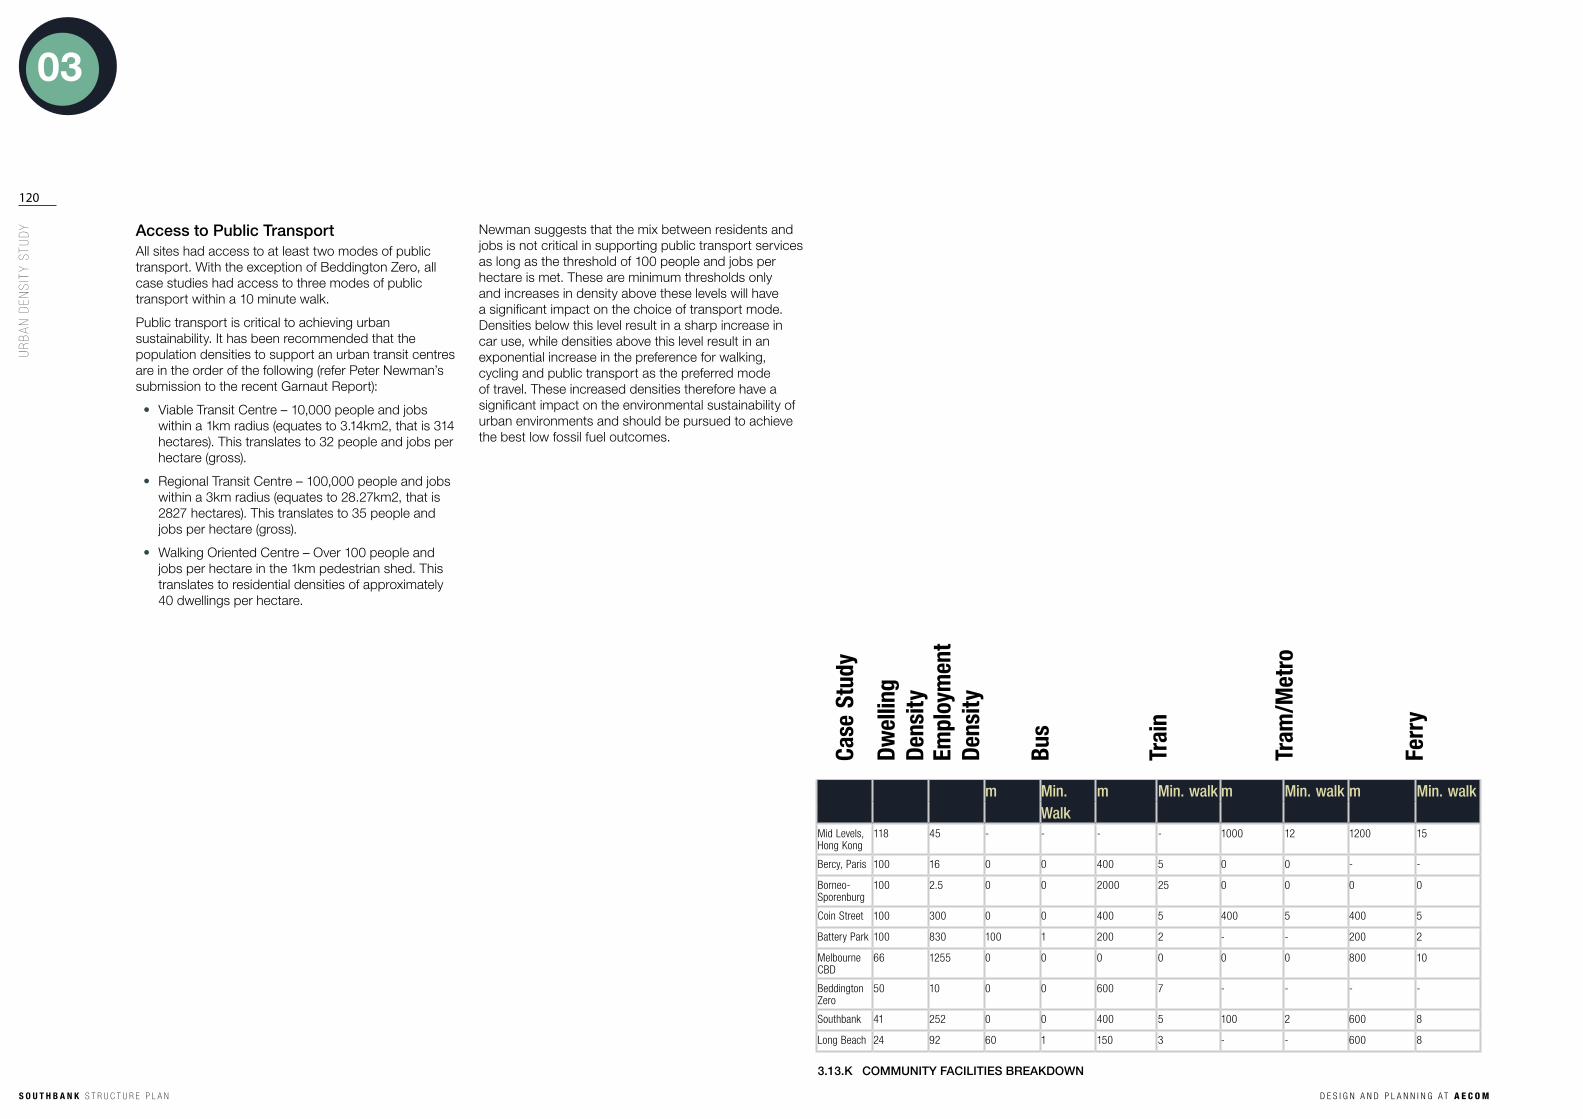
Case
stu
dy
Dwel
ling
Dens
ityEm
ploy
men
t De
nsity
Bus
trai
n
tram
/Met
ro
Ferr
y
m Min. m Min. walk m Min. walk m Min. walkWalk
mid levels, Hong Kong
118 45 - - - - 1000 12 1200 15
Bercy, Paris 100 16 0 0 400 5 0 0 - -
Borneo-sporenburg
100 2.5 0 0 2000 25 0 0 0 0
Coin street 100 300 0 0 400 5 400 5 400 5
Battery Park 100 830 100 1 200 2 - - 200 2
melbourne CBD
66 1255 0 0 0 0 0 0 800 10
Beddington Zero
50 10 0 0 600 7 - - - -
southbank 41 252 0 0 400 5 100 2 600 8
long Beach 24 92 60 1 150 3 - - 600 8
3.13.K COMMUNITY FACILITIES BREAKDOWN
120
s o u t h B a n k S t r u c t u r e P L A N
03u
rb
an
den
sit
y s
tud
y
D e s i g n a n D P l a n n i n g a t A e c om
Access to Public TransportAll sites had access to at least two modes of public transport. With the exception of Beddington Zero, all case studies had access to three modes of public transport within a 10 minute walk.
Public transport is critical to achieving urban sustainability. It has been recommended that the population densities to support an urban transit centres are in the order of the following (refer Peter Newman’s submission to the recent Garnaut Report):
Viable Transit Centre – 10,000 people and jobs •within a 1km radius (equates to 3.14km2, that is 314 hectares). This translates to 32 people and jobs per hectare (gross).
Regional Transit Centre – 100,000 people and jobs •within a 3km radius (equates to 28.27km2, that is 2827 hectares). This translates to 35 people and jobs per hectare (gross).
Walking Oriented Centre – Over 100 people and •jobs per hectare in the 1km pedestrian shed. This translates to residential densities of approximately 40 dwellings per hectare.
Newman suggests that the mix between residents and jobs is not critical in supporting public transport services as long as the threshold of 100 people and jobs per hectare is met. These are minimum thresholds only and increases in density above these levels will have a significant impact on the choice of transport mode. Densities below this level result in a sharp increase in car use, while densities above this level result in an exponential increase in the preference for walking, cycling and public transport as the preferred mode of travel. These increased densities therefore have a significant impact on the environmental sustainability of urban environments and should be pursued to achieve the best low fossil fuel outcomes.

50
58
308
100
351
10 lonG bEaCh, CalIFoRnIa
09 southbank, MElbouRnE
08 bEddInGton ZERo, suRREy
02 MId lEVEls, honG konG
01 EIxaMPlE, baRCElona
24
41
118
50
230
200
200
240
03 boRnEo sPoREnbuRG, aMstERdaM
03 bERCy, PaRIs
03 battERy PaRk, nEW yoRk
100
100
100
50
50
50
24
41
108
07 MElbouRnE Cbd 66 33
15
12
140
03 CoIn st, london100 20200
PoPu
latI
on
dWEl
lInG
CaRs
CaRs
/dW
EllI
nG
EMPl
oyM
Ent
oPEn
sPa
CE
CoM
Mun
Ity/
soCI
al
Publ
IC
tRan
sPoR
t
0.6/
0.1/
0.2/
0.5/
0.5/
0.5/
0.5/
0.2/
1.0/
1.0/
kEy outCoMEs: ContExtThe following table illustrates the performance of each of the case study examples in the Context category. The key outcomes that can be discerned from the study area:
The provision of good amenity through •the delivery of open space, community infrastructure and public transport was not directly related to density, however it was possible to discern the highest performing examples with Coin Street representing the best recorded outcome.
Southbank was one of the two •worst performers along with Borneo Sporenburg.
121
03
ur
ba
n d
ens
ity
stu
dy
s o u t h B a n k S t r u c t u r e P L A ND e s i g n a n D P l a n n i n g a t A e c om

3.13.L PUBLIC TRANSPORT BREAKDOWN
lonG
bEa
Ch, C
alIF
oRnI
a
sout
hban
k, M
Elbo
uRnE
bEdd
InGt
on Z
ERo,
suR
REy
MEl
bouR
nE C
bd
MId
lEV
Els,
hon
G ko
nG
boRn
Eo s
PoRE
nbuR
G, a
Mst
ERda
M
bERC
y, P
aRIs
batt
ERy
PaRk
, nEW
yoR
k
EIxa
MPl
E, b
aRCE
lona
CoIn
st,
lon
don
100 100 2441118 50230 66100 100
01 02 03 03 03 03 07 08 09 10
Potable Town supply
Stormwater Reuse
Greywater Reuse
Blackwater Reuse
Grid
Self Generated
District Distributed Network
99%
0.5%
0.5%
0.1%
100%
0%
0%
70%
15%
15%
0%
50%
50%
0%
99%
0.5%
0.5%
0.1%
100%
0%
0%
100%
0%
0%
0%
100%
0%
0%
99%
1%
0%
0%
100%
0%
0%
90%
10%
0%
0%
100%
0%
0%
60%
20%
20%
0%
100%
0%
0%
100%
0%
0%
0%
80%
20%
0%
100%
0%
0%
0%
100%
0%
0%
100%
0%
0%
0%
100%
0%
0%
0 - 50%
51 - 75%
76 - 100%
76 - 100%
51 - 75%
0 - 50%
122
s o u t h B a n k S t r u c t u r e P L A N
03u
rb
an
den
sit
y s
tud
y
D e s i g n a n D P l a n n i n g a t A e c om
3.13.04 ESD
Water SourceThe majority of case studies relied on the potable water supply to service the development. The exceptions were Borneo-Sporenburg and Beddington Zero which only partly used other water sources. These figures reflect the fact that although there might be the odd development undertaking water capture and reuse, the majority do not.
The residents of Beddington Zero use 50% less •water than the local average.
Energy SourceThe majority of the case studies relied on the energy grid to provide power requirements. The exceptions were Coin Street and Beddington Zero. Beddington Zero relied on a combination of solar and wind technology to generate energy demands.
The residents of Beddington Zero use 45% less •energy than the local average. A biomass treatment plant is designed to service the development. This is yet to come online but is intended to replace all energy currently sourced from the grid.

50
58
308
100
351
10 lonG bEaCh, CalIFoRnIa
09 southbank, MElbouRnE
08 bEddInGton ZERo, suRREy
02 MId lEVEls, honG konG
01 EIxaMPlE, baRCElona
24
41
118
50
230
200
200
240
03 boRnEo sPoREnbuRG, aMstERdaM
03 bERCy, PaRIs
03 battERy PaRk, nEW yoRk
100
100
100
50
50
50
24
41
108
07 MElbouRnE Cbd 66 33
15
12
140
03 CoIn st, london100 20200
PoPu
latI
on
dWEl
lInG
CaRs
CaRs
/dW
EllI
nG
EMPl
oyM
Ent
Esd
0.6/
0.1/
0.2/
0.5/
0.5/
0.5/
0.5/
0.2/
1.0/
1.0/
kEy outCoMEs: EsdThe following table illustrates the performance of each of the case study examples in the ESD category. With the exception of Beddington Zero no case studies recorded outstanding ESD results.
It is important to note that the ESD study was focused on the method of provision of water and energy supply and did not delve into the ecological performance of each city zone - for example water quality, air quality, microclimate or residential comfort.
123
03
ur
ba
n d
ens
ity
stu
dy
s o u t h B a n k S t r u c t u r e P L A ND e s i g n a n D P l a n n i n g a t A e c om
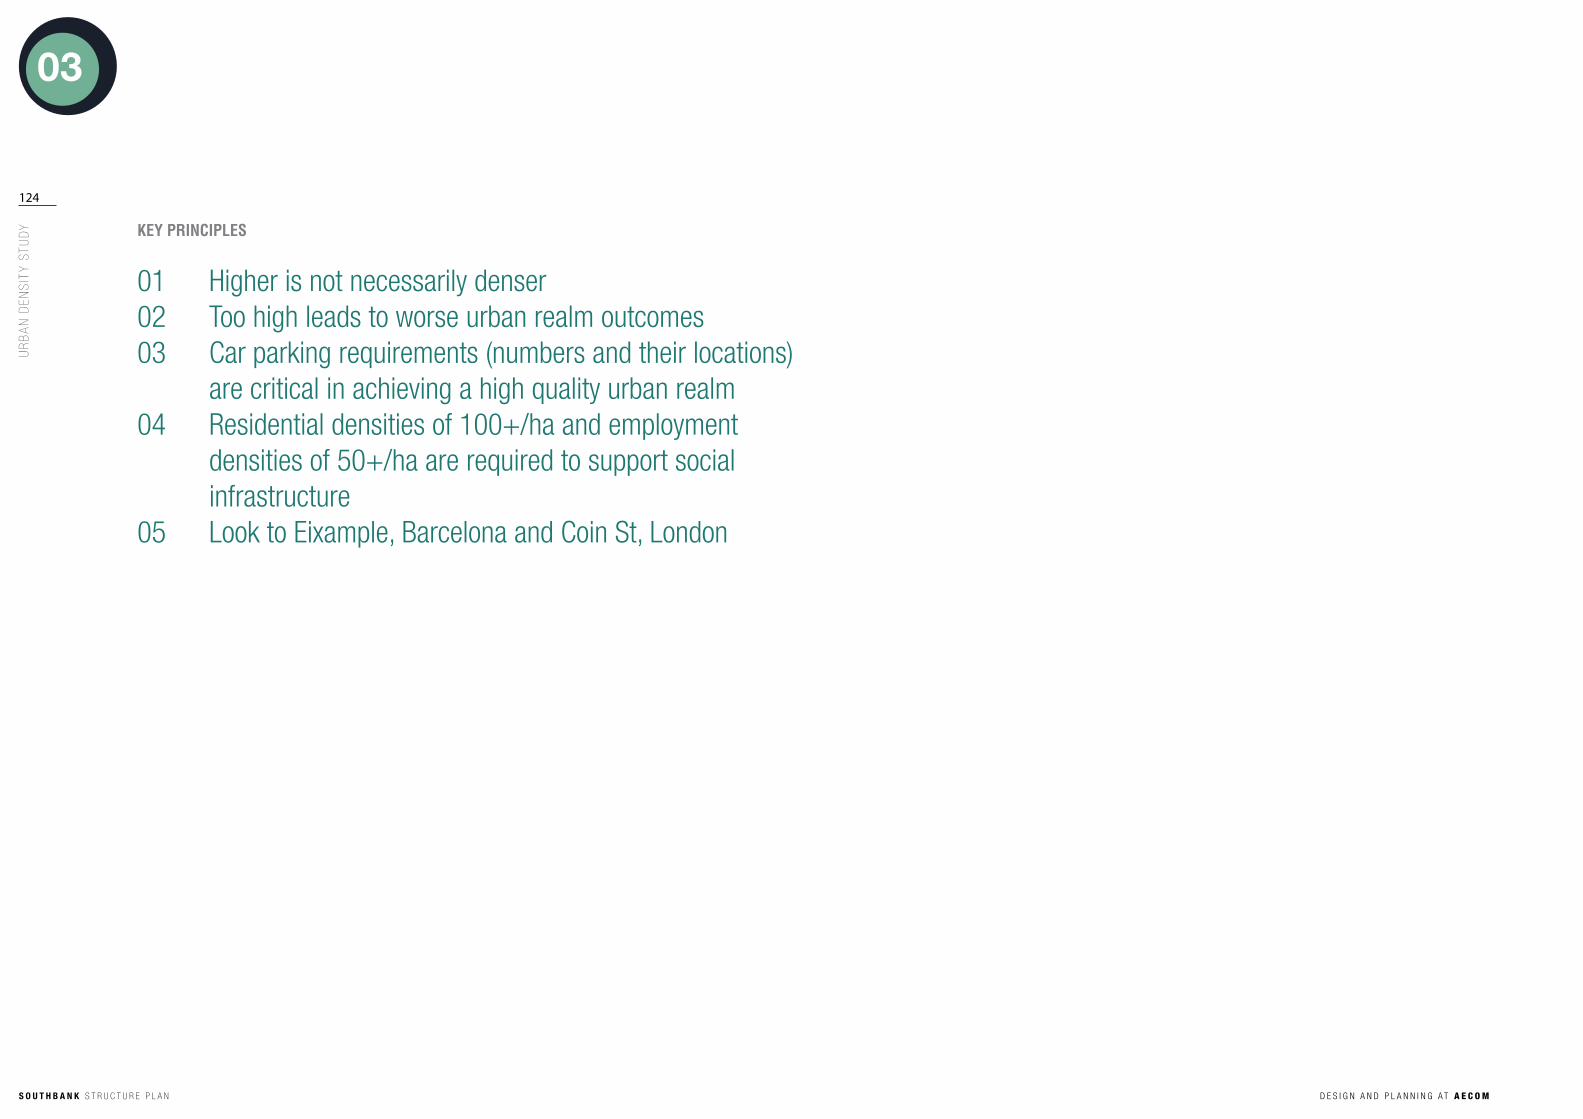
kEy PRInCIPlEs
01 Higher is not necessarily denser02 too high leads to worse urban realm outcomes03 Car parking requirements (numbers and their locations) are critical in achieving a high quality urban realm04 residential densities of 100+/ha and employment densities of 50+/ha are required to support social infrastructure05 look to eixample, Barcelona and Coin st, london
124
s o u t h B a n k S t r u c t u r e P L A N
03u
rb
an
den
sit
y s
tud
y
D e s i g n a n D P l a n n i n g a t A e c om
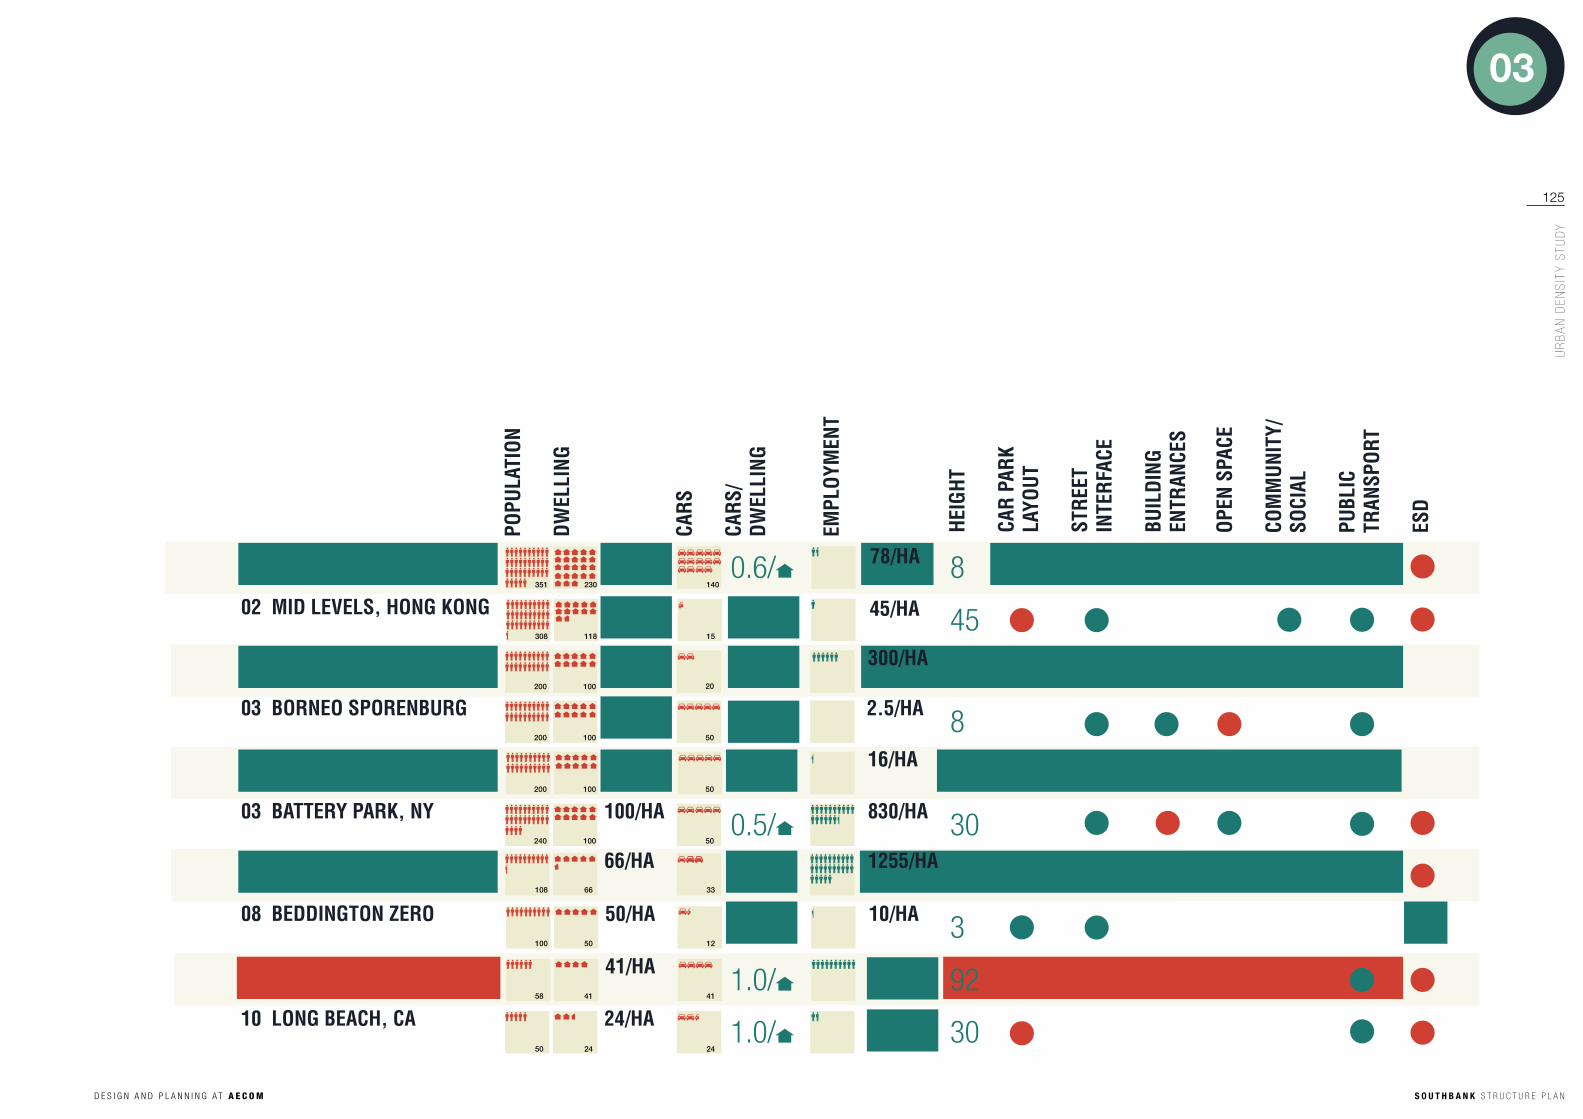
oPEn
sPa
CE
CoM
Mun
Ity/
soCI
al
Publ
IC
tRan
sPoR
t
Esd
50
58
308
100
351
24
41
118
50
230
200
200
240
100
100
100
108 66
100200
PoPu
latI
on
dWEl
lInG
CaRs
CaRs
/dW
EllI
nG
EMPl
oyM
Ent
50
50
50
24
41
33
15
12
140
20
0.6/
0.1/
0.2/
0.5/
0.5/
0.5/
0.5/
0.2/
1.0/
1.0/10 lonG bEaCh, Ca
09 southbank, MElb
08 bEddInGton ZERo
02 MId lEVEls, honG konG
01 EIxaMPlE, baRCElona
03 boRnEo sPoREnbuRG
03 bERCy, PaRIs
03 battERy PaRk, ny
07 MElbouRnE Cbd
03 CoIn st, london
24/ha
41/ha
50/ha
118/ha
230/ha
100/ha
100/ha
100/ha
66/ha
92/ha
252/ha
10/ha
45/ha
78/ha
2.5/ha
16/ha
830/ha
1255/ha
300/ha100/ha
hEIG
ht
CaR
PaRk
layo
ut
stRE
Et
IntE
RFaC
E bu
IldI
nG
EntR
anCE
s
8
45
9
8
9
30
12
3
92
30
125
03
ur
ba
n d
ens
ity
stu
dy
s o u t h B a n k S t r u c t u r e P L A ND e s i g n a n D P l a n n i n g a t A e c om

126
s o u t h B a n k S t r u c t u r e P L A N
03u
rb
an
den
sit
y s
tud
y
D e s i g n a n D P l a n n i n g a t A e c om
3.14 Recommendations for the Southbank Structure PlanThere are some clear distinctions between the global precedent examples and the present Southbank urban conditions. For an urban suburb located within 400m of the Melbourne CBD, Southbank residential densities are considerably low. The site layout, built form and urban context that generates these densities is categorised by particular characteristics that compromise the densities and livability of Southbank. These were most marked in the following criteria and recommendations to address each of these shortfalls are provided below.
Open SpaceWhile Southbank incorporated the equal highest area of open space (50%) and the highest area of public open space (45%) the greatest portion of this area is dedicated to road infrastructure and not available as community active or passive recreation areas. The Southbank study area incorporates only 5% of community open space. This is associated with one development and does not therefore contribute significantly to informal or spontaneous interactions between the residents across the site. Spaces for shared residential uses are typically provided within upper floors of residential towers – for example communal gym facilities/lap pool. There is a distinct lack of green open space.Recommendation:
Increase the extent of public open space •dedicated to active and passive recreational community uses; and Encourage developments that incorporate •shared communal open spaces to more effectively encourage interaction between residents in new developments.
Car Parking and Street InterfaceSouthbank recorded one of the worst public realm outcomes with a minimum of 80% of car parking located at ground level or in upper level car parks (incorporated into high-rise podiums). This results in a significant reduction in casual visual surveillance of the street both at street level and from the overlooking vantage points provided from upper floors. It also decreases the visual interest for pedestrians through the provision of largely inactive edges to the building frontages.Recommendation:
Reduce car parking requirements for all new •developments in Southbank; andDevelop residential edges to multi deck car •parking or encourage basement provision.
Building Typologies and HeightsSouthbank represented the greatest divergence in building typologies from the other 9 case study sites. In Southbank, 90% of the residential buildings were tower apartments with only 10% provided as Mid-rise apartments. A relationship between densities and heights was not evident as Southbank recorded a low average residential density. Southbank had the tallest building by 62 storeys. The footprint of this building is significant and the impact that it has on the surrounding urban environment is detrimentally affecting the quality of the urban realm. Recommendation:
Tower apartments are effective at achieving •high densities. They have however, a significant impact on the public realm and the livability of urban environments. To achieve higher levels of density it is recommended that the Southbank Structure Plan Stage 2 consider the efficiencies of density that can be achieved with lower building typologies – in particular mid-rise apartments which can achieve densities in the order of 100-235 dwellings per hectare.

127
03
ur
ba
n d
ens
ity
stu
dy
s o u t h B a n k S t r u c t u r e P L A ND e s i g n a n D P l a n n i n g a t A e c om
Building Entrances and Street interfaceSouthbank recorded a much coarser grain of development than Melbourne CBD and the European case studies. Southbank, long Beach and Battery Park (uSA examples) all had the majority of building entrances greater than 10 metres apart. This provides less opportunity for more complex and interesting experiences within the urban realm and inhabitants and visitors have to travel much further to access the same number of premises. The relationship between the tower apartment typologies and the coarser grain suggests that alternative built form scenarios would deliver a much richer, more interesting urban experience to Southbank.Southbank also provided a generally poor and inconsistent interface to the street with only 20% of the building frontage to the street recorded as an active or positive edge. A large percentage – 45% - was recorded as an active ground interface with inactive uses above – typically car parking as discussed above. Similarly, a significantly larger than average percentage was recorded as inactive. This has a significantly detrimental effect on the experience of the public realm. It establishes Southbank as a less stimulating place with less visible human activity which reduces the attractiveness of the area to further public life.Recommendations:
Encourage building typologies with smaller •footprints to provide a greater density of entrance points to different premises and a finer grain of urban development; andDiscourage blank and inactive interfaces to •the street scape. The City of Melbourne’s planning controls for the CBD recommend a minimum 85% active interface to the street but with an additional requirement for entrances at finer grain than 10m.
Access to Social /Community Infrastructure: EducationSouthbank recorded a distinct gap in the provision of childhood education with no primary or secondary school in the area. Recommendation:
Establish local schools which can support the •residential population.
Access to Social /Community Infrastructure: Community FacilitiesSouthbank lacks community public facilities such as a sports centre or public library. An increase in the provision of these facilities would significantly increase the livability of the area. A range of community services should be assessed.Recommendation:
Establish new public community facilities •to service the existing and future residential populations.
Access to Social /Community Infrastructure: Social ServicesSouthbank had the lowest provision of social services within the case studies with no medical or child care services provided.Recommendation:
Establish new social service facilities to service •the existing and future residential populations.
Access to Public TransportWhile Southbank exceeds the minimum density thresholds to services a transit centre, with only 58 residents people per hectare, it is reliant on its employment population to support any transport service. This will affect the capacity of the residential population to support transport services in non-peak times.Recommendation:
Increase residential densities to better •support existing and future public transport infrastructure requirements.
ESDWith the exception of Beddington Zero, most case studies performed poorly in the environmental categories that tested water and energy source supply. From the information provided in the case study it is not possible to draw any conclusions about the densities required to achieve environmentally sustainable developments. Beddington Zero achieves 62 dwellings per hectare, however the proposed plans for the carbon neutral MASDAR initiative currently in development in Abu Dhabi is aiming to deliver 140 dwellings/hectare. The greater the density the more economical it is to deliver the assets required to achieve carbon and water neutrality such as solar parks, biomass plants of wastewater treatment plants.Recommendation:
Southbank could significantly change its •carbon footprint and water requirements by putting into place initiatives to draw energy from sustainable resources or to capture or reuse and stormwater, grey water and waste water that exits the site.
