04-david zambrano - jdsu - ensuring fiber optic system performance
DESCRIPTION
testing fiberTRANSCRIPT

David Zambrano
Best Practices for Ensuring Fiber
Optic System Performance

Inspect Before You Connect
• Optical Connectors in our
Networks
• Contamination and Signal
Performance
• Sources of Contamination
• Process for Cleaning and
Inspection
• Standards update
• Summary & Backup slides

Fibre Optic Connectors
Understanding Fibre Optic Connectors

Optical Fiber Types
Multimode Single-mode
2 Types

Connectors Enable Network Adaptability
Connectors play an important role in Enterprise network architecture.
They give you the power to add, drop, move, and change the network.
Main Cross Connect
Backbone Cables
Cross Connect Patch Cords
Interconnect Patch Cords
SAN
Servers
Image property of CommScope

If a critical connection is affected, the impact can be
exponential.
Exponential Impact
Image property of CommScope

Storage
Servers
RS
-23
2
Link
10/1 00 Mb/s
Active C
P
RS
-23
2
Link
10/100 Mb/s
Active C
P
RS
-232
Link
10/100 Mb/s
Active CP
RS
-23
2
Link
10/1 00 Mb/s
A ctive C
P
Cross Connect Director Rack
Trunk Cables
Exponential Impact

Fiber Optic Connector
� The BODY houses the ferrule to secure the fiber in place.
� The FERRULE is a small cylinder used to mount the fiber and acts as the alignment
mechanism. The end of the fiber is located at the end of the ferrule.
� The FIBER comprises 2 layers: the CLADDING and the CORE.
– The CLADDING is a glass layer surrounding the core, which prevents the signal in
the core from escaping.
– The CORE is the critical center layer of the fiber and the conduit that light passes
through.
� Fiber connectors have extremely tight tolerances with the potential to make a low-loss
connection. To achieve this potential, they must be handled and mated properly.
SC Connector
BODYBODY
FERRULEFERRULE
FIBERFIBER
CLADDINGCLADDING
CORECORE
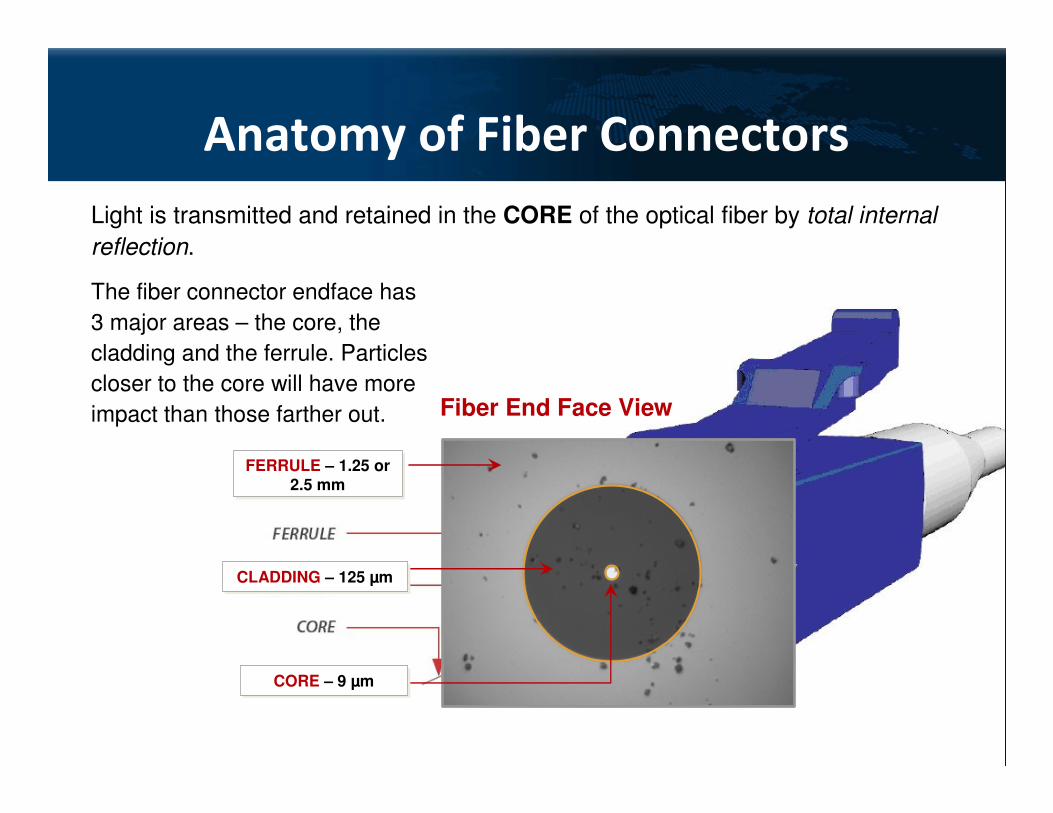
Anatomy of Fiber Connectors
Light is transmitted and retained in the CORE of the optical fiber by total internal
reflection.
The fiber connector endface has
3 major areas – the core, the
cladding and the ferrule. Particles
closer to the core will have more
impact than those farther out.
CORE – 9 µmCORE – 9 µm
CLADDING – 125 µmCLADDING – 125 µm
FERRULE – 1.25 or 2.5 mm
FERRULE – 1.25 or 2.5 mm
Fiber End Face View

Single Fiber vs. Multi-Fiber Connectors
SINGLE FIBER CONNECTOR MULTI-FIBER CONNECTOR
� White ceramic ferrule
� One fiber per connector
� Common types include SC, LC, FC, and ST
� Polymer ferrule
� Multiple fibers in linear array (12, 24, more)
in single, high-density connector
� Common type is MPO or MTP®

Types of End Faces
• PC – Physical Contact • APC – Angled Physical
Contact
� The angle reduces the back-reflection of the connection.
SC - PC SC - APC

Focus on the Connection
Bulkhead Adapter
Fiber Connector
Alignment Sleeve
Alignment Sleeve
Physical Contact
Fiber
Ferrule

What Makes a GOOD Fiber Connection?
� Perfect Core Alignment
� Physical Contact
� Pristine Connector
Interface
The 3 basic principles that are critical to achieving an efficient fiber
optic connection are “The 3 Ps”:
Core
Cladding
CLEAN
Light Transmitted
Today’s connector design and production techniques have eliminated
most of the challenges to achieving core alignment and physical contact.

What Makes a BAD Fiber Connection?
• A single particle mated
into the core of a fiber
can cause significant
back reflection,
insertion loss and even
equipment damage.
Today’s connector design and production techniques have eliminated
most of the challenges to achieving Core Alignment and Physical Contact.
What remains challenging is maintaining a Pristine End-face. As a result,
CONTAMINATION is the #1 source of troubleshooting in optical networks.
DIRT
Core
Cladding
Back Reflection Insertion LossLight

Impact on Network Performance

Measurement Units
• dBm unit is decibels relative to 1 mW of power
• dBm is an ABSOLUTE measurement
• dB is a RELATIVE measurement
0 dBm -3 dBm -10dBm -20 dBm -40 dBm
1 mW 0.5 mW 0.1 mW 0.01 mW 0.0001 mW
Relative Power (dB) =10*Log)(
)(
mWPt
mWPi
Tx
Rx
2 dB
5 dB
1 mW = 0 dBm
1 dBLoss = 8 dB
-8 dBm
Absolute Power (dBm) =10*LogmW
mWPi
1
)(

Contamination and Signal Performance
Fiber Contamination and Its Effect on Signal PerformanceCLEAN CONNECTION
Back Reflection = -67.5 dB
Total Loss = 0.250 dB
11
DIRTY CONNECTION
Back Reflection = -32.5 dB
Total Loss = 4.87 dB
33
Clean Connection vs. Dirty Connection
OTDR trace illustration of the significant decrease in signal
performance after mating dirty connectors

Illustration of Particle Migration
� Each time the connectors are mated, particles around the core are displaced, causing
them to migrate and spread across the fiber surface.
� Particles larger than 5µm usually explode and multiply upon mating.
� Large particles can create barriers (“air gaps”) that prevent physical contact.
� Particles less than 5µm tend to embed into the fiber surface, creating pits and chips.
11.8µ
15.1µ
10.3µ
Actual fiber end face images of particle migration
Core
Cladding

Dirt Damages Fibre!
� Once embedded debris is removed, pits and chips remain in the fibre.
� These pits can also prevent transmission of light, causing back reflection,
insertion loss and damage to other network components.
Most connectors are not inspected until the problem is detected… AFTER
permanent damage has already occurred.
Mating dirty connectors
embeds the debris into
the fiber.Core
Cladding
Back Reflection Insertion LossLight
DIRTPITS(permanent damage)
Mating force of 1kg
(2.2lb) over 200µm
diameter gives 45,000 psi.

Contamination

Types of Contamination
Fiber end faces should be free of any contamination or defects, as shown below:
Common types of contamination and defects include the following:
Dirt Oil Pits & Chips Scratches
Single Mode Fiber

Where Is It? – Everywhere!
• Airborne, hands, clothing, bulkhead adapter,
dust caps, test equipment, etc.
• The average dust particle is 2–5µ, which is not
visible to the human eye.
• A single spec of dust can be a major problem
when embedded on or near the fiber core.
• Even a brand new connector can be dirty. Dust
caps protect the fiber end-face, but can also be
a source of contamination.
• Fiber inspection microscopes give you a clear
picture of the problems you are facing.
Your biggest problem is right in front of you… you just can’t see it!
DIRT IS EVERYWHERE!

How is it getting on the fiber?
• Test Equipment
• Dust Caps
• Bulkheads
• People
• Environment
There are a number of different sources where dirt and other particles
can contaminate the fiber.
Connectors and ports on test equipment are mated frequently and are highly
likely to become contaminated. Once contaminated, this equipment will often
cross-contaminate the network connectors and ports being tested.
Inspecting and cleaning test ports and leads before testing network
connectors prevents cross-contamination.

Inspection and Cleaning

Inspect Before You Connectsm
Follow the simple “INSPECT BEFORE YOU CONNECT” process to ensure
fiber end faces are clean prior to mating connectors.

Inspect and Clean Both Connectors in Pairs!
Inspecting BOTH sides of the connection is the ONLY WAY to ensure
the connector will be free of contamination and defects.
Patch cords are easy to access and view compared to the fiber inside the bulkhead
(or test equipment or network equipment) which are frequently overlooked. The
bulkhead side may only be half of the connection, but it is far more likely to be dirty
and problematic.
Bulkhead (Female) InspectionPatch Cord (Male) Inspection

Inspect, Clean, Inspect, and Go!
Fiber inspection and cleaning are SIMPLE steps with immense benefits.
44 Connect
■ If the fiber is clean, CONNECT the connector.
NOTE: Be sure to
inspect both sides
(patch cord “male” and
bulkhead “female”) of
the fiber interconnect.
22 Clean
■ If the fiber is dirty, use a simple
cleaning tool to CLEAN the fiber surface.
11 Inspect
■ Use a probe microscope to INSPECT the fiber.
– If the fiber is dirty, go to Step 2, Clean.
– If the fiber is clean,
go to Step 4,
Connect.
33 Re-inspect
■ Use a probe microscope to
RE-INSPECT (confirm fiber is
clean).
– If the fiber is still
dirty, repeat Step 2,
Clean.
– If the fiber is clean,
go to Step 4,
Connect.

Proactive vs. Reactive Inspection
PROACTIVE INSPECTION:
Visually inspecting fiber connectors
at every stage of handling BEFORE
mating them.
Connectors are much easier to clean
prior to mating, before embedding
debris into the fiber.
REACTIVE INSPECTION:
Visually inspecting fiber connectors
AFTER a problem is discovered,
typically during troubleshooting.
By this time, connectors and other
equipment may have suffered
permanent damage.
Dirty Fiber PRIOR to MatingFiber AFTER Mating and
Numerous Cleanings
Fiber AFTER CleaningDirty Fiber PRIOR to Mating

Benefits of Proactive Inspection
• Reduce Network Downtime
Active network = satisfied customers
• Reduce Troubleshooting
Prevent costly truck rolls and service calls
• Optimize Signal Performance
Network components operate at highest level of
performance
• Prevent Network Damage
Ensure longevity of costly network equipment
PROACTIVE INSPECTION is quick and
easy, with indisputable benefits

Cleaning Best Practices
• Many tools exist to clean fiber
• Many companies have their own “best practices”
• Dry clean first, then try wet cleaning.
• Always finish with a dry cleaning process.

Standards Update

Standards and Zones
� ZONES are used to prioritize evaluation
criteria.
Zone A: Core Zone
Zone B: Cladding Zone
Zone C: Adhesive Zone
Zone D: Contact Zone
� Different failure criteria for defects and
scratches are specified for each zone:
• Quantity and Size
• Location relative to core
Zone A
Zone D
Zone B
IEC 61300-3-35 – “Fibre Optic Connector Endface Visual and Automated
Inspection” has recently been published as an interoperability standard for
connector manufacturers and users.

Recommended Acceptance Criteria for SM-UPC
Connectors (IEC 61300-3-35)
Zone Name(diameter) Scratches Defects
A, Core Zone(0-25µm)
none none
B, Cladding Zone(25-120µm)
none > 3µm width
no limit < 2µm
5 from 2 - 5µmnone > 5µm
C, Adhesive Zone
(120-130µm)no limit no limit
D, Contact Zone(130-250µm)
no limit none > 10µm
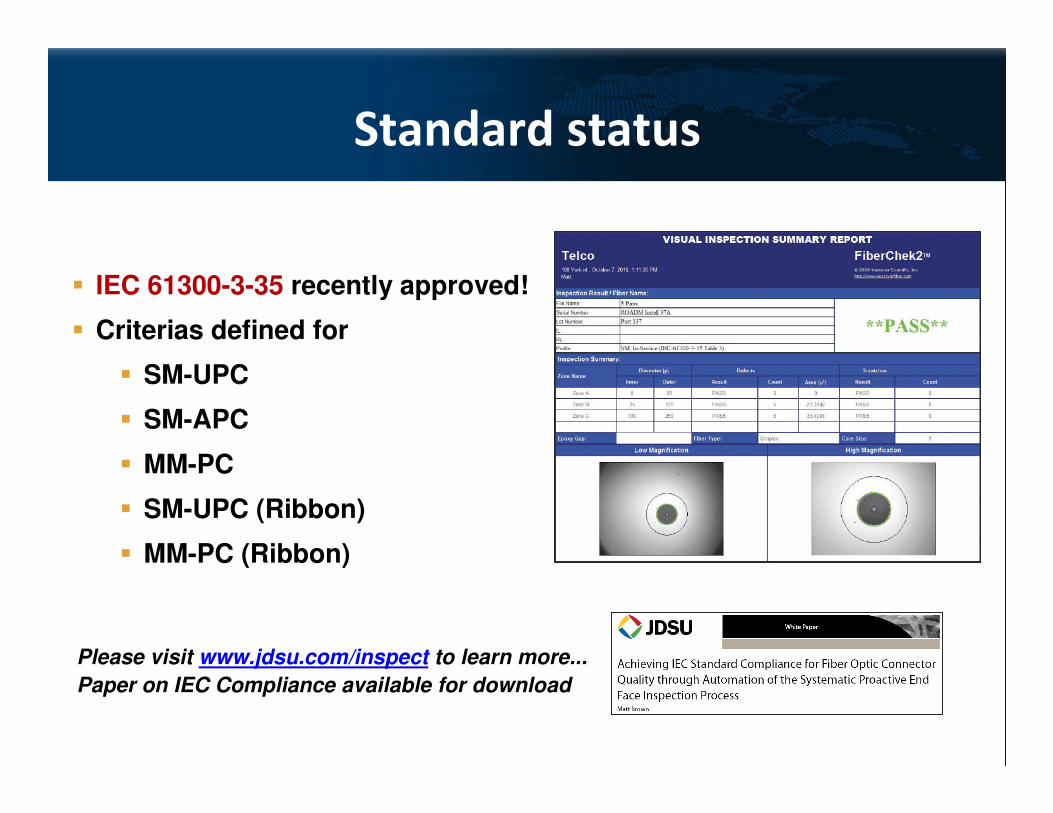
Standard status
� IEC 61300-3-35 recently approved!
� Criterias defined for
� SM-UPC
� SM-APC
� MM-PC
� SM-UPC (Ribbon)
� MM-PC (Ribbon)
Please visit www.jdsu.com/inspect to learn more...
Paper on IEC Compliance available for download

Key Takeaways
� Connectors are valuable and essential, but they must be handled properly.
� CONTAMINATION is the #1 source of troubleshooting in optical networks.
� This challenge is easily overcome with proactive inspection and cleaning.
� Visual inspection of fiber optic connectors with a microscope is the only way to determine if connectors are clean before they are mated.
� Proactive inspection is easy, and the benefits are:
– Reduced Network Downtime
– Reduced Troubleshooting
– Optimized Signal Performance
– Prevention of Network Damage
� Always “INSPECT BEFORE YOU CONNECT”

Backup slides:
LAN Fiber Testing Essentials

Fiber Certification Tier 1
� Polarity and LTS Tests, end-face inspection test strongly recommended
� The cabling infrastructure should respect maximum channel attenuation to ensure a reliable signal transmission over distance. This attenuation value should consider end-to-end channel losses
� Maximum channel attenuation is specified in the ANSI/TIA-568-B.1 standard
Fiber cable length must be either calculated or measured

Fiber Certification Tier 2
� Adds Fiber Plant Characterization with OTDR tests, end-face inspection tests strongly recommended
� An OTDR is the most powerful tool for certifying and troubleshooting Fiber Optic networks
� It provides the whole picture of the fiber link
� Detects, locates and measures events at any location of the fiber link
� Some requirements are needed
� SM/MM capabilities (850/1300/1310/1550nm)
� Minimum ADZ/EDZ (Attenuation/Event Dead Zone) � Short fiber patchcords
� EF Compliance (IEC 61280-4-1) and end-face inspection (IEC 61300-3-35)

The trend: Fiber Tests Automation
Automated bi-directional Insertion Loss / Return Loss and OTDR testing through a single fiber connection
� Fiber Test Automation examples:
� Connector Inspection Pass/Fail Analysis
� Bi-directional IL/ORL
� Bi-directional OTDR
� Full Fiber Characterization (IL/ORL/OTDR/Dispersion)
Reduces testing time during deployment of fiber optic networks by up to 75%!
Reduces testing time during deployment of fiber optic networks by up to 75%!
• Fiber Tests Automation reduces operational expenses (OPEX) and minimizes
training time with a simple, automated measurement process:
– Minimize the number of connections
– Guide the technician through the process
– Generate the report on the fly
– Allow uni-directional or bi-directional testing

Any questions?
Thank you!