04-sonic calibration and synthetic seismogram
DESCRIPTION
jjjjTRANSCRIPT
OCTOBER, 2010
HO CHI MINH CITY UNIVERSITY OF TECHNOLOGYRESEARCH CENTER FOR TECH. & INDUSTRIAL EQUIPMENT
Sonic Calibration and Synthetic SeismogramVIETSOVPETRO PETROLEUM
JOINT VENTURE
VERTICAL SEIMIC PROFILE PROCESSING AND INTERPRETATION training course
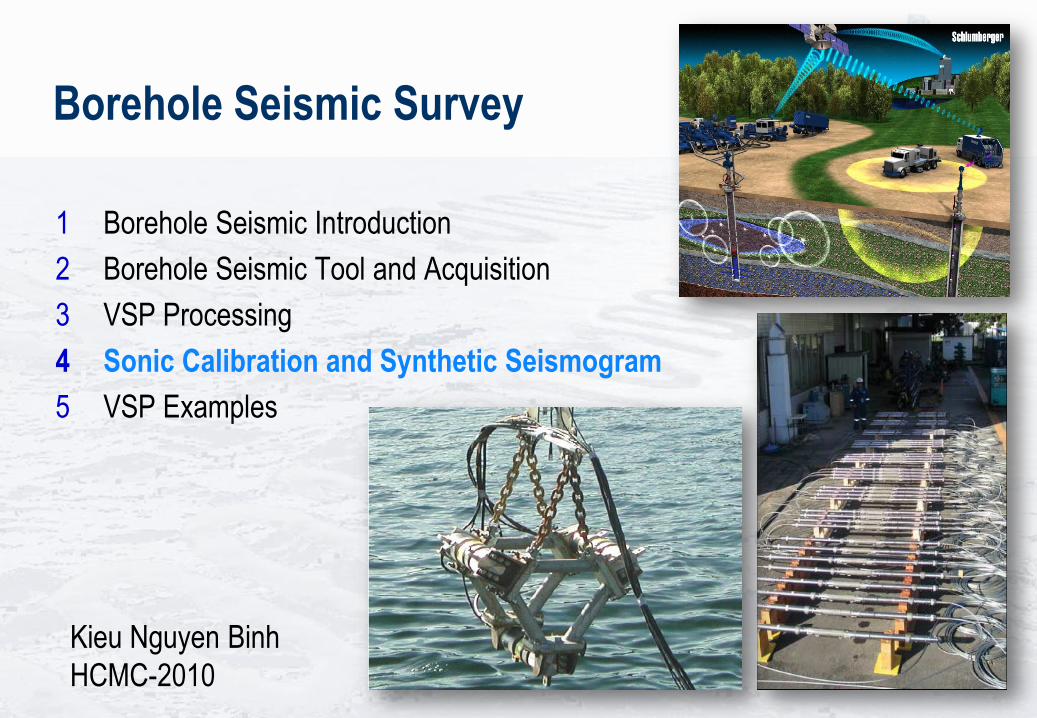
Borehole Seismic Survey
1 Borehole Seismic Introduction
2 Borehole Seismic Tool and Acquisition
3 VSP Processing
4 Sonic Calibration and Synthetic Seismogram
5 VSP Examples
Kieu Nguyen Binh
HCMC-2010
# 4
Sonic Calibration and
Synthetic Seismogram

What is it?
Sonic Calibration
Sonic times are corrected with borehole seismic times
Drift = (Vertical Seismic time - Integrated Sonic time)
Seismic & Sonic measurements:
1. Measure at different frequency range
2. Have different lateral investigation
3. Are direction dependent measurements
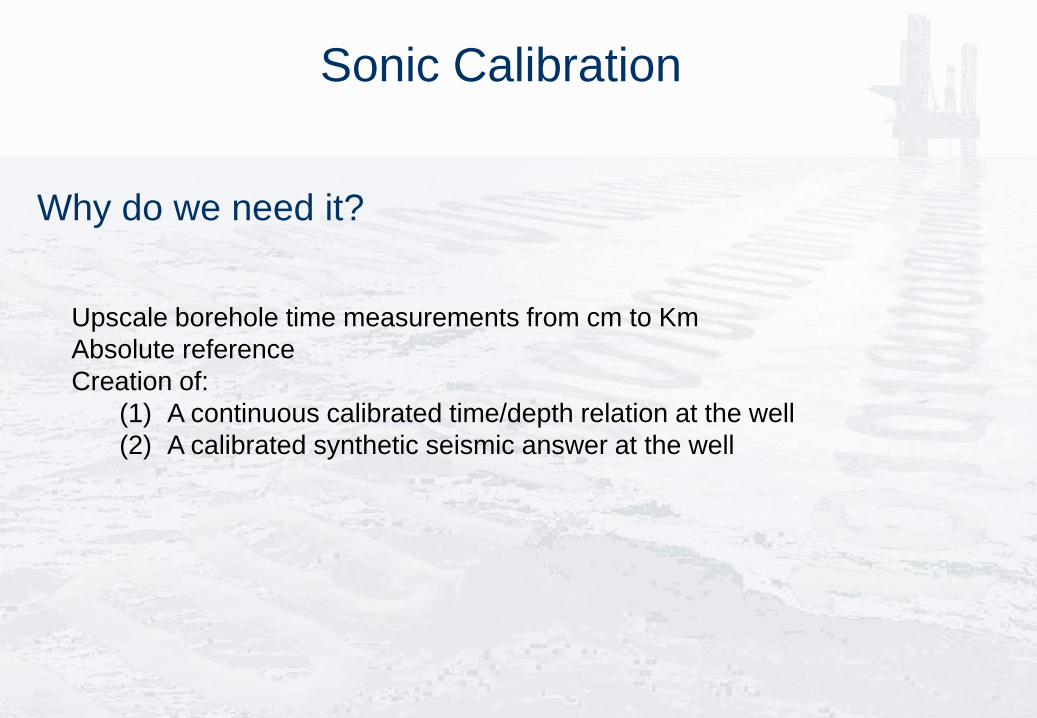
Sonic Calibration
Why do we need it?
Upscale borehole time measurements from cm to Km
Absolute reference
Creation of:
(1) A continuous calibrated time/depth relation at the well
(2) A calibrated synthetic seismic answer at the well
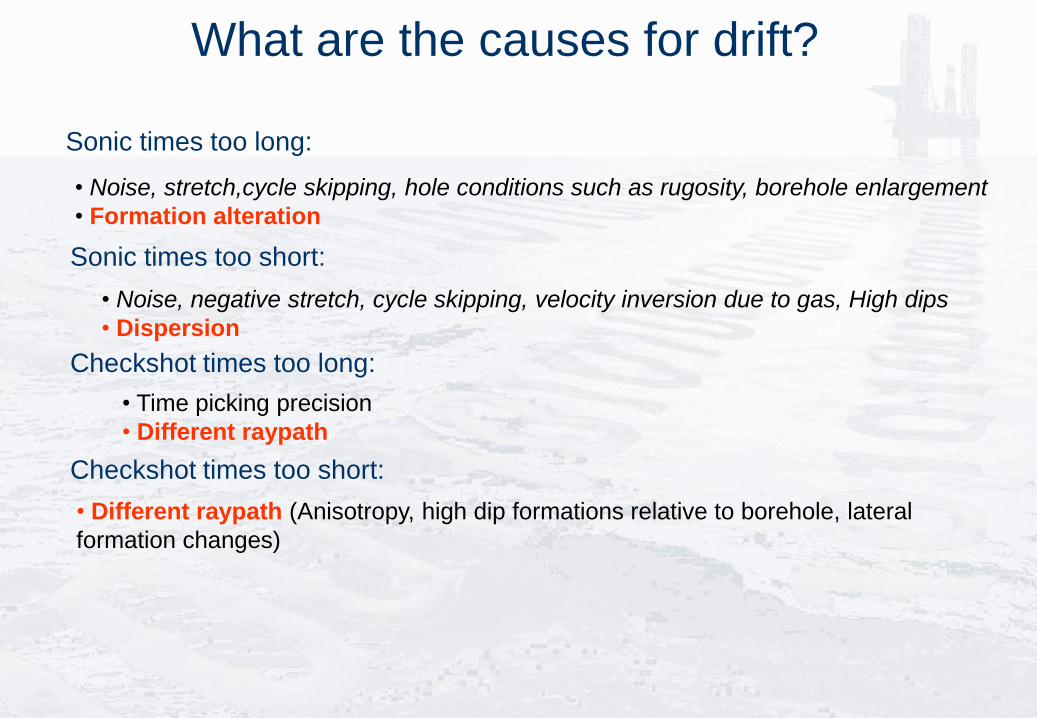
• Noise, stretch,cycle skipping, hole conditions such as rugosity, borehole enlargement
• Formation alteration
• Noise, negative stretch, cycle skipping, velocity inversion due to gas, High dips
• Dispersion
• Time picking precision
• Different raypath
• Different raypath (Anisotropy, high dip formations relative to borehole, lateral
formation changes)
Sonic times too long:
Sonic times too short:
Checkshot times too long:
Checkshot times too short:
What are the causes for drift?
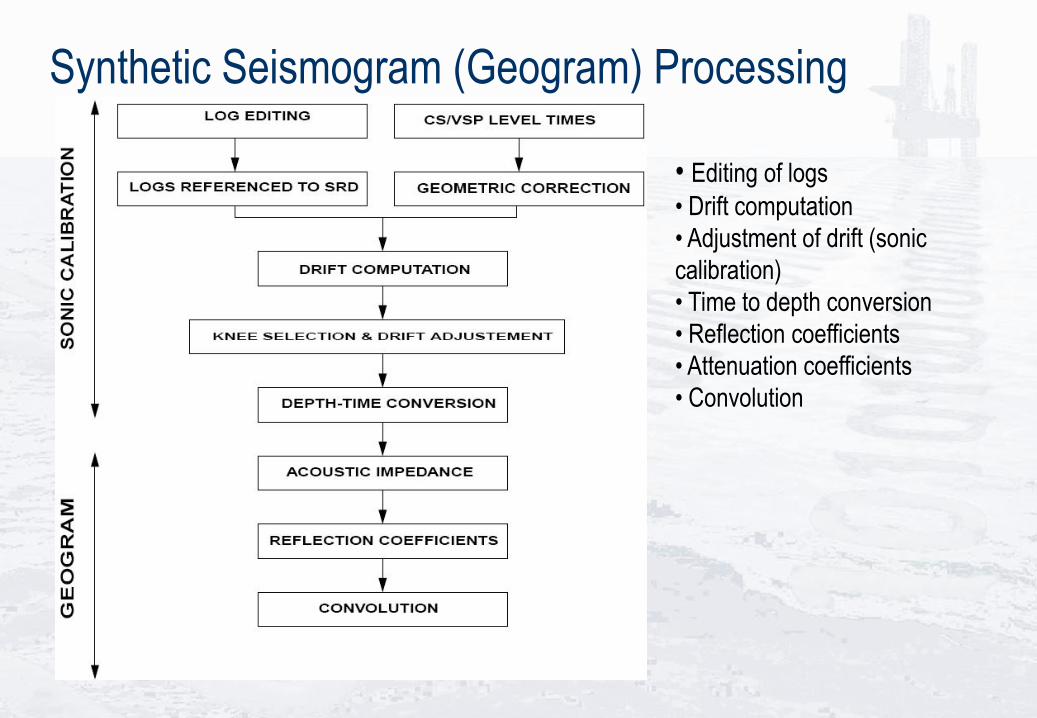
Synthetic Seismogram (Geogram) Processing
• Editing of logs
• Drift computation
• Adjustment of drift (sonic
calibration)
• Time to depth conversion
• Reflection coefficients
• Attenuation coefficients
• Convolution
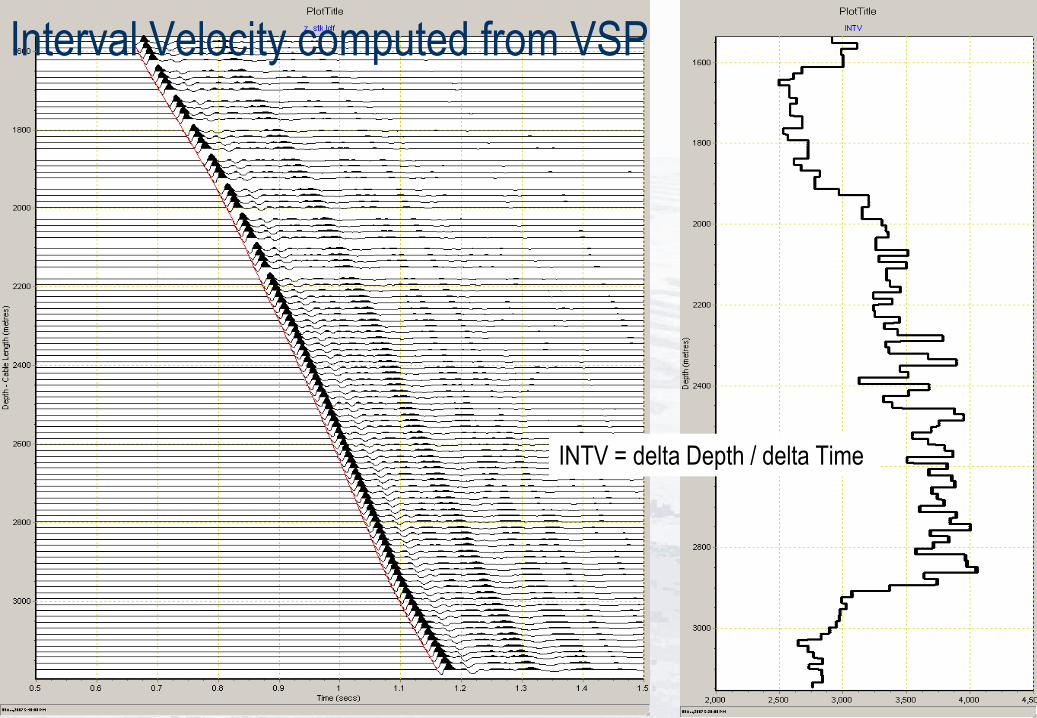
Interval Velocity computed from VSP
INTV = delta Depth / delta Time
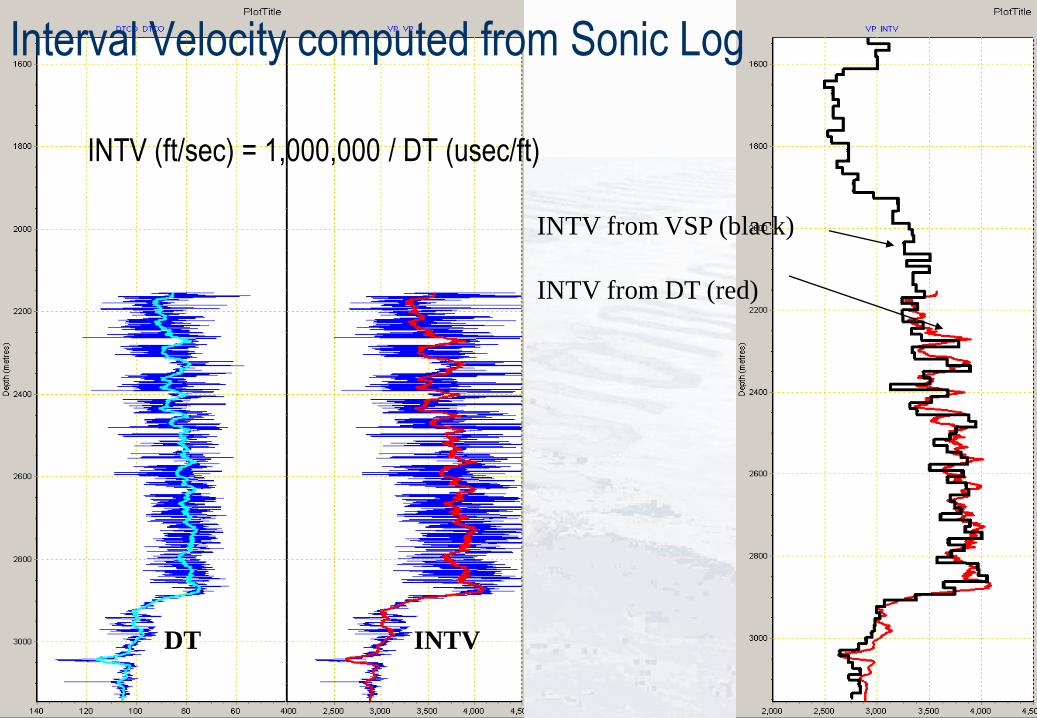
Interval Velocity computed from Sonic Log
INTV (ft/sec) = 1,000,000 / DT (usec/ft)
DT INTV
INTV from VSP (black)
INTV from DT (red)
Positive and Negative Drift
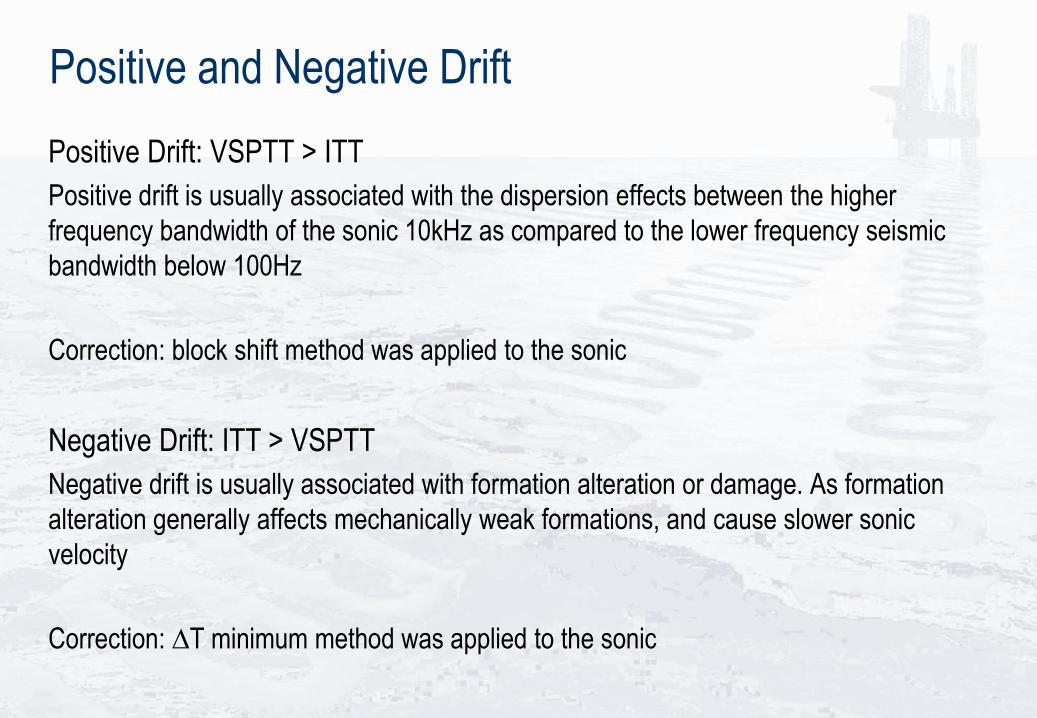
Positive Drift: VSPTT > ITT
Positive drift is usually associated with the dispersion effects between the higher
frequency bandwidth of the sonic 10kHz as compared to the lower frequency seismic
bandwidth below 100Hz
Correction: block shift method was applied to the sonic
Negative Drift: ITT > VSPTT
Negative drift is usually associated with formation alteration or damage. As formation
alteration generally affects mechanically weak formations, and cause slower sonic
velocity
Correction: ∆T minimum method was applied to the sonic
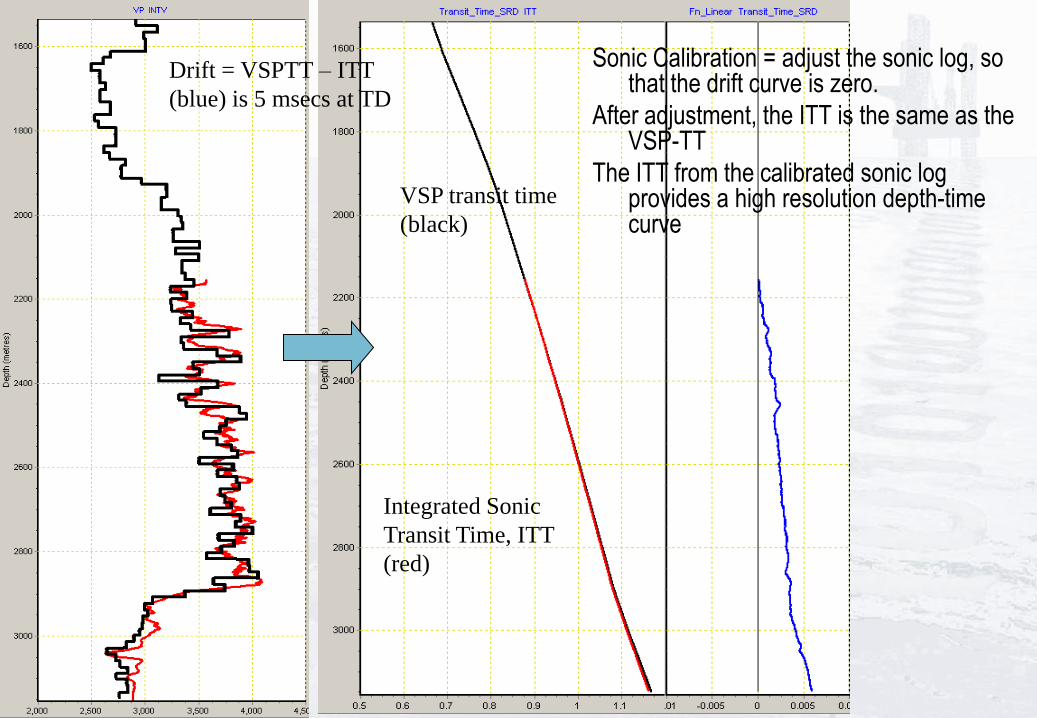
VSP transit time
(black)
Integrated Sonic
Transit Time, ITT
(red)
Drift = VSPTT – ITT
(blue) is 5 msecs at TD
Sonic Calibration = adjust the sonic log, so that the drift curve is zero.
After adjustment, the ITT is the same as the VSP-TT
The ITT from the calibrated sonic log provides a high resolution depth-time curve
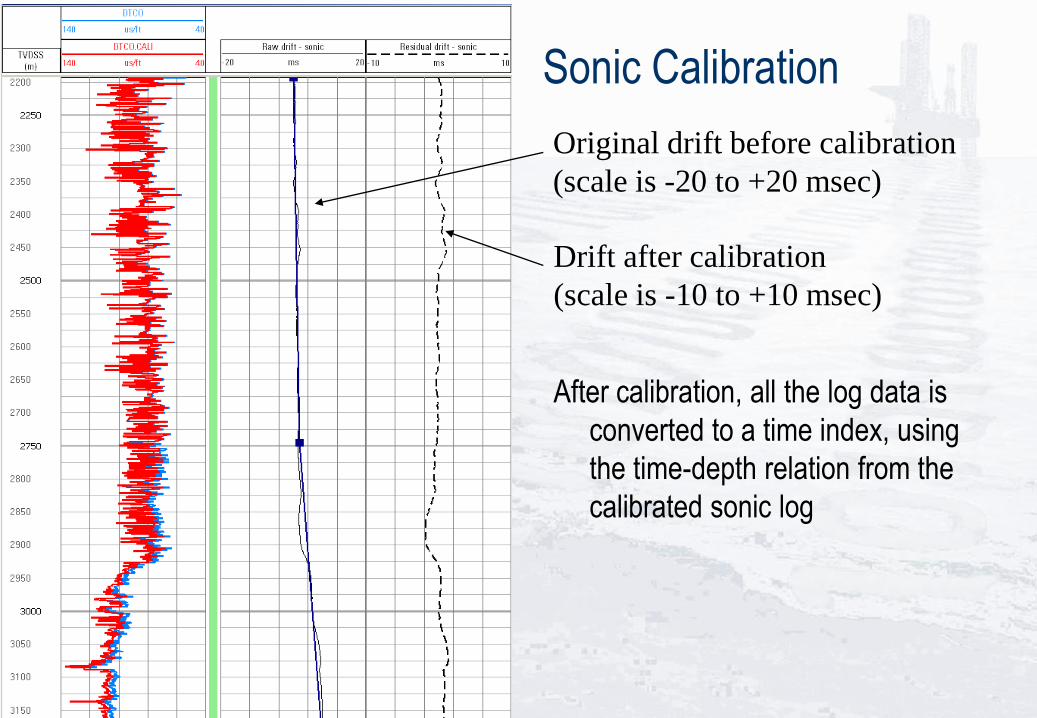
After calibration, all the log data is
converted to a time index, using
the time-depth relation from the
calibrated sonic log
Sonic Calibration
Original drift before calibration
(scale is -20 to +20 msec)
Drift after calibration
(scale is -10 to +10 msec)
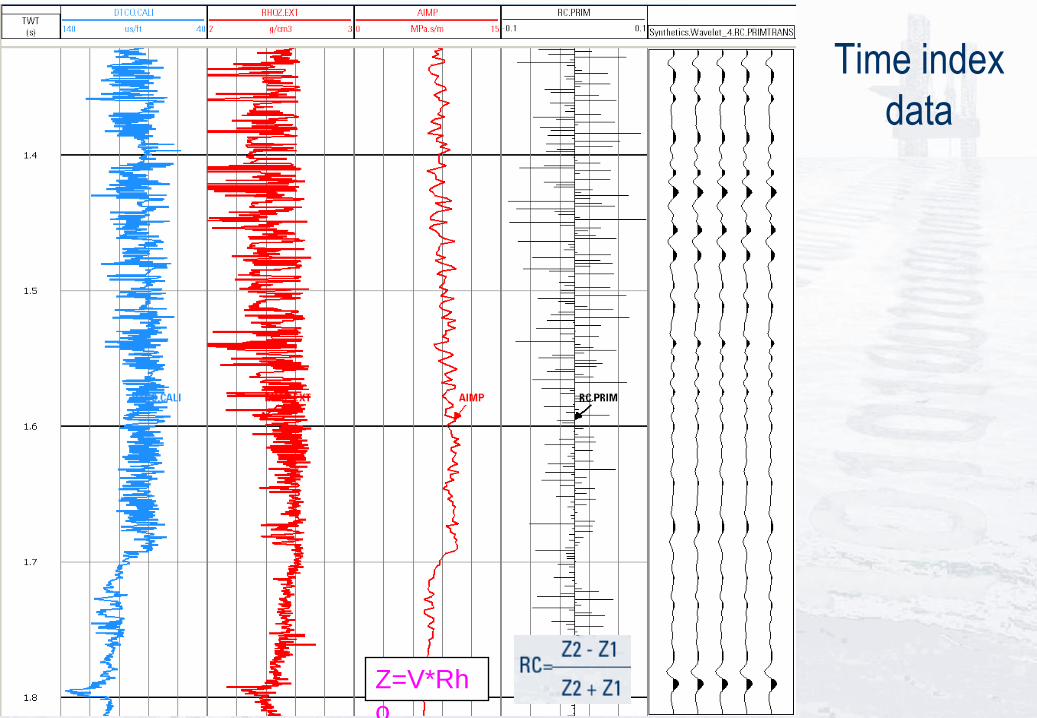
Time index
data
Z=V*Rh
o
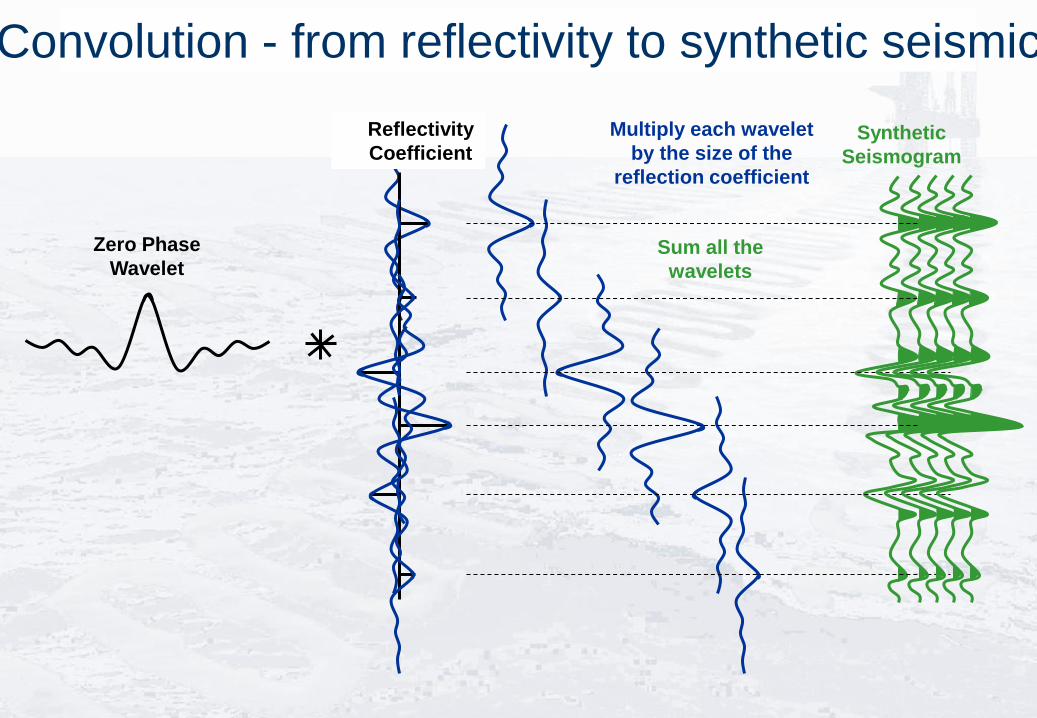
Convolution - from reflectivity to synthetic seismic
Zero Phase
Wavelet
Multiply each wavelet
by the size of the
reflection coefficient
Sum all the
wavelets
Synthetic
Seismogram
Reflectivity
Coefficient
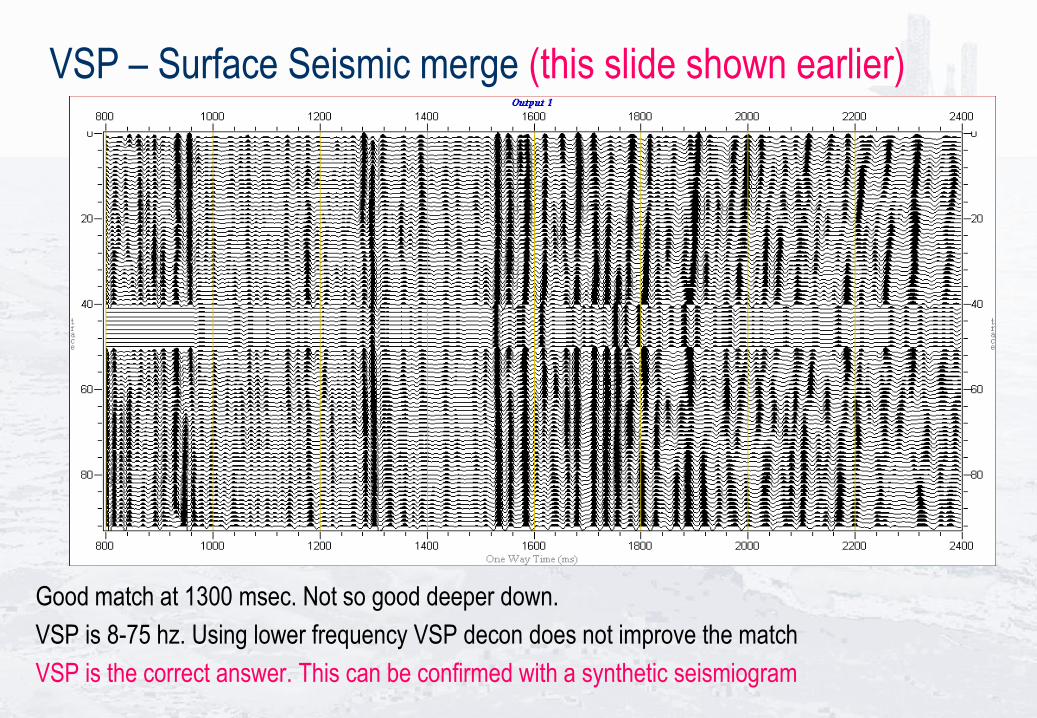
VSP – Surface Seismic merge (this slide shown earlier)
Good match at 1300 msec. Not so good deeper down.
VSP is 8-75 hz. Using lower frequency VSP decon does not improve the match
VSP is the correct answer. This can be confirmed with a synthetic seismiogram

VSP & Synthetic
C-Stk Synth
Apparent dipping
reflection seen away
from the corridor
stack window
with attenuation
The corridor stack and Synthetic are
independent measurements. If they
agree, then this confirms they are both
correct.

VSP verses Checkshot survey
~ 20 m level spacing ~ 100 m level
spacing and key
depth points
If Sonic Calibration is the only objective of a borehole seismic survey, then the levels can be spaced further apart.
The sonic log supplies the “higher resolution” part of the interval velocity.
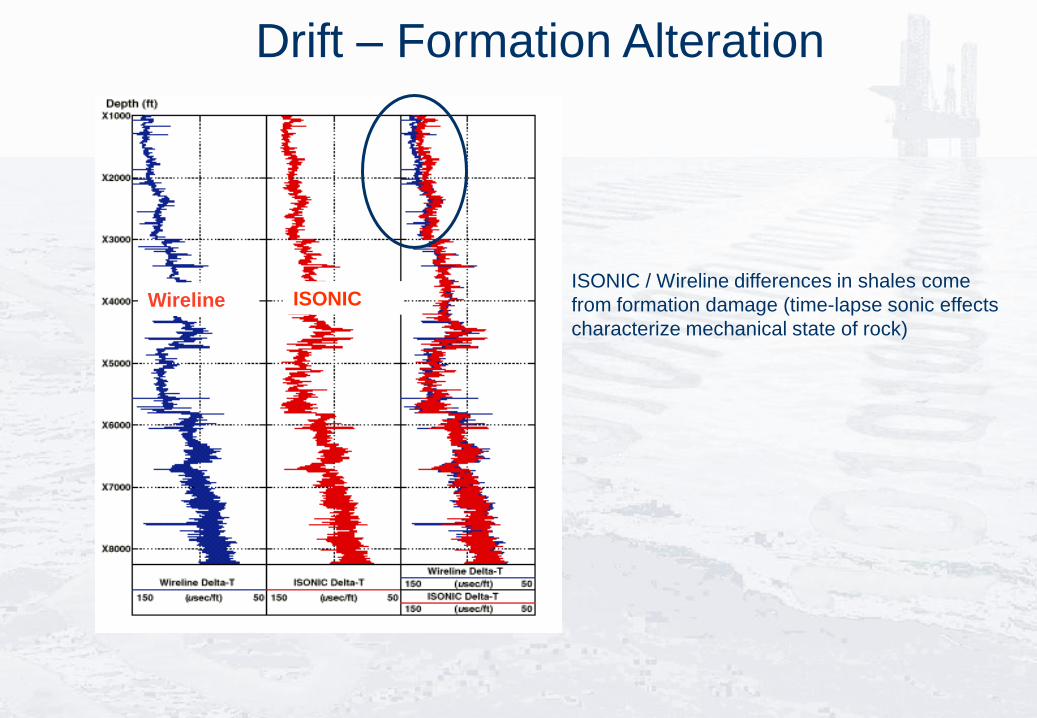
Drift – Formation Alteration
Wireline ISONICISONIC / Wireline differences in shales come
from formation damage (time-lapse sonic effects
characterize mechanical state of rock)

Dtc 3’ – 5’
(us/ft) 90
3900
De
pth
(ft
)140
Dtc 8’ – 10’
(us/ft) 90140
GR
(API) 1000
4000
Drift – Formation Alteration
1 w
ee
k la
ter
1 w
ee
k la
ter
De
pth
(ft
)6
40
00
.
................
0 20-20
Raw drift
Sonic 5’ – 7’
(ms)
.............
....
0 20-20
Raw drift
Sonic 7’ – 9’
(ms)
.....
.....
.......
0 20-20
Raw drift
Sonic 3’ – 5’
(ms)
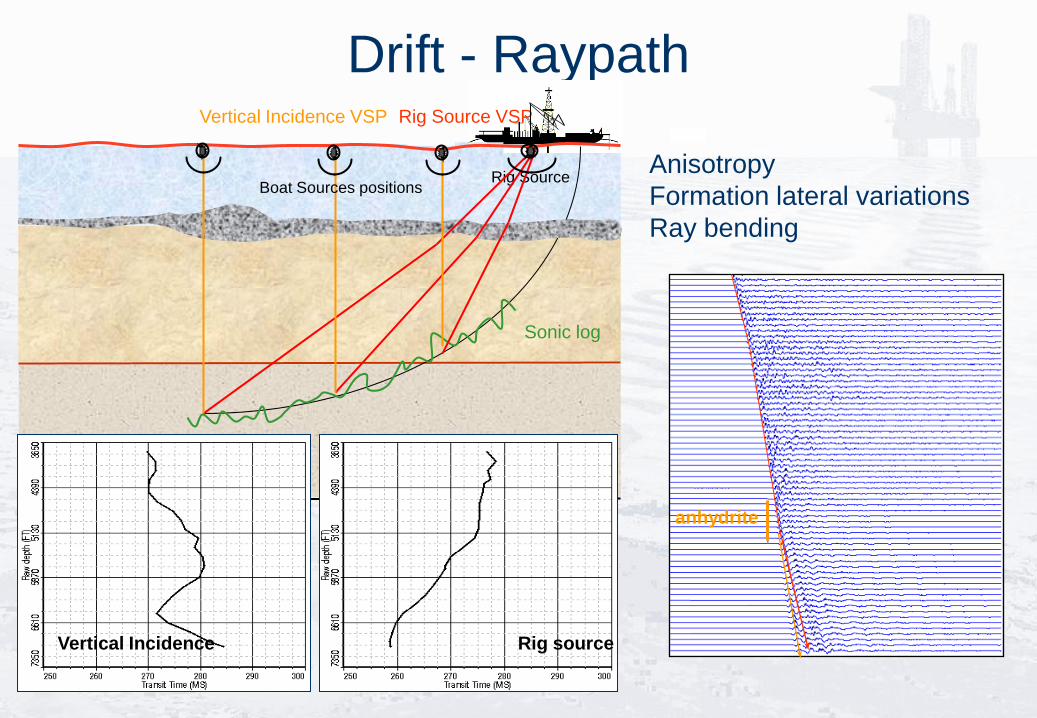
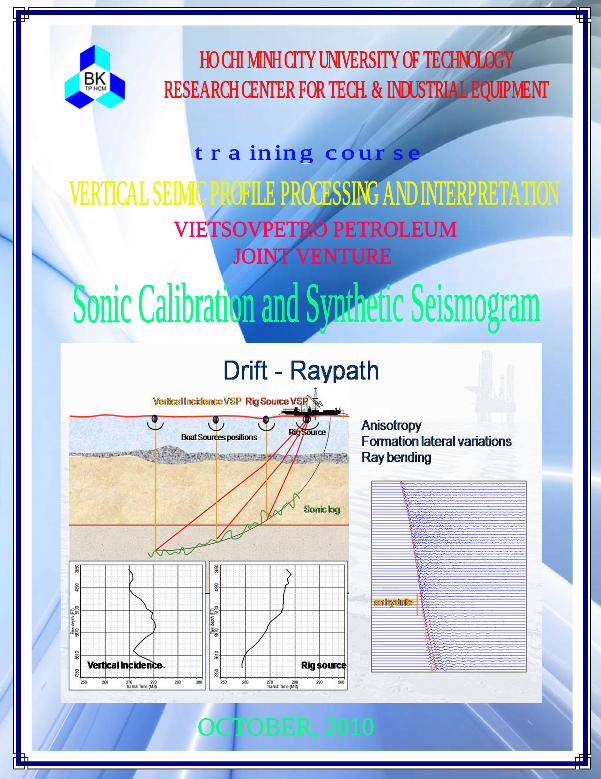
Drift - Raypath
Sonic log
Rig Source VSP
Rig Source
Rig source
Boat Sources positions
Vertical Incidence
Vertical Incidence VSP
Anisotropy
Formation lateral variations
Ray bending
anhydrite
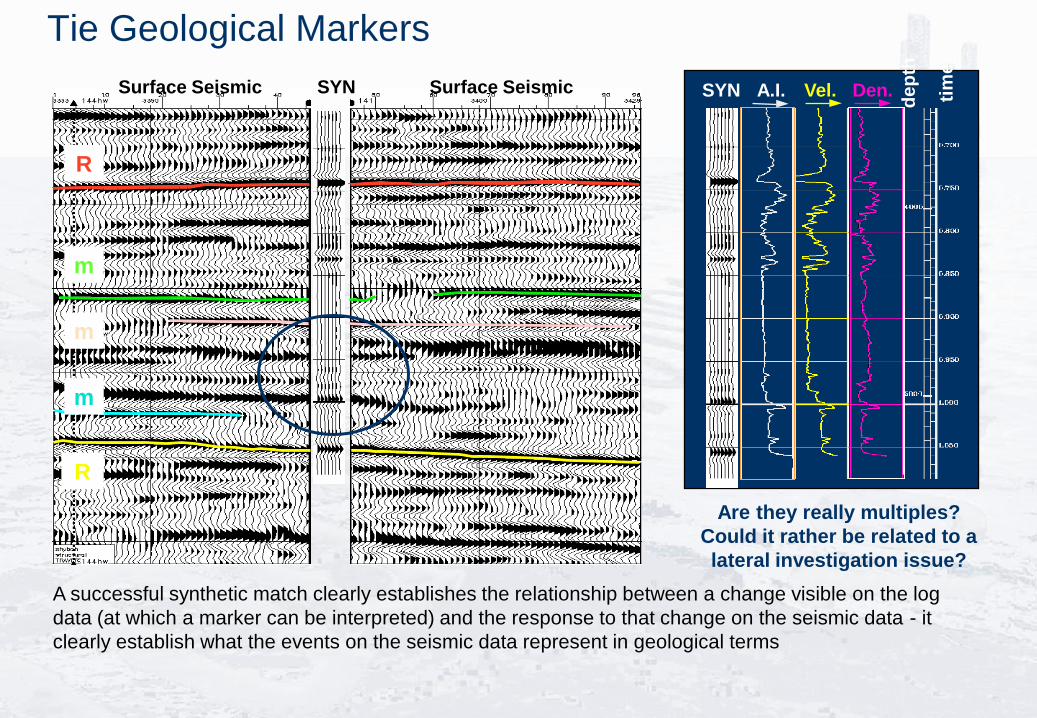
Tie Geological Markers
Surface Seismic Surface Seismic
m
m
m
R
R
SYN SYN A.I. Den.Vel. tim
e
de
pth
A successful synthetic match clearly establishes the relationship between a change visible on the log
data (at which a marker can be interpreted) and the response to that change on the seismic data - it
clearly establish what the events on the seismic data represent in geological terms
Are they really multiples?
Could it rather be related to a
lateral investigation issue?
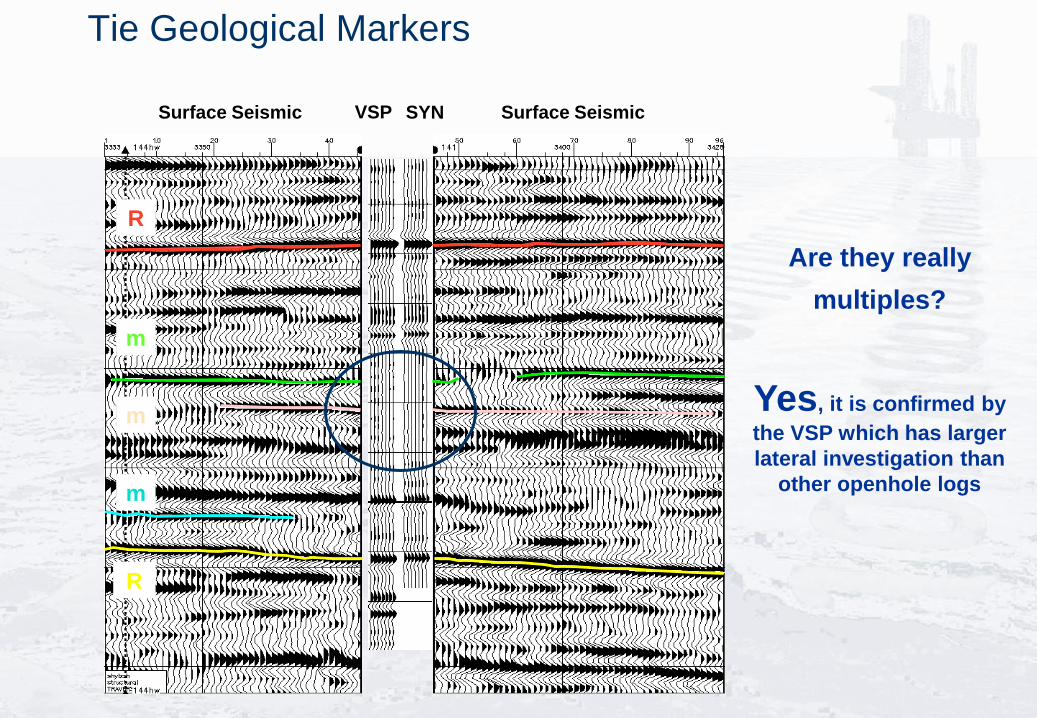
SYNSurface Seismic Surface Seismic
Tie Geological Markers
VSP
Yes, it is confirmed by
the VSP which has larger
lateral investigation than
other openhole logs
m
m
m
R
R
Are they really
multiples?