042009 year 2 and 3 charter report 090416
TRANSCRIPT

8/14/2019 042009 Year 2 and 3 Charter Report 090416
http://slidepdf.com/reader/full/042009-year-2-and-3-charter-report-090416 1/67
DIVISION OF R ESEARCH, EVALUATION, ASSESSMENT, AND ACCOUNTABILITY
BALTIMORE CITY PUBLIC SCHOOLS
Charter School Report
2005-06 to 2007-08 School Years
Charter schools in Baltimore City have experienced dramatic growth in number and enrollment, achieved generally stronge but uneven performance on objective outcomes, and evidenced superior satisfaction on climate measures.
April 16, 2009

8/14/2019 042009 Year 2 and 3 Charter Report 090416
http://slidepdf.com/reader/full/042009-year-2-and-3-charter-report-090416 2/67
i
8/14/2019 042009 Year 2 and 3 Charter Report 090416
http://slidepdf.com/reader/full/042009-year-2-and-3-charter-report-090416 3/67
ii
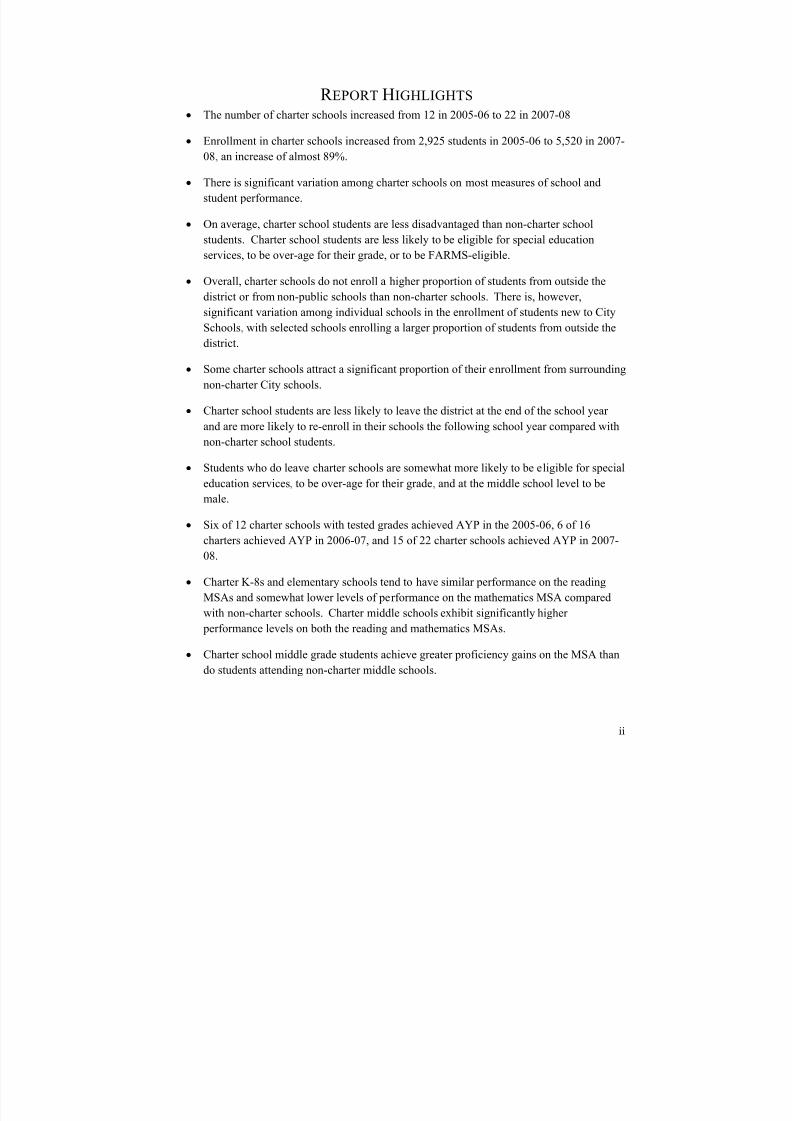
R EPORT HIGHLIGHTS • The number of charter schools increased from 12 in 2005-06 to 22 in 2007-08
• Enrollment in charter schools increased from 2,925 students in 2005-06 to 5,520 in 2007-
08, an increase of almost 89%.
• There is significant variation among charter schools on most measures of school and
student performance.
• On average, charter school students are less disadvantaged than non-charter school
students. Charter school students are less likely to be eligible for special education
services, to be over-age for their grade, or to be FARMS-eligible.
• Overall, charter schools do not enroll a higher proportion of students from outside the
district or from non-public schools than non-charter schools. There is, however,significant variation among individual schools in the enrollment of students new to City
Schools, with selected schools enrolling a larger proportion of students from outside the
district.
• Some charter schools attract a significant proportion of their enrollment from surrounding
non-charter City schools.
• Charter school students are less likely to leave the district at the end of the school year
and are more likely to re-enroll in their schools the following school year compared with
non-charter school students.
• Students who do leave charter schools are somewhat more likely to be eligible for special
education services, to be over-age for their grade, and at the middle school level to be
male.
• Six of 12 charter schools with tested grades achieved AYP in the 2005-06, 6 of 16
charters achieved AYP in 2006-07, and 15 of 22 charter schools achieved AYP in 2007-
08.
• Charter K-8s and elementary schools tend to have similar performance on the reading
MSAs and somewhat lower levels of performance on the mathematics MSA comparedwith non-charter schools. Charter middle schools exhibit significantly higher
performance levels on both the reading and mathematics MSAs.
• Charter school middle grade students achieve greater proficiency gains on the MSA than
do students attending non-charter middle schools.

8/14/2019 042009 Year 2 and 3 Charter Report 090416
http://slidepdf.com/reader/full/042009-year-2-and-3-charter-report-090416 4/67
iii
• Charter schools evidence higher rates of school attendance than non-charter schools with
the largest gaps appearing between charter and non-charter middle schools.
• Charter school parents, teachers, and students rate their school’s climate higher than do
parents, teachers, and students in non-charter schools at all grade levels.
• Charter school suspension rates tend to be lower than the rates of non-charter schools.

8/14/2019 042009 Year 2 and 3 Charter Report 090416
http://slidepdf.com/reader/full/042009-year-2-and-3-charter-report-090416 5/67
iv
TABLE OF CONTENTS
Report Highlights.......................................................................................................................................... ii List of Tables ............................................................................................................................................... vi Introduction................................................................................................................................................... 1 Methods ........................................................................................................................................................ 3
Data Collection Sources and Methods...................................................................................................... 3 Characteristics of Baltimore’s Charter Schools.................................................................................. 3
Program......................................................................................................................................................... 6 Funding..................................................................................................................................................... 6 Charter School Approval and Review ...................................................................................................... 6 School Size .............................................................................................................................................. 7
Characteristics of
Students ....................................................................................................................... 8
Student Demographics.......................................................................................................................... 8 Special Education in Charter Schools............................................................................................. 9
Characteristics of Students Transferring to Charter Schools......................................................... 12 Charter School Enrollment Patterns.................................................................................................. 13
Are Charter Schools Attracting Students Into City Schools?.................................................... 14 Are Enrollments of Some Non‐charter Schools Disproportionately Affected by Charter
Schools?............................................................................................................................................. 16 Are Students Who Leave Charter Schools Different From Those Who Stay?........................ 21
Adequate Yearly Progress and Student Performance on State and Standardized Assessments
................................................................................................................................................................ 22
8/14/2019 042009 Year 2 and 3 Charter Report 090416
http://slidepdf.com/reader/full/042009-year-2-and-3-charter-report-090416 6/67
v
Adequate Yearly Progress.............................................................................................................. 22 MSA Performance of Special Education Students...................................................................... 26 Student‐level MSA Proficiency Gains .......................................................................................... 28 High School Assessments .................................................................................................................. 30 Stanford 10 Performance.................................................................................................................... 31
Stanford Grade 1 to 2 Student‐level Progress......................................................................... 34 Learning Environment of Charter Schools....................................................................................... 34
School‐level Attendance Rates ...................................................................................................... 34 School Climate ................................................................................................................................. 36 Student Discipline ........................................................................................................................... 38
Teacher Characteristics – Highly Qualified Status ......................................................................... 40 Summary ................................................................................................................................................... 42 Appendix A............................................................................................................................................... 43
Characteristics of BCPSS Charter Schools 2005‐2006 through 2007‐08.................................... 43 Appendix
B........................................................................................................................................... 55
Title I School Improvement Sanctions.......................................................................................... 55 Appendix C ‐ Computation of MSA Proficiency Level Gains ...................................................... 56 Appendix D – LRE Codes.................................................................................................................... 57
8/14/2019 042009 Year 2 and 3 Charter Report 090416
http://slidepdf.com/reader/full/042009-year-2-and-3-charter-report-090416 7/67
vi
LIST OF TABLES
Table
1.
Charter
School
Enrollment
by
Grade
Level
2005‐
06
to
2007‐
08 ...................................... 1
Table 2. Charter School Operation and Enrollment 2005‐06 to 2007‐08........................................ 5 Table 3. 2007‐08 Charter School Application Renewal Decisions.................................................. 7 Table 4. Number of Schools and Average Enrollment by Charter School and Non‐charter
School Status 2005‐06 to 2007‐08.......................................................................................... 8 Table 5. Comparison of Charter School Student Characteristics with Non‐Charter School
Students ................................................................................................................................... 9 Table 6. Percent Distribution of Special Education Students by LRE Classification................. 11 Table 7. Special Education LRE Status Change .............................................................................. 11 Table
8. Comparison
of
the
Characteristics
of
Charter
and
Non
‐Charter
School
Transfer
Students ....................................................................................................................................................
13 Table 9. Rate of Enrollment of Charter and Non‐Charter School Students not Previously
Enrolled in City Schools...................................................................................................... 15 Table 10. Schools With More than Two Percent Average Annual Enrollment Transferring to
Charter Schools, 2005‐06 to 2007‐08............................................................................... 17 Table 11. Charter Schools Receiving more than 15 Percent of their Transfers from a Single
Sending School, 2005‐06 to 2007‐08 .............................................................................. 18 Table
12. Percentage
of
Students
Exiting
City
Schools................................................................ 19
Table 13. Percentage of Students Returning to the Same School in the Following Year ........20 Table 14. Demographics of Charter School Students by Leaver Status (%) 2005‐06 through
2007‐08 School Years........................................................................................................ 21 Table 15. Charter Schools Adequate Yearly Progress 2005‐06 to 2007‐08................................. 23 Table 16. Number of Schools Making AYP by Charter Status ................................................... 24 Table 17. AYP Percent of All Students Scoring Proficient or Advanced 2005‐06 to 2007‐08 25 Table 18. AYP Percent of Students Receiving Special Education Services Scoring Proficient
or Advanced 2005‐06 to 2007‐08..................................................................................... 27 Table
19. Change
in
MSA
Proficiency
Level
(Percent
of
Students) ........................................... 29
Table 20. Comprehensive HSA Performance 2006‐07 and 2007‐08 ........................................... 31 Table 21. Stanford 10 Grade 1 and 2 Reading National Percentile ............................................ 32 Table 22. Stanford 10 Grade 1 and 2 Mathematics National Percentile .................................... 33 Table 23. Stanford 10 Achievement Test Student Matched Pairs Average NCE Annual Gains
34 Table 24. School‐level attendance rates 2005‐06 to 2007‐08 by charter school status..............35

8/14/2019 042009 Year 2 and 3 Charter Report 090416
http://slidepdf.com/reader/full/042009-year-2-and-3-charter-report-090416 8/67
vii
Table 25. Measures of School Climate 2005‐06 through 2007‐08............................................... 37 Table 26. Suspension Rate by Charter School Status ................................................................... 39 Table 27. Highly Qualified Teacher Status....................................................................................41
8/14/2019 042009 Year 2 and 3 Charter Report 090416
http://slidepdf.com/reader/full/042009-year-2-and-3-charter-report-090416 9/67
8/14/2019 042009 Year 2 and 3 Charter Report 090416
http://slidepdf.com/reader/full/042009-year-2-and-3-charter-report-090416 10/67
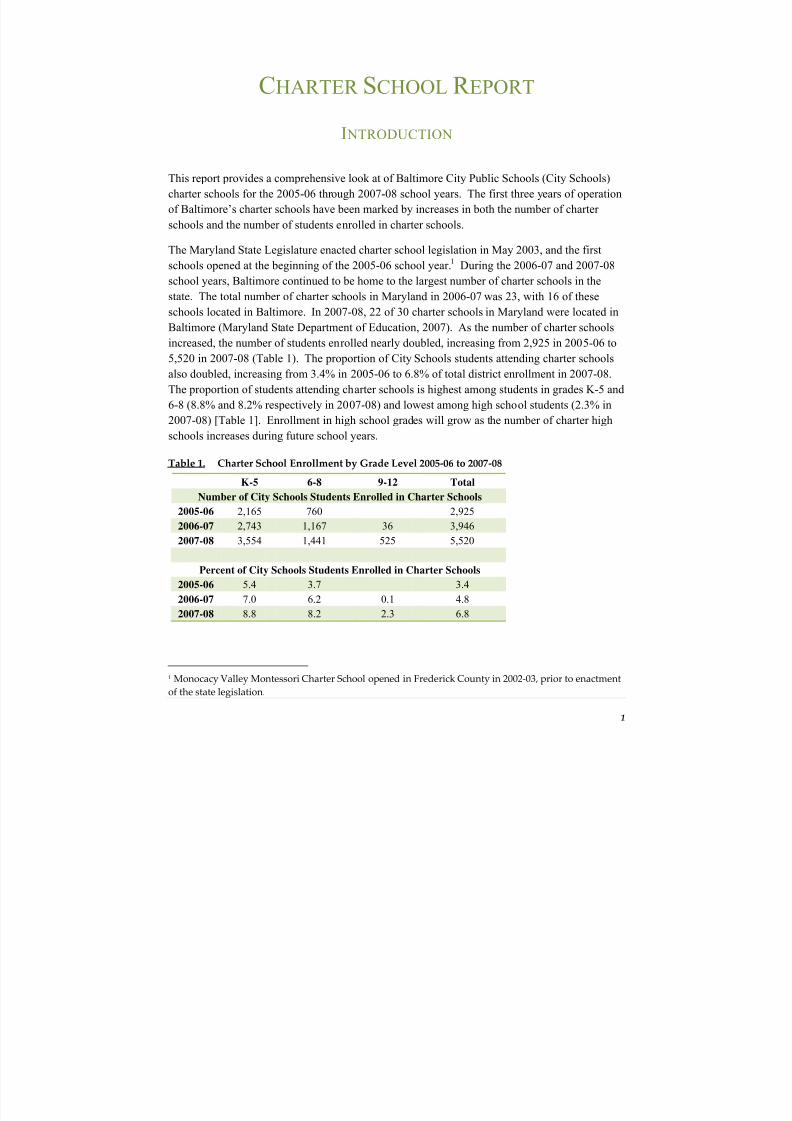
DREAA Charter School Report 2005-06 through 2007-08 April 2009
2
The goal of this report is to provide additional information to the Baltimore City Board of School
Commissioners and the City Schools community as a whole about charter school operation and
the extent to which Baltimore’s charter schools provided students and families with positive and
effective educational options for the 2005-06 through 2007-08 school years.
Questions guiding the evaluation included:
1. How many charter schools operated during each of the school years? What were thecharacteristics and missions of the schools?
2. Who attended charter schools during the first three years of operation? What were thedemographic characteristics of charter school students in Baltimore? How do thecharacteristics of students who attended charter schools compare with those of studentswho attend City non-charter schools?
3. How long did students remain enrolled in charter schools? To what extent did students
transfer from charter schools? In what ways, if any, did students who transferred fromcharter schools differ from students who remain?
4. What were the academic outcomes of students who attended charter schools? How didthe outcomes of charter schools compare with those of other City Schools serving thesame grade levels? What were student outcomes in the areas of assessment performance,disciplinary actions, and promotion?
5. What type of learning environment did charter schools provide? To what extent did parents and students report that the schools had a positive climate? How frequently didcharter schools suspend students?
6. How did the proportion of teachers achieving highly qualified status compare for charter and non-charter schools?
The first section of this report describes data collection methods and sources. The second section
highlights different aspects of charter school operation including the initial charter application
and renewal process and the size of charter schools in comparison to non-charter schools. The
third section of the report examines demographic characteristics of students and reenrollment in
and transfer to charter schools. The fourth part explores student and school outcomes in the
areas of performance on state and standardized assessments and achievement of adequate yearly
progress. The next section looks at student attendance, climate, disciplinary exclusions, andteacher characteristics. The final section of the report highlights key findings and possible areas
of work for upcoming charter school evaluations.
8/14/2019 042009 Year 2 and 3 Charter Report 090416
http://slidepdf.com/reader/full/042009-year-2-and-3-charter-report-090416 11/67
DREAA Charter School Report 2005-06 through 2007-08 April 2009
3
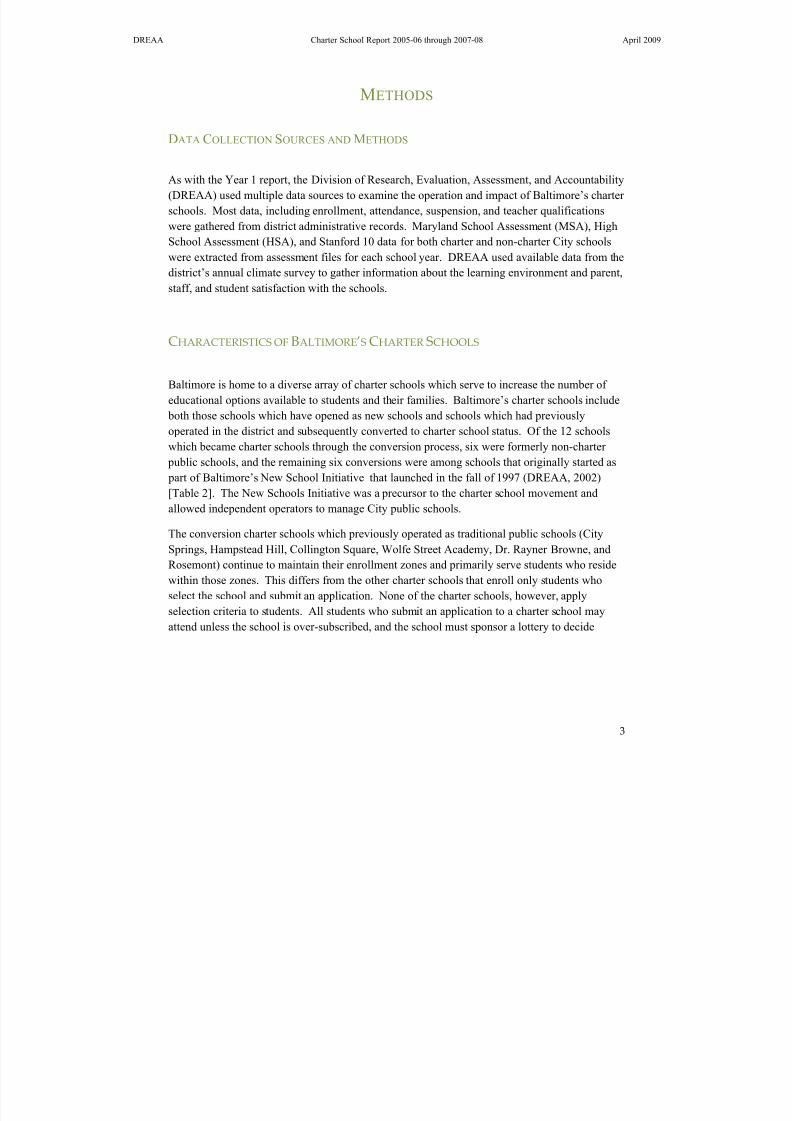
METHODS
DATA COLLECTION SOURCES AND METHODS
As with the Year 1 report, the Division of Research, Evaluation, Assessment, and Accountability
(DREAA) used multiple data sources to examine the operation and impact of Baltimore’s charter
schools. Most data, including enrollment, attendance, suspension, and teacher qualifications
were gathered from district administrative records. Maryland School Assessment (MSA), High
School Assessment (HSA), and Stanford 10 data for both charter and non-charter City schools
were extracted from assessment files for each school year. DREAA used available data from the
district’s annual climate survey to gather information about the learning environment and parent,
staff, and student satisfaction with the schools.
CHARACTERISTICS OF BALTIMORE’S CHARTER SCHOOLS
Baltimore is home to a diverse array of charter schools which serve to increase the number of
educational options available to students and their families. Baltimore’s charter schools include
both those schools which have opened as new schools and schools which had previously
operated in the district and subsequently converted to charter school status. Of the 12 schools
which became charter schools through the conversion process, six were formerly non-charter public schools, and the remaining six conversions were among schools that originally started as
part of Baltimore’s New School Initiative that launched in the fall of 1997 (DREAA, 2002)
[Table 2]. The New Schools Initiative was a precursor to the charter school movement and
allowed independent operators to manage City public schools.
The conversion charter schools which previously operated as traditional public schools (City
Springs, Hampstead Hill, Collington Square, Wolfe Street Academy, Dr. Rayner Browne, and
Rosemont) continue to maintain their enrollment zones and primarily serve students who reside
within those zones. This differs from the other charter schools that enroll only students who
select the school and submit an application. None of the charter schools, however, applyselection criteria to students. All students who submit an application to a charter school may
attend unless the school is over-subscribed, and the school must sponsor a lottery to decide

8/14/2019 042009 Year 2 and 3 Charter Report 090416
http://slidepdf.com/reader/full/042009-year-2-and-3-charter-report-090416 12/67
DREAA Charter School Report 2005-06 through 2007-08 April 2009
4
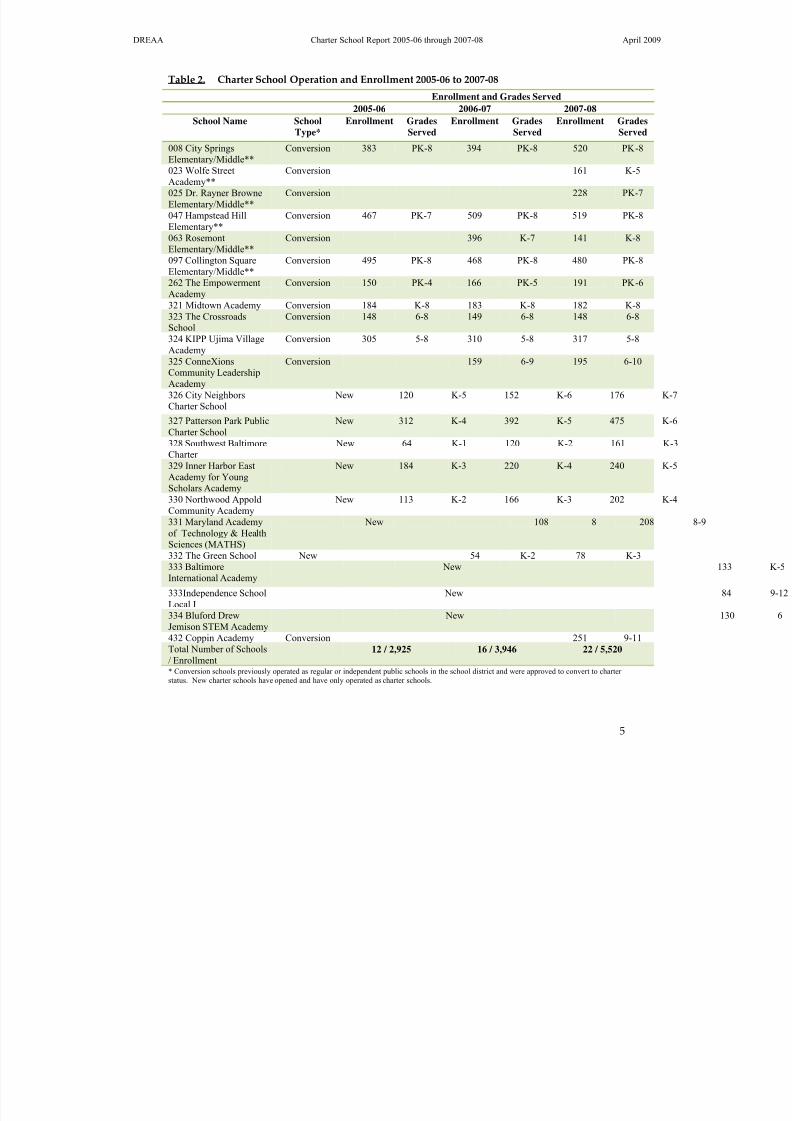
which students will enroll for the following school year.2 Table 2 demonstrates the growth of
charter schools since 2005-06 in terms of the numbers of schools and students and grades served.
As detailed in Appendix A, the mission and focus of the city’s charter schools varies. Several
schools such as City Neighbors, Southwest Baltimore Charter, and The Crossroads School focus
on providing students opportunities in project-based or experiential learning. The Bluford-Drew-Jemison STEM Academy is a middle school for boys that focuses on increasing student exposure
to and achievement in mathematics and science while the Empowerment Academy attempts to
infuse the arts throughout the curriculum. The differences in school mission and focus provide
students with a broad array of educational choices and opportunities.
2 Students who require special education services must be evaluated to ensure that the school is able to
provide adequate supports and accommodations for students. Some charter schools may not be able to
provide the proper educational environment.
8/14/2019 042009 Year 2 and 3 Charter Report 090416
http://slidepdf.com/reader/full/042009-year-2-and-3-charter-report-090416 13/67
DREAA Charter School Report 2005-06 through 2007-08 April 2009
5
Table 2. Charter School Operation and Enrollment 2005‐06 to 2007‐08
Enrollment and Grades Served
2005-06 2006-07 2007-08
School Name School
Type*
Enrollment Grades
Served
Enrollment Grades
Served
Enrollment Grades
Served
008 City SpringsElementary/Middle**
Conversion 383 PK-8 394 PK-8 520 PK-8
023 Wolfe StreetAcademy**
Conversion 161 K-5
025 Dr. Rayner BrowneElementary/Middle**
Conversion 228 PK-7
047 Hampstead HillElementary**
Conversion 467 PK-7 509 PK-8 519 PK-8
063 RosemontElementary/Middle**
Conversion 396 K-7 141 K-8
097 Collington SquareElementary/Middle**
Conversion 495 PK-8 468 PK-8 480 PK-8
262 The Empowerment
Academy
Conversion 150 PK-4 166 PK-5 191 PK-6
321 Midtown Academy Conversion 184 K-8 183 K-8 182 K-8323 The CrossroadsSchool
Conversion 148 6-8 149 6-8 148 6-8
324 KIPP Ujima VillageAcademy
Conversion 305 5-8 310 5-8 317 5-8
325 ConneXionsCommunity LeadershipAcademy
Conversion 159 6-9 195 6-10
326 City NeighborsCharter School
New 120 K-5 152 K-6 176
327 Patterson Park PublicCharter School
New 312 K-4 392 K-5 475
328 Southwest BaltimoreCharter New 64 K-1 120 K-2 161
329 Inner Harbor EastAcademy for YoungScholars Academy
New 184 K-3 220 K-4 240
330 Northwood AppoldCommunity Academy
New 113 K-2 166 K-3 202
331 Maryland Academyof Technology & HealthSciences (MATHS)
New 108 8 208
332 The Green School New 54 K-2 78 K-3333 BaltimoreInternational Academy
New
333Independence SchoolLocal I New
334 Bluford DrewJemison STEM Academy
New
432 Coppin Academy Conversion 251 9-11Total Number of Schools/ Enrollment
12 / 2,925 16 / 3,946 22 / 5,520
* Conversion schools previously operated as regular or independent public schools in the school district and were approved to convert to charter status. New charter schools have opened and have only operated as charter schools.
8/14/2019 042009 Year 2 and 3 Charter Report 090416
http://slidepdf.com/reader/full/042009-year-2-and-3-charter-report-090416 14/67
DREAA Charter School Report 2005-06 through 2007-08 April 2009
6
** These schools previously operated as traditional neighborhood schools and continue to maintain their enrollment zones and primarily servestudents from the enrollment zone.
PROGRAM
FUNDING
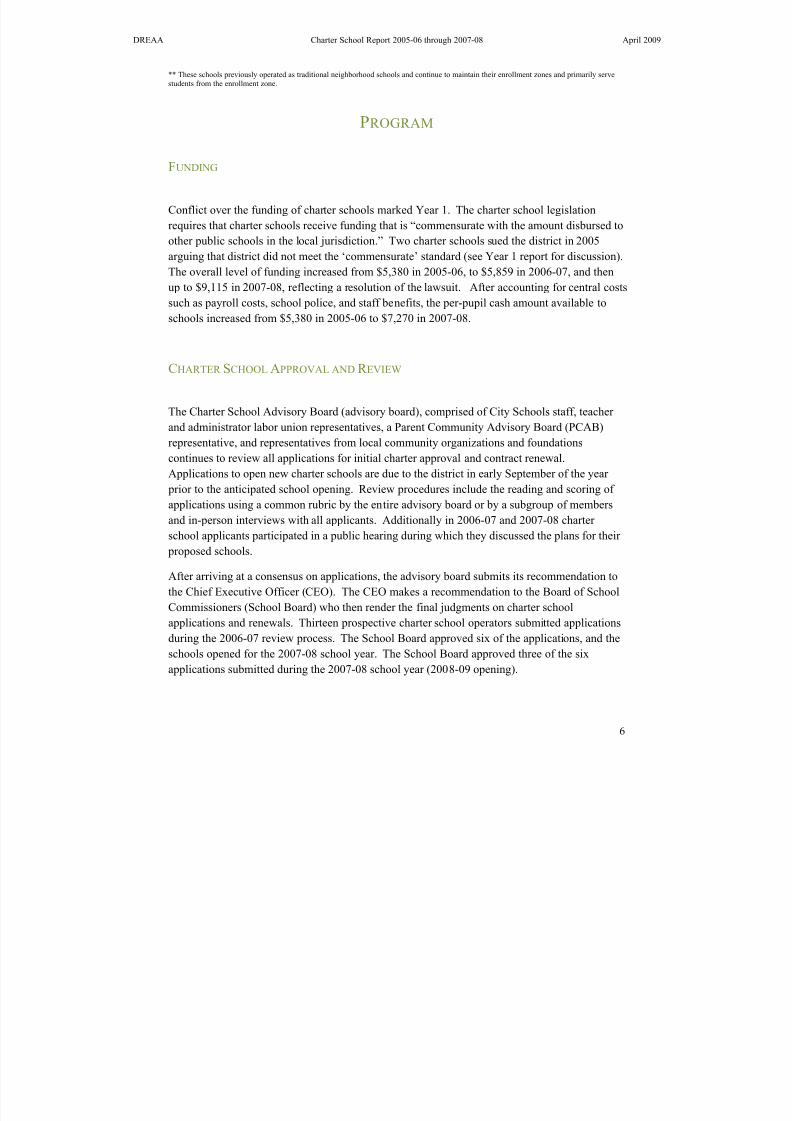
Conflict over the funding of charter schools marked Year 1. The charter school legislation
requires that charter schools receive funding that is “commensurate with the amount disbursed to
other public schools in the local jurisdiction.” Two charter schools sued the district in 2005
arguing that district did not meet the ‘commensurate’ standard (see Year 1 report for discussion).
The overall level of funding increased from $5,380 in 2005-06, to $5,859 in 2006-07, and then
up to $9,115 in 2007-08, reflecting a resolution of the lawsuit. After accounting for central costs
such as payroll costs, school police, and staff benefits, the per-pupil cash amount available to
schools increased from $5,380 in 2005-06 to $7,270 in 2007-08.
CHARTER SCHOOL APPROVAL AND R EVIEW
The Charter School Advisory Board (advisory board), comprised of City Schools staff, teacher
and administrator labor union representatives, a Parent Community Advisory Board (PCAB)
representative, and representatives from local community organizations and foundationscontinues to review all applications for initial charter approval and contract renewal.
Applications to open new charter schools are due to the district in early September of the year
prior to the anticipated school opening. Review procedures include the reading and scoring of
applications using a common rubric by the entire advisory board or by a subgroup of members
and in-person interviews with all applicants. Additionally in 2006-07 and 2007-08 charter
school applicants participated in a public hearing during which they discussed the plans for their
proposed schools.
After arriving at a consensus on applications, the advisory board submits its recommendation to
the Chief Executive Officer (CEO). The CEO makes a recommendation to the Board of SchoolCommissioners (School Board) who then render the final judgments on charter school
applications and renewals. Thirteen prospective charter school operators submitted applications
during the 2006-07 review process. The School Board approved six of the applications, and the
schools opened for the 2007-08 school year. The School Board approved three of the six
applications submitted during the 2007-08 school year (2008-09 opening).
8/14/2019 042009 Year 2 and 3 Charter Report 090416
http://slidepdf.com/reader/full/042009-year-2-and-3-charter-report-090416 15/67
DREAA Charter School Report 2005-06 through 2007-08 April 2009
7
New charter schools continue to receive three-year contracts to open and operate schools. At the
end of the initial contract period, charter school operators may receive a two-year contract
extension, a new contract of five years, or the contract may be terminated by the School Board.
The process of renewing charter school applications is similar to that of the initial approval
process. School operators must first submit a renewal application documenting their accomplishments during the initial two years of the contract and identifying areas for change or
improvement. In addition, DREAA compiled written summaries of school performance in the
areas of student enrollment and retention, student attendance, measures of school climate;
performance on state and standardized assessments, and disciplinary actions for review by the
advisory board. Advisory board members score the applications using a common rubric and
provide recommendations to the CEO who then makes a recommendation to the School Board.
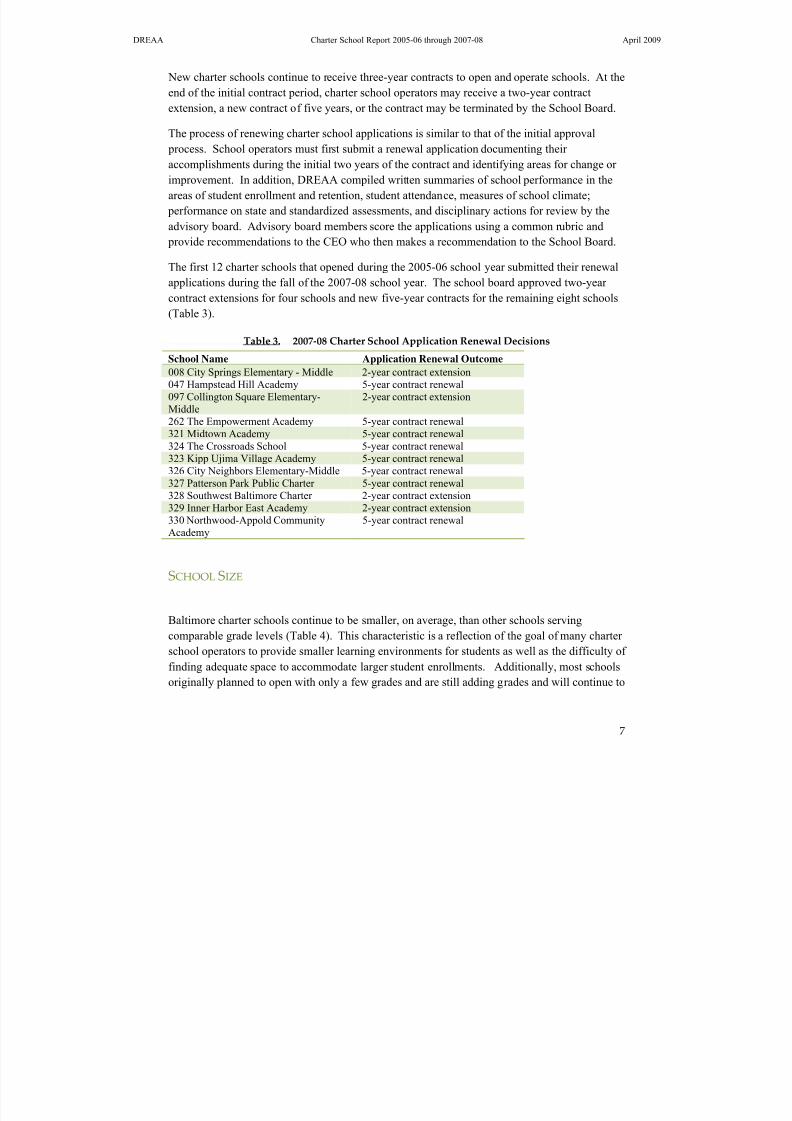
The first 12 charter schools that opened during the 2005-06 school year submitted their renewal
applications during the fall of the 2007-08 school year. The school board approved two-year
contract extensions for four schools and new five-year contracts for the remaining eight schools(Table 3).
Table 3. 2007‐08 Charter School Application Renewal Decisions
School Name Application Renewal Outcome
008 City Springs Elementary - Middle 2-year contract extension047 Hampstead Hill Academy 5-year contract renewal097 Collington Square Elementary-Middle
2-year contract extension
262 The Empowerment Academy 5-year contract renewal321 Midtown Academy 5-year contract renewal
324 The Crossroads School 5-year contract renewal323 Kipp Ujima Village Academy 5-year contract renewal326 City Neighbors Elementary-Middle 5-year contract renewal327 Patterson Park Public Charter 5-year contract renewal328 Southwest Baltimore Charter 2-year contract extension329 Inner Harbor East Academy 2-year contract extension330 Northwood-Appold CommunityAcademy
5-year contract renewal
SCHOOL SIZE
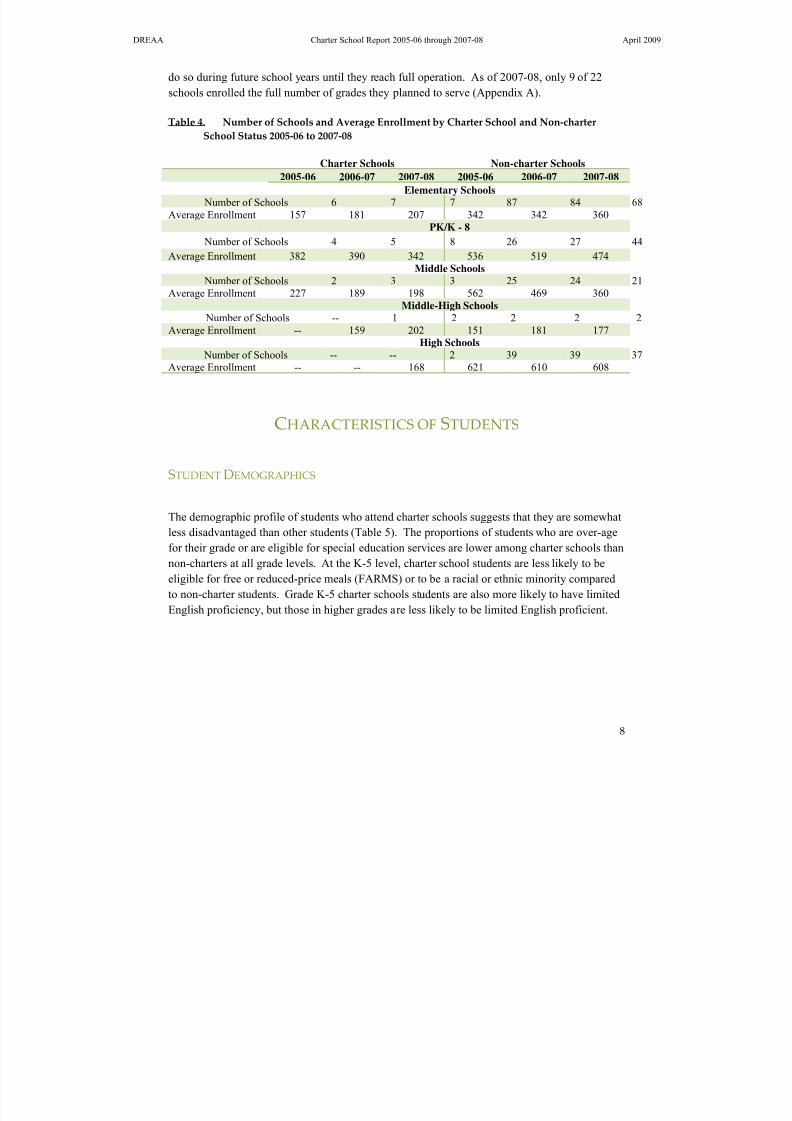
Baltimore charter schools continue to be smaller, on average, than other schools serving
comparable grade levels (Table 4). This characteristic is a reflection of the goal of many charter
school operators to provide smaller learning environments for students as well as the difficulty of
finding adequate space to accommodate larger student enrollments. Additionally, most schools
originally planned to open with only a few grades and are still adding grades and will continue to
8/14/2019 042009 Year 2 and 3 Charter Report 090416
http://slidepdf.com/reader/full/042009-year-2-and-3-charter-report-090416 16/67
DREAA Charter School Report 2005-06 through 2007-08 April 2009
8
do so during future school years until they reach full operation. As of 2007-08, only 9 of 22
schools enrolled the full number of grades they planned to serve (Appendix A).
Table 4. Number of Schools and Average Enrollment by Charter School and Non‐charter
School Status 2005‐06 to 2007‐08
Charter Schools Non-charter Schools
2005-06 2006-07 2007-08 2005-06 2006-07 2007-08
Elementary Schools Number of Schools 6 7 7 87 84 68Average Enrollment 157 181 207 342 342 360
PK/K - 8
Number of Schools 4 5 8 26 27 44
Average Enrollment 382 390 342 536 519 474Middle Schools
Number of Schools 2 3 3 25 24 21
Average Enrollment 227 189 198 562 469 360Middle-High Schools Number of Schools -- 1 2 2 2 2Average Enrollment -- 159 202 151 181 177
High Schools Number of Schools -- -- 2 39 39 37Average Enrollment -- -- 168 621 610 608
CHARACTERISTICS OF STUDENTS
STUDENT DEMOGRAPHICS
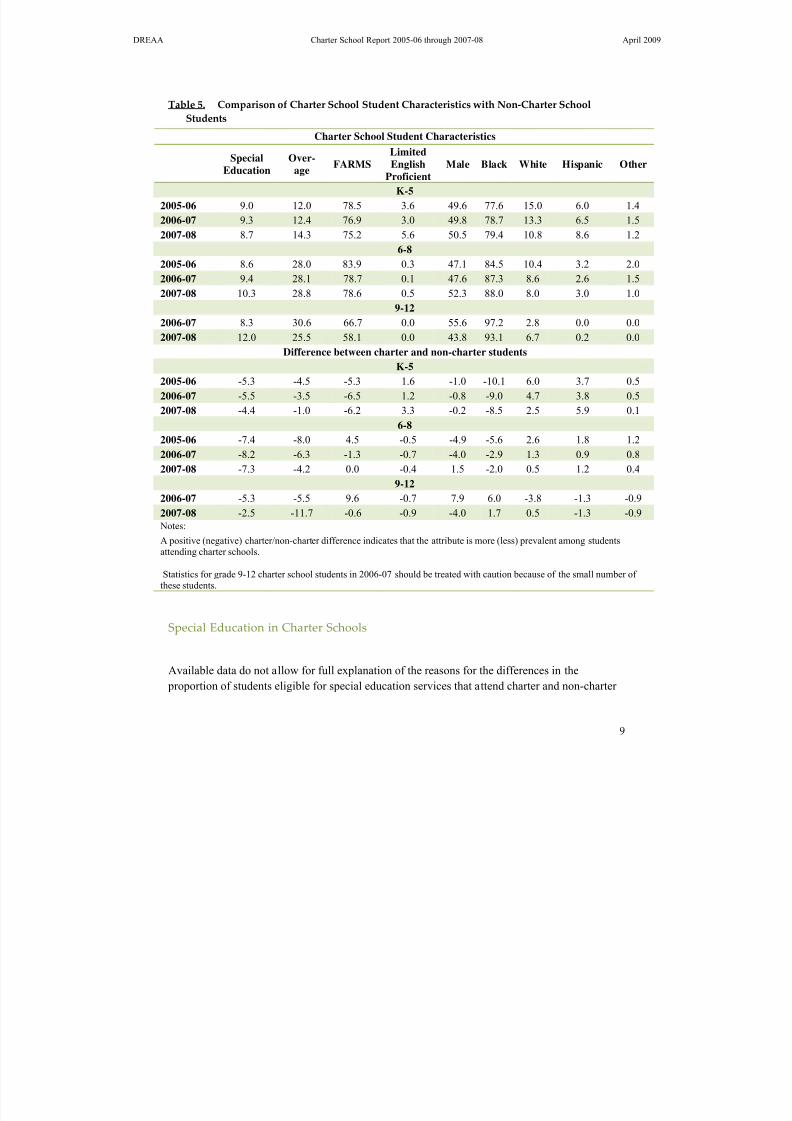
The demographic profile of students who attend charter schools suggests that they are somewhat
less disadvantaged than other students (Table 5). The proportions of students who are over-age
for their grade or are eligible for special education services are lower among charter schools than
non-charters at all grade levels. At the K-5 level, charter school students are less likely to be
eligible for free or reduced-price meals (FARMS) or to be a racial or ethnic minority compared
to non-charter students. Grade K-5 charter schools students are also more likely to have limitedEnglish proficiency, but those in higher grades are less likely to be limited English proficient.
8/14/2019 042009 Year 2 and 3 Charter Report 090416
http://slidepdf.com/reader/full/042009-year-2-and-3-charter-report-090416 17/67
DREAA Charter School Report 2005-06 through 2007-08 April 2009
9
Table 5. Comparison of Charter School Student Characteristics with Non‐Charter School
Students
Charter School Student Characteristics
SpecialEducation
Over-age
FARMSLimitedEnglish
ProficientMale Black White Hispanic Other
K-5
2005-06 9.0 12.0 78.5 3.6 49.6 77.6 15.0 6.0 1.4
2006-07 9.3 12.4 76.9 3.0 49.8 78.7 13.3 6.5 1.5
2007-08 8.7 14.3 75.2 5.6 50.5 79.4 10.8 8.6 1.2
6-8
2005-06 8.6 28.0 83.9 0.3 47.1 84.5 10.4 3.2 2.0
2006-07 9.4 28.1 78.7 0.1 47.6 87.3 8.6 2.6 1.5
2007-08 10.3 28.8 78.6 0.5 52.3 88.0 8.0 3.0 1.09-12
2006-07 8.3 30.6 66.7 0.0 55.6 97.2 2.8 0.0 0.0
2007-08 12.0 25.5 58.1 0.0 43.8 93.1 6.7 0.2 0.0
Difference between charter and non-charter students
K-5
2005-06 -5.3 -4.5 -5.3 1.6 -1.0 -10.1 6.0 3.7 0.5
2006-07 -5.5 -3.5 -6.5 1.2 -0.8 -9.0 4.7 3.8 0.5
2007-08 -4.4 -1.0 -6.2 3.3 -0.2 -8.5 2.5 5.9 0.1
6-8
2005-06 -7.4 -8.0 4.5 -0.5 -4.9 -5.6 2.6 1.8 1.2
2006-07 -8.2 -6.3 -1.3 -0.7 -4.0 -2.9 1.3 0.9 0.8
2007-08 -7.3 -4.2 0.0 -0.4 1.5 -2.0 0.5 1.2 0.4
9-12
2006-07 -5.3 -5.5 9.6 -0.7 7.9 6.0 -3.8 -1.3 -0.9
2007-08 -2.5 -11.7 -0.6 -0.9 -4.0 1.7 0.5 -1.3 -0.9
Notes:
A positive (negative) charter/non-charter difference indicates that the attribute is more (less) prevalent among studentsattending charter schools.
Statistics for grade 9-12 charter school students in 2006-07 should be treated with caution because of the small number of these students.
Special Education in Charter Schools
Available data do not allow for full explanation of the reasons for the differences in the
proportion of students eligible for special education services that attend charter and non-charter
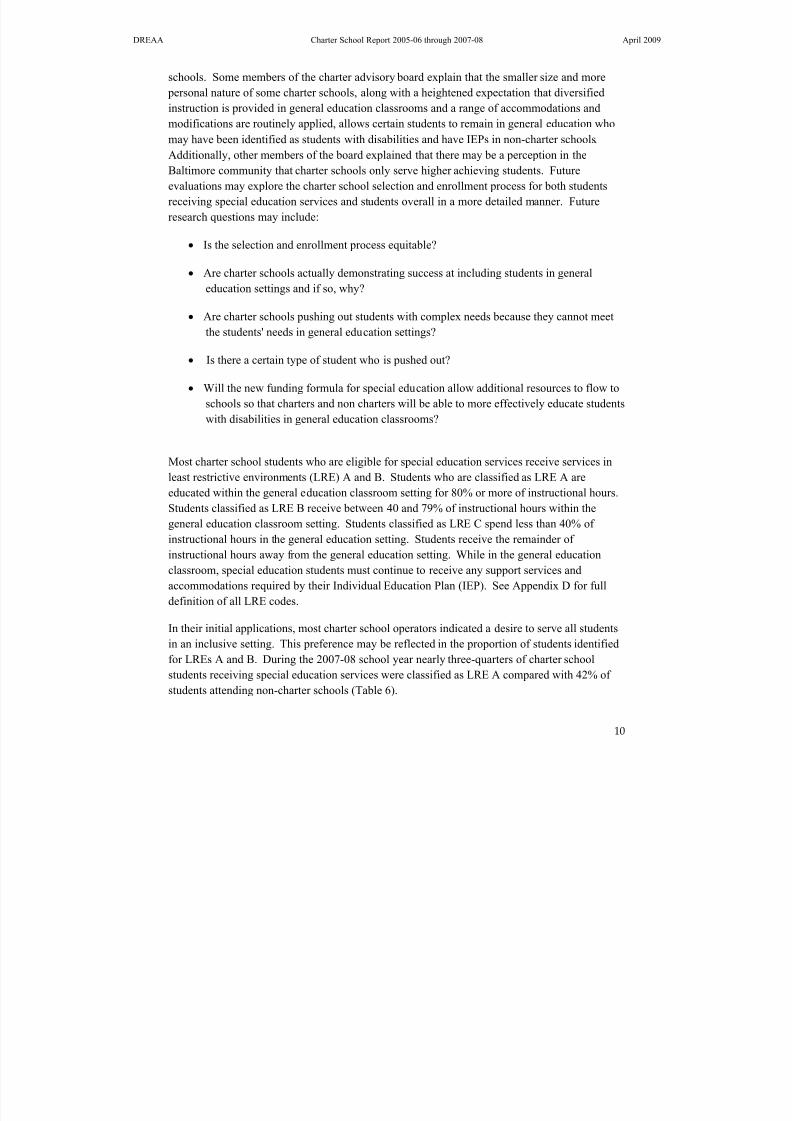
8/14/2019 042009 Year 2 and 3 Charter Report 090416
http://slidepdf.com/reader/full/042009-year-2-and-3-charter-report-090416 18/67
DREAA Charter School Report 2005-06 through 2007-08 April 2009
10
schools. Some members of the charter advisory board explain that the smaller size and more
personal nature of some charter schools, along with a heightened expectation that diversified
instruction is provided in general education classrooms and a range of accommodations and
modifications are routinely applied, allows certain students to remain in general education who
may have been identified as students with disabilities and have IEPs in non-charter schools.
Additionally, other members of the board explained that there may be a perception in the
Baltimore community that charter schools only serve higher achieving students. Future
evaluations may explore the charter school selection and enrollment process for both students
receiving special education services and students overall in a more detailed manner. Future
research questions may include:
• Is the selection and enrollment process equitable?
• Are charter schools actually demonstrating success at including students in general
education settings and if so, why?
• Are charter schools pushing out students with complex needs because they cannot meet
the students' needs in general education settings?
• Is there a certain type of student who is pushed out?
• Will the new funding formula for special education allow additional resources to flow to
schools so that charters and non charters will be able to more effectively educate students
with disabilities in general education classrooms?
Most charter school students who are eligible for special education services receive services in
least restrictive environments (LRE) A and B. Students who are classified as LRE A are
educated within the general education classroom setting for 80% or more of instructional hours.
Students classified as LRE B receive between 40 and 79% of instructional hours within the
general education classroom setting. Students classified as LRE C spend less than 40% of
instructional hours in the general education setting. Students receive the remainder of
instructional hours away from the general education setting. While in the general education
classroom, special education students must continue to receive any support services and
accommodations required by their Individual Education Plan (IEP). See Appendix D for full
definition of all LRE codes.
In their initial applications, most charter school operators indicated a desire to serve all students
in an inclusive setting. This preference may be reflected in the proportion of students identified
for LREs A and B. During the 2007-08 school year nearly three-quarters of charter school
students receiving special education services were classified as LRE A compared with 42% of
students attending non-charter schools (Table 6).
8/14/2019 042009 Year 2 and 3 Charter Report 090416
http://slidepdf.com/reader/full/042009-year-2-and-3-charter-report-090416 19/67
DREAA Charter School Report 2005-06 through 2007-08 April 2009
11
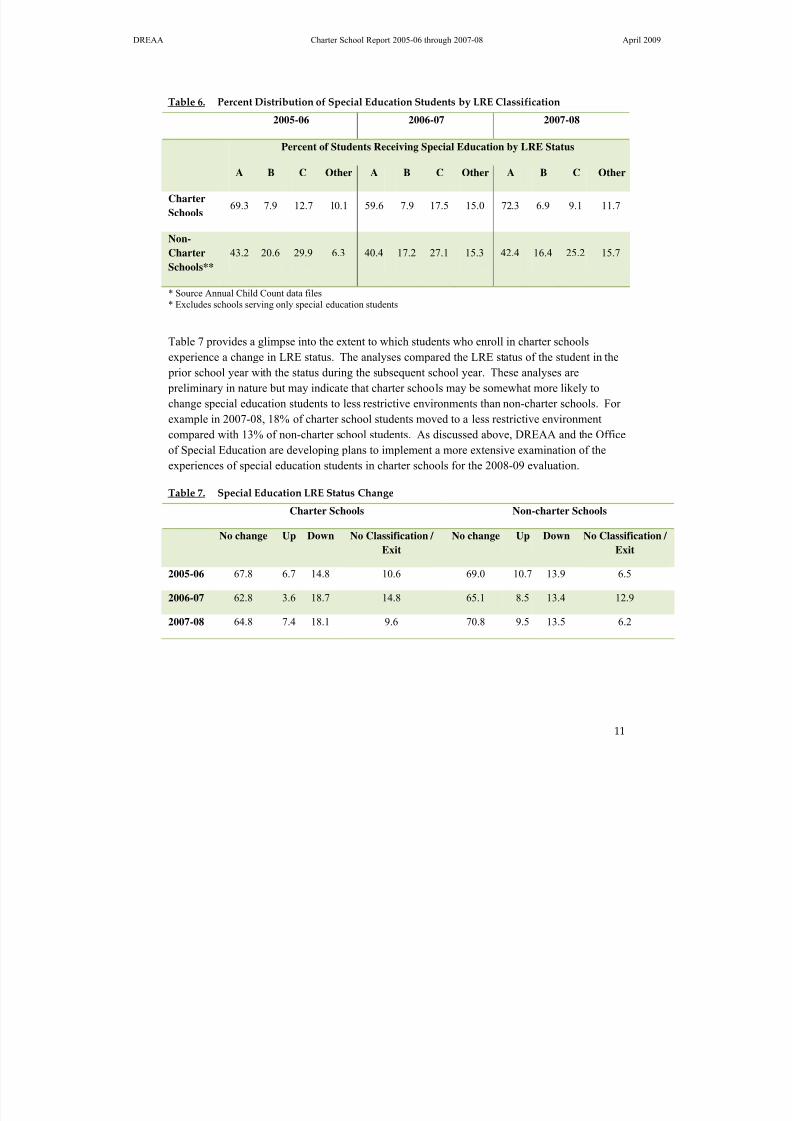
Table 6. Percent Distribution of Special Education Students by LRE Classification
2005-06 2006-07 2007-08
Percent of Students Receiving Special Education by LRE Status
A B C Other A B C Other A B C Other
Charter
Schools69.3 7.9 12.7 10.1 59.6 7.9 17.5 15.0 72.3 6.9 9.1 11.7
Non-
Charter
Schools**
43.2 20.6 29.9 6.3 40.4 17.2 27.1 15.3 42.4 16.4 25.2 15.7
* Source Annual Child Count data files* Excludes schools serving only special education students
Table 7 provides a glimpse into the extent to which students who enroll in charter schools
experience a change in LRE status. The analyses compared the LRE status of the student in the
prior school year with the status during the subsequent school year. These analyses are
preliminary in nature but may indicate that charter schools may be somewhat more likely to
change special education students to less restrictive environments than non-charter schools. For
example in 2007-08, 18% of charter school students moved to a less restrictive environment
compared with 13% of non-charter school students. As discussed above, DREAA and the Office
of Special Education are developing plans to implement a more extensive examination of theexperiences of special education students in charter schools for the 2008-09 evaluation.
Table 7. Special Education LRE Status Change
Charter Schools Non-charter Schools
No change Up Down No Classification /
Exit
No change Up Down No Classification
Exit
2005-06 67.8 6.7 14.8 10.6 69.0 10.7 13.9 6.5
2006-07 62.8 3.6 18.7 14.8 65.1 8.5 13.4 12.9
2007-08 64.8 7.4 18.1 9.6 70.8 9.5 13.5 6.2
8/14/2019 042009 Year 2 and 3 Charter Report 090416
http://slidepdf.com/reader/full/042009-year-2-and-3-charter-report-090416 20/67
DREAA Charter School Report 2005-06 through 2007-08 April 2009
12
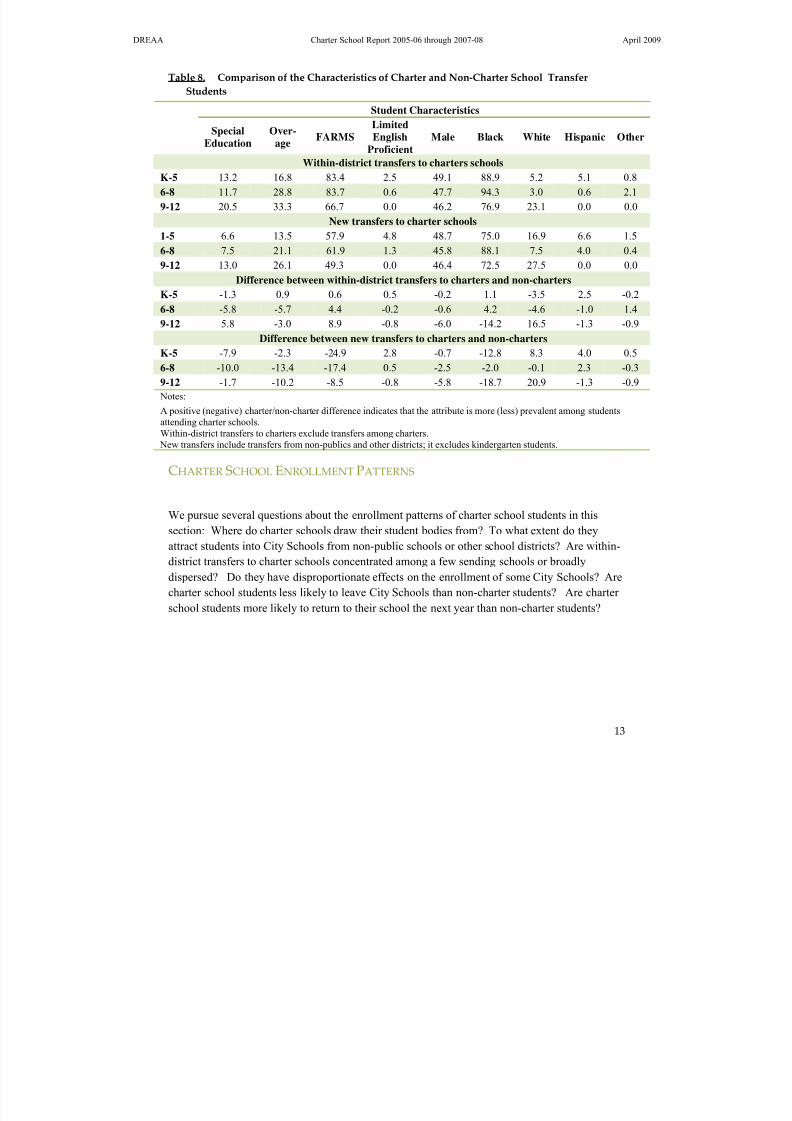
CHARACTERISTICS OF STUDENTS TRANSFERRING TO CHARTER SCHOOLS
If charter schools are attracting a more advantaged student population than non-charter schools, a
key question is whether charter schools are drawing these students into City Schools for the first
time or whether they are attracting them away from other City Schools. Some evidence on this
question is furnished in Table 8, which shows the demographic characteristics of students
transferring into charter schools, broken down by whether they transferred from another City
school (within district transfers) or were new to City Schools (new transfers). Results vary by
grade level, but students transferring to charters from other City Schools generally tend to be
more representative of the non-charter student population than new students entering a City
School for the first time.
At the K-5 level, within-district transfers to charter schools are virtually indistinguishable from
non-charter students, but new transfers are less likely to be a racial or ethnic minority, to be
FARMS eligible, or to require special education services.
At the middle school level, both types of transfers to charter schools are less likely to be over-age
for their grade or to require special education services than non-charter students. However, the
gaps between charter and non-charter students on these features are roughly twice as large for
new transfers as they are for within-district transfers. For example, 17.5% of grade 6-8 non-
charter students required special education services. This compares to 11.7% for grade 6-8
students who transferred from another City School to a charter and 7.5% for new transfers to
charter schools. Thus, the charter/non-charter “gap” for special education is 5.7 percentage
points for within-district transfers and 10 percentage points for new transfers. Also at the middleschool level, within-district transfers to charter schools are more likely to be FARMs-eligible and
minority than non-charter students. By contrast, new transfers are less likely to be FARMs-
eligible and are equally likely to be a minority.
The same pattern appears among high school transfers to charter schools. Compared to non-
charter students, within-district transfers are more likely to require special education services and
to be FARMS-eligible, while new transfers are less likely require special education services or to
be FARMS-eligible. Both types of transfers to charter schools are less likely to be over-age for
their grade and to be minority than non-charter students, but the differences are greater for new
transfer students.
8/14/2019 042009 Year 2 and 3 Charter Report 090416
http://slidepdf.com/reader/full/042009-year-2-and-3-charter-report-090416 21/67
DREAA Charter School Report 2005-06 through 2007-08 April 2009
13
Table 8. Comparison of the Characteristics of Charter and Non‐Charter School Transfer
Students
Student Characteristics
SpecialEducation
Over-age
FARMSLimitedEnglish
Proficient
Male Black White Hispanic Other
Within-district transfers to charters schools
K-5 13.2 16.8 83.4 2.5 49.1 88.9 5.2 5.1 0.8
6-8 11.7 28.8 83.7 0.6 47.7 94.3 3.0 0.6 2.1
9-12 20.5 33.3 66.7 0.0 46.2 76.9 23.1 0.0 0.0
New transfers to charter schools
1-5 6.6 13.5 57.9 4.8 48.7 75.0 16.9 6.6 1.5
6-8 7.5 21.1 61.9 1.3 45.8 88.1 7.5 4.0 0.4
9-12 13.0 26.1 49.3 0.0 46.4 72.5 27.5 0.0 0.0
Difference between within-district transfers to charters and non-charters
K-5 -1.3 0.9 0.6 0.5 -0.2 1.1 -3.5 2.5 -0.26-8 -5.8 -5.7 4.4 -0.2 -0.6 4.2 -4.6 -1.0 1.4
9-12 5.8 -3.0 8.9 -0.8 -6.0 -14.2 16.5 -1.3 -0.9
Difference between new transfers to charters and non-charters
K-5 -7.9 -2.3 -24.9 2.8 -0.7 -12.8 8.3 4.0 0.5
6-8 -10.0 -13.4 -17.4 0.5 -2.5 -2.0 -0.1 2.3 -0.3
9-12 -1.7 -10.2 -8.5 -0.8 -5.8 -18.7 20.9 -1.3 -0.9
Notes:
A positive (negative) charter/non-charter difference indicates that the attribute is more (less) prevalent among studentsattending charter schools.Within-district transfers to charters exclude transfers among charters.
New transfers include transfers from non-publics and other districts; it excludes kindergarten students.
CHARTER SCHOOL ENROLLMENT PATTERNS
We pursue several questions about the enrollment patterns of charter school students in this
section: Where do charter schools draw their student bodies from? To what extent do they
attract students into City Schools from non-public schools or other school districts? Are within-
district transfers to charter schools concentrated among a few sending schools or broadly
dispersed? Do they have disproportionate effects on the enrollment of some City Schools? Are
charter school students less likely to leave City Schools than non-charter students? Are charter school students more likely to return to their school the next year than non-charter students?
8/14/2019 042009 Year 2 and 3 Charter Report 090416
http://slidepdf.com/reader/full/042009-year-2-and-3-charter-report-090416 22/67
DREAA Charter School Report 2005-06 through 2007-08 April 2009
14
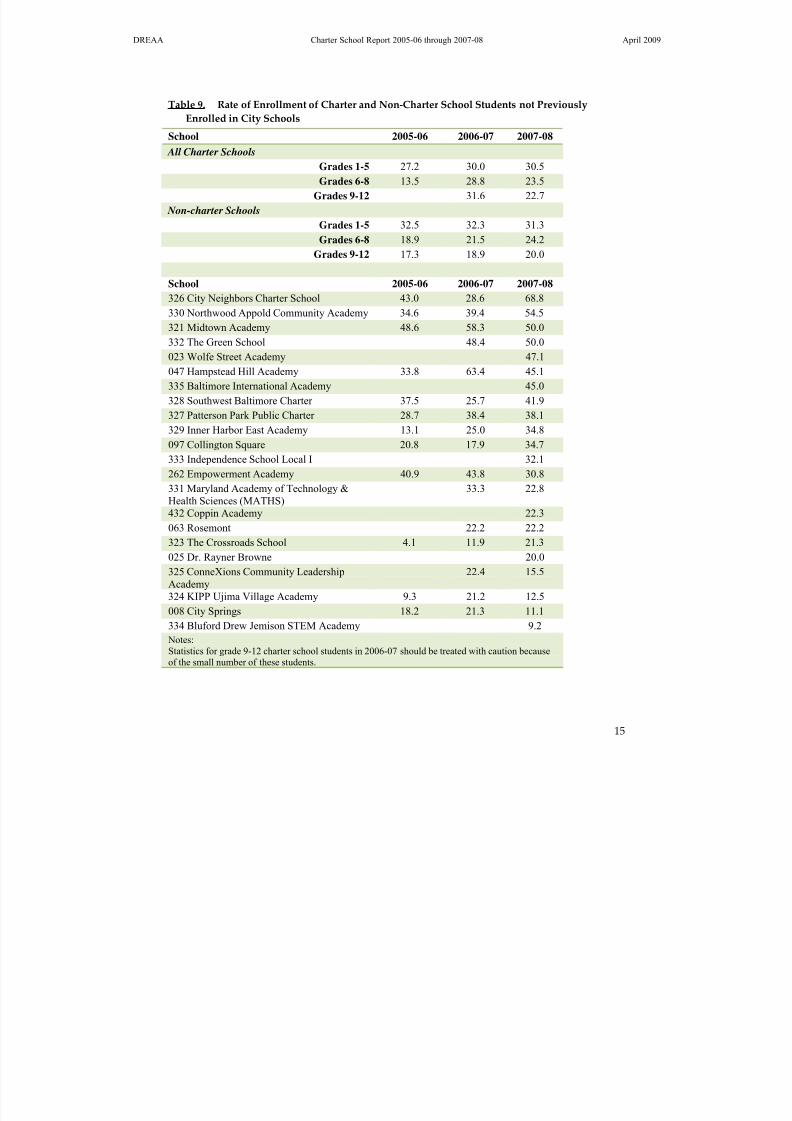
Are Charter Schools Attracting Students Into City Schools?
The proportion of students new to City Schools (excluding kindergarteners) provides anindication of whether charter schools are attracting new students into the district (Table 9).
3
Overall, charter schools as a group do not appear to be attracting a higher proportion of new
entrants into City Schools than non-charter schools. In both types of schools, new entrants to
City Schools comprise about 30% of transfers to grades 1-5 and 20-25% of transfers to grades 6-
12 (Table 8). Beneath these aggregate numbers, however, there is considerable variation among
schools. Seven charter schools consistently draw more than 40% of their transferring students
from outside City Schools (Wolfe Street Academy, Hampstead Hill Academy, Midtown
Academy, City Neighbors Charter School, Northwood Appold Community Academy, The Green
School, and Baltimore International Academy). Others draw 80% or more of their transferring
students from other City Schools, including City Springs, The Crossroads Schools, KIPP Ujima
Village Academy, ConneXions Community Leadership Academy, and Bluford Drew Jemison
Academy.
3 Kindergarteners are excluded because many are not enrolled in a previous educational setting and
consequently the proportion newly enrolled in City Schools does not accurately reflect a parental choice
to switch from nonpublic or another district into City Schools.
8/14/2019 042009 Year 2 and 3 Charter Report 090416
http://slidepdf.com/reader/full/042009-year-2-and-3-charter-report-090416 23/67
DREAA Charter School Report 2005-06 through 2007-08 April 2009
15
Table 9. Rate of Enrollment of Charter and Non‐Charter School Students not Previously
Enrolled in City Schools
School 2005-06 2006-07 2007-08
All Charter Schools
Grades 1-5 27.2 30.0 30.5
Grades 6-8 13.5 28.8 23.5
Grades 9-12 31.6 22.7
Non-charter Schools
Grades 1-5 32.5 32.3 31.3
Grades 6-8 18.9 21.5 24.2
Grades 9-12 17.3 18.9 20.0
School 2005-06 2006-07 2007-08
326 City Neighbors Charter School 43.0 28.6 68.8330 Northwood Appold Community Academy 34.6 39.4 54.5
321 Midtown Academy 48.6 58.3 50.0
332 The Green School 48.4 50.0
023 Wolfe Street Academy 47.1
047 Hampstead Hill Academy 33.8 63.4 45.1
335 Baltimore International Academy 45.0
328 Southwest Baltimore Charter 37.5 25.7 41.9
327 Patterson Park Public Charter 28.7 38.4 38.1
329 Inner Harbor East Academy 13.1 25.0 34.8
097 Collington Square 20.8 17.9 34.7333 Independence School Local I 32.1
262 Empowerment Academy 40.9 43.8 30.8
331 Maryland Academy of Technology &Health Sciences (MATHS)
33.3 22.8
432 Coppin Academy 22.3
063 Rosemont 22.2 22.2
323 The Crossroads School 4.1 11.9 21.3
025 Dr. Rayner Browne 20.0
325 ConneXions Community LeadershipAcademy
22.4 15.5
324 KIPP Ujima Village Academy 9.3 21.2 12.5008 City Springs 18.2 21.3 11.1
334 Bluford Drew Jemison STEM Academy 9.2
Notes:Statistics for grade 9-12 charter school students in 2006-07 should be treated with caution becauseof the small number of these students.
8/14/2019 042009 Year 2 and 3 Charter Report 090416
http://slidepdf.com/reader/full/042009-year-2-and-3-charter-report-090416 24/67
DREAA Charter School Report 2005-06 through 2007-08 April 2009
16
Are Enrollments of Some Non‐charter Schools Disproportionately Affected by
Charter Schools?
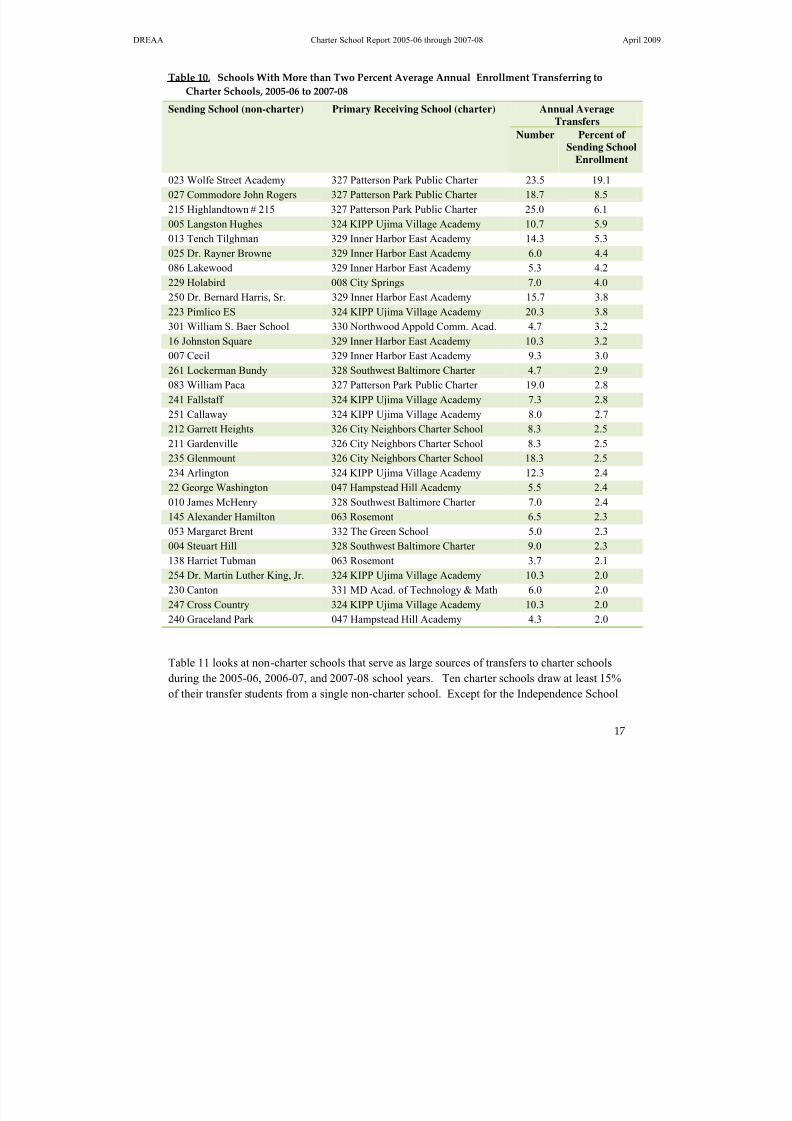
To address the question of whether charter schools are disproportionately affecting enrollments
at some schools, Table 10 lists all schools that have lost an annual average of at least 2% of their
enrollment to charter schools. Interestingly, two of the schools that have lost some of the largest
shares of students to charter schools during the 2005-06, 2006-07 school years – Wolfe Street
Academy and Dr. Rayner Browne – subsequently became charter schools themselves in 2007-08.
Transfers from non-charter schools to charter schools appear to be largely geographically based.
Patterson Park Public Charter has drawn heavily from schools surrounding Patterson Park. The
Inner Harbor East Academy draws students from a swath extending from the school site in the
Pleasant View Gardens complex at Orleans Street north to Cecil (school #7), just above North
Avenue, including Tench Tilghman Elementary, Johnston Square Elementary, and Dr. Bernhard
Harris, Sr. Elementary. KIPP Ujima Village Academy has attracted students from several
schools in the northwest: Langston Hughes Elementary, Pimlico Elementary, Falstaff
Elementary, Callaway Elementary, and Arlington Elementary. In the northeast, City Neighbors
has drawn students from Garrett Heights Elementary, Gardenville Elementary, and Glenmount
Elementary.
8/14/2019 042009 Year 2 and 3 Charter Report 090416
http://slidepdf.com/reader/full/042009-year-2-and-3-charter-report-090416 25/67
DREAA Charter School Report 2005-06 through 2007-08 April 2009
17
Table 10. Schools With More than Two Percent Average Annual Enrollment Transferring to
Charter Schools, 2005‐06 to 2007‐08
Annual Average
Transfers
Sending School (non-charter) Primary Receiving School (charter)
Number Percent of
Sending SchoolEnrollment
023 Wolfe Street Academy 327 Patterson Park Public Charter 23.5 19.1
027 Commodore John Rogers 327 Patterson Park Public Charter 18.7 8.5
215 Highlandtown # 215 327 Patterson Park Public Charter 25.0 6.1
005 Langston Hughes 324 KIPP Ujima Village Academy 10.7 5.9
013 Tench Tilghman 329 Inner Harbor East Academy 14.3 5.3
025 Dr. Rayner Browne 329 Inner Harbor East Academy 6.0 4.4
086 Lakewood 329 Inner Harbor East Academy 5.3 4.2
229 Holabird 008 City Springs 7.0 4.0
250 Dr. Bernard Harris, Sr. 329 Inner Harbor East Academy 15.7 3.8223 Pimlico ES 324 KIPP Ujima Village Academy 20.3 3.8
301 William S. Baer School 330 Northwood Appold Comm. Acad. 4.7 3.2
16 Johnston Square 329 Inner Harbor East Academy 10.3 3.2
007 Cecil 329 Inner Harbor East Academy 9.3 3.0
261 Lockerman Bundy 328 Southwest Baltimore Charter 4.7 2.9
083 William Paca 327 Patterson Park Public Charter 19.0 2.8
241 Fallstaff 324 KIPP Ujima Village Academy 7.3 2.8
251 Callaway 324 KIPP Ujima Village Academy 8.0 2.7
212 Garrett Heights 326 City Neighbors Charter School 8.3 2.5
211 Gardenville 326 City Neighbors Charter School 8.3 2.5235 Glenmount 326 City Neighbors Charter School 18.3 2.5
234 Arlington 324 KIPP Ujima Village Academy 12.3 2.4
22 George Washington 047 Hampstead Hill Academy 5.5 2.4
010 James McHenry 328 Southwest Baltimore Charter 7.0 2.4
145 Alexander Hamilton 063 Rosemont 6.5 2.3
053 Margaret Brent 332 The Green School 5.0 2.3
004 Steuart Hill 328 Southwest Baltimore Charter 9.0 2.3
138 Harriet Tubman 063 Rosemont 3.7 2.1
254 Dr. Martin Luther King, Jr. 324 KIPP Ujima Village Academy 10.3 2.0
230 Canton 331 MD Acad. of Technology & Math 6.0 2.0
247 Cross Country 324 KIPP Ujima Village Academy 10.3 2.0
240 Graceland Park 047 Hampstead Hill Academy 4.3 2.0
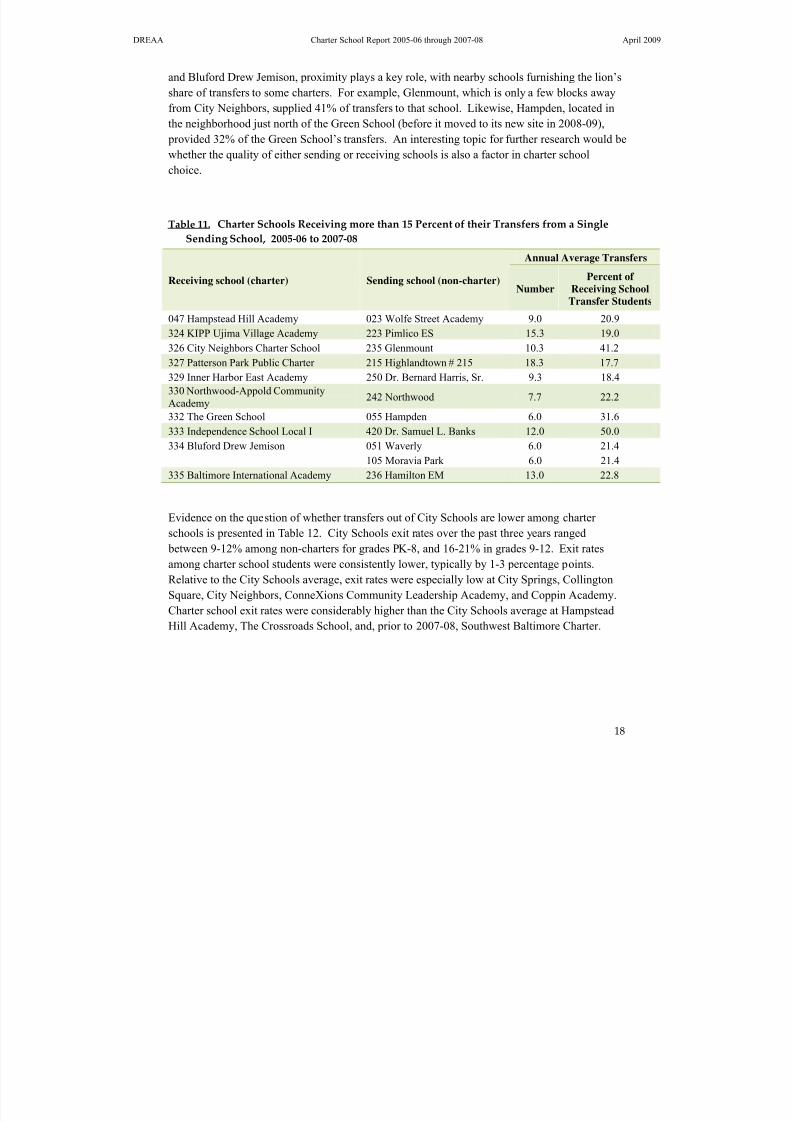
Table 11 looks at non-charter schools that serve as large sources of transfers to charter schools
during the 2005-06, 2006-07, and 2007-08 school years. Ten charter schools draw at least 15%
of their transfer students from a single non-charter school. Except for the Independence School
8/14/2019 042009 Year 2 and 3 Charter Report 090416
http://slidepdf.com/reader/full/042009-year-2-and-3-charter-report-090416 26/67
DREAA Charter School Report 2005-06 through 2007-08 April 2009
18
and Bluford Drew Jemison, proximity plays a key role, with nearby schools furnishing the lion’s
share of transfers to some charters. For example, Glenmount, which is only a few blocks away
from City Neighbors, supplied 41% of transfers to that school. Likewise, Hampden, located in
the neighborhood just north of the Green School (before it moved to its new site in 2008-09),
provided 32% of the Green School’s transfers. An interesting topic for further research would be
whether the quality of either sending or receiving schools is also a factor in charter school
choice.
Table 11. Charter Schools Receiving more than 15 Percent of their Transfers from a Single
Sending School, 2005‐06 to 2007‐08
Annual Average Transfers
Receiving school (charter) Sending school (non-charter)Number
Percent of Receiving School
Transfer Students
047 Hampstead Hill Academy 023 Wolfe Street Academy 9.0 20.9
324 KIPP Ujima Village Academy 223 Pimlico ES 15.3 19.0
326 City Neighbors Charter School 235 Glenmount 10.3 41.2
327 Patterson Park Public Charter 215 Highlandtown # 215 18.3 17.7
329 Inner Harbor East Academy 250 Dr. Bernard Harris, Sr. 9.3 18.4
330 Northwood-Appold CommunityAcademy
242 Northwood 7.7 22.2
332 The Green School 055 Hampden 6.0 31.6
333 Independence School Local I 420 Dr. Samuel L. Banks 12.0 50.0
334 Bluford Drew Jemison 051 Waverly 6.0 21.4105 Moravia Park 6.0 21.4
335 Baltimore International Academy 236 Hamilton EM 13.0 22.8
Evidence on the question of whether transfers out of City Schools are lower among charter
schools is presented in Table 12. City Schools exit rates over the past three years ranged
between 9-12% among non-charters for grades PK-8, and 16-21% in grades 9-12. Exit rates
among charter school students were consistently lower, typically by 1-3 percentage points.
Relative to the City Schools average, exit rates were especially low at City Springs, Collington
Square, City Neighbors, ConneXions Community Leadership Academy, and Coppin Academy.Charter school exit rates were considerably higher than the City Schools average at Hampstead
Hill Academy, The Crossroads School, and, prior to 2007-08, Southwest Baltimore Charter.
8/14/2019 042009 Year 2 and 3 Charter Report 090416
http://slidepdf.com/reader/full/042009-year-2-and-3-charter-report-090416 27/67
DREAA Charter School Report 2005-06 through 2007-08 April 2009
19
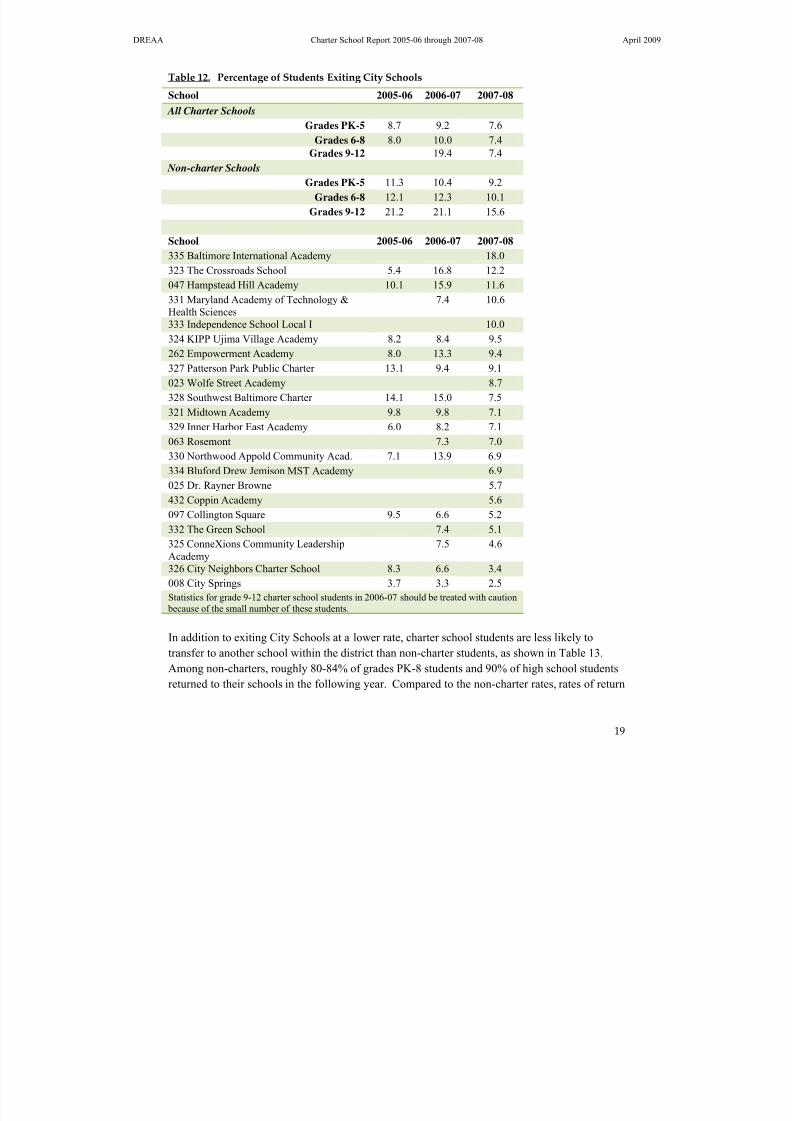
Table 12. Percentage of Students Exiting City Schools
School 2005-06 2006-07 2007-08
All Charter Schools
Grades PK-5 8.7 9.2 7.6
Grades 6-8 8.0 10.0 7.4
Grades 9-12 19.4 7.4
Non-charter Schools
Grades PK-5 11.3 10.4 9.2
Grades 6-8 12.1 12.3 10.1
Grades 9-12 21.2 21.1 15.6
School 2005-06 2006-07 2007-08
335 Baltimore International Academy 18.0
323 The Crossroads School 5.4 16.8 12.2
047 Hampstead Hill Academy 10.1 15.9 11.6
331 Maryland Academy of Technology &Health Sciences
7.4 10.6
333 Independence School Local I 10.0
324 KIPP Ujima Village Academy 8.2 8.4 9.5
262 Empowerment Academy 8.0 13.3 9.4
327 Patterson Park Public Charter 13.1 9.4 9.1
023 Wolfe Street Academy 8.7
328 Southwest Baltimore Charter 14.1 15.0 7.5
321 Midtown Academy 9.8 9.8 7.1
329 Inner Harbor East Academy 6.0 8.2 7.1
063 Rosemont 7.3 7.0330 Northwood Appold Community Acad. 7.1 13.9 6.9
334 Bluford Drew Jemison MST Academy 6.9
025 Dr. Rayner Browne 5.7
432 Coppin Academy 5.6
097 Collington Square 9.5 6.6 5.2
332 The Green School 7.4 5.1
325 ConneXions Community LeadershipAcademy
7.5 4.6
326 City Neighbors Charter School 8.3 6.6 3.4
008 City Springs 3.7 3.3 2.5
Statistics for grade 9-12 charter school students in 2006-07 should be treated with caution because of the small number of these students.
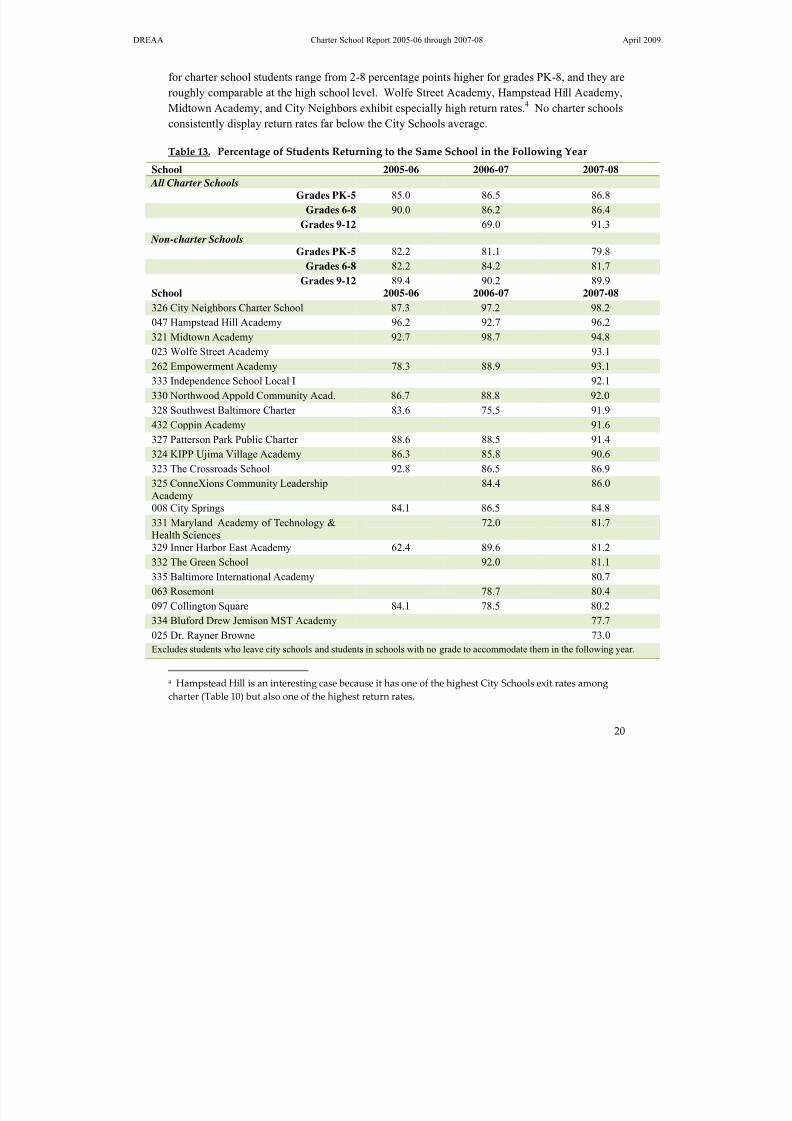
In addition to exiting City Schools at a lower rate, charter school students are less likely to
transfer to another school within the district than non-charter students, as shown in Table 13.
Among non-charters, roughly 80-84% of grades PK-8 students and 90% of high school students
returned to their schools in the following year. Compared to the non-charter rates, rates of return
8/14/2019 042009 Year 2 and 3 Charter Report 090416
http://slidepdf.com/reader/full/042009-year-2-and-3-charter-report-090416 28/67
DREAA Charter School Report 2005-06 through 2007-08 April 2009
20
for charter school students range from 2-8 percentage points higher for grades PK-8, and they are
roughly comparable at the high school level. Wolfe Street Academy, Hampstead Hill Academy,
Midtown Academy, and City Neighbors exhibit especially high return rates.4 No charter schools
consistently display return rates far below the City Schools average.
Table 13. Percentage
of Students
Returning
to
the
Same
School
in
the
Following
Year
School 2005-06 2006-07 2007-08
All Charter Schools
Grades PK-5 85.0 86.5 86.8
Grades 6-8 90.0 86.2 86.4
Grades 9-12 69.0 91.3
Non-charter Schools
Grades PK-5 82.2 81.1 79.8
Grades 6-8 82.2 84.2 81.7
Grades 9-12 89.4 90.2 89.9
School 2005-06 2006-07 2007-08326 City Neighbors Charter School 87.3 97.2 98.2
047 Hampstead Hill Academy 96.2 92.7 96.2
321 Midtown Academy 92.7 98.7 94.8
023 Wolfe Street Academy 93.1
262 Empowerment Academy 78.3 88.9 93.1
333 Independence School Local I 92.1
330 Northwood Appold Community Acad. 86.7 88.8 92.0
328 Southwest Baltimore Charter 83.6 75.5 91.9
432 Coppin Academy 91.6
327 Patterson Park Public Charter 88.6 88.5 91.4
324 KIPP Ujima Village Academy 86.3 85.8 90.6
323 The Crossroads School 92.8 86.5 86.9
325 ConneXions Community LeadershipAcademy
84.4 86.0
008 City Springs 84.1 86.5 84.8
331 Maryland Academy of Technology &Health Sciences
72.0 81.7
329 Inner Harbor East Academy 62.4 89.6 81.2
332 The Green School 92.0 81.1
335 Baltimore International Academy 80.7
063 Rosemont 78.7 80.4097 Collington Square 84.1 78.5 80.2
334 Bluford Drew Jemison MST Academy 77.7
025 Dr. Rayner Browne 73.0
Excludes students who leave city schools and students in schools with no grade to accommodate them in the following year.
4 Hampstead Hill is an interesting case because it has one of the highest City Schools exit rates among
charter (Table 10) but also one of the highest return rates.

8/14/2019 042009 Year 2 and 3 Charter Report 090416
http://slidepdf.com/reader/full/042009-year-2-and-3-charter-report-090416 29/67
DREAA Charter School Report 2005-06 through 2007-08 April 2009
21
School 2005-06 2006-07 2007-08Statistics for grade 9-12 charter school students in 2006-07 should be treated with caution due to the small number of students.
Are Students Who Leave Charter Schools Different From Those Who Stay?
Table 14 provides information on the extent to which students who leave charter schools have
different demographic characteristics (leavers) than those student who remain enrolled (stayers).
Analyses reveal that students who leave charter schools are 1-2 percentage points slightly more
likely to require special education services than those who stay. For example, 11.7% of students
who left charters required special education, compared to 10.1% who stay. At the elementary
grade level, leavers are marginally more likely to be over-age for their grade, male, and minority.
At the middle and high school levels, the proportion of over-age students is much higher among
leavers than stayers. Leavers are also more likely to be boys. Leavers and stayers are similar in
terms of FARMS-eligibility and race/ethnicity at the middle and high-school levels.
As with explaining differences in student demographic data, no contextual data exists which
explains differences in the characteristics of students who leave and remain in charter schools.
In 2008-09, DREAA may administer an exit survey to the families of all students who
transferred from charter schools. Such information may yield a better understanding of why
students leave charter schools.
Table 14. Demographics of Charter School Students by Leaver Status (%)
2005‐06 through 2007‐08 School Years
Student CharacteristicsPercent of Students
Race/ethnicity
Spec.Ed
Over-age FARMs LEP Male Black White Hispanic Other
K-5
Leavers 10.5 14.5 78.4 2.5 51.8 81.6 10.8 6.0 1.6
Stayers 8.5 12.7 76.0 4.6 49.6 78.0 13.2 7.2 1.4
6-8
Leavers 11.7 36.4 78.4 0.3 54.0 86.5 8.1 3.6 1.8
Stayers 10.1 26.6 79.5 0.3 49.7 87.1 8.9 2.9 1.4
9-12
Leavers 12.4 39.2 57.7 0.0 46.4 93.8 6.2 0.0 0.0
Stayers 11.2 22.9 59.3 0.0 43.8 94.9 4.8 0.2 0.0

8/14/2019 042009 Year 2 and 3 Charter Report 090416
http://slidepdf.com/reader/full/042009-year-2-and-3-charter-report-090416 30/67
DREAA Charter School Report 2005-06 through 2007-08 April 2009
22
ADEQUATE YEARLY PROGRESS AND STUDENT PERFORMANCE ON STATE AND
STANDARDIZED ASSESSMENTS
The academic progress achieved by charter schools can be measured on two levels. The first
level looks at the school as a whole to determine the extent to which the school has achieved
adequate yearly progress (AYP) under the No Child Left Behind (NCLB) legislation. Although
AYP is often the most visible measure of school progress, schools may demonstrate increases in
the number and proportion of students who achieve at the proficient or advanced levels on state
assessments but not evidence enough progress to achieve AYP. Thus, another way to measure
the impact and effectiveness of a school is to examine the extent to which individual students
make measureable progress in key areas.
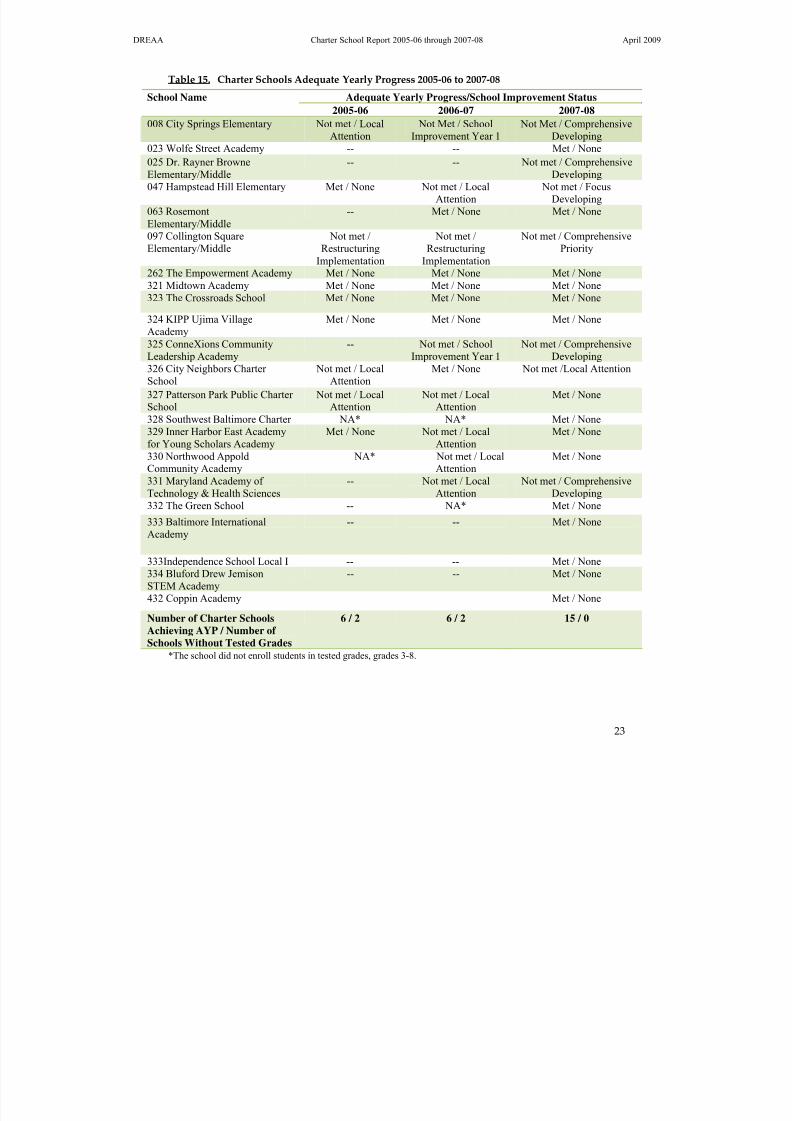
Adequate Yearly Progress
Currently, an important metric for evaluating the overall health and performance of a school is
whether a school has made sufficient progress in the areas of reading and mathematics among
students overall and by student subgroup. Schools that fail to achieve AYP for two consecutive
school years in the same area are identified for improvement and are required to make differing
levels of instructional and administrative interventions to improve student achievement
(Appendix B). In 2007-08, the Maryland State Department of Education (MSDE) gained
approval from the U.S. Department of Education to implement a system of differentiated
accountability for schools that fail to make adequate progress. Schools that fail to make progress
in the ‘all students’ category or for three or more student subgroups are placed on the
Comprehensive Needs pathway. Schools that fail to make progress for one or two subgroups or
serve only students receiving special education services are placed on the Focused Needs
pathway. Six charter schools achieved AYP in both 2005-06 and 2006-07. In 2007-08, 15
charter schools made AYP (Table 15).
8/14/2019 042009 Year 2 and 3 Charter Report 090416
http://slidepdf.com/reader/full/042009-year-2-and-3-charter-report-090416 31/67
DREAA Charter School Report 2005-06 through 2007-08 April 2009
23
Table 15. Charter Schools Adequate Yearly Progress 2005‐06 to 2007‐08
Adequate Yearly Progress/School Improvement StatusSchool Name
2005-06 2006-07 2007-08
008 City Springs Elementary Not met / LocalAttention
Not Met / SchoolImprovement Year 1
Not Met / ComprehensiveDeveloping
023 Wolfe Street Academy -- -- Met / None025 Dr. Rayner BrowneElementary/Middle
-- -- Not met / ComprehensiveDeveloping
047 Hampstead Hill Elementary Met / None Not met / LocalAttention
Not met / FocusDeveloping
063 RosemontElementary/Middle
-- Met / None Met / None
097 Collington SquareElementary/Middle
Not met /Restructuring
Implementation
Not met /Restructuring
Implementation
Not met / ComprehensivePriority
262 The Empowerment Academy Met / None Met / None Met / None321 Midtown Academy Met / None Met / None Met / None
323 The Crossroads School Met / None Met / None Met / None
324 KIPP Ujima VillageAcademy
Met / None Met / None Met / None
325 ConneXions CommunityLeadership Academy
-- Not met / SchoolImprovement Year 1
Not met / ComprehensiveDeveloping
326 City Neighbors Charter School
Not met / LocalAttention
Met / None Not met /Local Attention
327 Patterson Park Public Charter School
Not met / LocalAttention
Not met / LocalAttention
Met / None
328 Southwest Baltimore Charter NA* NA* Met / None329 Inner Harbor East Academy
for Young Scholars Academy
Met / None Not met / Local
Attention
Met / None
330 Northwood AppoldCommunity Academy
NA* Not met / LocalAttention
Met / None
331 Maryland Academy of Technology & Health Sciences
-- Not met / LocalAttention
Not met / ComprehensiveDeveloping
332 The Green School -- NA* Met / None
333 Baltimore InternationalAcademy
-- -- Met / None
333Independence School Local I -- -- Met / None334 Bluford Drew JemisonSTEM Academy
-- -- Met / None
432 Coppin Academy Met / None
Number of Charter SchoolsAchieving AYP / Number of Schools Without Tested Grades
6 / 2 6 / 2 15 / 0
*The school did not enroll students in tested grades, grades 3-8.
8/14/2019 042009 Year 2 and 3 Charter Report 090416
http://slidepdf.com/reader/full/042009-year-2-and-3-charter-report-090416 32/67
DREAA Charter School Report 2005-06 through 2007-08 April 2009
24
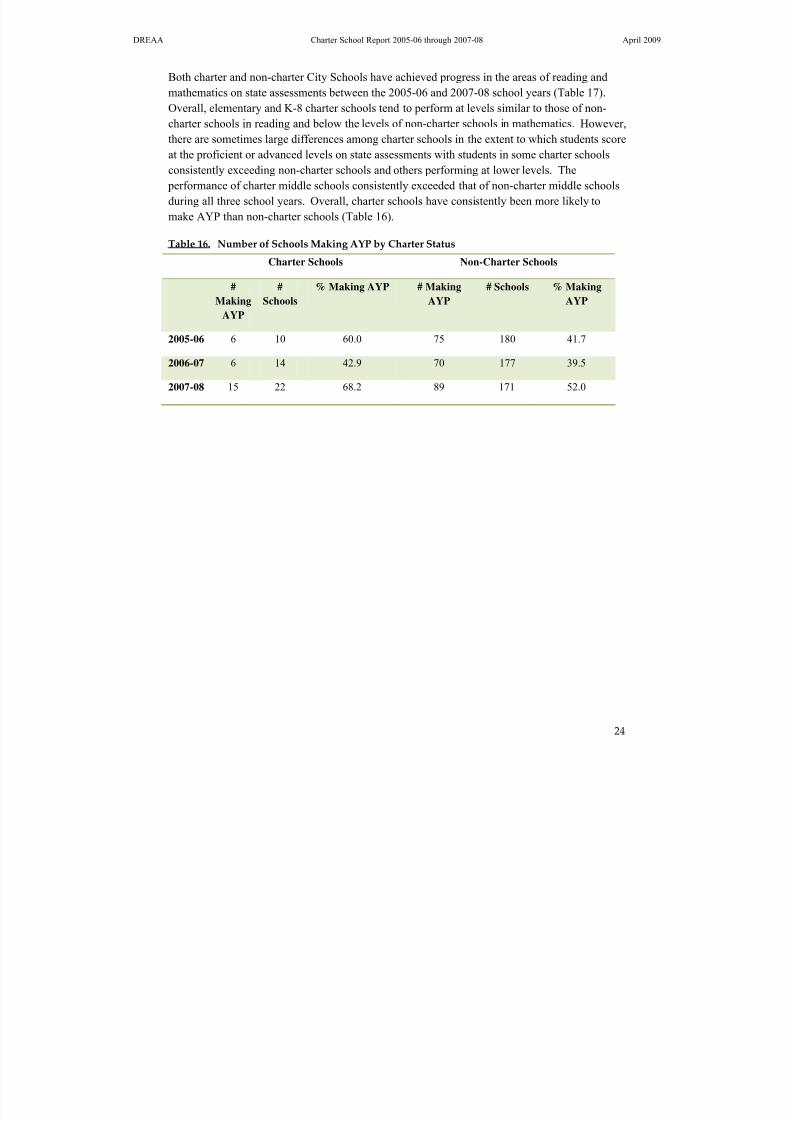
Both charter and non-charter City Schools have achieved progress in the areas of reading and
mathematics on state assessments between the 2005-06 and 2007-08 school years (Table 17).
Overall, elementary and K-8 charter schools tend to perform at levels similar to those of non-
charter schools in reading and below the levels of non-charter schools in mathematics. However,
there are sometimes large differences among charter schools in the extent to which students score
at the proficient or advanced levels on state assessments with students in some charter schools
consistently exceeding non-charter schools and others performing at lower levels. The
performance of charter middle schools consistently exceeded that of non-charter middle schools
during all three school years. Overall, charter schools have consistently been more likely to
make AYP than non-charter schools (Table 16).
Table 16. Number of Schools Making AYP by Charter Status
Charter Schools Non-Charter Schools
#
Making
AYP
#
Schools
% Making AYP # Making
AYP
# Schools % Making
AYP
2005-06 6 10 60.0 75 180 41.7
2006-07 6 14 42.9 70 177 39.5
2007-08 15 22 68.2 89 171 52.0

8/14/2019 042009 Year 2 and 3 Charter Report 090416
http://slidepdf.com/reader/full/042009-year-2-and-3-charter-report-090416 33/67
DREAA Charter School Report 2005-06 through 2007-08 April 2009
25
Table 17. AYP Percent of All Students Scoring Proficient or Advanced 2005‐06 to 2007‐08
AYP - All Students Percent Proficient or Advanced
Reading Mathematics
School Name
2005-06 2006-07 2007-08 2005-06 2006-07 2007-08
Charter SchoolsElementary 67.3 69.0 74.6 48.6 58.2 69.7
K-8 61.7 60.6 72.7 40.2 47.0 59.4
Middle 73.4 66.5 74.6 75.4 59.4 69.7
Middle-High 51.7 61.9 27.5 33.0
High 68.4 87.3
Non-Charter Schools
Elementary 65.3 68.1 77.1 62.2 67.3 74.0
K-8 62.3 65.8 71.9 49.7 56.3 59.4
Middle 37.2 38.1 47.2 19.5 21.2 22.8Middle-High 22.5 35.3 12.5 35.3
High 65.8 65.7
008 City Springs Elementary 52.0 46.8 59.3 34.8 33.8 28.1023 Wolfe Street Academy 74.2 81.0025 Dr. Rayner BrowneElementary/Middle
59.5 54.3
047 Hampstead HillElementary
72.6 69.8 75.3 46.2 45.2 73.1
063 RosemontElementary/Middle
77.0 88.2 75.0 80.3
097 Collington SquareElementary/Middle
50.7 43.3 61.9 24.3 30.7 41.0
262 The EmpowermentAcademy
85.7 80.8 83.5 81.0 75.6 87.4
321 Midtown Academy 80.8 74.2 83.6 73.3 60.8 78.7323 The Crossroads School 62.0 59.4 77.5 47.2 44.8 73.9324 KIPP Ujima VillageAcademy
79.4 73.9 80.5 90.1 79.9 82.5
325 ConneXionsCommunity LeadershipAcademy
62.4 51.7 66.7 37.6 27.5 29.9
326 City Neighbors Charter
School
72.7 78.2 85.2 45.5 66.7 61.1
328 Southwest BaltimoreCharter
71.1 81.6
327 Patterson Park PublicCharter School
55.4 58.3 67.0 37.2 56.4 59.2
329 Inner Harbor EastAcademy for YoungScholars Academy
68.4 59.7 85.2 41.2 30.6 71.6
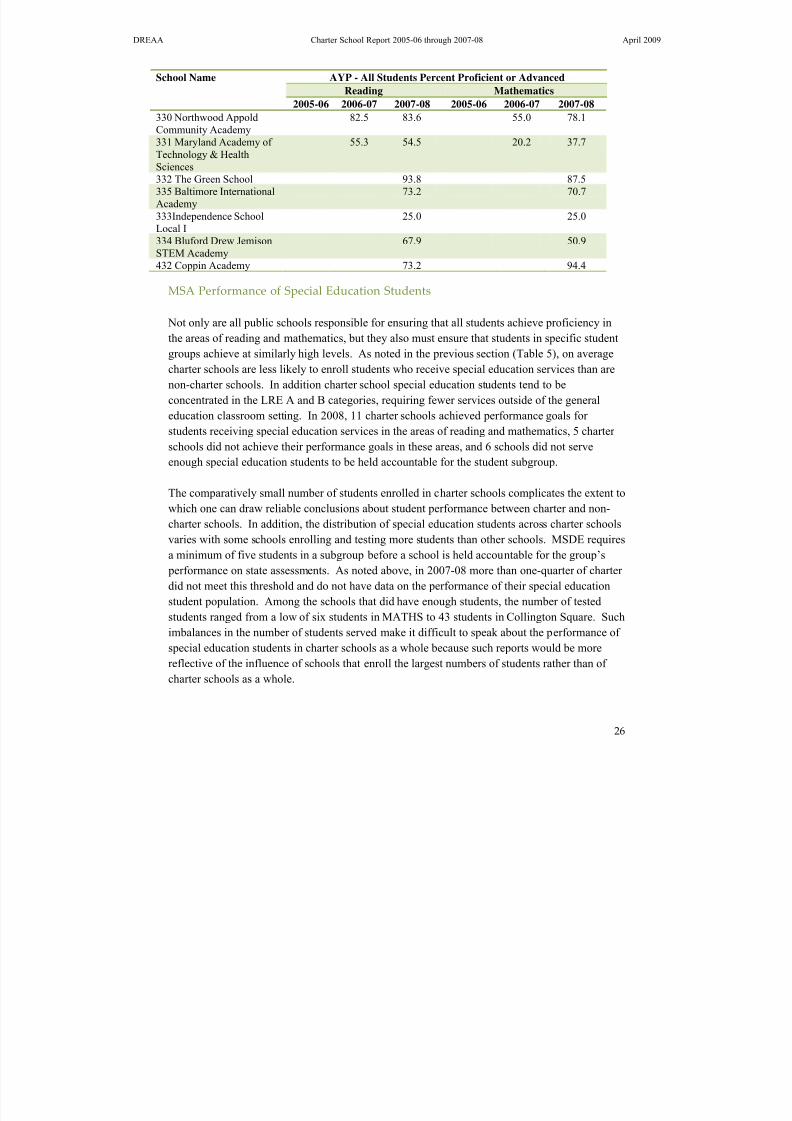
8/14/2019 042009 Year 2 and 3 Charter Report 090416
http://slidepdf.com/reader/full/042009-year-2-and-3-charter-report-090416 34/67
DREAA Charter School Report 2005-06 through 2007-08 April 2009
26
AYP - All Students Percent Proficient or Advanced
Reading Mathematics
School Name
2005-06 2006-07 2007-08 2005-06 2006-07 2007-08
330 Northwood AppoldCommunity Academy
82.5 83.6 55.0 78.1
331 Maryland Academy of Technology & HealthSciences
55.3 54.5 20.2 37.7
332 The Green School 93.8 87.5335 Baltimore InternationalAcademy
73.2 70.7
333Independence SchoolLocal I
25.0 25.0
334 Bluford Drew JemisonSTEM Academy
67.9 50.9
432 Coppin Academy 73.2 94.4
MSA Performance of Special Education Students
Not only are all public schools responsible for ensuring that all students achieve proficiency in
the areas of reading and mathematics, but they also must ensure that students in specific student
groups achieve at similarly high levels. As noted in the previous section (Table 5), on average
charter schools are less likely to enroll students who receive special education services than are
non-charter schools. In addition charter school special education students tend to be
concentrated in the LRE A and B categories, requiring fewer services outside of the general
education classroom setting. In 2008, 11 charter schools achieved performance goals for
students receiving special education services in the areas of reading and mathematics, 5 charter
schools did not achieve their performance goals in these areas, and 6 schools did not serveenough special education students to be held accountable for the student subgroup.
The comparatively small number of students enrolled in charter schools complicates the extent to
which one can draw reliable conclusions about student performance between charter and non-
charter schools. In addition, the distribution of special education students across charter schools
varies with some schools enrolling and testing more students than other schools. MSDE requires
a minimum of five students in a subgroup before a school is held accountable for the group’s
performance on state assessments. As noted above, in 2007-08 more than one-quarter of charter
did not meet this threshold and do not have data on the performance of their special education
student population. Among the schools that did have enough students, the number of tested
students ranged from a low of six students in MATHS to 43 students in Collington Square. Such
imbalances in the number of students served make it difficult to speak about the performance of
special education students in charter schools as a whole because such reports would be more
reflective of the influence of schools that enroll the largest numbers of students rather than of
charter schools as a whole.
8/14/2019 042009 Year 2 and 3 Charter Report 090416
http://slidepdf.com/reader/full/042009-year-2-and-3-charter-report-090416 35/67
DREAA Charter School Report 2005-06 through 2007-08 April 2009
27
Table 18. AYP Percent of Students Receiving Special Education Services Scoring Proficient or
Advanced 2005‐06 to 2007‐08
AYP – Special Education Students Percent Proficient or Advanced / Student Performance Goal Performance
Reading Mathematics
School Name
2005-06 2006-07 2007-08 2005-06 2006-07 2007-08
008 City Springs Elementary /Middle
20.0 / Not met
16.7 / Not met
26.7 / Notmet
26.7 /Met
11.1 / Not met
10.0 / Notmet
023 Wolfe Street Academy 72.7 /Met
63.6 /Met
025 Dr. Rayner BrowneElementary/Middle
17.6 / Notmet
29.4 / NotMet
047 Hampstead Hill Elementary 38.1 /Met
6.3 / Not met
40.7 / Notmet
9.5 /Met
6.3 / Notmet
44.4 / Notmet
063 Rosemont Elementary/Middle 57.1 /Met
67.5 / Met 35.7 /Met
50.0 / Met
097 Collington SquareElementary/Middle
0.0 / Not met
10.0 / Not met
30.2 / Notmet
2.9 / Not met
0.0 / Notmet
19.5 / Notmet
262 The Empowerment Academy -- -- -- -- -- --321 Midtown Academy 66.7 /
Met57.1 /Met
55.6 / Met 50.0 /Met
42.9 /Met
55.6 / Met
323 The Crossroads School 33.3 /Met
43.8 /Met
57.1 / Met 20.0 /Met
31.3 /Met
42.9 / Met
324 KIPP Ujima Village Academy 46.2 /Met
35.0 /Met
51.4 / Met 76.9 /Met
50.0 /Met
42.9 / Met
325 ConneXions CommunityLeadership Academy
16.7 / Not met
50.0 / Met 0.0 / Met 8.3 / Notmet
326 City Neighbors Charter
School
62.5 /
Met
66.7 /
Met
65.2 / Met 12.5 /
Met
50.0 /
Met
30.4 / Not
met328 Southwest Baltimore -- --327 Patterson Park Public Charter School
33.3 /Met
20.8 / Not Met
36.1 / Met 8.3 / Not met
25.0 /Met
22.2 / Met
329 Inner Harbor East Academyfor Young Scholars Academy
-- 60.0 /Met
85.7 / Met -- 40.0 /Met
85.7 / Met
330 Northwood AppoldCommunity Academy
-- -- 57.1 / Met -- -- 71.4 / Met
331 Maryland Academy of Technology & Health Sciences(MATHS)
50.0 /Met
0.0 / Notmet
37.5 /Met
16.7 / Met
332 The Green School -- --
335 Baltimore InternationalAcademy -- --
333Independence School Local I -- --334 Bluford Drew Jemison STEMAcademy
63.6 / Met 45.5 / Met
432 Coppin Academy
8/14/2019 042009 Year 2 and 3 Charter Report 090416
http://slidepdf.com/reader/full/042009-year-2-and-3-charter-report-090416 36/67
DREAA Charter School Report 2005-06 through 2007-08 April 2009
28
Table 18 demonstrates that charter schools vary in the extent to which they achieve performance
goals for special education students. The proportion of special education students meeting
performance goals may vary significantly from year to year. Such variations are more likely to
occur when the number of students is small as is the case with most charter schools. Some
schools such as Midtown Academy and Rosemont Elementary/Middle have consistently met
special education student performance goals while other schools such as City Springs and
Collington Square have failed to meet most performance targets since 2005-06.
Student‐level MSA Proficiency Gains
Table 19 presents data on the percentages of students moving up or down at least one proficiency
level, as well as percentages of students remaining at the same proficiency level. Students
maintaining performance at the highest proficiency level (advanced) are classified as moving up.
(See Appendix C for details on the derivation of these measures). Overall, charter school
students progress less than non-charter students moving from grade 3 to grade 4, but they
progress more than non-charter students between grades 5 and 6; 6 and 7, and 7 and 8. Charter
school students moving from grade 4 to grade 5 are more likely to maintain their status than are
non-charter school students who were more likely to change performance levels.
Both Midtown Academy and KIPP Ujima Village Academy consistently raised proficiency
levels or maintained highest level proficiency among 40% or more of their students over the full
three years. At KIPP, 57% of these students “moving up” achieved actual proficiency level
gains, while at Midtown Academy only 42% did so, with the others maintaining highest level
proficiency. Rosemont, City Neighbors, and Patterson Park Public Charter achieved strong
gains for the most recent two years. City Springs, ConneXions Community Leadership
Academy, Maryland Academy of Technology and Health Sciences, and Baltimore International
Academy have never improved scores among more than 20% of their students. It may be noted
that there is only one year of data for Baltimore International Academy, and most charters
performed weakly in their initial year of operation. City Springs has turned in three years of
consistently lackluster performance. Collington Square failed to produce significant gains in both
2005-06 and 2006-07, but its performance improved in 2007-08.

8/14/2019 042009 Year 2 and 3 Charter Report 090416
http://slidepdf.com/reader/full/042009-year-2-and-3-charter-report-090416 37/67
DREAA Charter School Report 2005-06 through 2007-08 April 2009
29
Table 19. Change in MSA Proficiency Level (Percent of Students)
Student Proficiency Level Change Status
2005-06 2006-07 2007-08
Down Same Up Down Same Up Down Same Up
All Charter Schools
Grade 3 to 4 21 64 15 8 60 32 7 51 42
Grade 4 to 5 14 67 19 14 63 23 15 49 37
Grade 5 to 6 11 58 32 14 58 28 12 45 43
Grade 6 to 7 14 60 25 28 60 12 11 49 39
Grade 7 to 8 6 54 40 14 61 26 4 62 34
Non-charter Schools
Grade 3 to 4 14 58 28 10 51 39 8 43 49
Grade 4 to 5 17 59 23 18 55 26 17 42 40
Grade 5 to 6 20 67 14 18 62 19 17 53 30
Grade 6 to 7 12 78 10 12 76 11 12 67 21
Grade 7 to 8 8 80 12 9 79 12 7 75 18
Charter Schools
008 City Springs 13 75 12 7 77 15 12 71 17
023 Wolfe Street Academy 0 30 70
025 Dr. Rayner Browne 8 68 24
047 Hampstead Hill Academy 17 65 17 13 65 22 6 48 46
063 Rosemont 22 46 33 7 30 63
097 Collington Square 7 79 13 10 75 15 8 59 32
262 Empowerment Academy 20 65 15 6 50 44 5 50 45
321 Midtown Academy 12 43 45 22 39 40 4 33 63
323 The Crossroads School 12 65 23 17 67 16 8 49 43
324 KIPP Ujima Village Academy 13 39 48 22 42 37 15 36 49
325 ConneXions CommunityLeadership Academy
22 70 8 15 67 18
326 City Neighbors Charter School 30 65 5 13 51 36 9 51 41
327 Patterson Park Public Charter 33 51 15 8 63 30 11 54 35
329 Inner Harbor East Academy 20 76 4 2 39 60
330 Northwood Appold Comm.Acad. 3 60 37
331 Maryland Academy of Technology & Health Sciences(MATHS)
18 73 9 7 75 18
334 Bluford Drew Jemison 24 50 26
335 Baltimore Int. Acad. 19 63 19
Notes: See Appendix C for details calculation of change in proficiency level.
8/14/2019 042009 Year 2 and 3 Charter Report 090416
http://slidepdf.com/reader/full/042009-year-2-and-3-charter-report-090416 38/67
DREAA Charter School Report 2005-06 through 2007-08 April 2009
30
High School Assessments
Students who entered high school for the first time during 2005-06 school year or later must pass
High School Assessments (HSAs) in the areas of Algebra 1, Biology, English 1, and American
Government to graduate. In 2008, MSDE implemented the Bridge Plan for Academic Validation
which allowed students who have difficulty passing the assessments after multiple attempts to
participate in independent study projects to fulfill the HSA requirements. In 2008-09, charter
schools will graduate their first significant number of students. Upcoming evaluations will
explore in-depth the extent to which charter school students are successful in meeting both the
HSA and other graduation requirements.
The 2006-07 school year was the first year City charter schools enrolled high school students.
Depending on their academic progress, some students may take the Algebra 1 assessment for the
first time during 8th grade. Table 20 displays the performance of students during the 2006-07
and 2007-08 school years. All students who took assessments are included. The Algebra I and
English II data should not be confused with the AYP data provided in Table 17. For 2006-07,
the AYP data reflect the pass rates for first-time takers of the Algebra and English assessments.
For 2007-08, AYP data reflect the status of 11th grade students actively enrolled as of the end of
the school year. Students may have passed the assessment in 2007-08 or during prior school
years. The comprehensive measure shows the extent to which schools are making annual
progress among all test takers.
As with other data presented in this report, charter schools vary greatly in the proportion of
students passing HSAs each year. For the Algebra I assessment, middle and K-8 schools
evidence the highest pass rates. This pattern likely reflects the selection of specific students to
take the test prior to the 9th grade. These are probably among the most capable students,
resulting in the high pass rates.
Among the charter schools that enroll students in high school grades, the performance of some
schools exceeds that of the district as a whole, while the performance of others falls below that of
the school district. For example, Coppin Students posted a 90% pass rate in American
Government in 2007-08, significantly above the 52% of the district. However, in English II,
students had a pass rate of approximately 33% slightly below the district rate of nearly 36%.
Student outcomes for charter high school students will become more visible as the schools enroll
larger numbers of high school students.
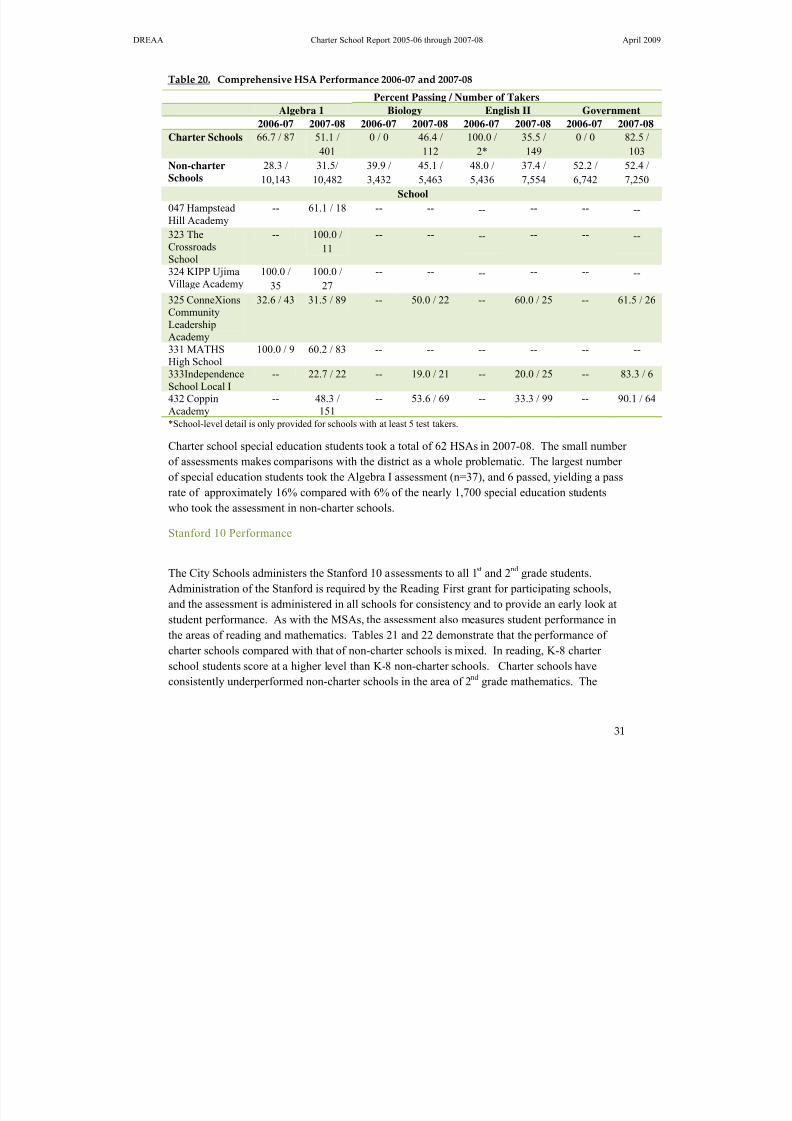
8/14/2019 042009 Year 2 and 3 Charter Report 090416
http://slidepdf.com/reader/full/042009-year-2-and-3-charter-report-090416 39/67
DREAA Charter School Report 2005-06 through 2007-08 April 2009
31
Table 20. Comprehensive HSA Performance 2006‐07 and 2007‐08
Percent Passing / Number of Takers
Algebra 1 Biology English II Government
2006-07 2007-08 2006-07 2007-08 2006-07 2007-08 2006-07 2007-08
Charter Schools 66.7 / 87 51.1 /
401
0 / 0 46.4 /
112
100.0 /
2*
35.5 /
149
0 / 0 82.5 /
103Non-charterSchools
28.3 /
10,143
31.5/
10,482
39.9 /
3,432
45.1 /
5,463
48.0 /
5,436
37.4 /
7,554
52.2 /
6,742
52.4 /
7,250
School
047 HampsteadHill Academy
-- 61.1 / 18 -- --‐‐
-- --‐‐
323 TheCrossroadsSchool
-- 100.0 /
11
-- -- ‐‐ -- -- ‐‐
324 KIPP UjimaVillage Academy
100.0 /
35
100.0 /
27
-- -- ‐‐ -- -- ‐‐
325 ConneXionsCommunityLeadershipAcademy
32.6 / 43 31.5 / 89 -- 50.0 / 22 -- 60.0 / 25 -- 61.5 / 26
331 MATHSHigh School
100.0 / 9 60.2 / 83 -- -- -- -- -- --
333IndependenceSchool Local I
-- 22.7 / 22 -- 19.0 / 21 -- 20.0 / 25 -- 83.3 / 6
432 CoppinAcademy
-- 48.3 /151
-- 53.6 / 69 -- 33.3 / 99 -- 90.1 / 64
*School-level detail is only provided for schools with at least 5 test takers.
Charter school special education students took a total of 62 HSAs in 2007-08. The small number of assessments makes comparisons with the district as a whole problematic. The largest number
of special education students took the Algebra I assessment (n=37), and 6 passed, yielding a pass
rate of approximately 16% compared with 6% of the nearly 1,700 special education students
who took the assessment in non-charter schools.
Stanford 10 Performance
The City Schools administers the Stanford 10 assessments to all 1st and 2nd grade students.
Administration of the Stanford is required by the Reading First grant for participating schools,
and the assessment is administered in all schools for consistency and to provide an early look at
student performance. As with the MSAs, the assessment also measures student performance in
the areas of reading and mathematics. Tables 21 and 22 demonstrate that the performance of
charter schools compared with that of non-charter schools is mixed. In reading, K-8 charter
school students score at a higher level than K-8 non-charter schools. Charter schools have
consistently underperformed non-charter schools in the area of 2nd grade mathematics. The
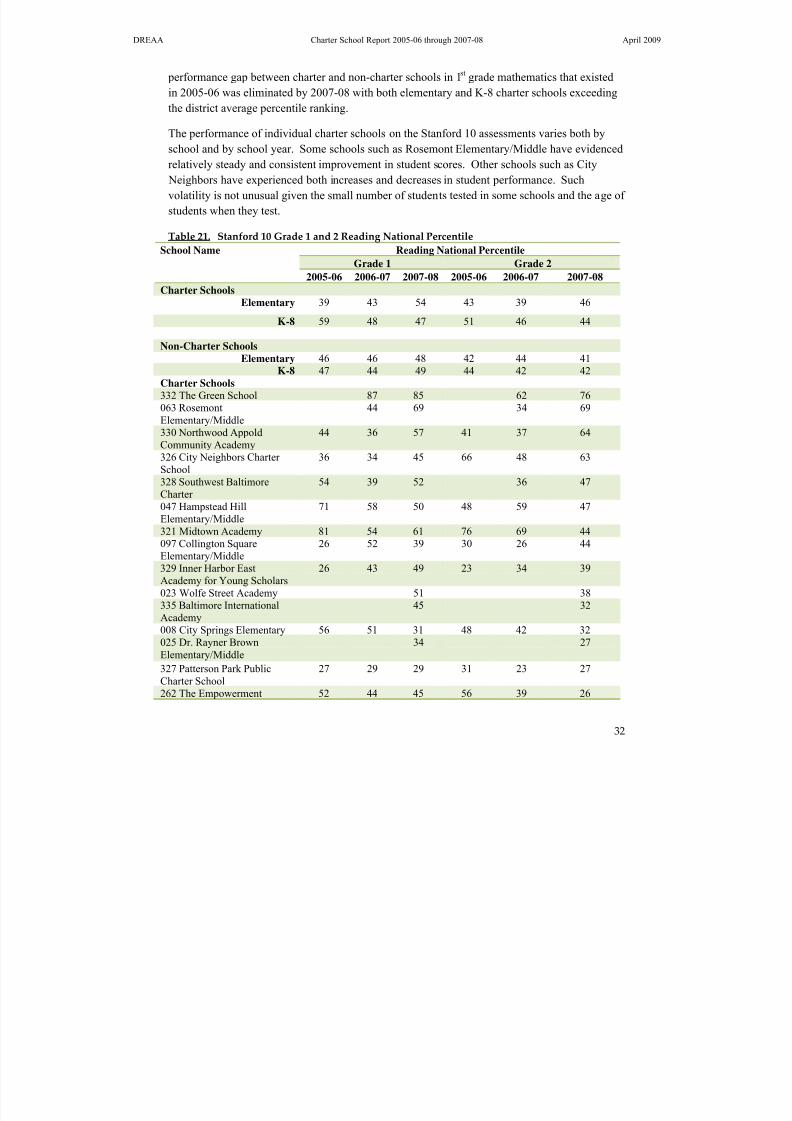
8/14/2019 042009 Year 2 and 3 Charter Report 090416
http://slidepdf.com/reader/full/042009-year-2-and-3-charter-report-090416 40/67
DREAA Charter School Report 2005-06 through 2007-08 April 2009
32
performance gap between charter and non-charter schools in 1st grade mathematics that existed
in 2005-06 was eliminated by 2007-08 with both elementary and K-8 charter schools exceeding
the district average percentile ranking.
The performance of individual charter schools on the Stanford 10 assessments varies both by
school and by school year. Some schools such as Rosemont Elementary/Middle have evidencedrelatively steady and consistent improvement in student scores. Other schools such as City
Neighbors have experienced both increases and decreases in student performance. Such
volatility is not unusual given the small number of students tested in some schools and the age of
students when they test.
Table 21. Stanford 10 Grade 1 and 2 Reading National Percentile
Reading National Percentile
Grade 1 Grade 2
School Name
2005-06 2006-07 2007-08 2005-06 2006-07 2007-08
Charter SchoolsElementary 39 43 54 43 39 46
K-8 59 48 47 51 46 44
Non-Charter Schools
Elementary 46 46 48 42 44 41K-8 47 44 49 44 42 42
Charter Schools332 The Green School 87 85 62 76063 RosemontElementary/Middle
44 69 34 69
330 Northwood Appold
Community Academy
44 36 57 41 37 64
326 City Neighbors Charter School
36 34 45 66 48 63
328 Southwest BaltimoreCharter
54 39 52 36 47
047 Hampstead HillElementary/Middle
71 58 50 48 59 47
321 Midtown Academy 81 54 61 76 69 44097 Collington SquareElementary/Middle
26 52 39 30 26 44
329 Inner Harbor EastAcademy for Young Scholars
26 43 49 23 34 39
023 Wolfe Street Academy 51 38335 Baltimore InternationalAcademy
45 32
008 City Springs Elementary 56 51 31 48 42 32025 Dr. Rayner BrownElementary/Middle
34 27
327 Patterson Park PublicCharter School
27 29 29 31 23 27
262 The Empowerment 52 44 45 56 39 26
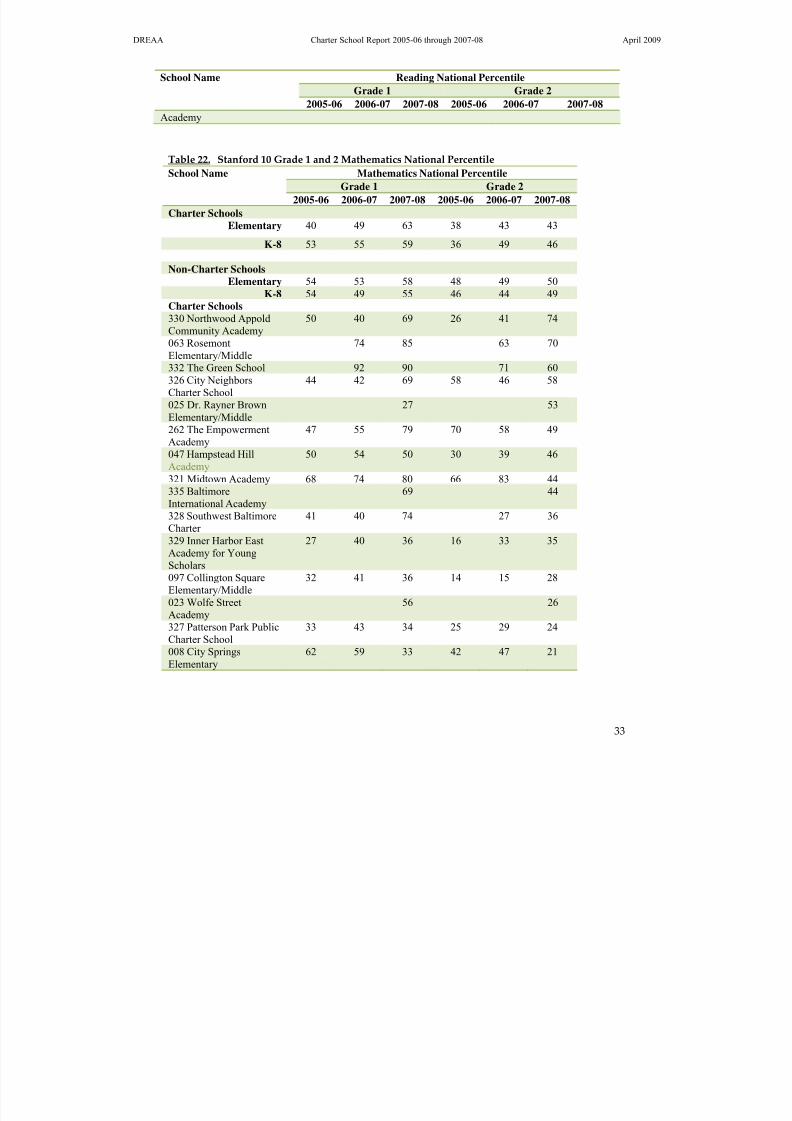
8/14/2019 042009 Year 2 and 3 Charter Report 090416
http://slidepdf.com/reader/full/042009-year-2-and-3-charter-report-090416 41/67
DREAA Charter School Report 2005-06 through 2007-08 April 2009
33
Reading National Percentile
Grade 1 Grade 2
School Name
2005-06 2006-07 2007-08 2005-06 2006-07 2007-08
Academy
Table 22. Stanford 10 Grade 1 and 2 Mathematics National Percentile
Mathematics National Percentile
Grade 1 Grade 2
School Name
2005-06 2006-07 2007-08 2005-06 2006-07 2007-08
Charter SchoolsElementary 40 49 63 38 43 43
K-8 53 55 59 36 49 46
Non-Charter SchoolsElementary 54 53 58 48 49 50
K-8 54 49 55 46 44 49Charter Schools330 Northwood AppoldCommunity Academy
50 40 69 26 41 74
063 RosemontElementary/Middle
74 85 63 70
332 The Green School 92 90 71 60326 City NeighborsCharter School
44 42 69 58 46 58
025 Dr. Rayner BrownElementary/Middle
27 53
262 The Empowerment
Academy
47 55 79 70 58 49
047 Hampstead HillAcademy
50 54 50 30 39 46
321 Midtown Academy 68 74 80 66 83 44335 BaltimoreInternational Academy
69 44
328 Southwest BaltimoreCharter
41 40 74 27 36
329 Inner Harbor EastAcademy for YoungScholars
27 40 36 16 33 35
097 Collington SquareElementary/Middle
32 41 36 14 15 28
023 Wolfe StreetAcademy
56 26
327 Patterson Park PublicCharter School
33 43 34 25 29 24
008 City SpringsElementary
62 59 33 42 47 21

8/14/2019 042009 Year 2 and 3 Charter Report 090416
http://slidepdf.com/reader/full/042009-year-2-and-3-charter-report-090416 42/67
DREAA Charter School Report 2005-06 through 2007-08 April 2009
34
Stanford Grade 1 to 2 Student‐level Progress
As with the progress measure on the MSAs, it is also possible to examine the extent to which
individual students make progress on the Stanford measures from grades 1 to 2. A matched pair
score is a repeated measure using the child as the unit of analysis. For 2007-08 gains, the 20071st grade scores were compared against the same child a year later in grade 2. Similarly, 2006-07
gains reflect the comparison between 1st
grade scores in 2006 with 2nd
grade scores in 2007.
The Title I evaluation model that was accepted for many years posited a 2 (normal curve
equivalent) NCE gain per child and in the aggregate. Comparing 2005-06 to 2006-07 and 2006-
07 to 2007-08 data, the system overall has declined by 6.0 and 4.9 NCEs in mathematics in both
respective years. The reading pattern is similar, having lost 4.5 and 4.9 NCEs in both respective
years. As revealed in Table 23 both charter and non-charter school students evidenced this
overall decline in both reading and mathematics performance for both the 2007 and 2008
measures.
Table 23. Stanford 10 Achievement Test Student Matched Pairs Average NCE Annual Gains
Average Annual NCE Change
2005-06 to 2006-07 2006-07 to 2007-08
Reading Mathematics Reading Mathematics
Charter
Schools
-6.1 -5.4 -3.0 -7.5
Non-Charter
Schools
-4.3 -6.0 -5.1 -4.6
LEARNING ENVIRONMENT OF CHARTER SCHOOLS
School‐level Attendance Rates
Charter schools, on average, had slightly higher rates of attendance than non-charter schools at
all grade levels. Charter students of all grade levels were less likely to miss 20 or more days of

8/14/2019 042009 Year 2 and 3 Charter Report 090416
http://slidepdf.com/reader/full/042009-year-2-and-3-charter-report-090416 43/67
DREAA Charter School Report 2005-06 through 2007-08 April 2009
35
school than were non-charter school students. The attendance disparities are largest among
middle and middle/high schools. In 2007-08 the average attendance rate at charter middle
schools was 95.9% compared with 86.2% at non-charter middle schools. Six percent of charter
middle school students missed more than 20 days of schools compared with 38% of non-charter
middle school students.
Table 24. School‐level attendance rates 2005‐06 to 2007‐08 by charter school status
All Students Attendance Rates
Average Attendance
Rate
Percent of Students
Missing Less than 5
Days of School*
Percent of Students
Missing More than 20
Days of School *
School Name
2005-06
2006-07
2007-08
2005-06
2006-07
2007-08
2005-06
2006-07
2007-08
All Charter Schools
Elementary 94.3 94.4 95.0 31.1 29.8 34.6 12.1 13.2 7.1
K-8 95.8 94.3 95.1 50.4 36.6 37.6 7.8 14.8 9.3Middle 96.0 94.8 95.9 50.5 33.6 44.9 5.1 9.1 6.0
High 91.7 17.0 29.7
Middle-High 99.4 94.1 23.4 38.6 8.9 11.6
Non-charter Schools
Elementary 94.1 94.0 94.1 38.0 37.2 37.8 12.5 13.2 11.9
K-8 93.8 93.8 93.8 34.4 35.0 35.1 14.2 14.3 13.8
Middle 85.7 84.9 86.2 17.8 14.5 17.5 38.5 43.4 37.8
High 83.7 18.4 41.2
Middle-High 79.9 68.0 25.9 25.1 63.7 70.0Charter Schools
008 City SpringsElementary
96.3 97.1 93.8 64.9 69.4 37.5 5.1 6.2 10.9
023 Wolfe Street Academy 95.3 40.0 6.4
025 Dr. Rayner BrownElementary/ Middle
93.7 40.3 11.5
047 Hampstead HillAcademy
95.3 95.4 95.0 40.7 38.9 31.8 6.2 9.0 10.8
063 Rosemont Elementary/Middle
93.3 94.5 25.8 27.7 14.5 12.8
097 Collington SquareElementary/ Middle
96.1 90.8 96.4 54.7 16.3 53.9 10.5 30.1 7.7
262 The EmpowermentAcademy
95.2 95.6 95.8 32.4 34.1 28.2 5.6 2.4 2.7
321 Midtown Academy 95.4 95.6 96.2 33.7 32.7 37.7 9.8 13.0 5.6
323 The Crossroads School 95.4 95.7 95.3 39.0 32.4 39.7 6.2 8.3 6.4324 KIPP Ujima VillageAcademy
96.3 94.8 96.3 56.4 38.3 47.6 4.6 7.9 5.2
325 ConneXions 96.0 99.4 95.9 47.0 23.4 47.4 4.3 8.9 6.8
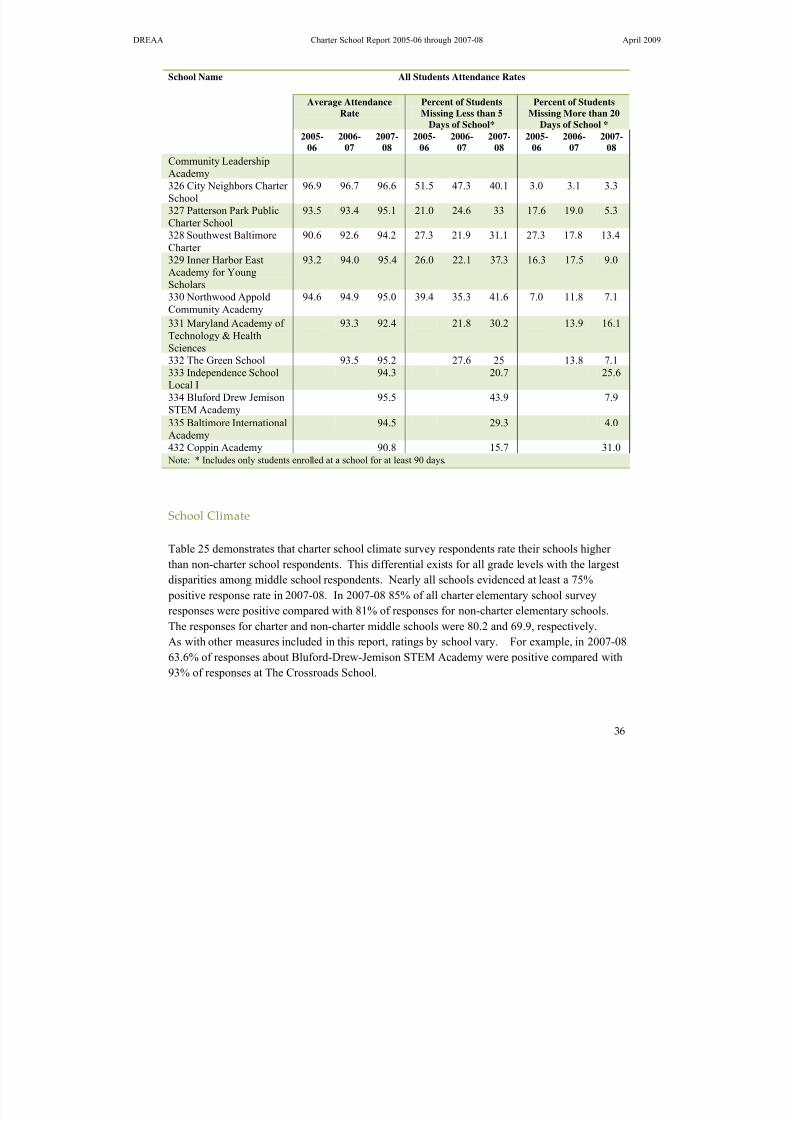
8/14/2019 042009 Year 2 and 3 Charter Report 090416
http://slidepdf.com/reader/full/042009-year-2-and-3-charter-report-090416 44/67
DREAA Charter School Report 2005-06 through 2007-08 April 2009
36
All Students Attendance Rates
Average Attendance
Rate
Percent of Students
Missing Less than 5
Days of School*
Percent of Students
Missing More than 20
Days of School *
School Name
2005-
06
2006-
07
2007-
08
2005-
06
2006-
07
2007-
08
2005-
06
2006-
07
2007-
08Community LeadershipAcademy326 City Neighbors Charter School
96.9 96.7 96.6 51.5 47.3 40.1 3.0 3.1 3.3
327 Patterson Park PublicCharter School
93.5 93.4 95.1 21.0 24.6 33 17.6 19.0 5.3
328 Southwest BaltimoreCharter
90.6 92.6 94.2 27.3 21.9 31.1 27.3 17.8 13.4
329 Inner Harbor EastAcademy for YoungScholars
93.2 94.0 95.4 26.0 22.1 37.3 16.3 17.5 9.0
330 Northwood AppoldCommunity Academy
94.6 94.9 95.0 39.4 35.3 41.6 7.0 11.8 7.1
331 Maryland Academy of Technology & HealthSciences
93.3 92.4 21.8 30.2 13.9 16.1
332 The Green School 93.5 95.2 27.6 25 13.8 7.1333 Independence SchoolLocal I
94.3 20.7 25.6
334 Bluford Drew JemisonSTEM Academy
95.5 43.9 7.9
335 Baltimore InternationalAcademy
94.5 29.3 4.0
432 Coppin Academy 90.8 15.7 31.0 Note: * Includes only students enrolled at a school for at least 90 days.
School Climate
Table 25 demonstrates that charter school climate survey respondents rate their schools higher
than non-charter school respondents. This differential exists for all grade levels with the largest
disparities among middle school respondents. Nearly all schools evidenced at least a 75%
positive response rate in 2007-08. In 2007-08 85% of all charter elementary school surveyresponses were positive compared with 81% of responses for non-charter elementary schools.
The responses for charter and non-charter middle schools were 80.2 and 69.9, respectively.
As with other measures included in this report, ratings by school vary. For example, in 2007-08
63.6% of responses about Bluford-Drew-Jemison STEM Academy were positive compared with
93% of responses at The Crossroads School.
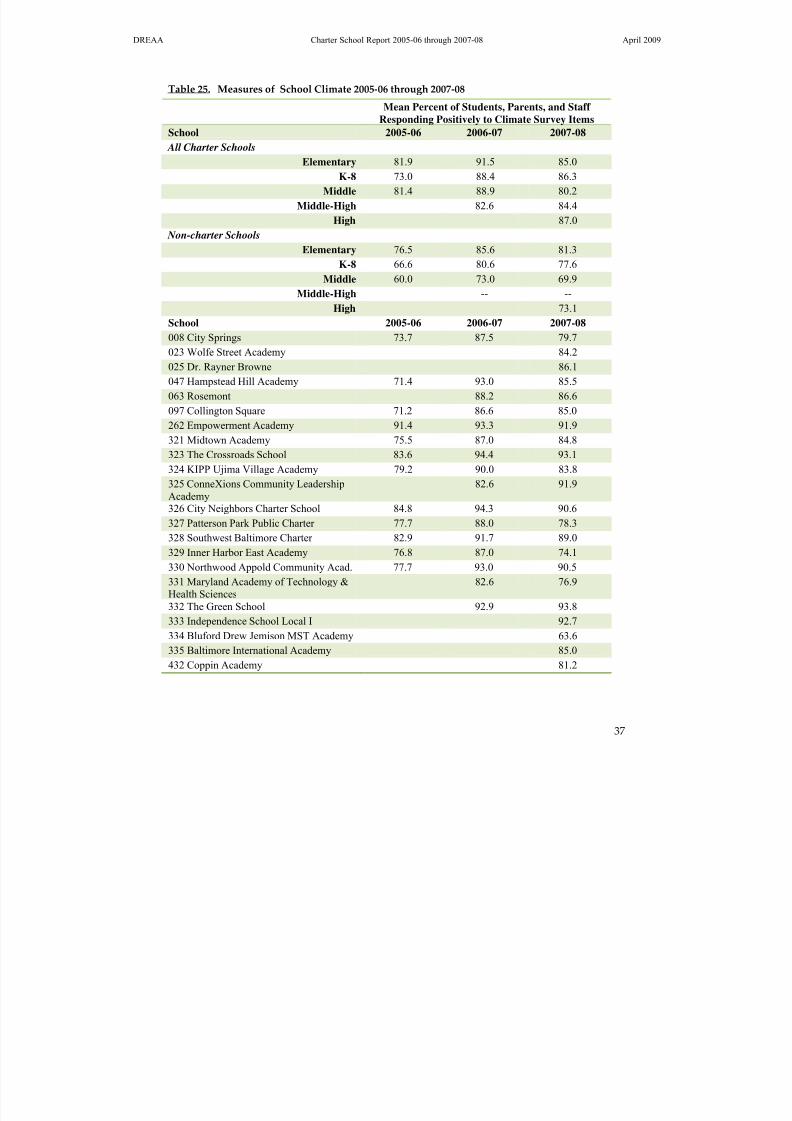
8/14/2019 042009 Year 2 and 3 Charter Report 090416
http://slidepdf.com/reader/full/042009-year-2-and-3-charter-report-090416 45/67
DREAA Charter School Report 2005-06 through 2007-08 April 2009
37
Table 25. Measures of School Climate 2005‐06 through 2007‐08
Mean Percent of Students, Parents, and Staff
Responding Positively to Climate Survey Items
School 2005-06 2006-07 2007-08
All Charter SchoolsElementary 81.9 91.5 85.0
K-8 73.0 88.4 86.3
Middle 81.4 88.9 80.2
Middle-High 82.6 84.4
High 87.0
Non-charter Schools
Elementary 76.5 85.6 81.3
K-8 66.6 80.6 77.6
Middle 60.0 73.0 69.9
Middle-High -- --High 73.1
School 2005-06 2006-07 2007-08
008 City Springs 73.7 87.5 79.7
023 Wolfe Street Academy 84.2
025 Dr. Rayner Browne 86.1
047 Hampstead Hill Academy 71.4 93.0 85.5
063 Rosemont 88.2 86.6
097 Collington Square 71.2 86.6 85.0
262 Empowerment Academy 91.4 93.3 91.9
321 Midtown Academy 75.5 87.0 84.8
323 The Crossroads School 83.6 94.4 93.1
324 KIPP Ujima Village Academy 79.2 90.0 83.8
325 ConneXions Community LeadershipAcademy
82.6 91.9
326 City Neighbors Charter School 84.8 94.3 90.6
327 Patterson Park Public Charter 77.7 88.0 78.3
328 Southwest Baltimore Charter 82.9 91.7 89.0
329 Inner Harbor East Academy 76.8 87.0 74.1
330 Northwood Appold Community Acad. 77.7 93.0 90.5
331 Maryland Academy of Technology &
Health Sciences
82.6 76.9
332 The Green School 92.9 93.8
333 Independence School Local I 92.7
334 Bluford Drew Jemison MST Academy 63.6
335 Baltimore International Academy 85.0
432 Coppin Academy 81.2

8/14/2019 042009 Year 2 and 3 Charter Report 090416
http://slidepdf.com/reader/full/042009-year-2-and-3-charter-report-090416 46/67
DREAA Charter School Report 2005-06 through 2007-08 April 2009
38
Notes: Students in grades 3-8 complete the climate surveyAggregations by school configuration reflect the grand mean (the mean of means)
Student Discipline
Charter schools tend to have lower suspension rates than non-charter schools. The elementary
school charter school suspension rate exceeded the rate for non-charter schools in 2006-07 and
the charter middle/high school rate exceeded the non-charter rate in 2007-08. The K-8 and
middle school charter school rates have consistently been lower than those of non-charter
schools. Although the overall rates tend to be lower among charter schools, the rates across
schools vary, sometimes by large margins. Some schools such as Collington Square, The Green
School, and The Empowerment Academy routinely post suspension rates of less than 5%. On
the other hand, other schools such as Patterson Park and MATHS have rates that exceed 20% of
enrollment. The cause of the variations in suspension rates is not available from current datasources. Future reports may explore this feature of charter schools in greater depth.
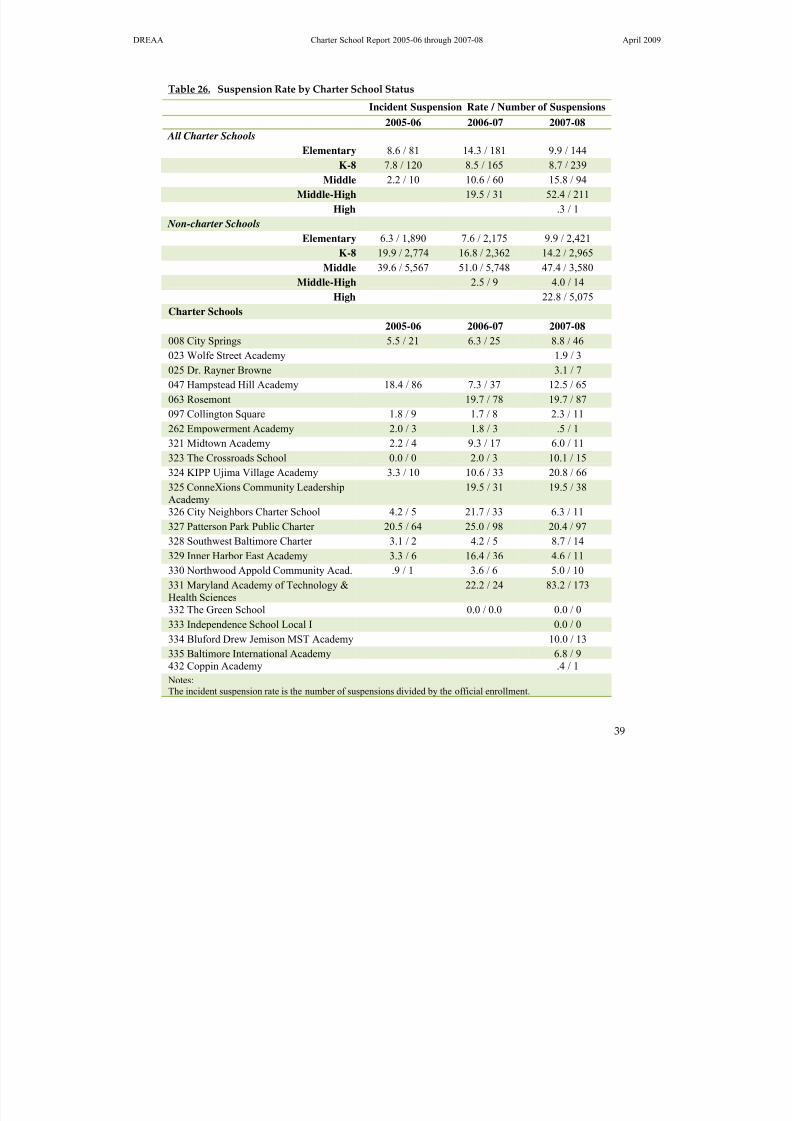
8/14/2019 042009 Year 2 and 3 Charter Report 090416
http://slidepdf.com/reader/full/042009-year-2-and-3-charter-report-090416 47/67
DREAA Charter School Report 2005-06 through 2007-08 April 2009
39
Table 26. Suspension Rate by Charter School Status
Incident Suspension Rate / Number of Suspensions
2005-06 2006-07 2007-08
All Charter Schools
Elementary 8.6 / 81 14.3 / 181 9.9 / 144K-8 7.8 / 120 8.5 / 165 8.7 / 239
Middle 2.2 / 10 10.6 / 60 15.8 / 94
Middle-High 19.5 / 31 52.4 / 211
High .3 / 1
Non-charter Schools
Elementary 6.3 / 1,890 7.6 / 2,175 9.9 / 2,421
K-8 19.9 / 2,774 16.8 / 2,362 14.2 / 2,965
Middle 39.6 / 5,567 51.0 / 5,748 47.4 / 3,580
Middle-High 2.5 / 9 4.0 / 14
High 22.8 / 5,075Charter Schools
2005-06 2006-07 2007-08
008 City Springs 5.5 / 21 6.3 / 25 8.8 / 46
023 Wolfe Street Academy 1.9 / 3
025 Dr. Rayner Browne 3.1 / 7
047 Hampstead Hill Academy 18.4 / 86 7.3 / 37 12.5 / 65
063 Rosemont 19.7 / 78 19.7 / 87
097 Collington Square 1.8 / 9 1.7 / 8 2.3 / 11
262 Empowerment Academy 2.0 / 3 1.8 / 3 .5 / 1
321 Midtown Academy 2.2 / 4 9.3 / 17 6.0 / 11323 The Crossroads School 0.0 / 0 2.0 / 3 10.1 / 15
324 KIPP Ujima Village Academy 3.3 / 10 10.6 / 33 20.8 / 66
325 ConneXions Community LeadershipAcademy
19.5 / 31 19.5 / 38
326 City Neighbors Charter School 4.2 / 5 21.7 / 33 6.3 / 11
327 Patterson Park Public Charter 20.5 / 64 25.0 / 98 20.4 / 97
328 Southwest Baltimore Charter 3.1 / 2 4.2 / 5 8.7 / 14
329 Inner Harbor East Academy 3.3 / 6 16.4 / 36 4.6 / 11
330 Northwood Appold Community Acad. .9 / 1 3.6 / 6 5.0 / 10
331 Maryland Academy of Technology &
Health Sciences
22.2 / 24 83.2 / 173
332 The Green School 0.0 / 0.0 0.0 / 0
333 Independence School Local I 0.0 / 0
334 Bluford Drew Jemison MST Academy 10.0 / 13
335 Baltimore International Academy 6.8 / 9432 Coppin Academy .4 / 1
Notes:The incident suspension rate is the number of suspensions divided by the official enrollment.

8/14/2019 042009 Year 2 and 3 Charter Report 090416
http://slidepdf.com/reader/full/042009-year-2-and-3-charter-report-090416 48/67
DREAA Charter School Report 2005-06 through 2007-08 April 2009
40
TEACHER CHARACTERISTICS – HIGHLY QUALIFIED STATUS
NCLB regulations require that teachers in Title I schools be, ‘highly qualified’ for thecourses/classes they teach. Highly qualified status is determined both by the level of
certification and the actual courses/classes taught in a school. At the elementary school level,
charter schools have consistently posted lower proportions of highly qualified teachers than non-
charter schools while K-8 charters have had slightly higher proportions of highly qualified
teachers. Except for the 2007-08 school year, charter middle schools had similar rates to those of
non-charter middle schools. In 2007-08, charter high schools had highly qualified rates of 11
percentage points less than non-charter high schools. As with most other measures the
proportion of highly qualified teachers varies by both school and by schools year. During future
evaluations, DREAA may more closely examine the extent to which highly qualified status is
related to student performance.
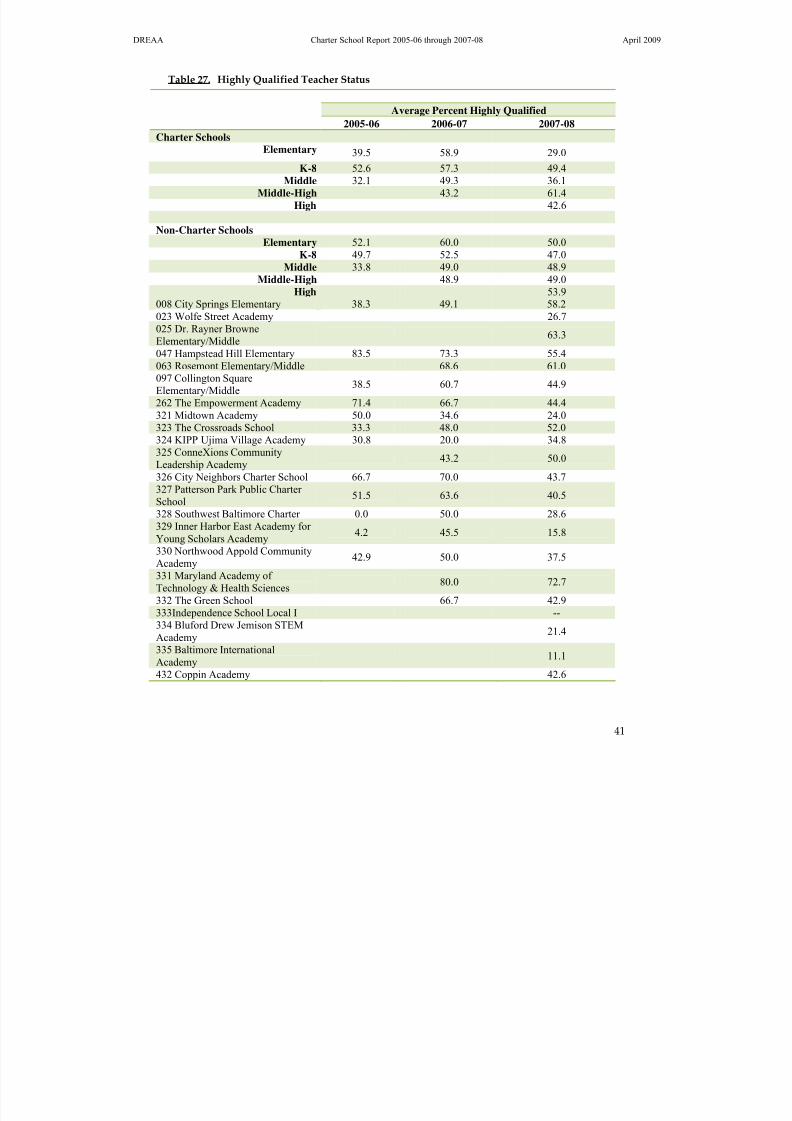
8/14/2019 042009 Year 2 and 3 Charter Report 090416
http://slidepdf.com/reader/full/042009-year-2-and-3-charter-report-090416 49/67
DREAA Charter School Report 2005-06 through 2007-08 April 2009
41
Table 27. Highly Qualified Teacher Status
Average Percent Highly Qualified
2005-06 2006-07 2007-08
Charter Schools
Elementary 39.5 58.9 29.0
K-8 52.6 57.3 49.4Middle 32.1 49.3 36.1
Middle-High 43.2 61.4High 42.6
Non-Charter SchoolsElementary 52.1 60.0 50.0
K-8 49.7 52.5 47.0Middle 33.8 49.0 48.9
Middle-High 48.9 49.0High 53.9
008 City Springs Elementary 38.3 49.1 58.2023 Wolfe Street Academy 26.7025 Dr. Rayner BrowneElementary/Middle
63.3
047 Hampstead Hill Elementary 83.5 73.3 55.4063 Rosemont Elementary/Middle 68.6 61.0097 Collington SquareElementary/Middle
38.5 60.7 44.9
262 The Empowerment Academy 71.4 66.7 44.4321 Midtown Academy 50.0 34.6 24.0323 The Crossroads School 33.3 48.0 52.0324 KIPP Ujima Village Academy 30.8 20.0 34.8325 ConneXions CommunityLeadership Academy
43.2 50.0
326 City Neighbors Charter School 66.7 70.0 43.7327 Patterson Park Public Charter School
51.5 63.6 40.5
328 Southwest Baltimore Charter 0.0 50.0 28.6329 Inner Harbor East Academy for Young Scholars Academy
4.2 45.5 15.8
330 Northwood Appold CommunityAcademy
42.9 50.0 37.5
331 Maryland Academy of Technology & Health Sciences
80.0 72.7
332 The Green School 66.7 42.9333Independence School Local I --334 Bluford Drew Jemison STEMAcademy
21.4
335 Baltimore InternationalAcademy
11.1
432 Coppin Academy 42.6
8/14/2019 042009 Year 2 and 3 Charter Report 090416
http://slidepdf.com/reader/full/042009-year-2-and-3-charter-report-090416 50/67
DREAA Charter School Report 2005-06 through 2007-08 April 2009
42
SUMMARY
The first three years of charter school operation in Baltimore have been marked by increases in
both the number of schools and the number and proportion of all City Schools students enrolled
in them. The enhanced levels of parent, student, and staff perception of the district’s charter
schools; the comparatively higher rates of attendance; and the higher levels of re-enrollment
provide evidence of, and justification for, the overall levels of satisfaction with the schools.
Charter schools exhibit variation in many of the student outcome measures included in this
report. Data indicate that some schools are experiencing high levels of success in maintaining or
improving the levels of student performance on the MSAs and HSAs while others struggle to
close the gap with non-charter schools on some measures. Such variations in performance—
coupled with the great expansion in the number of these schools—make it difficult to speak of
charter schools as a monolithic entity. Thus, it may now become more meaningful to look at
schools individually as occurs at initial application and at contract renewal. Contract renewal
requires that schools present information about their performance during the contract period and
allows for the School Board to judge whether each school, individually, has met performance
expectations.
This report has provided a comprehensive but somewhat limited view of charter school
performance. As indicated many times during the report, there are areas of charter school
operations and outcomes that may be explored during future school years, e.g., a more in-depth
look at the enrollment and performance of students eligible for special education services.
Beginning in 2008-09, DREAA will receive information about students who apply to attend
charter schools. Such information will allow greater insight into charter school selection and
enrollment processes. Another interesting area for future research will be to examine the
progress of students who complete 8th grade in charter K-8 or middle schools and continue to
other City high schools. Future research may examine the extent to which charter school
students exhibit different levels of performance during high school.
When charter schools became part of the City Schools’ portfolio, choice was a limited option for
many parents. In the several years since the first schools were charters, City Schools has become
a system of choice. Thus, what it meant to be a charter four years ago is quite different from
what it means to be a charter now. This will be the research mandate for the future.
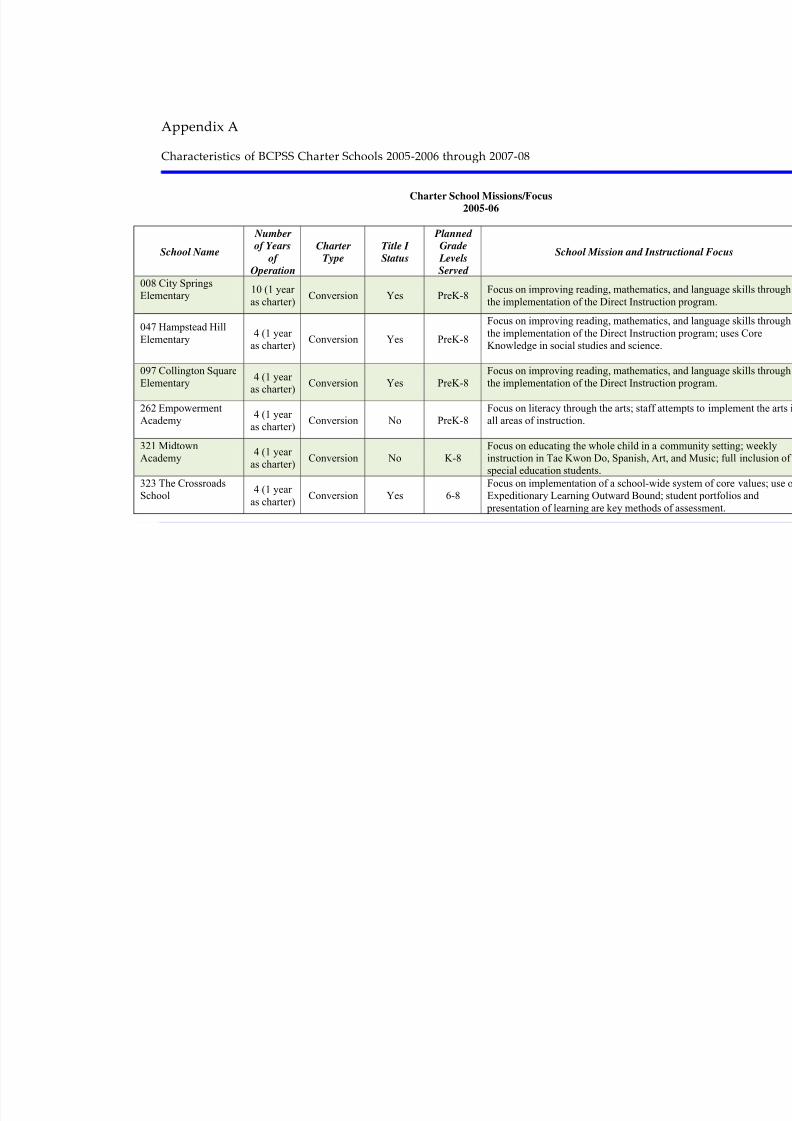
8/14/2019 042009 Year 2 and 3 Charter Report 090416
http://slidepdf.com/reader/full/042009-year-2-and-3-charter-report-090416 51/67
Appendix A
Characteristics of BCPSS Charter Schools 2005‐2006 through 2007‐08
Charter School Missions/Focus2005-06
School Name
Number of Years
of
Operation
Charter
Type
Title I
Status
Planned Grade
Levels
Served
School Mission and Ins
008 City Springs
Elementary10 (1 year as charter) Conversion Yes PreK-8
Focus on improving reading, mathematithe implementation of the Direct Instruc
047 Hampstead HillElementary
4 (1 year as charter)
Conversion Yes PreK-8
Focus on improving reading, mathematithe implementation of the Direct InstrucKnowledge in social studies and science
097 Collington SquareElementary
4 (1 year as charter)
Conversion Yes PreK-8Focus on improving reading, mathematithe implementation of the Direct Instruc
262 EmpowermentAcademy
4 (1 year as charter)
Conversion No PreK-8Focus on literacy through the arts; staff all areas of instruction.
321 MidtownAcademy
4 (1 year as charter)
Conversion No K-8Focus on educating the whole child in ainstruction in Tae Kwon Do, Spanish, Aspecial education students.
323 The CrossroadsSchool
4 (1 year as charter)
Conversion Yes 6-8Focus on implementation of a school-wExpeditionary Learning Outward Bound presentation of learning are key method

8/14/2019 042009 Year 2 and 3 Charter Report 090416
http://slidepdf.com/reader/full/042009-year-2-and-3-charter-report-090416 52/67
DREAA Charter School Report 2005-06 through 2007-08 April 2009
School Name
Number
of Years
of
Operation
Charter
Type
Title I
Status
Planned
Grade
Levels
Served
School Mission and Ins
324 Kipp UjimaVillage Academy
5 (1 year
as charter)
Conversion Yes 5-8Focus on preparing students to attend ri preparing for college; emphasis on disci
development.326 City NeighborsCharter School 1
Wholly New
No K-8Experiential, project-based learning witintegration of instruction across content
327 Patterson Park Public Charter School 1
Wholly New
No K-8Character education and development ouse of project-based curriculum and inq
328 SouthwestBaltimore Charter 1
Wholly New
No K-8Focus on experiential learning; school-wInstruction Plans for all students to imprinstruction.
329 Inner Harbor EastAcademy for YoungScholars Academy 1
Wholly New Yes K-8
Extension of Sojourner-Douglass Colleg
community development, and student em
330 NorthwoodAppold CommunityAcademy
1Wholly New
No K-8Regular integration of African Americanlessons; focus on the Freedom and DemVincent Harding.
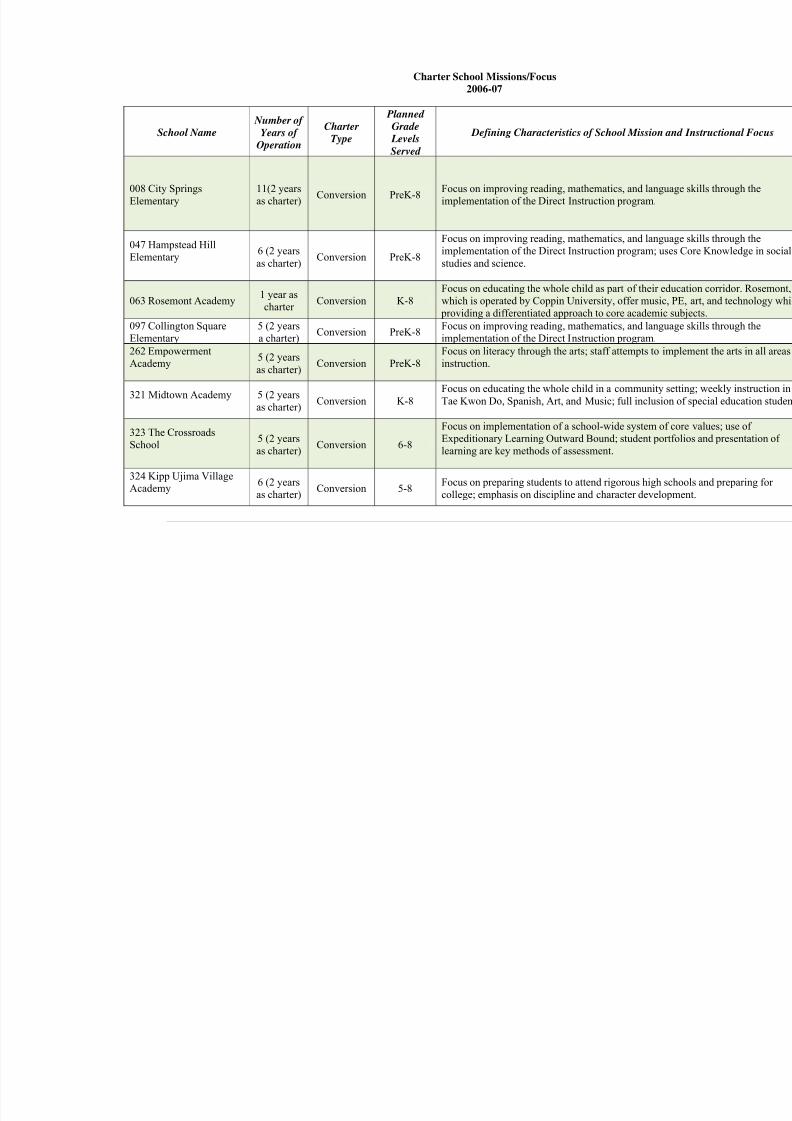
8/14/2019 042009 Year 2 and 3 Charter Report 090416
http://slidepdf.com/reader/full/042009-year-2-and-3-charter-report-090416 53/67
Charter School Missions/Focus2006-07
School Name Number of
Years of
Operation
Charter
Type
Planned
Grade
Levels
Served
Defining Characteristics of School Mission
008 City SpringsElementary
11(2 yearsas charter)
Conversion PreK-8Focus on improving reading, mathematics, and lanimplementation of the Direct Instruction program.
047 Hampstead HillElementary
6 (2 yearsas charter)
Conversion PreK-8
Focus on improving reading, mathematics, and lanimplementation of the Direct Instruction program;studies and science.
063 Rosemont Academy 1 year ascharter
Conversion K-8
Focus on educating the whole child as part of their
which is operated by Coppin University, offer mus providing a differentiated approach to core academ
097 Collington SquareElementary
5 (2 yearsa charter)
Conversion PreK-8Focus on improving reading, mathematics, and lanimplementation of the Direct Instruction program.
262 EmpowermentAcademy
5 (2 yearsas charter)
Conversion PreK-8Focus on literacy through the arts; staff attempts toinstruction.
321 Midtown Academy 5 (2 yearsas charter)
Conversion K-8Focus on educating the whole child in a communitTae Kwon Do, Spanish, Art, and Music; full inclus
323 The Crossroads
School5 (2 yearsas charter) Conversion 6-8
Focus on implementation of a school-wide systemExpeditionary Learning Outward Bound; student plearning are key methods of assessment.
324 Kipp Ujima VillageAcademy
6 (2 yearsas charter)
Conversion 5-8Focus on preparing students to attend rigorous highcollege; emphasis on discipline and character deve
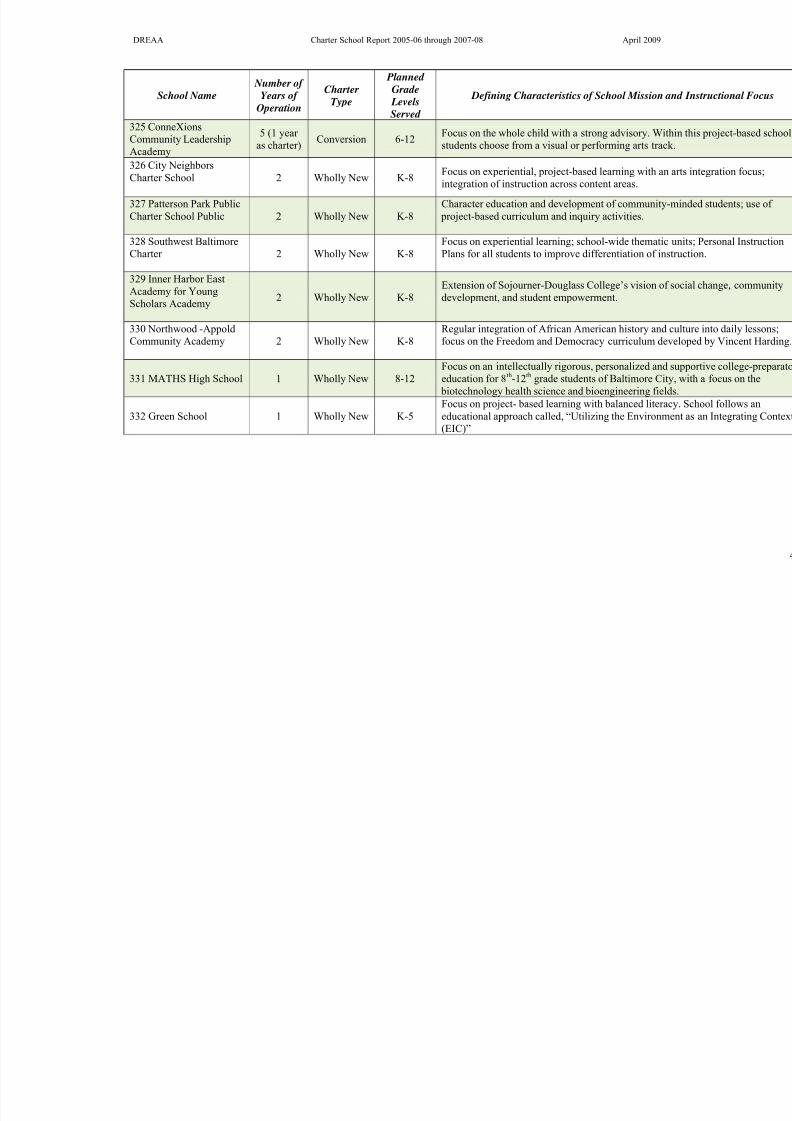
8/14/2019 042009 Year 2 and 3 Charter Report 090416
http://slidepdf.com/reader/full/042009-year-2-and-3-charter-report-090416 54/67
DREAA Charter School Report 2005-06 through 2007-08 April 2009
School Name
Number of
Years of
Operation
Charter
Type
Planned
Grade
Levels
Served
Defining Characteristics of School Mission
325 ConneXionsCommunity Leadership
Academy
5 (1 year
as charter)
Conversion 6-12Focus on the whole child with a strong advisory. W
students choose from a visual or performing arts tr
326 City NeighborsCharter School 2 Wholly New K-8
Focus on experiential, project-based learning with integration of instruction across content areas.
327 Patterson Park PublicCharter School Public 2 Wholly New K-8
Character education and development of communi project-based curriculum and inquiry activities.
328 Southwest BaltimoreCharter 2 Wholly New K-8
Focus on experiential learning; school-wide themaPlans for all students to improve differentiation of
329 Inner Harbor East
Academy for YoungScholars Academy 2 Wholly New K-8
Extension of Sojourner-Douglass College’s vision
development, and student empowerment.
330 Northwood -AppoldCommunity Academy 2 Wholly New K-8
Regular integration of African American history anfocus on the Freedom and Democracy curriculum
331 MATHS High School 1 Wholly New 8-12Focus on an intellectually rigorous, personalized aeducation for 8th-12th grade students of Baltimore C biotechnology health science and bioengineering f
332 Green School 1 Wholly New K-5Focus on project- based learning with balanced liteeducational approach called, “Utilizing the Environ(EIC)”
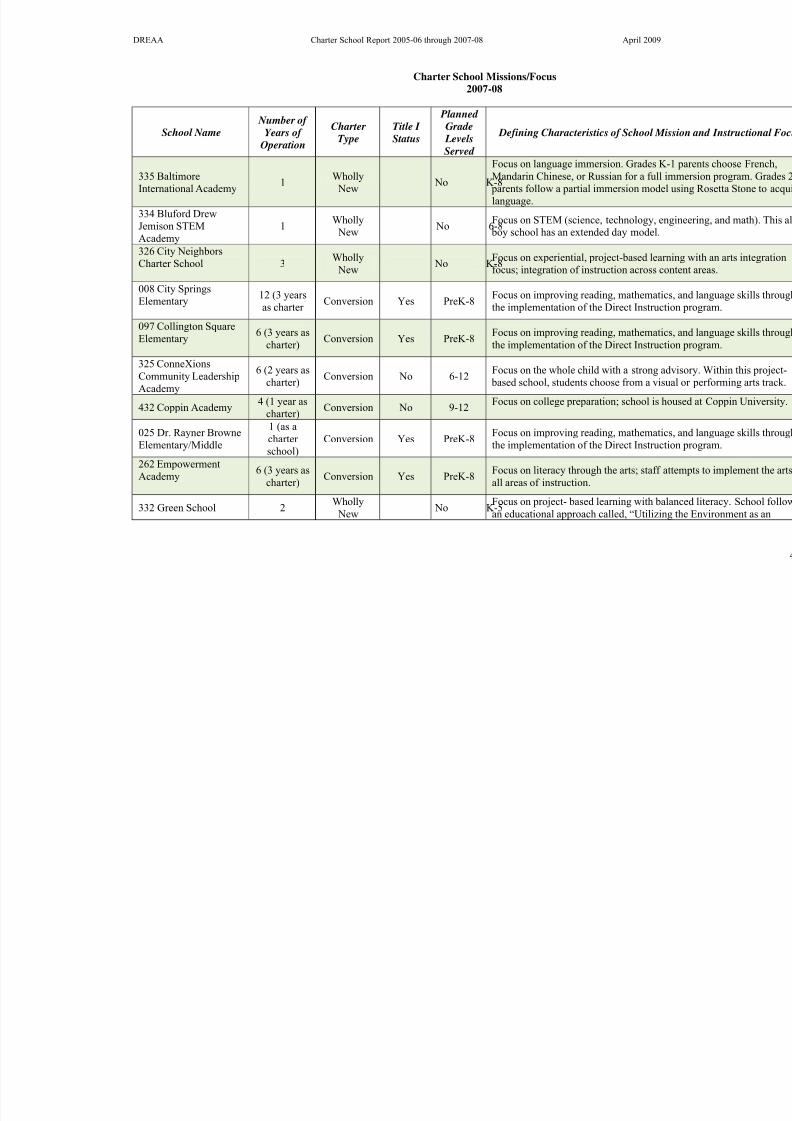
8/14/2019 042009 Year 2 and 3 Charter Report 090416
http://slidepdf.com/reader/full/042009-year-2-and-3-charter-report-090416 55/67
DREAA Charter School Report 2005-06 through 2007-08 April 2009
Charter School Missions/Focus2007-08
School Name Number of
Years of
Operation
Charter
Type
Title I
Status
Planned
Grade
Levels
Served
Defining Characteristics of School M
335 BaltimoreInternational Academy
1Wholly New
No K-8
Focus on language immersion. Grades Mandarin Chinese, or Russian for a ful parents follow a partial immersion modlanguage.
334 Bluford DrewJemison STEMAcademy
1Wholly New
No 6-8Focus on STEM (science, technology, boy school has an extended day model
326 City NeighborsCharter School 3
Wholly New
No K-8Focus on experiential, project-based lefocus; integration of instruction across
008 City SpringsElementary 12 (3 years
as charter Conversion Yes PreK-8 Focus on improving reading, mathema
the implementation of the Direct Instru
097 Collington SquareElementary
6 (3 years ascharter)
Conversion Yes PreK-8Focus on improving reading, mathemathe implementation of the Direct Instru
325 ConneXionsCommunity LeadershipAcademy
6 (2 years ascharter)
Conversion No 6-12Focus on the whole child with a strong based school, students choose from a v
432 Coppin Academy4 (1 year as
charter)Conversion No 9-12
Focus on college preparation; school is
025 Dr. Rayner Browne
Elementary/Middle
1 (as acharter school)
Conversion Yes PreK-8Focus on improving reading, mathema
the implementation of the Direct Instru
262 EmpowermentAcademy
6 (3 years ascharter)
Conversion Yes PreK-8Focus on literacy through the arts; stafall areas of instruction.
332 Green School 2Wholly New
No K-5Focus on project- based learning with ban educational approach called, “Utiliz

8/14/2019 042009 Year 2 and 3 Charter Report 090416
http://slidepdf.com/reader/full/042009-year-2-and-3-charter-report-090416 56/67
DREAA Charter School Report 2005-06 through 2007-08 April 2009
School Name
Number of
Years of
Operation
Charter
Type
Title I
Status
Planned
Grade
Levels
Served
Defining Characteristics of School M
Integrating Context (EIC)”
047 Hampstead Hill
Elementary 6 (3 years ascharter)
Conversion Yes PreK-8
Focus on improving reading, mathema
the implementation of the Direct InstruKnowledge in social studies and scienc
333 IndependenceSchool Local I
2 (1 year ascharter)
Wholly New
(createdfrom a
program)
No 9-12
Focus on authentic learning through thone mind at a time; and providing a forstrong social identity with respect to thIndependence students also learn the p
329 Inner Harbor EastAcademy for YoungScholars Academy
3Wholly New
Yes K-8Extension of Sojourner-Douglass Collecommunity development, and student e
323 KIPP UjimaVillage Academy 7 (3 years as
charter)Conversion Yes 5-8 Focus on preparing students to attend r
preparing for college; emphasis on disc
331 MATHS HighSchool
2Wholly New
No 6-12Focus on an intellectually rigorous, per preparatory education for 8th-12th gradea focus on the biotechnology health sc
321 Midtown Academy 6 (3 years ascharter)
Conversion No K-8
Focus on educating the whole child in instruction in Tae Kwon Do, Spanish, Aspecial education students.
330 Northwood-AppoldCommunity Academy 3
Wholly New
No K-8Regular integration of African Americlessons; focus on the Freedom and DemVincent Harding.
327 Patterson Park Public Charter School 3
Wholly New
Yes K-8Focus on character education and devestudents; use of project-based curriculu
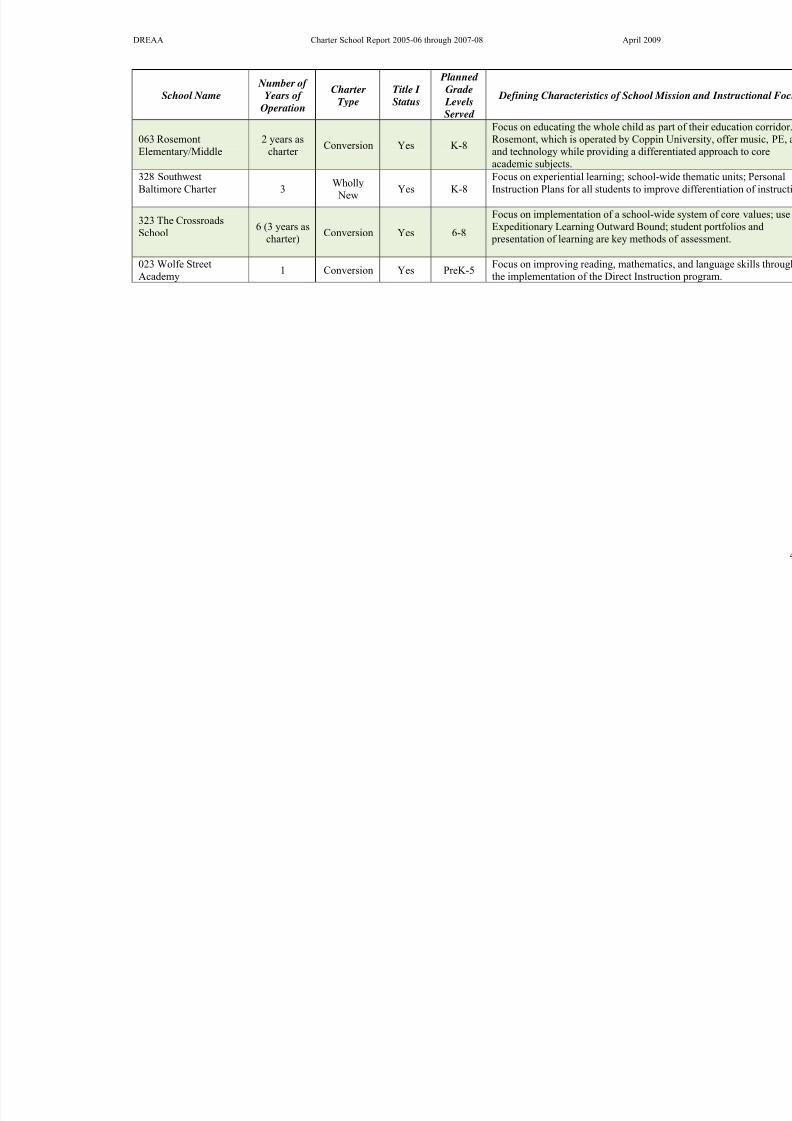
8/14/2019 042009 Year 2 and 3 Charter Report 090416
http://slidepdf.com/reader/full/042009-year-2-and-3-charter-report-090416 57/67
DREAA Charter School Report 2005-06 through 2007-08 April 2009
School Name
Number of
Years of
Operation
Charter
Type
Title I
Status
Planned
Grade
Levels
Served
Defining Characteristics of School M
063 Rosemont
Elementary/Middle
2 years as
charter Conversion Yes K-8
Focus on educating the whole child as Rosemont, which is operated by Coppi
and technology while providing a diffeacademic subjects.
328 SouthwestBaltimore Charter 3
Wholly New
Yes K-8Focus on experiential learning; school-Instruction Plans for all students to imp
323 The CrossroadsSchool
6 (3 years ascharter)
Conversion Yes 6-8
Focus on implementation of a school-wExpeditionary Learning Outward Boun presentation of learning are key metho
023 Wolfe StreetAcademy
1 Conversion Yes PreK-5Focus on improving reading, mathemathe implementation of the Direct Instru
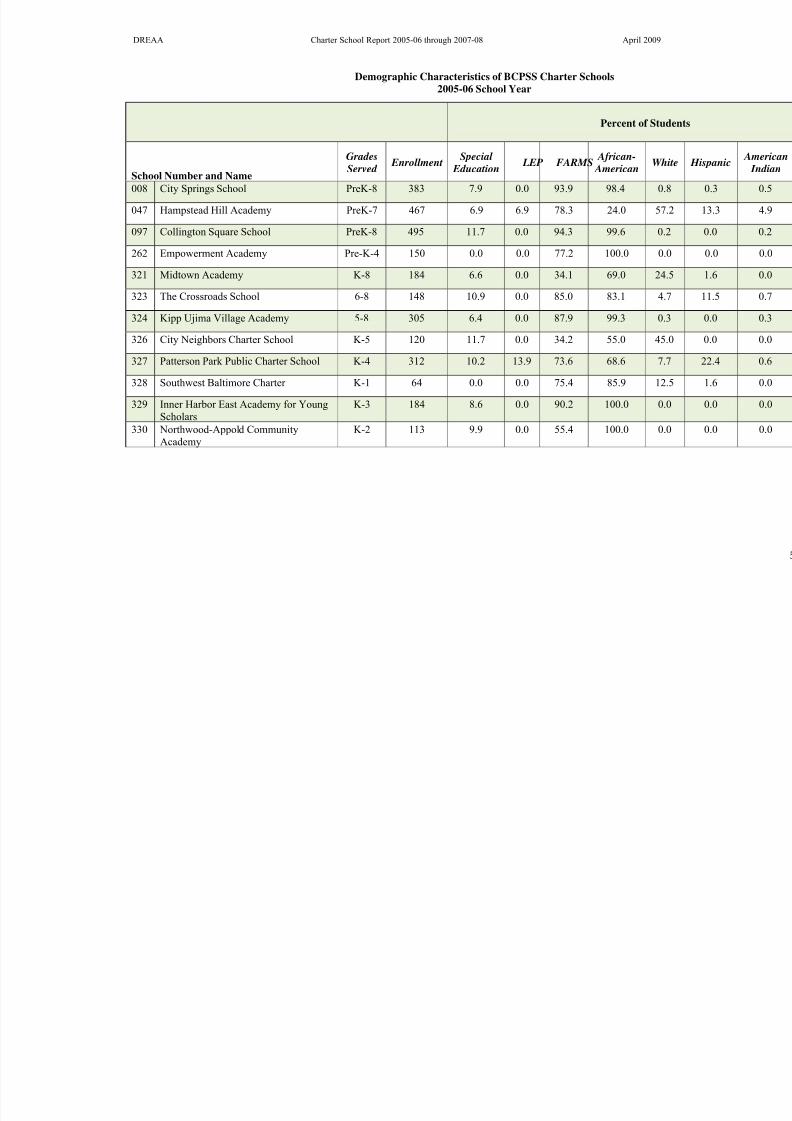
8/14/2019 042009 Year 2 and 3 Charter Report 090416
http://slidepdf.com/reader/full/042009-year-2-and-3-charter-report-090416 58/67
DREAA Charter School Report 2005-06 through 2007-08 April 2009
Demographic Characteristics of BCPSS Charter Schools2005-06 School Year
Percent of St
School Number and Name
Grades
Served Enrollment
Special
Education LEP FARMS
African-
AmericanW
008 City Springs School PreK-8 383 7.9 0.0 93.9 98.4
047 Hampstead Hill Academy PreK-7 467 6.9 6.9 78.3 24.0 5
097 Collington Square School PreK-8 495 11.7 0.0 94.3 99.6
262 Empowerment Academy Pre-K-4 150 0.0 0.0 77.2 100.0
321 Midtown Academy K-8 184 6.6 0.0 34.1 69.0 2
323 The Crossroads School 6-8 148 10.9 0.0 85.0 83.1
324 Kipp Ujima Village Academy 5-8 305 6.4 0.0 87.9 99.3
326 City Neighbors Charter School K-5 120 11.7 0.0 34.2 55.0 4
327 Patterson Park Public Charter School K-4 312 10.2 13.9 73.6 68.6
328 Southwest Baltimore Charter K-1 64 0.0 0.0 75.4 85.9 1
329 Inner Harbor East Academy for YoungScholars
K-3 184 8.6 0.0 90.2 100.0
330 Northwood-Appold Community
Academy
K-2 113 9.9 0.0 55.4 100.0
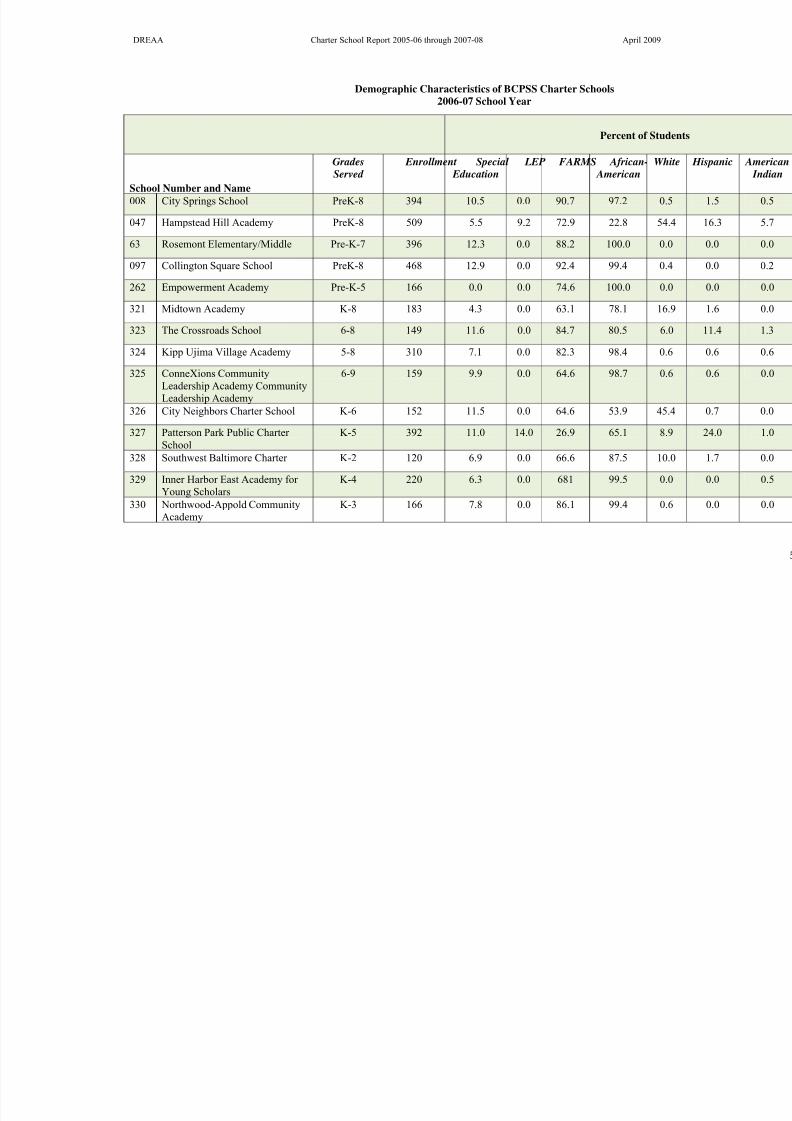
8/14/2019 042009 Year 2 and 3 Charter Report 090416
http://slidepdf.com/reader/full/042009-year-2-and-3-charter-report-090416 59/67
DREAA Charter School Report 2005-06 through 2007-08 April 2009
Demographic Characteristics of BCPSS Charter Schools2006-07 School Year
Percent of St
School Number and Name
Grades
Served
Enrollment Special
Education
LEP FARMS African-
American
W
008 City Springs School PreK-8 394 10.5 0.0 90.7 97.2
047 Hampstead Hill Academy PreK-8 509 5.5 9.2 72.9 22.8
63 Rosemont Elementary/Middle Pre-K-7 396 12.3 0.0 88.2 100.0
097 Collington Square School PreK-8 468 12.9 0.0 92.4 99.4
262 Empowerment Academy Pre-K-5 166 0.0 0.0 74.6 100.0
321 Midtown Academy K-8 183 4.3 0.0 63.1 78.1
323 The Crossroads School 6-8 149 11.6 0.0 84.7 80.5
324 Kipp Ujima Village Academy 5-8 310 7.1 0.0 82.3 98.4
325 ConneXions CommunityLeadership Academy CommunityLeadership Academy
6-9 159 9.9 0.0 64.6 98.7
326 City Neighbors Charter School K-6 152 11.5 0.0 64.6 53.9
327 Patterson Park Public Charter
School
K-5 392 11.0 14.0 26.9 65.1
328 Southwest Baltimore Charter K-2 120 6.9 0.0 66.6 87.5
329 Inner Harbor East Academy for Young Scholars
K-4 220 6.3 0.0 681 99.5
330 Northwood-Appold CommunityAcademy
K-3 166 7.8 0.0 86.1 99.4

8/14/2019 042009 Year 2 and 3 Charter Report 090416
http://slidepdf.com/reader/full/042009-year-2-and-3-charter-report-090416 60/67
DREAA Charter School Report 2005-06 through 2007-08 April 2009
Percent of St
School Number and Name
Grades
Served
Enrollment Special
Education
LEP FARMS African-
American
W
331 Maryland Academy of Technology and Health Sciences
8 108 9.7 0.0 63.1 100.0
332 The Green School of Baltimore K-2 54 0.0 0.0 63.1 38.9
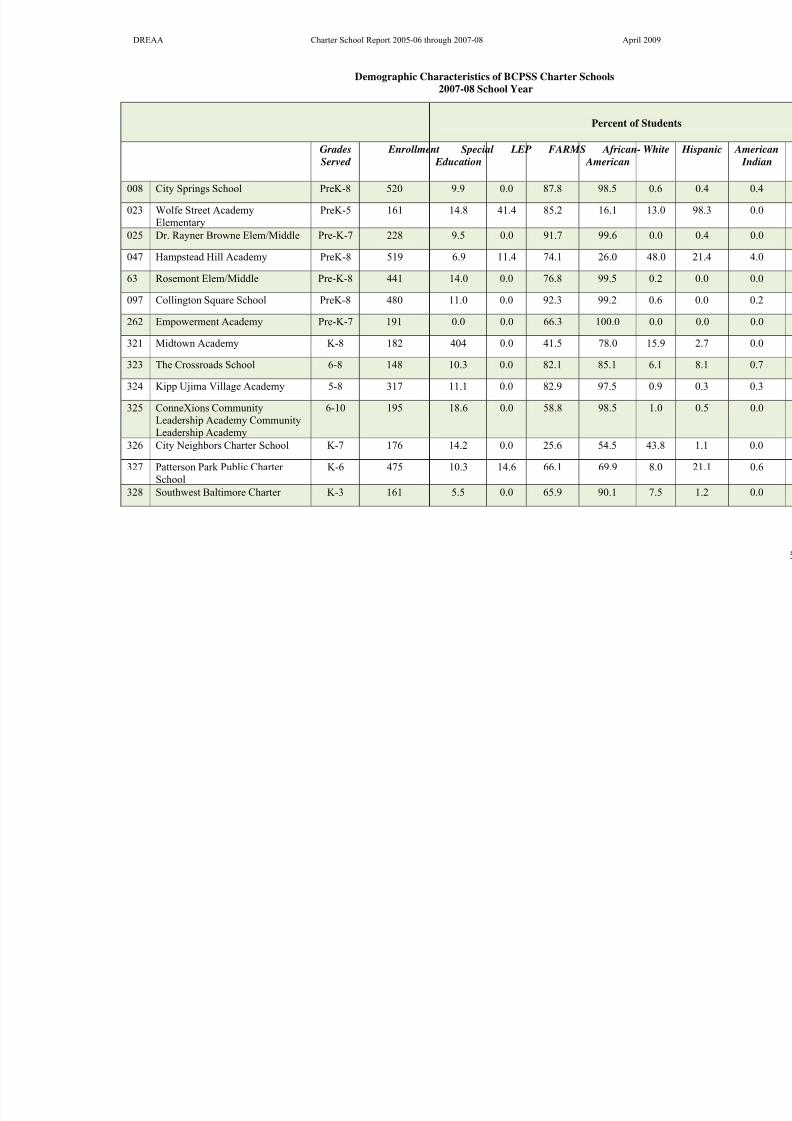
8/14/2019 042009 Year 2 and 3 Charter Report 090416
http://slidepdf.com/reader/full/042009-year-2-and-3-charter-report-090416 61/67
DREAA Charter School Report 2005-06 through 2007-08 April 2009
Demographic Characteristics of BCPSS Charter Schools2007-08 School Year
Percent of Stud
GradesServed
Enrollment Special Education
LEP FARMS African- American
Wh
008 City Springs School PreK-8 520 9.9 0.0 87.8 98.5 0.
023 Wolfe Street AcademyElementary
PreK-5 161 14.8 41.4 85.2 16.1 13
025 Dr. Rayner Browne Elem/Middle Pre-K-7 228 9.5 0.0 91.7 99.6 0.
047 Hampstead Hill Academy PreK-8 519 6.9 11.4 74.1 26.0 48
63 Rosemont Elem/Middle Pre-K-8 441 14.0 0.0 76.8 99.5 0.
097 Collington Square School PreK-8 480 11.0 0.0 92.3 99.2 0.
262 Empowerment Academy Pre-K-7 191 0.0 0.0 66.3 100.0 0.
321 Midtown Academy K-8 182 404 0.0 41.5 78.0 15
323 The Crossroads School 6-8 148 10.3 0.0 82.1 85.1 6.
324 Kipp Ujima Village Academy 5-8 317 11.1 0.0 82.9 97.5 0.
325 ConneXions CommunityLeadership Academy CommunityLeadership Academy
6-10 195 18.6 0.0 58.8 98.5 1.
326 City Neighbors Charter School K-7 176 14.2 0.0 25.6 54.5 43
327 Patterson Park Public Charter School
K-6 475 10.3 14.6 66.1 69.9 8.
328 Southwest Baltimore Charter K-3 161 5.5 0.0 65.9 90.1 7.
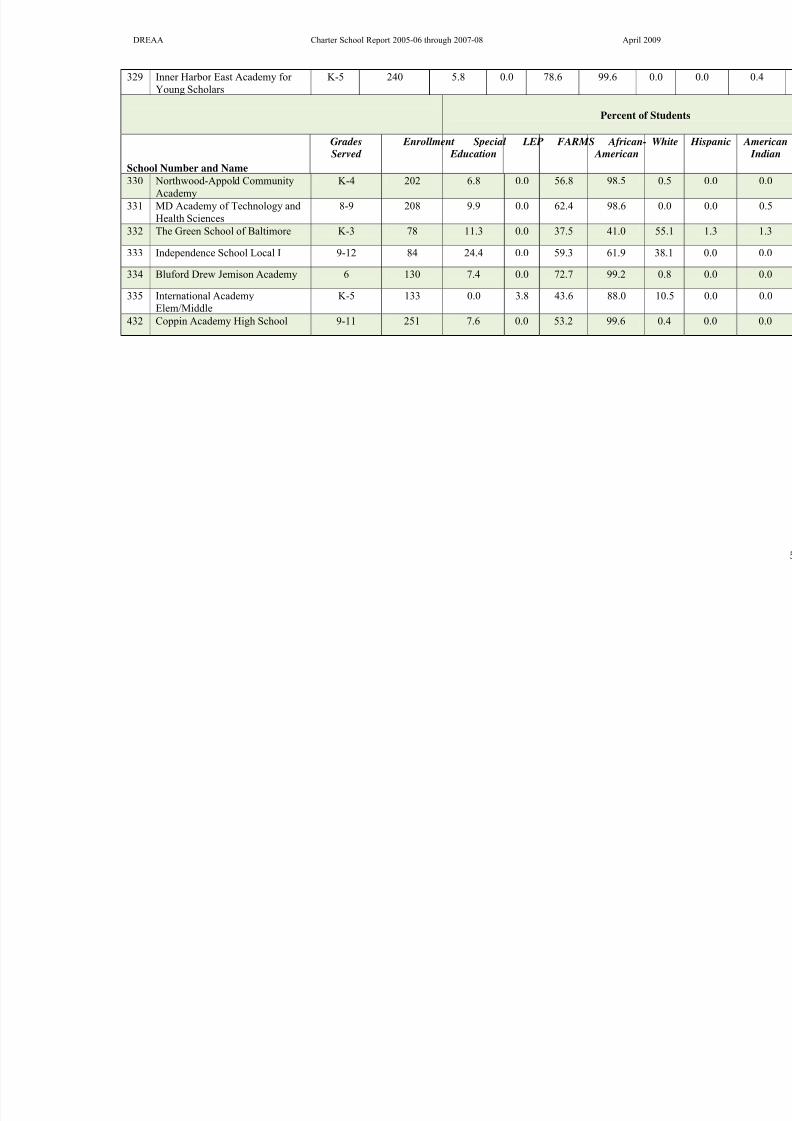
8/14/2019 042009 Year 2 and 3 Charter Report 090416
http://slidepdf.com/reader/full/042009-year-2-and-3-charter-report-090416 62/67
DREAA Charter School Report 2005-06 through 2007-08 April 2009
329 Inner Harbor East Academy for Young Scholars
K-5 240 5.8 0.0 78.6 99.6 0.
Percent of St
School Number and Name
GradesServed
Enrollment Special Education
LEP FARMS African- American
W
330 Northwood-Appold CommunityAcademy
K-4 202 6.8 0.0 56.8 98.5
331 MD Academy of Technology andHealth Sciences
8-9 208 9.9 0.0 62.4 98.6
332 The Green School of Baltimore K-3 78 11.3 0.0 37.5 41.0 5
333 Independence School Local I 9-12 84 24.4 0.0 59.3 61.9 3
334 Bluford Drew Jemison Academy 6 130 7.4 0.0 72.7 99.2
335 International AcademyElem/Middle
K-5 133 0.0 3.8 43.6 88.0 1
432 Coppin Academy High School 9-11 251 7.6 0.0 53.2 99.6
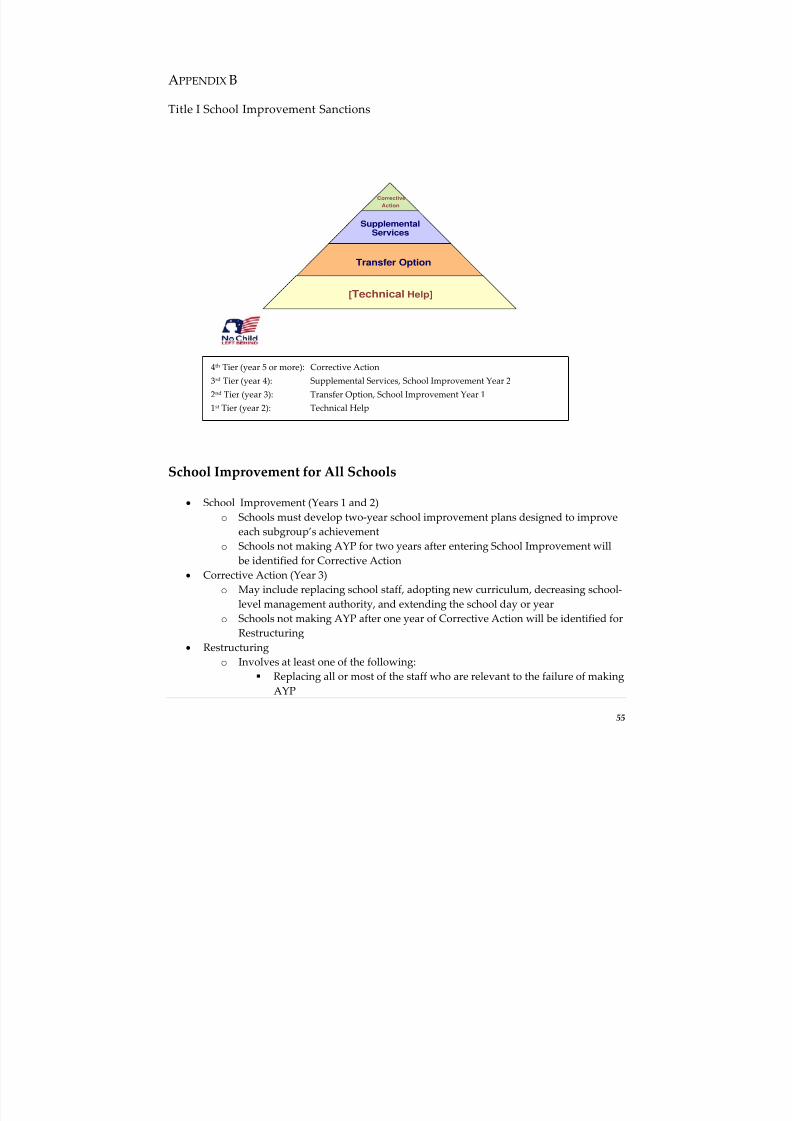
8/14/2019 042009 Year 2 and 3 Charter Report 090416
http://slidepdf.com/reader/full/042009-year-2-and-3-charter-report-090416 63/67
55
APPENDIX B
Title I School Improvement Sanctions
School Improvement for All Schools
• School Improvement (Years 1 and 2)
o Schools must develop two‐year school improvement plans designed to improve
each subgroup’s achievement
o Schools not making AYP for two years after entering School Improvement will
be identified for Corrective Action
• Corrective Action (Year 3)
o May include replacing school staff, adopting new curriculum, decreasing school‐
level management authority, and extending the school day or year
o Schools not making AYP after one year of Corrective Action will be identified for
Restructuring
• Restructuring
o Involves at least one of the following:
Replacing all or most of the staff who are relevant to the failure of making
AYP
4th Tier (year 5 or more): Corrective Action
3rd Tier (year 4): Supplemental Services, School Improvement Year 2
2nd Tier (year 3): Transfer Option, School Improvement Year 1
1st Tier (year 2): Technical Help
Transfer Option
SupplementalServices
[Technical Help]
Corrective
Action

8/14/2019 042009 Year 2 and 3 Charter Report 090416
http://slidepdf.com/reader/full/042009-year-2-and-3-charter-report-090416 64/67
DREAA Charter School Report 2005-06 through 2007-08 April 2009
56
Contracting with a management company to operate the school
Reopening schools as a public charter school
Other major restructuring actions that involve significant changes to
staffing and governance
APPENDIX C ‐ COMPUTATION OF MSA PROFICIENCY LEVEL GAINS
The gains in MSA proficiency level in Table 17 were derived by first coding of MSA proficiency level
scores as follows:
1=Basic
2=Proficient
3=Advanced.
These encoded proficiency levels were then summed (yielding a composite score ranging from 2-6) and
then recoded thus:
2, 3→ 1
4 → 2
5, 6→ 3.
Students who increased this resulting composite proficiency level between two sequential years are coded
as moving up; students who reduced their composite proficiency level are coded as moving down;students who remained at the same level are coded as unchanged, unless they were a 3 in both years, in
which case they were coded as moving up.
Although this approach may appear to be fairly crude, it was compared with several other approaches, and
they all produced roughly similar results. Therefore, it seems fair to conclude that it is a fairly reliable
measure of student-level growth. Perhaps its most serious weakness is that it treats students maintaining
highest level proficiency as moving up, and consequently biases results in favor of schools serving
students who are performing higher before they even enter the school.
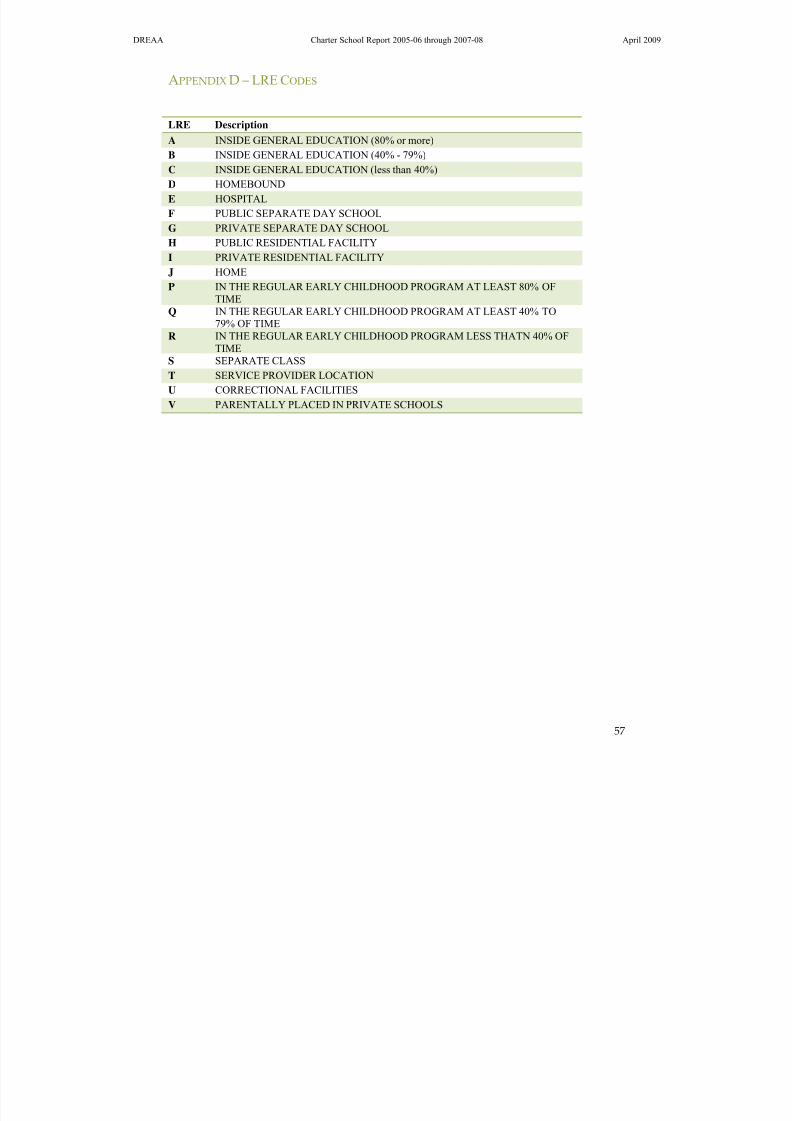
8/14/2019 042009 Year 2 and 3 Charter Report 090416
http://slidepdf.com/reader/full/042009-year-2-and-3-charter-report-090416 65/67
DREAA Charter School Report 2005-06 through 2007-08 April 2009
57
APPENDIX D – LRE CODES
LRE Description
A INSIDE GENERAL EDUCATION (80% or more)
B INSIDE GENERAL EDUCATION (40% - 79%)
C INSIDE GENERAL EDUCATION (less than 40%)
D HOMEBOUND
E HOSPITAL
F PUBLIC SEPARATE DAY SCHOOL
G PRIVATE SEPARATE DAY SCHOOL
H PUBLIC RESIDENTIAL FACILITY
I PRIVATE RESIDENTIAL FACILITY
J HOME
P IN THE REGULAR EARLY CHILDHOOD PROGRAM AT LEAST 80% OF
TIMEQ IN THE REGULAR EARLY CHILDHOOD PROGRAM AT LEAST 40% TO
79% OF TIME
R IN THE REGULAR EARLY CHILDHOOD PROGRAM LESS THATN 40% OFTIME
S SEPARATE CLASS
T SERVICE PROVIDER LOCATION
U CORRECTIONAL FACILITIES
V PARENTALLY PLACED IN PRIVATE SCHOOLS

8/14/2019 042009 Year 2 and 3 Charter Report 090416
http://slidepdf.com/reader/full/042009-year-2-and-3-charter-report-090416 66/67
8/14/2019 042009 Year 2 and 3 Charter Report 090416
http://slidepdf.com/reader/full/042009-year-2-and-3-charter-report-090416 67/67
Baltimore City Public Schools
Board of School Commissioners
Brian D. Morris, Board Chair
Jerrelle Francois , Board Vice-Chair
Anirban Basu
James W. Campbell
Neil E. Duke
David Stone
Robert Heck
Maxine Johnson Wood
George M. VanHook, Sr.
Mitchell Generette, Student Commissioner
Andrés A. Alonso, Ed.D.
Chief Executive Officer
Baltimore City Public Schools offer equal employment and educational opportunities for all, regardless
of race, religion, color, age, sexual orientation, national origin, handicapping condition, veteran’s status
or any other occupationally irrelevant criteria.