05 15 2012 baml conference final version for posting
TRANSCRIPT

Bank of America-Merrill Lynch
Global Metals and Mining Conference
Tuesday, May 15, 2012
Newmont Mining Corporation | Bank of America-Merrill Lynch Global Mining & Metals Conference | www.newmont.com May 15, 2012 2
Cautionary Statement
Cautionary Statement Regarding Forward Looking Statements, Including 2012 Outlook:
This presentation contains “forward-looking statements” within the meaning of Section 27A of the Securities Act of 1933, as amended, and Section 21E of the Securities Exchange Act of 1934,
as amended, which are intended to be covered by the safe harbor created by those sections and other applicable laws. Those forward-looking statements include (without limitation) estimates
and expectations of, and statements regarding: (i) the Company‟s strategy and plans; (ii) future equity gold and equity copper production; (iii) future operating, sales and other costs; (iv) future
capital expenditures; (v) project returns; (vi) project start dates, ramp up, life, pipeline timelines, including commencement of mining, drilling and stage gate advancement and expansion
opportunities; (vii) potential ounces or tons of reserves, NRM and potential resources; (viii) exploration pipeline, potential or upside, opportunities, growth and growth potential; (ix) dividend
payments and increases; (x) future liquidity, cash and balance sheet expectations; and (xi) other financial outlook indicators relation to the Company‟s operations and projects. Those forward-
looking statements include (without limitation) statements that use forward-looking terminology such as “may”, “will”, “expect”, “predict”, “anticipate”, “believe”, “continue”, “potential”, “target”,
“goal”, “opportunity”, “outlook”, or the negative or other variations of those terms or comparable terminology. Estimates or expectations of future events or results are based upon certain
assumptions, which may prove to be incorrect. Those assumptions include (without limitation): (i) there being no significant change to current geotechnical, metallurgical, hydrological and other
physical conditions; (ii) permitting, development, operations and expansion of the Company‟s projects being consistent with current expectations and mine plans; (iii) political, social and legal
developments in any jurisdiction in which the Company conducts business being consistent with its current expectations; (iv) certain exchange rate assumptions for the Australian dollar to the
U.S. dollar, as well as the other exchange rates being approximately consistent with current levels; (v) certain price assumptions for gold, copper and oil; (vi) prices for key supplies being
approximately consistent with current levels and such supplies otherwise being available on bases consistent with the Company‟s current expectations; and (vii) the accuracy of our current
mineral reserve and mineral resource estimates and exploration information. Where the Company expresses or implies an expectation or belief as to future events or results, that expectation
or belief is expressed in good faith and is believed to have a reasonable basis. However, forward-looking statements are subject to risks, uncertainties and other factors that could cause actual
results to differ materially from future results expressed, projected or implied by the “forward-looking statements”. Those risks, uncertainties and other factors include (without limitation): (i) gold
and other metals price volatility; (ii) currency fluctuations; (iii) increased capital and operating costs, and scarcity of and competition for required labor and supplies; (iv) variances in oregrade or
recovery rates from those assumed in mining plans; (v) operating or technical difficulties; (vi) political and operational risks; (vii) community relations, conflict resolution and outcome of projects
or oppositions; and (viii) governmental regulation and judicial outcomes. For a more detailed discussion of such risks and other factors, see the Company‟s 2011 Annual Report on Form 10-K,
filed on February 24, 2012, with the Securities and Exchange Commission (“SEC”), as well as the Company‟s other SEC filings. These forward-looking statements are not guarantees of future
performance, given that they involve risks and uncertainties. The Company does not undertake any obligation to release publicly revisions to any forward-looking statement except as may be
required under applicable securities laws. Investors should not assume that any lack of update to a previously issued forward-looking statement constitutes a reaffirmation of that statement.
Continued reliance on forward-looking statements is at investors' own risk. In addition, some of the statements in this presentation are based on assumptions or methodologies (such as
commodity prices) or subject to cautionary statements that are discussed in the notes found at the end of this presentation.
Cautionary Note to U.S. Investors -The United States Securities and Exchange Commission permits U.S. mining companies, in their filings with the SEC, to disclose only those mineral
deposits that a company can economically and legally extract or produce in accordance with Industry Guide 7. We use certain terms on this presentation, such as “measured,” “indicated,” and
“inferred” resources, which the SEC guidelines prohibit U.S. registered companies from including in their filings with the SEC. U.S. Investors are urged to consider closely the disclosure in our
Form 10- K, which may be found on our website or the SEC‟s website http://www.sec.gov/edgar.shtml.

Newmont Mining Corporation | Bank of America-Merrill Lynch Global Mining & Metals Conference | www.newmont.com May 15, 2012 3
Building on Strong Operating Performance Newmont Offers a Compelling Combination of Growth, Returns and Exploration Upside
Attributable Basis
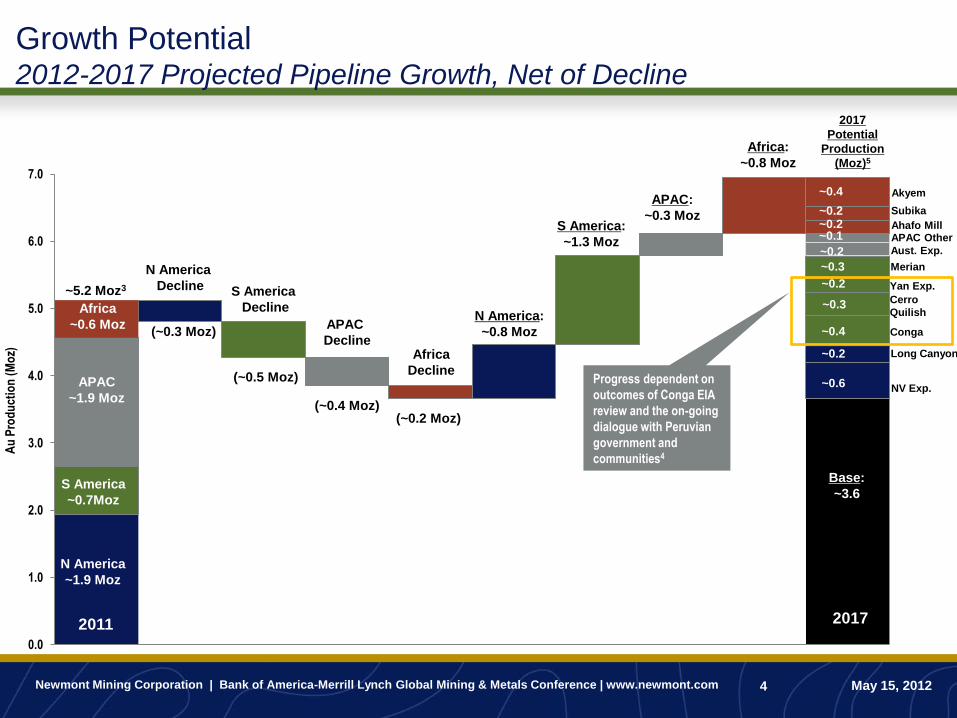
Production Growth • Gold production growth potential to ~ 6 - 7 Moz by 2017 1
(Growth potential dependent on outcomes of Conga EIA review and the on-going dialogue with Peruvian government and communities)
• Copper production to potentially double over same period
Project Returns • Competitive returns across the pipeline
Exploration Upside • Potential to add equivalent of 90 Moz Au and 9 Blbs Cu reserves
between 2011 and 20202
Balance Sheet
Strength • Investment grade balance sheet and strong operating cash flows
Gold Price-Linked
Dividend • Returning capital to shareholders through gold price-linked dividend
Newmont Mining Corporation | Bank of America-Merrill Lynch Global Mining & Metals Conference | www.newmont.com May 15, 2012 4
0.0
1.0
2.0
3.0
4.0
5.0
6.0
7.0
2011 2017
Growth Potential 2012-2017 Projected Pipeline Growth, Net of Decline
~5.2 Moz3
Africa
~0.6 Moz
APAC
~1.9 Moz
S America
~0.7Moz
N America
~1.9 Moz
N America
Decline S America
Decline
APAC
Decline Africa
Decline
Africa:
~0.8 Moz
APAC:
~0.3 Moz S America:
~1.3 Moz
N America:
~0.8 Moz (~0.3 Moz)
(~0.5 Moz)
(~0.4 Moz) (~0.2 Moz)
Base:
~3.6
NV Exp.
Long Canyon
Conga
Merian
Cerro
Quilish
Yan Exp.
Aust. Exp.
Ahafo Mill
Subika
Akyem
~0.6
~0.2
~0.4
~0.3
~0.3
~0.2
~0.2
~0.1 ~0.2 ~0.2
~0.4
2017
Potential
Production
(Moz)5
Au
Pro
du
ctio
n (
Mo
z)
Progress dependent on
outcomes of Conga EIA
review and the on-going
dialogue with Peruvian
government and
communities4
APAC Other
Newmont Mining Corporation | Bank of America-Merrill Lynch Global Mining & Metals Conference | www.newmont.com May 15, 2012 5
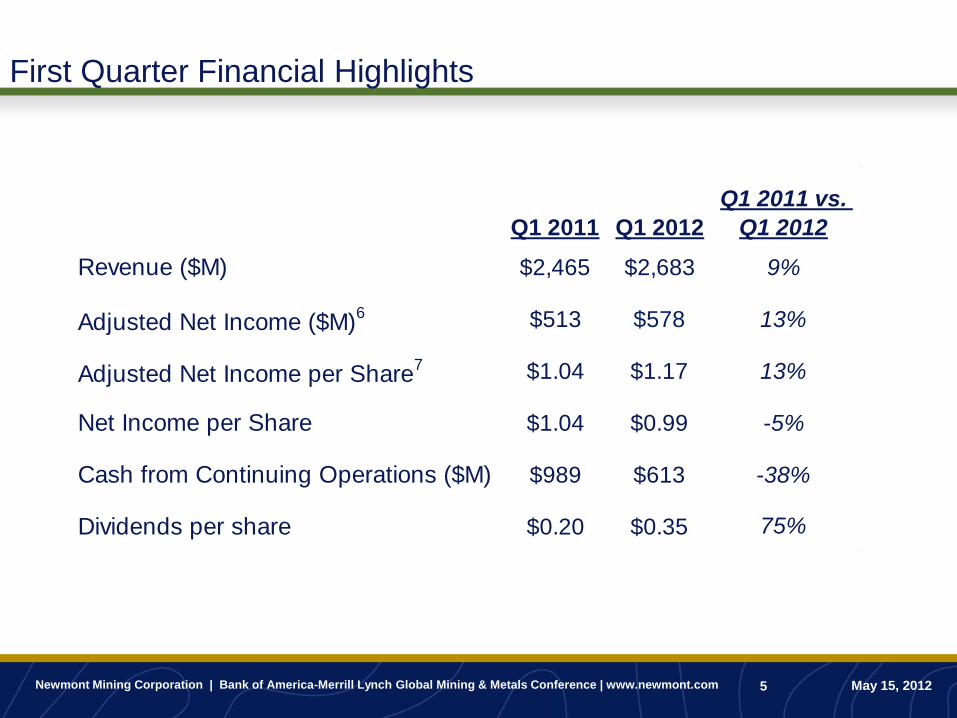
First Quarter Financial Highlights
Q1 2011 Q1 2012
Q1 2011 vs.
Q1 2012
Revenue ($M) $2,465 $2,683 9%
Adjusted Net Income ($M)6 $513 $578 13%
Adjusted Net Income per Share7 $1.04 $1.17 13%
Net Income per Share $1.04 $0.99 -5%
Cash from Continuing Operations ($M) $989 $613 -38%
Dividends per share $0.20 $0.35 75%
Newmont Mining Corporation | Bank of America-Merrill Lynch Global Mining & Metals Conference | www.newmont.com May 15, 2012 6
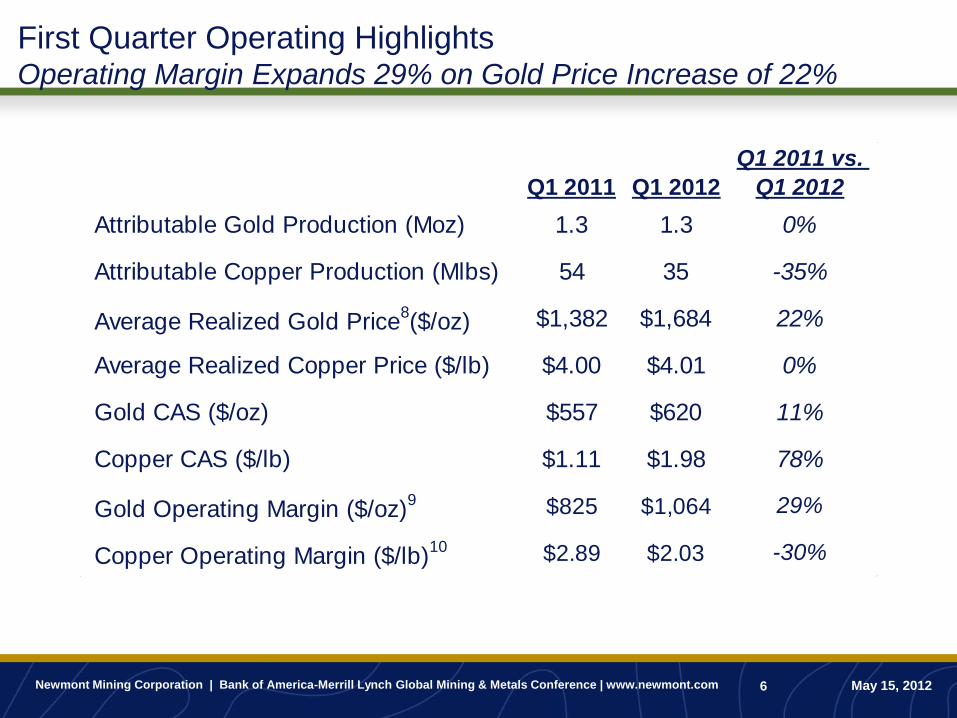
First Quarter Operating Highlights Operating Margin Expands 29% on Gold Price Increase of 22%
Q1 2011 Q1 2012
Q1 2011 vs.
Q1 2012
Attributable Gold Production (Moz) 1.3 1.3 0%
Attributable Copper Production (Mlbs) 54 35 -35%
Average Realized Gold Price8($/oz) $1,382 $1,684 22%
Average Realized Copper Price ($/lb) $4.00 $4.01 0%
Gold CAS ($/oz) $557 $620 11%
Copper CAS ($/lb) $1.11 $1.98 78%
Gold Operating Margin ($/oz)9 $825 $1,064 29%
Copper Operating Margin ($/lb)10 $2.89 $2.03 -30%

Newmont Mining Corporation | Bank of America-Merrill Lynch Global Mining & Metals Conference | www.newmont.com May 15, 2012 7
N America~480Koz
S America ~150Koz
APAC~510Koz
Africa ~190Koz
N America
S America
APAC
Africa
N America~490Koz
S America~200Koz
APAC~440Koz
Africa~180Koz
N America
S America
APAC
Africa
Q1 2012 Operational Performance 1.3Moz at CAS of $620/oz
Q1 2011 Attributable Gold Production
Consolidated
Gold CAS ($/oz) N America S America APAC Africa Total Newmont
Q1 2011 $617 $583 $527 $451 $557
Q1 2012 $613 $458 $774 $568 $620
(36%)
(14%)
(39%)
(11%)
(37%)
(34%)
(14%)
(15%)
Q1 2012 Attributable Gold Production
~1.3Moz ~1.3Moz
Newmont Mining Corporation | Bank of America-Merrill Lynch Global Mining & Metals Conference | www.newmont.com May 15, 2012 8
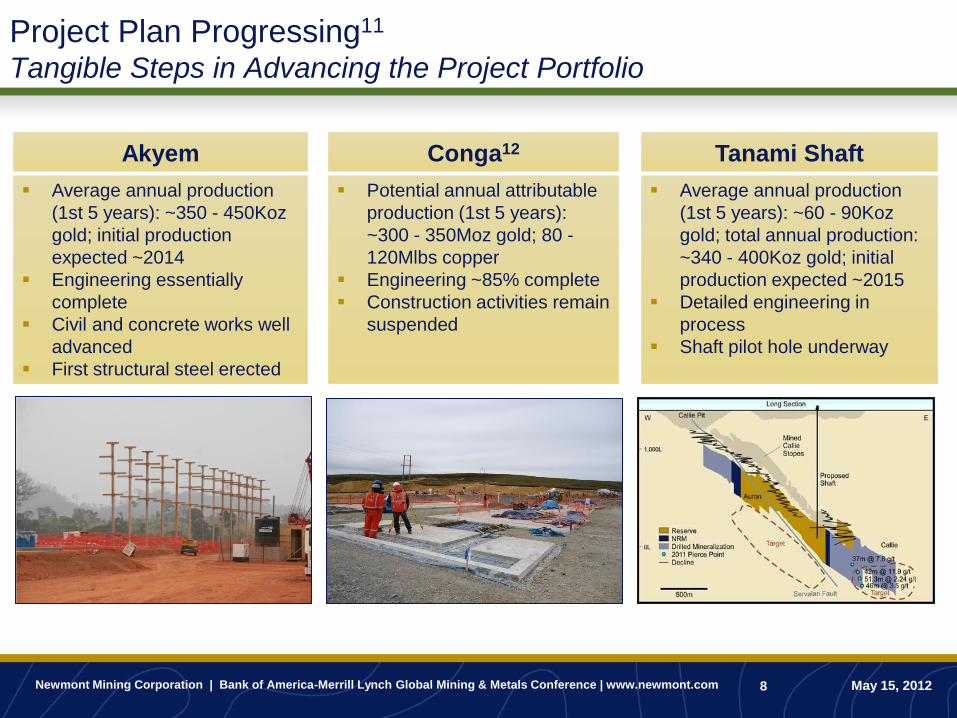
Project Plan Progressing11
Tangible Steps in Advancing the Project Portfolio
Tanami Shaft
Average annual production
(1st 5 years): ~60 - 90Koz
gold; total annual production:
~340 - 400Koz gold; initial
production expected ~2015
Detailed engineering in
process
Shaft pilot hole underway
Conga12
Potential annual attributable
production (1st 5 years):
~300 - 350Moz gold; 80 -
120Mlbs copper
Engineering ~85% complete
Construction activities remain
suspended
Akyem
Average annual production
(1st 5 years): ~350 - 450Koz
gold; initial production
expected ~2014
Engineering essentially
complete
Civil and concrete works well
advanced
First structural steel erected

Newmont Mining Corporation | Bank of America-Merrill Lynch Global Mining & Metals Conference | www.newmont.com May 15, 2012 9
Recent Developments in North America
Tangible Steps in Advancing the Project Portfolio
Phoenix Copper Leach
Average annual production
(1st 5 years): ~10 - 20Mlb;
Initial production expected
~2014
By-product credit to Nevada
CAS
Ore placement begun on
leach pad
Emigrant
Average annual production
(1st 5 years): ~80 - 90Koz
gold
Commercial production
expected ~2013 with startup
in 2012
Vista
Oxide layback that will
provide leach ore and feed to
Juniper mill
Average annual production of
~100Koz

Newmont Mining Corporation | Bank of America-Merrill Lynch Global Mining & Metals Conference | www.newmont.com May 15, 2012 10
Long Canyon Continuing Confidence in Original Investment Thesis
Trend Potential of >3-4X Fronteer’s Stated Resource Estimate13 (1.4Moz M&I + 0.8Moz Inferred; No ounces currently in reserves or NRM; Expected to
declare first NRM in 2012)

Newmont Mining Corporation | Bank of America-Merrill Lynch Global Mining & Metals Conference | www.newmont.com May 15, 2012 11
Ball Mill and SAG Mill Construction at Akyem
February 2012

Newmont Mining Corporation | Bank of America-Merrill Lynch Global Mining & Metals Conference | www.newmont.com May 15, 2012 12
Exploration Upside Gold Reserves Increase to Record Levels
Record gold reserves of 98.8 million ounces, an increase of ~6% from 2010
Total gold NRM14 increased ~12% over 2010
Biggest gold reserve increases came from North America (Carlin, Phoenix, and
Turf/Leeville) and Africa (Ahafo open pits)
2011 Attributable Gold
Proven and Probable Reserves
Asia Pacific
Africa N. America
S. America
2011 Attributable Gold Proven and
Probable Reserve Additions by Region
93.5
~3.3
~7.4~0.9 ~6.3
98.8
2010 Gold Price Additions Revisions Depletions 2011
Millio
n O
un
ces
~6.2
~0.3~2.2
~2.9
Million Ounces

Newmont Mining Corporation | Bank of America-Merrill Lynch Global Mining & Metals Conference | www.newmont.com May 15, 2012 13
Exploration Upside Copper Reserves Increase to Record Levels
Record copper reserves of 9.7 billion pounds, an increase of ~3% from 2010
Total copper NRM14 increased ~11% over 2010
Copper reserve growth driven by increases at Phoenix and Batu Hijau
2011 Attributable Copper
Proven and Probable Reserves
2011 Attributable Copper Proven and
Probable Reserve Additions by Region
Asia Pacific N. America
S. America
~0.5
~0.03
~0.2
Billion Pounds
9.4
~0.4
~0.1~0.1 ~0.3
9.7
2010 Cu Price Additions Revisions Depletions 2011
Bil
lio
n P
ou
nd
s

Newmont Mining Corporation | Bank of America-Merrill Lynch Global Mining & Metals Conference | www.newmont.com May 15, 2012 14
Exploration Upside14 Strong Pipeline to Support the Reserve Base in the Growth Plan
Reserves
Long Canyon
Fimiston
Elang
Mike
Fiberline
Greater Phoenix
La Carpa
TRJV
Copper Basin
Greater Gold Quarry
Leeville/Turf
Yanacocha Verde
Chaquicocha UG
Subika Expansion
Phoenix Cu Leach
Gold Quarry
Leeville/Turf
Phoenix
Tanami
Ahafo
Merian
Yanacocha
Cerro Quilish
Potential to add more than equivalent of current
Gold and Copper reserves over the next decade
Africa 19.47 -
APAC 31.55 5.99
North 36.98 2.04
America
South 10.75 1.69
America
Region Gold
(Moz)
Copper
(Blb)
Non Reserve Mineralization Reserves
42.1 Moz Au
4.1 Blb Cu
98.8 Moz Au
9.7 Blb Cu
Mineral Inventory Potentially Economic
Mineralization

Newmont Mining Corporation | Bank of America-Merrill Lynch Global Mining & Metals Conference | www.newmont.com May 15, 2012 15
Strong Balance Sheet and Cash Flow
Strong Operating Cash Flow
Internal Funding Capacity For:
Project pipeline
Exploration
Gold price-linked dividend
~$2.6B in Cash
~$1.6B in Marketable Securities
~$2.5B in Revolver Capacity
~$4-$5B in Additional Leverage Capacity
~$11B (All numbers as of 3/31/2012)

Newmont Mining Corporation | Bank of America-Merrill Lynch Global Mining & Metals Conference | www.newmont.com May 15, 2012 16
$0.40
$0.60
$0.80
$1.00
$1.20
$1.40
$1.70
$2.00
$2.30
$2.70
$3.10
$3.50
$3.90
$4.30
$4.70
$0.00
$0.50
$1.00
$1.50
$2.00
$2.50
$3.00
$3.50
$4.00
$4.50
$5.00
$1,100-$1,199
$1,200-$1,299
$1,300-$1,399
$1,400-$1,499
$1,500-$1,599
$1,600-$1,699
$1,700-$1,799
$1,800-$1,899
$1,900-$1,999
$2,000-$2,099
$2,100-$2,199
$2,200-$2,299
$2,300-$2,399
$2,400-$2,499
$2,500-$2,599
Industry Leading Gold Price-Linked Dividend15
Up 75% from Prior Year Quarter
An
nu
ali
ze
d D
ivid
en
d p
er
Sh
are
($
)
Trailing Quarter Realized Gold Price ($/oz)
Dividend increases / decreases
by $0.40/share for every $100/oz
change in the gold price
Dividend
increases /
decreases by
$0.30/share for
every $100/oz
change in gold
price
Dividend increases /
decreases by $0.20/share
for every $100/oz change
in the gold price
Q2 2012 Dividend
Declared: $0.35

Newmont Mining Corporation | Bank of America-Merrill Lynch Global Mining & Metals Conference | www.newmont.com May 15, 2012 17
Newmont: Summary/Conclusion
~35% Potential increase in attributable gold production by 2017
Industry-leading returns on invested capital
Exploration upside as large as current reserve base
Strong balance sheet with significant financial flexibility
Industry-leading dividend

Appendix A – Costs, ESR, and Market Data

Newmont Mining Corporation | Bank of America-Merrill Lynch Global Mining & Metals Conference | www.newmont.com May 15, 2012 19
Senior Peers Total Costs Breakout T
ota
l p
rod
ucti
on
co
st
per
Go
ld E
qu
iva
len
t O
un
ce (
$/o
z)
Senior Peers Production Cost Increase1
1Industry comparison based on ABX, GG, KGC & AU financials 2008-2011 Actuals. Company guidance utilized for 2012E.
420 450510
580 621
113 110
190
197
293
3020
40
54
80
4040
50
61
55
241 212
155
299
383
$872 $972
$1,225
$1,572
$1,696
$0
$200
$400
$600
$800
$1,000
$1,200
$1,400
$1,600
$1,800
2008 2009 2010 2011 2012E
CAS ($/oz) Sustaining Capex ($/oz) Exploration ($/oz) SG&A ($/oz) Development Capex ($/oz) Avg Au Price $/oz
$844 $832 $945 $1,191 $1,433
Sustaining Capex CAGR 27%Development Capex CAGR 12%

Newmont Mining Corporation | Bank of America-Merrill Lynch Global Mining & Metals Conference | www.newmont.com May 15, 2012 20
$480
$40
$25
$15
$15
$10
$5 $5
$5
$10
$25 $555
$20
$25
$20
$5
$5 $5
$640
$400
$450
$500
$550
$600
$650
Cash
Co
sts
($/o
z)
NEM~$565
NEM~$510
NEM~$440
NEM CAGR „09-„11 = 13%
Industry CAGR = 16%
1
Industry Cost Inflation Year-on-Year Changes to Industry Cash Costs
1Source: GFMS Gold Survey 2011, RBC Capital Markets
Industry Cash Cost Trend 2009 to 2011A1
Industry Cash Cost Avg.
NEM Attributable CAS
~$591
2011A Gold CAS Detail
~50%
~20%
~10%
~10%
~10%
Labor Materials & PartsConsumables DieselPower
NEM
2009 Avg Spot Gold = $972
NEM Stk Price = $47.31
2010 Avg Spot Gold = $1,224
NEM Stk Price = $61.43
2011 Avg Spot Gold = $1,571
NEM Stk Price = $60.01
Newmont Mining Corporation | Bank of America-Merrill Lynch Global Mining & Metals Conference | www.newmont.com May 15, 2012 21
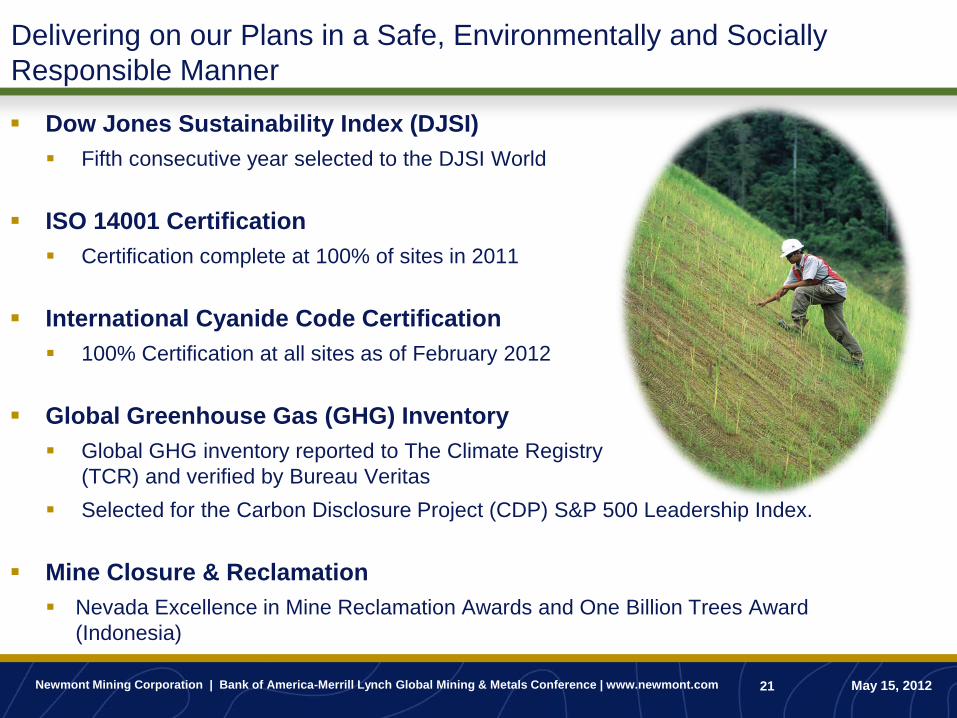
Delivering on our Plans in a Safe, Environmentally and Socially
Responsible Manner
Dow Jones Sustainability Index (DJSI)
Fifth consecutive year selected to the DJSI World
ISO 14001 Certification
Certification complete at 100% of sites in 2011
International Cyanide Code Certification
100% Certification at all sites as of February 2012
Global Greenhouse Gas (GHG) Inventory
Global GHG inventory reported to The Climate Registry
(TCR) and verified by Bureau Veritas
Selected for the Carbon Disclosure Project (CDP) S&P 500 Leadership Index.
Mine Closure & Reclamation
Nevada Excellence in Mine Reclamation Awards and One Billion Trees Award
(Indonesia)

Newmont Mining Corporation | Bank of America-Merrill Lynch Global Mining & Metals Conference | www.newmont.com May 15, 2012 22
Corporate Responsibility Magazine
Ranked 42nd overall in 2012 on 100 Best Corporate Citizens
Community Relationships Review (CRR)
Unprecedented independent review of Newmont relationships with communities;
implementation plans are underway to respond to the CRR recommendations
Rollout of our revised social responsibility
standards
Development and implementation of
our social audit program
Conflict Management training in
partnership with RESOLVE.
Implemented our ESR-Exploration
Guidebook
www.beyondthemine.com
Delivering on our Plans in a Safe, Environmentally and Socially
Responsible Manner
Newmont Mining Corporation | Bank of America-Merrill Lynch Global Mining & Metals Conference | www.newmont.com May 15, 2012 23
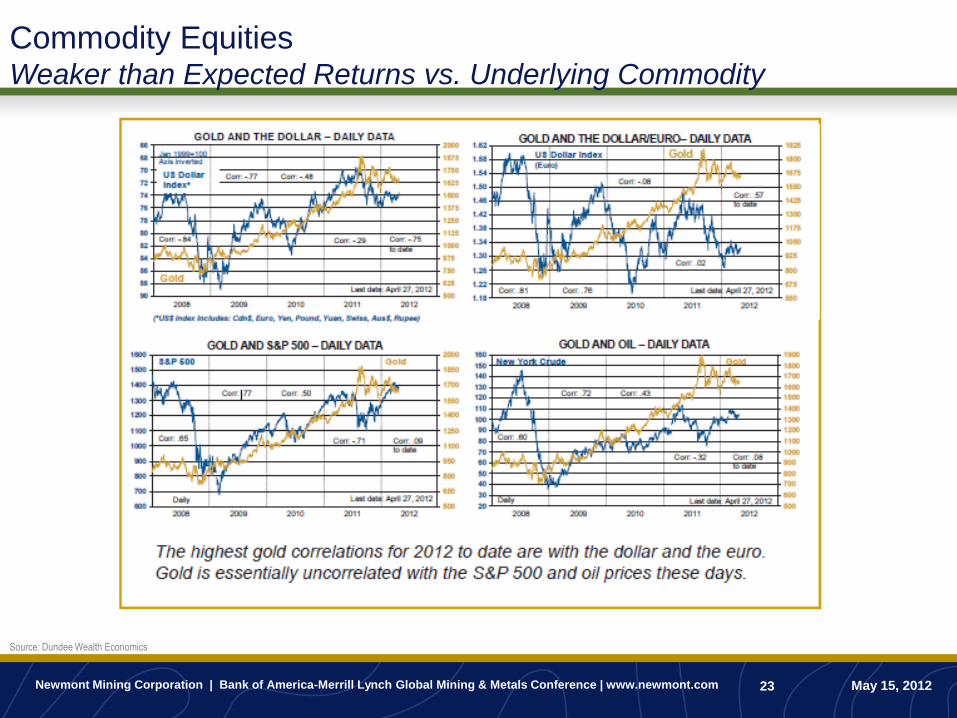
Source: Dundee Wealth Economics
Commodity Equities Weaker than Expected Returns vs. Underlying Commodity

Newmont Mining Corporation | Bank of America-Merrill Lynch Global Mining & Metals Conference | www.newmont.com May 15, 2012 24
Gold Bullish Factors for Gold
Source: Dundee Wealth Economics (March 30, 2012.)

Newmont Mining Corporation | Bank of America-Merrill Lynch Global Mining & Metals Conference | www.newmont.com May 15, 2012 25
Gold Bearish Factors for Gold
Source: Dundee Wealth Economics (March 30, 2012.)

Newmont Mining Corporation | Bank of America-Merrill Lynch Global Mining & Metals Conference | www.newmont.com May 15, 2012 26
Gold Gold Price Forecast
Source: Dundee Wealth Economics (March 30, 2012.)
“Our bias rests with Scenario C – it retains a subjective probability of 40%. The problems
in the world economy are many; governments will need to borrow trillions of dollars/euros
to fund their deficits and support weaker economies in Europe, and central banks will
remain under extreme pressure as a result of unusually high unemployment rates to keep
monetary policy easy.”- Murenbeeld
Appendix B – Project Overview

Newmont Mining Corporation | Bank of America-Merrill Lynch Global Mining & Metals Conference | www.newmont.com May 15, 2012 28
North America Long Canyon
Project Description
A Carlin-Type trend with potential for significant
development and operating synergies
Current Estimated Potential
Annual Ave. First Five Years
Production (Koz):
~250 – 300
Annual Ave. First Five Years
CAS ($/oz):
~$375 - $520
Anticipated Start Date: ~2017
Initial Capex ($M)16: $500 - $700
Recent Updates17
Completed 278 drill holes; ~59 km
Infill drilling extended mineralization by ~25%
Step out drilling extended mineralization North
and South
Potentially new mineralized structures
2012 Program
~70km of infill, extension and district
exploration drilling
Expect to declare first NRM by year-end
Newmont Mining Corporation | Bank of America-Merrill Lynch Global Mining & Metals Conference | www.newmont.com May 15, 2012 29
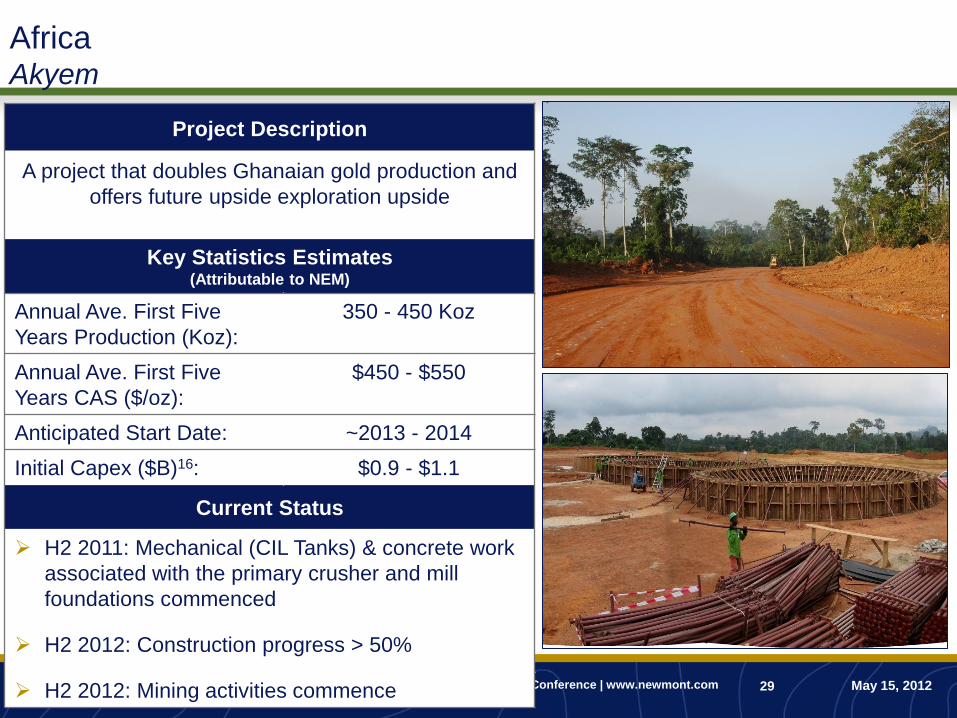
Africa Akyem
Project Description
A project that doubles Ghanaian gold production and
offers future upside exploration upside
Key Statistics Estimates (Attributable to NEM)
Annual Ave. First Five
Years Production (Koz):
350 - 450 Koz
Annual Ave. First Five
Years CAS ($/oz):
$450 - $550
Anticipated Start Date: ~2013 - 2014
Initial Capex ($B)16: $0.9 - $1.1
Current Status
H2 2011: Mechanical (CIL Tanks) & concrete work
associated with the primary crusher and mill
foundations commenced
H2 2012: Construction progress > 50%
H2 2012: Mining activities commence

Newmont Mining Corporation | Bank of America-Merrill Lynch Global Mining & Metals Conference | www.newmont.com May 15, 2012 30
South America Conga4
Project Description
A long-lived asset with potential to develop sulfide
and underground opportunities in a region with
existing infrastructure
Key Statistics Estimates (Attributable to NEM)
Annual Ave. First Five
Years Production :
300-350 Koz Au;
80-120 Mlbs Cu
Annual Ave. First Five
Years CAS:
~$400 - $450/oz
~$1.25 - ~$1.75/lb
Anticipated Start Date: ~2014 - 2015
Initial Capex ($B)16: $2.0 - $2.4
Near Term Milestones
H1 2012: First concrete pour for mill
H2 2012: Detailed engineering complete
H2 2012: Start of SAG Mill construction
H2 2012: Mining activities commence

Appendix C – CAS Data

Newmont Mining Corporation | Bank of America-Merrill Lynch Global Mining & Metals Conference | www.newmont.com May 15, 2012 32
$500
$520
$540
$560
$580
$600
$620
$640
$660
$680
$700
2011 Actual Manpower All OtherDirect Costs
A$, net ofhedges
Byproductcredits
Other InventoryChanges
2012 GoldCAS (Midpt)
2011 v 2012 Gold CAS ($/oz)
Rising APAC, Labor and Consumables Costs are Key Drivers
~$590
~$25
~$15 ~$5
~$25
~$650
$500
$520
$540
$560
$580
$600
$620
$640
$660
$680
$700
2011 Actual APAC N America Africa S America 2012 Gold CAS(Midpt)
~$590
~$10 ~$10
~$40
~$0 ~$650
Changes in Gold CAS ($/oz) by Region
Changes in Gold CAS ($/oz) by Driver
APAC cost increase accounts for
~67% of total CAS increase
Average salary in Australian
mining sector was ~$110K/yr in
20101
Australian carbon tax passed in
November 2011
Polluters will pay ~$23/tonne of
carbon released into
atmosphere
Labor crunch stemming from
shortfall of mining professionals
Canada shortfall ~60K – 90K by
20172
Peru shortfall ~40K by 20202
Commodity boom boosting input
costs
Competition for parts,
equipment driving prices
1Austrialn Bureau of Statistics 3Mining Industry Council
`
~$5 ~$5
Appendix D – Reconciliations and Reserves
Tables
Newmont Mining Corporation | Bank of America-Merrill Lynch Global Mining & Metals Conference | www.newmont.com May 15, 2012 34
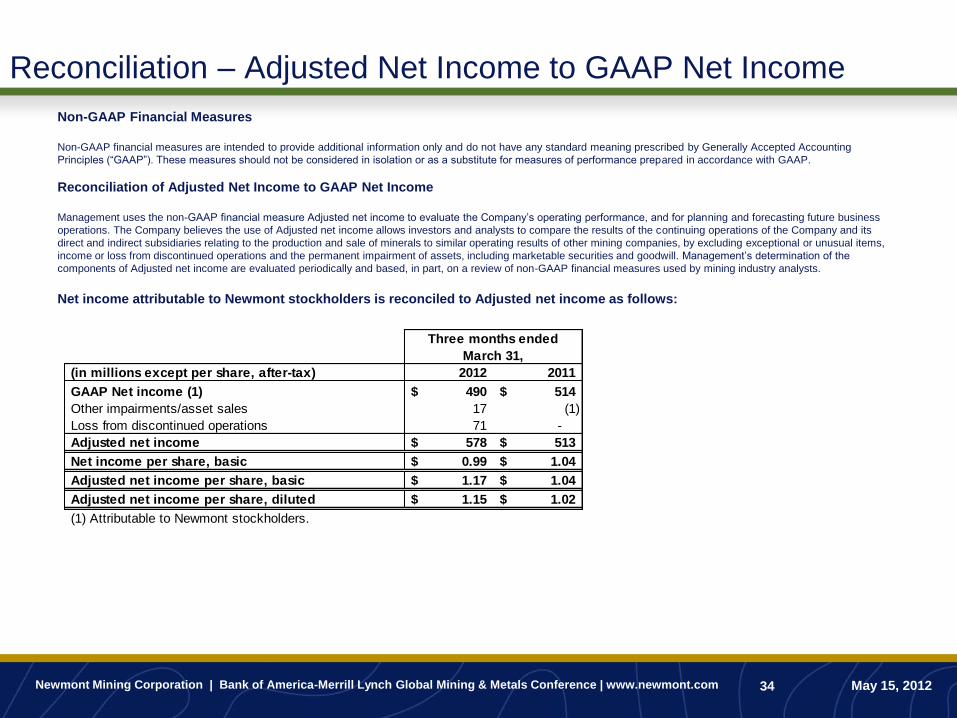
Reconciliation – Adjusted Net Income to GAAP Net Income
Non-GAAP Financial Measures
Non-GAAP financial measures are intended to provide additional information only and do not have any standard meaning prescribed by Generally Accepted Accounting
Principles (“GAAP”). These measures should not be considered in isolation or as a substitute for measures of performance prepared in accordance with GAAP.
Reconciliation of Adjusted Net Income to GAAP Net Income
Management uses the non-GAAP financial measure Adjusted net income to evaluate the Company‟s operating performance, and for planning and forecasting future business
operations. The Company believes the use of Adjusted net income allows investors and analysts to compare the results of the continuing operations of the Company and its
direct and indirect subsidiaries relating to the production and sale of minerals to similar operating results of other mining companies, by excluding exceptional or unusual items,
income or loss from discontinued operations and the permanent impairment of assets, including marketable securities and goodwill. Management‟s determination of the
components of Adjusted net income are evaluated periodically and based, in part, on a review of non-GAAP financial measures used by mining industry analysts.
Net income attributable to Newmont stockholders is reconciled to Adjusted net income as follows:
(in millions except per share, after-tax) 2012 2011
GAAP Net income (1) 490$ 514$
Other impairments/asset sales 17 (1)
Loss from discontinued operations 71 -
Adjusted net income 578$ 513$
Net income per share, basic 0.99$ 1.04$
Adjusted net income per share, basic 1.17$ 1.04$
Adjusted net income per share, diluted 1.15$ 1.02$
(1) Attributable to Newmont stockholders.
Three months ended
March 31,

Newmont Mining Corporation | Bank of America-Merrill Lynch Global Mining & Metals Conference | www.newmont.com May 15, 2012 35
2012 2011 2012 2011
Costs applicable to sales:
Consolidated $ 902 $ 823 $ 115 $ 117
Noncontrolling interests (1) (91) (94) (44) (46)
Attributable to Newmont $ 811 $ 729 $ 71 $ 71
Gold/Copper sold (000 ounces/million lbs):
Consolidated 1,455 1,478 58 105
Noncontrolling interests (1) (181) (182) (22) (48)
Attributable to Newmont 1,274 1,296 36 57
Costs applicable to sales per ounce/pound:
Consolidated $ 620 $ 557 $ 1.98 $ 1.11
Attributable to Newmont $ 637 $ 562 $ 1.97 $ 1.23
Net attributable costs applicable to sales per ounce
2012 2011
Attributable costs applicable to sales:
Gold $ 811 $ 729
Copper 71 71
$ 882 $ 800
Copper revenue:
Consolidated $ (233) $ (422)
Noncontrolling interests (1) 89 190
(144) (232)
Net attributable costs applicable to sales $ 738 $ 568
Attributable gold ounces sold (thousands) 1,274 1,296
Net attributable costs applicable to sales per ounce $ 580 $ 438
(1) Relates to partners' interests in Batu Hijau and Yanacocha.
Three Months Ended,
Gold Copper
Three Months Ended,
Three Months Ended,
Attributable and Net Attributable CAS Costs Applicable to Sales per Ounce/Pound
Costs applicable to sales per ounce/pound are non-GAAP financial measures. These measures are calculated by dividing the costs applicable to sales of gold and copper by gold ounces or copper pounds
sold, respectively. These measures are calculated on a consistent basis for the periods presented on both a consolidated and attributable to Newmont basis. Attributable costs applicable to sales are based
on our economic interest in production from our mines. For operations where we hold less than a 100% economic share in the production, we exclude the share of gold or copper production attributable to
the non-controlling interest. We include attributable costs applicable to sales per ounce/pound to provide management, investors and analysts with information with which to compare our performance to
other gold producers. Costs applicable to sales per ounce/pound statistics are intended to provide additional information only and do not have any standardized meaning prescribed by GAAP and should
not be considered in isolation or as a substitute for measures of performance prepared in accordance with GAAP. The measures are not necessarily indicative of operating profit or cash flow from
operations as determined under GAAP. Other companies may calculate these measures differently.
Net attributable costs applicable to sales per ounce measures the benefit of copper produced in conjunction with gold, as a credit against the cost of producing gold. A number of other gold producers
present their costs net of the contribution from copper and other non-gold sales. We believe that including a measure of this basis provides management, investors and analysts with information with which
to compare our performance to other gold producers, and to better assess the overall performance of our business. In addition, this measure provides information to enable investors and analysts to
understand the importance of non-gold revenues to our cost structure.
Newmont Mining Corporation | Bank of America-Merrill Lynch Global Mining & Metals Conference | www.newmont.com May 15, 2012 36
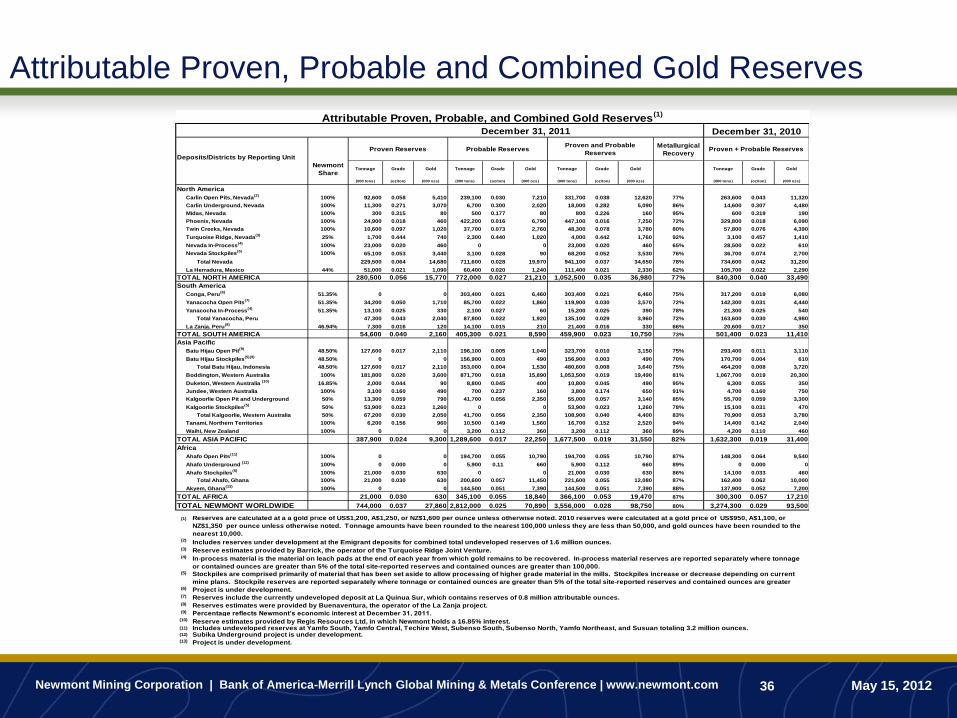
Attributable Proven, Probable and Combined Gold Reserves
December 31, 2011 December 31, 2010
Deposits/Districts by Reporting Unit
Metallurgical
Recovery
Newmont
ShareTonnage Grade Gold Tonnage Grade Gold Tonnage Grade Gold Tonnage Grade Gold
(000 tons) (oz/ton) (000 ozs) (000 tons) (oz/ton) (000 ozs) (000 tons) (oz/ton) (000 ozs) (000 tons) (oz/ton) (000 ozs)
North America
Carlin Open Pits, Nevada(2)
100% 92,600 0.058 5,410 239,100 0.030 7,210 331,700 0.038 12,620 77% 263,600 0.043 11,320
Carlin Underground, Nevada 100% 11,300 0.271 3,070 6,700 0.300 2,020 18,000 0.282 5,090 86% 14,600 0.307 4,480
Midas, Nevada 100% 300 0.315 80 500 0.177 80 800 0.226 160 95% 600 0.319 190
Phoenix, Nevada 100% 24,900 0.018 460 422,200 0.016 6,790 447,100 0.016 7,250 72% 329,800 0.018 6,090
Twin Creeks, Nevada 100% 10,600 0.097 1,020 37,700 0.073 2,760 48,300 0.078 3,780 80% 57,800 0.076 4,390
Turquoise Ridge, Nevada(3)
25% 1,700 0.444 740 2,300 0.440 1,020 4,000 0.442 1,760 92% 3,100 0.457 1,410
Nevada In-Process(4)
100% 23,000 0.020 460 0 0 23,000 0.020 460 65% 28,500 0.022 610
Nevada Stockpiles(5)
100% 65,100 0.053 3,440 3,100 0.028 90 68,200 0.052 3,530 76% 36,700 0.074 2,700
Total Nevada 229,500 0.064 14,680 711,600 0.028 19,970 941,100 0.037 34,650 78% 734,600 0.042 31,200
La Herradura, Mexico 44% 51,000 0.021 1,090 60,400 0.020 1,240 111,400 0.021 2,330 62% 105,700 0.022 2,290
TOTAL NORTH AMERICA 280,500 0.056 15,770 772,000 0.027 21,210 1,052,500 0.035 36,980 77% 840,300 0.040 33,490
South America
Conga, Peru(6)
51.35% 0 0 303,400 0.021 6,460 303,400 0.021 6,460 75% 317,200 0.019 6,080
Yanacocha Open Pits(7)
51.35% 34,200 0.050 1,710 85,700 0.022 1,860 119,900 0.030 3,570 72% 142,300 0.031 4,440
Yanacocha In-Process(4)
51.35% 13,100 0.025 330 2,100 0.027 60 15,200 0.025 390 78% 21,300 0.025 540
Total Yanacocha, Peru 47,300 0.043 2,040 87,800 0.022 1,920 135,100 0.029 3,960 72% 163,600 0.030 4,980
La Zanja, Peru(8)
46.94% 7,300 0.016 120 14,100 0.015 210 21,400 0.016 330 66% 20,600 0.017 350
TOTAL SOUTH AMERICA 54,600 0.040 2,160 405,300 0.021 8,590 459,900 0.023 10,750 73% 501,400 0.023 11,410
Asia Pacific
Batu Hijau Open Pit(9)
48.50% 127,600 0.017 2,110 196,100 0.005 1,040 323,700 0.010 3,150 75% 293,400 0.011 3,110
Batu Hijau Stockpiles(5)(9)
48.50% 0 0 156,900 0.003 490 156,900 0.003 490 70% 170,700 0.004 610
Total Batu Hijau, Indonesia 48.50% 127,600 0.017 2,110 353,000 0.004 1,530 480,600 0.008 3,640 75% 464,200 0.008 3,720
Boddington, Western Australia 100% 181,800 0.020 3,600 871,700 0.018 15,890 1,053,500 0.019 19,490 81% 1,067,700 0.019 20,300
Duketon, Western Australia (10)
16.85% 2,000 0.044 90 8,800 0.045 400 10,800 0.045 490 95% 6,300 0.055 350
Jundee, Western Australia 100% 3,100 0.160 490 700 0.237 160 3,800 0.174 650 91% 4,700 0.160 750
Kalgoorlie Open Pit and Underground 50% 13,300 0.059 790 41,700 0.056 2,350 55,000 0.057 3,140 85% 55,700 0.059 3,300
Kalgoorlie Stockpiles(5)
50% 53,900 0.023 1,260 0 0 53,900 0.023 1,260 78% 15,100 0.031 470
Total Kalgoorlie, Western Australia 50% 67,200 0.030 2,050 41,700 0.056 2,350 108,900 0.040 4,400 83% 70,900 0.053 3,780
Tanami, Northern Territories 100% 6,200 0.156 960 10,500 0.149 1,560 16,700 0.152 2,520 94% 14,400 0.142 2,040
Waihi, New Zealand 100% 0 0 3,200 0.112 360 3,200 0.112 360 89% 4,200 0.110 460
TOTAL ASIA PACIFIC 387,900 0.024 9,300 1,289,600 0.017 22,250 1,677,500 0.019 31,550 82% 1,632,300 0.019 31,400
Africa
Ahafo Open Pits(11)
100% 0 0 194,700 0.055 10,790 194,700 0.055 10,790 87% 148,300 0.064 9,540
Ahafo Underground (12)
100% 0 0.000 0 5,900 0.11 660 5,900 0.112 660 89% 0 0.000 0
Ahafo Stockpiles(5)
100% 21,000 0.030 630 0 0 21,000 0.030 630 86% 14,100 0.033 460
Total Ahafo, Ghana 100% 21,000 0.030 630 200,600 0.057 11,450 221,600 0.055 12,080 87% 162,400 0.062 10,000
Akyem, Ghana(13)
100% 0 0 144,500 0.051 7,390 144,500 0.051 7,390 88% 137,900 0.052 7,200
TOTAL AFRICA 21,000 0.030 630 345,100 0.055 18,840 366,100 0.053 19,470 87% 300,300 0.057 17,210
TOTAL NEWMONT WORLDWIDE 744,000 0.037 27,860 2,812,000 0.025 70,890 3,556,000 0.028 98,750 80% 3,274,300 0.029 93,500
(1)
(2) Includes reserves under development at the Emigrant deposits for combined total undeveloped reserves of 1.6 million ounces.(3) Reserve estimates provided by Barrick, the operator of the Turquoise Ridge Joint Venture. (4)
(5)
(6) Project is under development. (7) Reserves include the currently undeveloped deposit at La Quinua Sur, which contains reserves of 0.8 million attributable ounces.(8) Reserves estimates were provided by Buenaventura, the operator of the La Zanja project. (9)
(10) Reserve estimates provided by Regis Resources Ltd, in which Newmont holds a 16.85% interest. (11) Includes undeveloped reserves at Yamfo South, Yamfo Central, Techire West, Subenso South, Subenso North, Yamfo Northeast, and Susuan totaling 3.2 million ounces. (12) Subika Underground project is under development. (13) Project is under development.
In-process material is the material on leach pads at the end of each year from which gold remains to be recovered. In-process material reserves are reported separately where tonnage
or contained ounces are greater than 5% of the total site-reported reserves and contained ounces are greater than 100,000.
Stockpiles are comprised primarily of material that has been set aside to allow processing of higher grade material in the mills. Stockpiles increase or decrease depending on current
mine plans. Stockpile reserves are reported separately where tonnage or contained ounces are greater than 5% of the total site-reported reserves and contained ounces are greater
Percentage reflects Newmont’s economic interest at December 31, 2011.
Attributable Proven, Probable, and Combined Gold Reserves(1)
Proven Reserves Probable ReservesProven and Probable
ReservesProven + Probable Reserves
Reserves are calculated at a a gold price of US$1,200, A$1,250, or NZ$1,600 per ounce unless otherwise noted. 2010 reserves were calculated at a gold price of US$950, A$1,100, or
NZ$1,350 per ounce unless otherwise noted. Tonnage amounts have been rounded to the nearest 100,000 unless they are less than 50,000, and gold ounces have been rounded to the
nearest 10,000.

Newmont Mining Corporation | Bank of America-Merrill Lynch Global Mining & Metals Conference | www.newmont.com May 15, 2012 37
Attributable Copper Reserves
December 31, 2010
Probable Reserves
Deposits/Districts
Newmont
ShareTonnage Grade Copper Tonnage Grade Copper Tonnage Grade Copper Metallurgical Tonnage Grade Copper
(000 tons) (Cu%) (million
pounds)
(000 tons) (Cu%) (million
pounds)
(000 tons) (Cu%) (million
pounds)
Recovery (000 tons) (Cu%) (million
pounds)
North America
Phoenix, Nevada 100% 24,900 0.15% 70 425,400 0.15% 1,230 450,300 0.15% 1,300 61% 332,600 0.15% 1,030
Phoenix Copper Leach, Nevada (2) 100% 9,900 0.24% 50 160,300 0.21% 690 170,200 0.21% 740 52% 132,900 0.23% 610
TOTAL NORTH AMERICA 34,800 0.17% 120 585,700 0.16% 1,920 620,500 0.16% 2,040 58% 465,500 0.18% 1,640
South America
Conga, Peru(3) 51.35% 0 0 303,400 0.28% 1,690 303,400 0.28% 1,690 85% 317,200 0.26% 1,660
TOTAL SOUTH AMERICA 0 0 303,400 0.28% 1,690 303,400 0.28% 1,690 85% 317,200 0.26% 1,660
Asia Pacific
Batu Hijau(3) 48.50% 127,600 0.51% 1,300 196,100 0.35% 1,370 323,700 0.41% 2,670 76% 293,400 0.44% 2,560
Batu Hijau, Stockpiles(4)(5) 48.50% 0 0 156,900 0.34% 1,060 156,900 0.34% 1,060 66% 170,700 0.35% 1,200
Batu Hijau, Indonesia 48.50% 127,600 0.51% 1,300 353,000 0.34% 2,430 480,600 0.39% 3,730 73% 464,100 0.40% 3,760
Boddington, Western Australia 100.00% 181,800 0.10% 350 871,700 0.11% 1,910 1,053,500 0.11% 2,260 83% 1,067,800 0.11% 2,360
TOTAL ASIA PACIFIC 309,400 0.27% 1,650 1,224,700 0.18% 4,340 1,534,100 0.20% 5,990 77% 1,531,900 0.20% 6,120
TOTAL NEWMONT WORLDWIDE 344,200 0.26% 1,770 2,113,800 0.19% 7,950 2,458,000 0.20% 9,720 74% 2,314,600 0.20% 9,420
(1)
(2)
(3)
(4)
(5)
Project is under development. Leach reserves are within Phoenix Reserve Pit.
Project is under development.
Percentage reflects Newmont's economic interest at December 31, 2011.
Stockpiles are comprised primarily of material that has been set aside to allow processing of higher grade material. Stockpiles increase or decrease depending on current mine plans. Stockpiles are
reported separately where tonnage or contained metal are greater than 5% of the total site reported reserves.
Attributable Copper Reserves(1)
December 31, 2011
Proven Reserves Proven + Probable Reserves Proven + Probable Reserve
Reserves are calculated at US$3.00 or A$3.15 per pound copper price unless otherwise noted. 2010 reserves were calculated at US$2.50 or A$2.95 per pound copper price unless otherwise noted.
Tonnage amounts have been rounded to the nearest 100,000 and pounds have been rounded to the nearest 10 million.
Newmont Mining Corporation | Bank of America-Merrill Lynch Global Mining & Metals Conference | www.newmont.com May 15, 2012 38
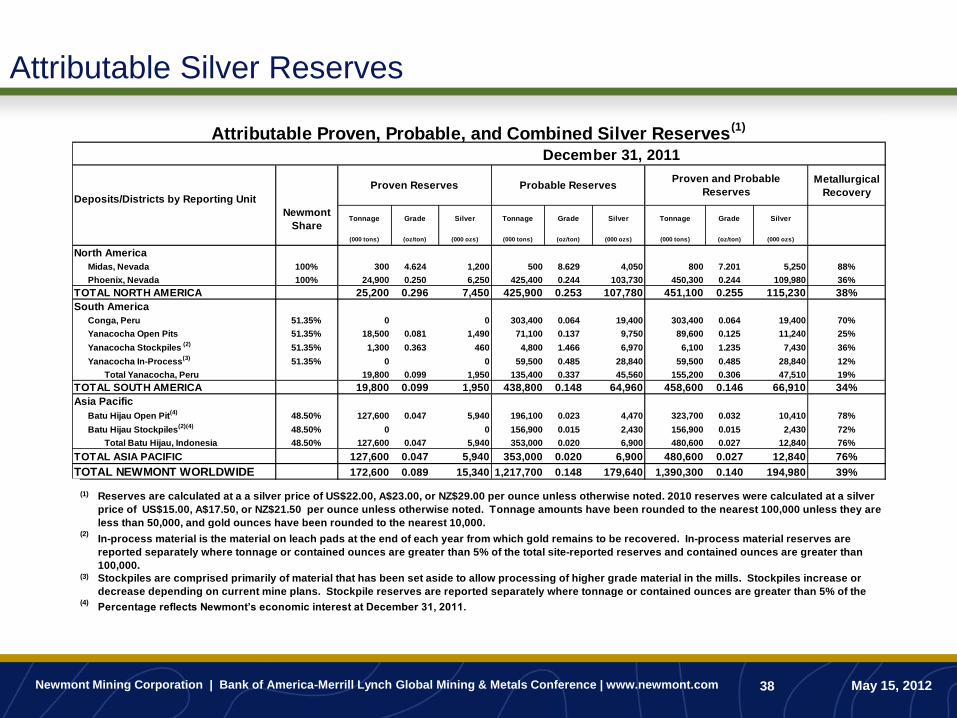
Attributable Silver Reserves
December 31, 2011
Deposits/Districts by Reporting Unit
Metallurgical
Recovery
Newmont
ShareTonnage Grade Silver Tonnage Grade Silver Tonnage Grade Silver
(000 tons) (oz/ton) (000 ozs) (000 tons) (oz/ton) (000 ozs) (000 tons) (oz/ton) (000 ozs)
North America
Midas, Nevada 100% 300 4.624 1,200 500 8.629 4,050 800 7.201 5,250 88%
Phoenix, Nevada 100% 24,900 0.250 6,250 425,400 0.244 103,730 450,300 0.244 109,980 36%
TOTAL NORTH AMERICA 25,200 0.296 7,450 425,900 0.253 107,780 451,100 0.255 115,230 38%
South America
Conga, Peru 51.35% 0 0 303,400 0.064 19,400 303,400 0.064 19,400 70%
Yanacocha Open Pits 51.35% 18,500 0.081 1,490 71,100 0.137 9,750 89,600 0.125 11,240 25%
Yanacocha Stockpiles (2)
51.35% 1,300 0.363 460 4,800 1.466 6,970 6,100 1.235 7,430 36%
Yanacocha In-Process(3)
51.35% 0 0 59,500 0.485 28,840 59,500 0.485 28,840 12%
Total Yanacocha, Peru 19,800 0.099 1,950 135,400 0.337 45,560 155,200 0.306 47,510 19%
TOTAL SOUTH AMERICA 19,800 0.099 1,950 438,800 0.148 64,960 458,600 0.146 66,910 34%
Asia Pacific
Batu Hijau Open Pit(4)
48.50% 127,600 0.047 5,940 196,100 0.023 4,470 323,700 0.032 10,410 78%
Batu Hijau Stockpiles(2)(4)
48.50% 0 0 156,900 0.015 2,430 156,900 0.015 2,430 72%
Total Batu Hijau, Indonesia 48.50% 127,600 0.047 5,940 353,000 0.020 6,900 480,600 0.027 12,840 76%
TOTAL ASIA PACIFIC 127,600 0.047 5,940 353,000 0.020 6,900 480,600 0.027 12,840 76%
TOTAL NEWMONT WORLDWIDE 172,600 0.089 15,340 1,217,700 0.148 179,640 1,390,300 0.140 194,980 39%
(1)
(2)
(3)
(4)
Stockpiles are comprised primarily of material that has been set aside to allow processing of higher grade material in the mills. Stockpiles increase or
decrease depending on current mine plans. Stockpile reserves are reported separately where tonnage or contained ounces are greater than 5% of the
Percentage reflects Newmont’s economic interest at December 31, 2011.
Attributable Proven, Probable, and Combined Silver Reserves(1)
Proven Reserves Probable ReservesProven and Probable
Reserves
Reserves are calculated at a a silver price of US$22.00, A$23.00, or NZ$29.00 per ounce unless otherwise noted. 2010 reserves were calculated at a silver
price of US$15.00, A$17.50, or NZ$21.50 per ounce unless otherwise noted. Tonnage amounts have been rounded to the nearest 100,000 unless they are
less than 50,000, and gold ounces have been rounded to the nearest 10,000.
In-process material is the material on leach pads at the end of each year from which gold remains to be recovered. In-process material reserves are
reported separately where tonnage or contained ounces are greater than 5% of the total site-reported reserves and contained ounces are greater than
100,000.
Newmont Mining Corporation | Bank of America-Merrill Lynch Global Mining & Metals Conference | www.newmont.com May 15, 2012 39
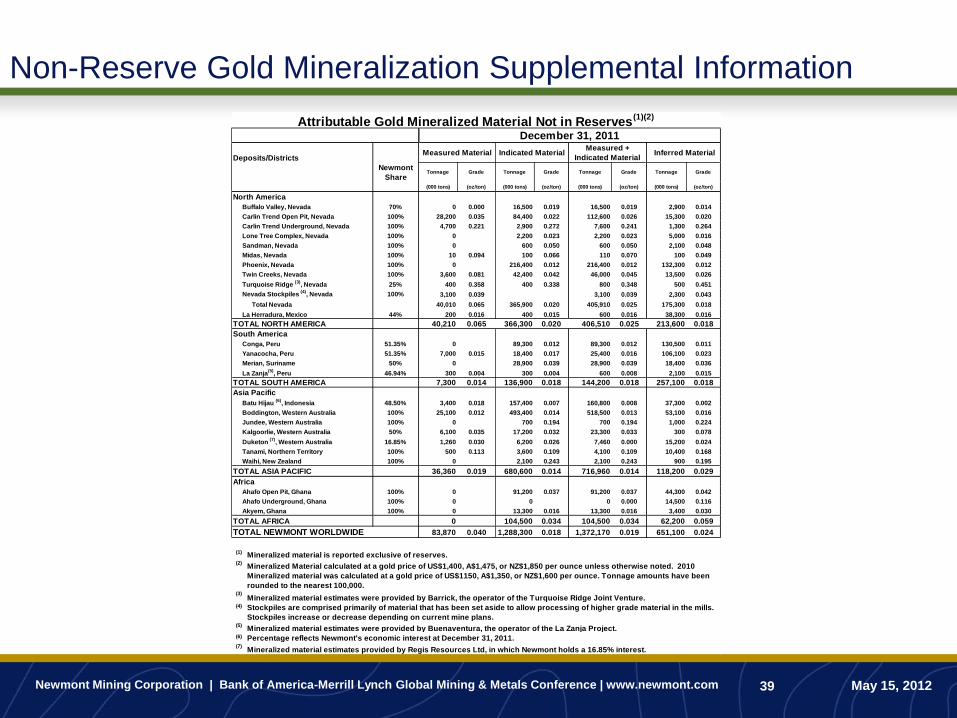
Non-Reserve Gold Mineralization Supplemental Information
Deposits/Districts
Newmont
ShareTonnage Grade Tonnage Grade Tonnage Grade Tonnage Grade
(000 tons) (oz/ton) (000 tons) (oz/ton) (000 tons) (oz/ton) (000 tons) (oz/ton)
North America
Buffalo Valley, Nevada 70% 0 0.000 16,500 0.019 16,500 0.019 2,900 0.014
Carlin Trend Open Pit, Nevada 100% 28,200 0.035 84,400 0.022 112,600 0.026 15,300 0.020
Carlin Trend Underground, Nevada 100% 4,700 0.221 2,900 0.272 7,600 0.241 1,300 0.264
Lone Tree Complex, Nevada 100% 0 2,200 0.023 2,200 0.023 5,000 0.016
Sandman, Nevada 100% 0 600 0.050 600 0.050 2,100 0.048
Midas, Nevada 100% 10 0.094 100 0.066 110 0.070 100 0.049
Phoenix, Nevada 100% 0 216,400 0.012 216,400 0.012 132,300 0.012
Twin Creeks, Nevada 100% 3,600 0.081 42,400 0.042 46,000 0.045 13,500 0.026
Turquoise Ridge (3)
, Nevada 25% 400 0.358 400 0.338 800 0.348 500 0.451
Nevada Stockpiles (4)
, Nevada 100% 3,100 0.039 3,100 0.039 2,300 0.043
Total Nevada 40,010 0.065 365,900 0.020 405,910 0.025 175,300 0.018
La Herradura, Mexico 44% 200 0.016 400 0.015 600 0.016 38,300 0.016
TOTAL NORTH AMERICA 40,210 0.065 366,300 0.020 406,510 0.025 213,600 0.018
South America
Conga, Peru 51.35% 0 89,300 0.012 89,300 0.012 130,500 0.011
Yanacocha, Peru 51.35% 7,000 0.015 18,400 0.017 25,400 0.016 106,100 0.023
Merian, Suriname 50% 0 28,900 0.039 28,900 0.039 18,400 0.036
La Zanja(5)
, Peru 46.94% 300 0.004 300 0.004 600 0.008 2,100 0.015
TOTAL SOUTH AMERICA 7,300 0.014 136,900 0.018 144,200 0.018 257,100 0.018
Asia Pacific
Batu Hijau (6)
, Indonesia 48.50% 3,400 0.018 157,400 0.007 160,800 0.008 37,300 0.002
Boddington, Western Australia 100% 25,100 0.012 493,400 0.014 518,500 0.013 53,100 0.016
Jundee, Western Australia 100% 0 700 0.194 700 0.194 1,000 0.224
Kalgoorlie, Western Australia 50% 6,100 0.035 17,200 0.032 23,300 0.033 300 0.078
Duketon (7)
, Western Australia 16.85% 1,260 0.030 6,200 0.026 7,460 0.000 15,200 0.024
Tanami, Northern Territory 100% 500 0.113 3,600 0.109 4,100 0.109 10,400 0.168
Waihi, New Zealand 100% 0 2,100 0.243 2,100 0.243 900 0.195
TOTAL ASIA PACIFIC 36,360 0.019 680,600 0.014 716,960 0.014 118,200 0.029
Africa
Ahafo Open Pit, Ghana 100% 0 91,200 0.037 91,200 0.037 44,300 0.042
Ahafo Underground, Ghana 100% 0 0 0 0.000 14,500 0.116
Akyem, Ghana 100% 0 13,300 0.016 13,300 0.016 3,400 0.030
TOTAL AFRICA 0 104,500 0.034 104,500 0.034 62,200 0.059
TOTAL NEWMONT WORLDWIDE 83,870 0.040 1,288,300 0.018 1,372,170 0.019 651,100 0.024
(1)
(2)
(3)
(4)
(5)
(6)
(7)
Attributable Gold Mineralized Material Not in Reserves(1)(2)
December 31, 2011
Measured Material Indicated MaterialMeasured +
Indicated Material Inferred Material
Mineralized material estimates provided by Regis Resources Ltd, in which Newmont holds a 16.85% interest.
Mineralized material is reported exclusive of reserves.
Mineralized Material calculated at a gold price of US$1,400, A$1,475, or NZ$1,850 per ounce unless otherwise noted. 2010
Mineralized material was calculated at a gold price of US$1150, A$1,350, or NZ$1,600 per ounce. Tonnage amounts have been
rounded to the nearest 100,000.
Mineralized material estimates were provided by Barrick, the operator of the Turquoise Ridge Joint Venture.
Stockpiles are comprised primarily of material that has been set aside to allow processing of higher grade material in the mills.
Stockpiles increase or decrease depending on current mine plans.
Mineralized material estimates were provided by Buenaventura, the operator of the La Zanja Project.
Percentage reflects Newmont's economic interest at December 31, 2011.

Newmont Mining Corporation | Bank of America-Merrill Lynch Global Mining & Metals Conference | www.newmont.com May 15, 2012 40
Non-Reserve Copper Mineralization Supplemental Information
Attributable Copper Mineralized Material Not in Reserves(1)(2)
December 31, 2011
Deposits/DistrictsMeasured Material Indicated Material
Measured + Indicated
Material Inferred Material
Newmont
Share Tonnage Grade Tonnage Grade Tonnage Grade Tonnage Grade
(000 tons) (Cu%) (000 tons) (Cu%) (000 tons) (Cu%) (000 tons) (Cu%)
North America
Phoenix, Nevada 100% 0 0.00% 216,400 0.09% 216,400 0.09% 132,300 0.10%
Phoenix Copper Leach, Nevada 100% 0 0.00% 14,100 0.20% 14,100 0.20% 54,100 0.20%
TOTAL NORTH AMERICA 230,500 0.10% 230,500 0.10% 188,700 0.13%
South America
Conga, Peru 51.35% 0 0.00% 89,300 0.19% 89,300 0.19% 130,480 0.19%
TOTAL SOUTH AMERICA 89,300 0.19% 89,300 0.19% 130,480 0.19%
Asia Pacific
Batu Hijau, Indonesia (3)
48.50% 3,400 0.36% 157,400 0.33% 160,900 0.33% 37,300 0.25%
Boddington, Western Australia 100.00% 25,100 0.07% 493,400 0.09% 518,500 0.09% 53,100 0.08%
TOTAL ASIA PACIFIC 28,500 0.10% 650,800 0.15% 679,400 0.15% 90,400 0.15%
TOTAL NEWMONT WORLDWIDE 28,500 0.10% 970,600 0.14% 999,200 0.14% 409,580 0.15%
(1)
(2)
(3)
Mineralized material is reported exclusive of reserves.
Mineralized material calculated at a copper price of US$3.50 or A$3.70 per pound unless otherwise noted. 2010 mineralized material was
calculated at a copper price of US$3.00 or A$3.50 per pound. Tonnage amounts have been rounded to the nearest 100,000.
Percentage reflects Newmont's economic interest at December 31, 2011.
Newmont Mining Corporation | Bank of America-Merrill Lynch Global Mining & Metals Conference | www.newmont.com May 15, 2012 41
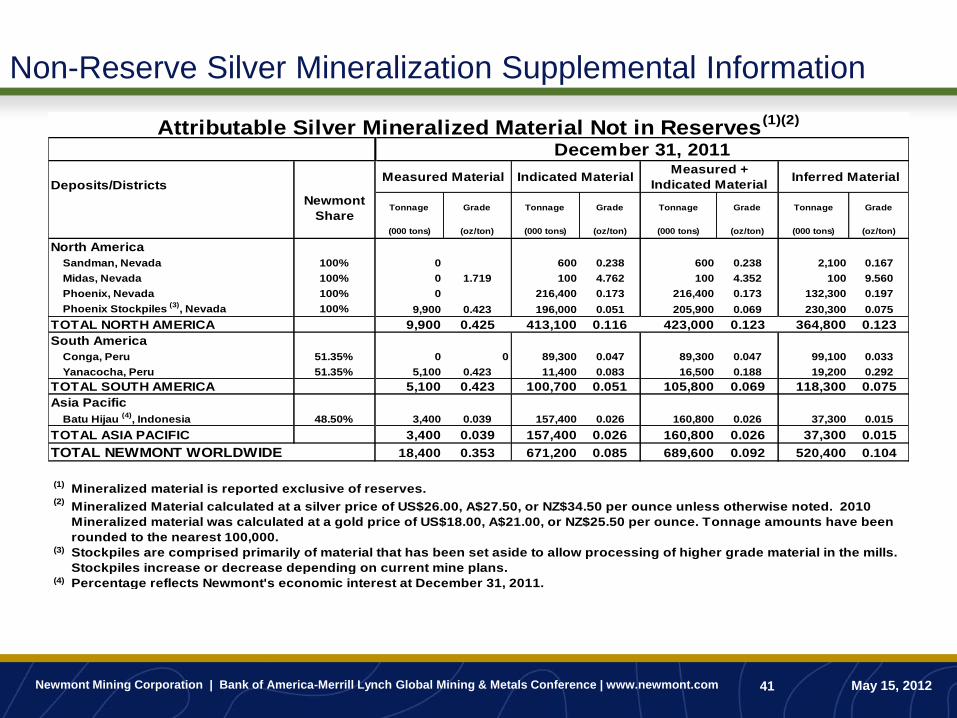
Non-Reserve Silver Mineralization Supplemental Information
Deposits/Districts
Newmont
ShareTonnage Grade Tonnage Grade Tonnage Grade Tonnage Grade
(000 tons) (oz/ton) (000 tons) (oz/ton) (000 tons) (oz/ton) (000 tons) (oz/ton)
North America
Sandman, Nevada 100% 0 600 0.238 600 0.238 2,100 0.167
Midas, Nevada 100% 0 1.719 100 4.762 100 4.352 100 9.560
Phoenix, Nevada 100% 0 216,400 0.173 216,400 0.173 132,300 0.197
Phoenix Stockpiles (3)
, Nevada 100% 9,900 0.423 196,000 0.051 205,900 0.069 230,300 0.075
TOTAL NORTH AMERICA 9,900 0.425 413,100 0.116 423,000 0.123 364,800 0.123
South America
Conga, Peru 51.35% 0 0 89,300 0.047 89,300 0.047 99,100 0.033
Yanacocha, Peru 51.35% 5,100 0.423 11,400 0.083 16,500 0.188 19,200 0.292
TOTAL SOUTH AMERICA 5,100 0.423 100,700 0.051 105,800 0.069 118,300 0.075
Asia Pacific
Batu Hijau (4)
, Indonesia 48.50% 3,400 0.039 157,400 0.026 160,800 0.026 37,300 0.015
TOTAL ASIA PACIFIC 3,400 0.039 157,400 0.026 160,800 0.026 37,300 0.015
TOTAL NEWMONT WORLDWIDE 18,400 0.353 671,200 0.085 689,600 0.092 520,400 0.104
(1)
(2)
(3)
(4)
Mineralized material is reported exclusive of reserves.
Mineralized Material calculated at a silver price of US$26.00, A$27.50, or NZ$34.50 per ounce unless otherwise noted. 2010
Mineralized material was calculated at a gold price of US$18.00, A$21.00, or NZ$25.50 per ounce. Tonnage amounts have been
rounded to the nearest 100,000.
Stockpiles are comprised primarily of material that has been set aside to allow processing of higher grade material in the mills.
Stockpiles increase or decrease depending on current mine plans.
Attributable Silver Mineralized Material Not in Reserves(1)(2)
December 31, 2011
Measured Material Indicated MaterialMeasured +
Indicated Material Inferred Material
Percentage reflects Newmont's economic interest at December 31, 2011.

Newmont Mining Corporation | Bank of America-Merrill Lynch Global Mining & Metals Conference | www.newmont.com May 15, 2012 42
Non-Reserve Mineralization Definitions
Supplemental Information (continued)
Defined terms and Statement Regarding Reserves and NRM: Ian Douglas, Newmont‟s Group Executive of Reserves and Geostatistics, is the qualified person responsible for the preparation of the reserve and NRM estimates in this presentation.
The reserves disclosed in this presentation have been prepared in compliance with Industry Guide 7 published by the SEC. Investors are encouraged to read the footnotes to the tables
included on slides 36-41, as well as the definitions and cautionary statements included herein.
As used in this presentation, the term “reserve” means that part of a mineral deposit that can be economically and legally extracted or produced at the time of the reserve determination.
The term “economically,” as used in this definition, means that profitable extraction or production has been established or analytically demonstrated in a full feasibility study to be viable
and justifiable under reasonable investment and market assumptions. The term “legally,” as used in this definition, does not imply that all permits needed for mining and processing have
been obtained or that other legal issues have been completely resolved. However, for a reserve to exist, Newmont must have a justifiable expectation, based on applicable laws and
regulations, that issuance of permits or resolution of legal issues necessary for mining and processing at a particular deposit will be accomplished in the ordinary course and in a
timeframe consistent with Newmont‟s current mine plans. Reserves in this presentation may be aggregated from the Proven and Probable classes.
As used in this presentation, the term ”non-reserve mineralization” or “NRM” refers to Measured, Indicated and/or Inferred materials, which are exclusive of reserves. Newmont has
determined that such NRM would be substantively the same as those prepared using the Guidelines established by the Society of Mining, Metallurgy and Exploration and defined as
Resources. Estimates of NRM are subject to further exploration and development, are subject to additional risks, and no assurance can be given that they will eventually convert to
future mineral reserves of the Company. In addition, our current or future reserves and exploration and development projects may not result in new mineral producing operations. Even
if significant mineralization is discovered and converted to reserves, it will likely take many years from the initial phases of exploration to development and ultimately to production, during
which time the economic feasibility of production may change.
Additionally, references to “attributable ounces,” “attributable pounds” and “attributable mineralization” in this presentation are intended to mean that portion of gold or copper produced,
sold or included in Proven and Probable reserves or NRM that is attributable to our ownership or economic interest.
For a description of the key assumptions, parameters and methods used to estimate mineral reserves and mineralized material, as well as a general discussion of the extent to which
the estimates may be affected by any known environmental, permitting, legal, title, taxation, socio-political, marketing or other relevant factors, please see Newmont‟s most recent
Annual Report on Form 10-K, filed on February 24, 2012, and other SEC filings.

Newmont Mining Corporation | Bank of America-Merrill Lynch Global Mining & Metals Conference | www.newmont.com May 15, 2012 43
Non-Reserve Mineralization Definitions
Supplemental Information (continued)
Defined terms and Statement Regarding Reserves and NRM: Ian Douglas, Newmont‟s Group Executive of Reserves and Geostatistics, is the qualified person responsible for the preparation of the reserve and NRM estimates in this presentation.
The reserves disclosed in this presentation have been prepared in compliance with Industry Guide 7 published by the SEC. Investors are encouraged to read the footnotes to the tables
included on slides 36-41, as well as the definitions and cautionary statements included herein.
As used in this presentation, the term “reserve” means that part of a mineral deposit that can be economically and legally extracted or produced at the time of the reserve determination.
The term “economically,” as used in this definition, means that profitable extraction or production has been established or analytically demonstrated in a full feasibility study to be viable
and justifiable under reasonable investment and market assumptions. The term “legally,” as used in this definition, does not imply that all permits needed for mining and processing have
been obtained or that other legal issues have been completely resolved. However, for a reserve to exist, Newmont must have a justifiable expectation, based on applicable laws and
regulations, that issuance of permits or resolution of legal issues necessary for mining and processing at a particular deposit will be accomplished in the ordinary course and in a
timeframe consistent with Newmont‟s current mine plans. Reserves in this presentation may be aggregated from the Proven and Probable classes.
As used in this presentation, the term ”non-reserve mineralization” or “NRM” refers to Measured, Indicated and/or Inferred materials, which are exclusive of reserves. Newmont has
determined that such NRM would be substantively the same as those prepared using the Guidelines established by the Society of Mining, Metallurgy and Exploration and defined as
Resources. Estimates of NRM are subject to further exploration and development, are subject to additional risks, and no assurance can be given that they will eventually convert to
future mineral reserves of the Company. In addition, our current or future reserves and exploration and development projects may not result in new mineral producing operations. Even
if significant mineralization is discovered and converted to reserves, it will likely take many years from the initial phases of exploration to development and ultimately to production, during
which time the economic feasibility of production may change.
Additionally, references to “attributable ounces,” “attributable pounds” and “attributable mineralization” in this presentation are intended to mean that portion of gold or copper produced,
sold or included in Proven and Probable reserves or NRM that is attributable to our ownership or economic interest.
For a description of the key assumptions, parameters and methods used to estimate mineral reserves and mineralized material, as well as a general discussion of the extent to which
the estimates may be affected by any known environmental, permitting, legal, title, taxation, socio-political, marketing or other relevant factors, please see Newmont‟s most recent
Annual Report on Form 10-K, filed on February 24, 2012, and other SEC filings.

Newmont Mining Corporation | Bank of America-Merrill Lynch Global Mining & Metals Conference | www.newmont.com May 15, 2012 44
Increased Gold Price-Linked Dividend11
Indicative Payout Table
Gold Price
($/oz)
$1,100-
$1,199
$1,200-
$1,299
$1,300-
$1,399
$1,400-
$1,499
$1,500-
$1,599
$1,600-
$1,699
$1,700-
$1,799
$1,800-
$1,899
$1,900-
$1,999
$2,000-
$2,199
Dividend per
Share ($/qtr) $0.10 $0.15 $0.20 $0.25 $0.30 $0.35 $0.425 $0.50 $0.575 $0.675
Dividend per
Share ($/yr) $0.40 $0.60 $0.80 $1.00 $1.20 $1.40 $1.70 $2.00 $2.30 $2.70
Dividend Yield:
NEM @ $60/sh 0.7% 1.0% 1.3% 1.7% 2.0% 2.3% 2.8% 3.3% 3.8% 4.5%
Dividend Yield:
NEM @ $70/sh 0.6% 0.9% 1.1% 1.4% 1.7% 2.0% 2.4% 2.9% 3.3% 3.9%
Dividend Yield:
NEM @ $80/sh 0.5% 0.8% 1.0% 1.3% 1.5% 1.8% 2.1% 2.5% 2.9% 3.4%
Q1’2012 Avg. Realized Gold
Price $1,684/oz
Appendix E – Cautionary Statement and
Footnotes

Newmont Mining Corporation | Bank of America-Merrill Lynch Global Mining & Metals Conference | www.newmont.com May 15, 2012 46
Cautionary Statement Regarding
2012 Outlook
2012 Outlook projections contained in this presentation (“Outlook”) are considered “forward-looking statements” within the
meaning of Section 27A of the Securities Act of 1933, as amended, and Section 21E of the Securities Exchange Act of 1934, as
amended, which are intended to be covered by the safe harbor created by such sections and other applicable laws. Outlook
represents management‟s good faith estimates or expectations of future results as of February 24, 2012 and is based upon
certain assumptions. Such assumptions, include, but are not limited to: (i) there being no significant change to current
geotechnical, metallurgical, hydrological and other physical conditions; (ii) permitting, development, operations and expansion
of the Company‟s projects being consistent with current expectations and mine plans; (iii) political developments in any
jurisdiction in which the Company operates being consistent with its current expectations; (iv) certain exchange rate
assumptions for the Australian dollar to the U.S. dollar, as well as other the exchange rates, being approximately consistent with
current levels; (v) certain price assumptions for gold, copper and oil; (vi) prices for key supplies being approximately consistent
with current levels; and (vii) the accuracy of our current mineral reserve and mineral resource estimates. However, Outlook is
subject to risks, uncertainties and other factors, including that such assumptions may prove to be incorrect and other factor
referred to on slide, which could cause actual results to differ materially from Outlook. Consequently, Outlook cannot be
guaranteed. Investors are cautioned that the Company does not undertake to subsequently reaffirm, provide comfort or
otherwise update Outlook to reflect events or circumstances after the date hereof or to reflect the occurrence of unanticipated
events. Investors should not assume that any lack of update constitutes a current reaffirmation of Outlook. Continued reliance
on Outlook after the date it is first issued is at investors' own risk.

Newmont Mining Corporation | Bank of America-Merrill Lynch Global Mining & Metals Conference | www.newmont.com May 15, 2012 47
2012 Outlook
Description
Consolidated Expenses
($M)
Attributable Expenses
($M)
General & Administrative $210 - $230 $210 - $230
Interest Expense $240 - $260 $230 - $250
DD&A $1,050 - $1,080 $890 - $920
Exploration Expense $400 - $430 $360 - $390
Advanced Projects & R&D $475 - $525 $430 - $480
Tax Rate 28% - 32% 28% - 32%
Assumptions
Gold Price ($/ounce) $1,500 $1,500
Copper Price ($/pound) $3.50 $3.50
Oil Price ($/barrel) $90 $90
AUD Exchange Rate 1.00 1.00
Attributable Production Consolidated CAS Consolidated Capital Attributable Capital
Region (Kozs, Mlbs) ($/oz, $/lb) Expenditures ($M) Expenditures ($M)
Nevada 1,725 - 1,800 $575 - $625 $650 - $750 $650 - $750
La Herradura 200 - 240 $460 - $510 $80 - $130 $80 - $130
North America 1,900 - 2,000 $570 - $630 $780 - $830 $780 - $830
Yanacocha 650 - 700 $480 - $530 $530 - $580 $270 - $310
La Zanja 40 - 50 n/a - -
Conga a - - $1,150 - $1,250 $600 - $650
South America 700 - 750 $480 - $530 $1,750 - $1,950 $800 - $900
Boddington 750 - 800 $800 - $850 $215 - $245 $215 - $245
Other Australia/NZ 980 - 1,030 $810 - $860 $375 - $400 $375 - $400
Batu Hijau e 45 - 55 $800 - $850 $200 - $230 $95 - $105
Asia Pacific 1,775 - 1,885 $800 - $850 $800 - $900 $700 - $800
Ahafo 570 - 600 $500 - $550 $240 - $270 $240 - $270
Akyem - - $370 - $420 $370 - $420
Africa 570 - 600 $500 - $550 $600 - $700 $600 - $700
Corporate/Other - - $60 - $70 $60 - $70
Total Gold 5,000 - 5,200 $625 - $675 b,c $4,000 - $4,300 d $3,000 - $3,300
Boddington 70 - 80 $2.00 - $2.25 - -
Batu Hijau e 80 - 90 $1.80 - $2.20 - -
Total Copper 150 - 170 $1.80 - $2.20
b 2012 Attributable CAS Outlook is $640 - $690 per ounce.c 2012 Net Attributable CAS Outlook (inclusive of by-product credits) is $600 - $650 per ounce.d Includes capitalized interest of approximately $140 million.e Assumes Batu Hijau economic interest of 44.5625% for 2012, subject to final divestiture obligations.
a The above 2012 capital expenditures outlook for the Conga project assumes development as initially anticipated by management when
the Company announced its original 2012 outlook on January 17, 2012 and it is not being reaffirmed at this time. As previously disclosed,
development of the Conga project was temporarily suspended in November, 2011 and future development remains subject to certain risks,
including political and social unrest risks, and uncertainties, including those relating to the evaluation of the recommendations resulting
from the Conga project EIA review. Accordingly, investors are cautioned not to place undue reliance on this future look ing statement. The
Company will reevaluate its capital expenditure outlook after the development schedule of Conga is more clearly defined. Should the
Company be unable to continue with the current development plan at Conga, it may reprioritize and reallocate capital to development
alternatives in Nevada, Australia, Ghana, and Indonesia.

Newmont Mining Corporation | Bank of America-Merrill Lynch Global Mining & Metals Conference | www.newmont.com May 15, 2012 48
Endnotes
.
Investors are encouraged to read the information contained in this presentation in conjunction with the following notes footnotes, the Cautionary Statement on slide 2 and the factors described under the “Risk Factors” section
of the Company’s most recent Form 10-K, filed with the SEC on February 24, 2012.
1. 2017 potential production metrics are targets and should be considered forward-looking statements. See the cautionary statement on slide 2 of this presentations and footnotes 4 and 5 below.
2. Estimated mineralization “potential” and “exploration upside” refer to mineralization that are additional to current Reserves and Non-Reserve Mineralization (“NRM”). Conversion of such mineralization to Reserves or
NRM is subject to substantive risks inherent in the mining industry, and no assurance can be given that such inventory will be converted to Reserves or NRM or of the timing or terms of any such conversion. Even if
significant mineralization is discovered and converted to Reserves, it will likely take many years from the initial phases of exploration to development and to production, during which time the economic feasibility of
production may change. As a result, there is greater uncertainty of the conversion of such inventory to production than in the case of Reserves or NRM. For additional information on Newmont‟s Reserves and NRM, see
our Year-End Reserve Report (as of 12/31/11) available at www.newmont.com/our-investors/reserves-and-resources. For a description of the key assumptions, parameters and methods used to estimate mineral
reserves and mineralized material, as well as a general discussion of the extent to which the estimates may be affected by any known environmental, permitting, legal, title, taxation, socio-political, metals prices or other
relevant factors, please see Newmont‟s Form.
3. Newmont‟s attributable gold production was 5,185Koz. 2011 attributable copper production was 206 Mlbs.
4. The ability to deliver the production potential indicated in the gold box on slide 4 remain subject to certain risks and uncertainties and are based upon certain assumptions, including gold price, CAS and that Due to local
political and community protests, construction and development activities at the Conga project were largely suspended in November 2011 and recommencement remains subject to certain risks and uncertainties,
including those relating to the Environmental Impact Assessment (“EIA”) review. The Conga project‟s EIA, which was previously approved by the central government of Peru in October 2010 following an extensive
public engagement process, was subject to a review by independent experts during the first quarter at the request of the central government. The results of the independent review were released on April 17, 2012 and
confirmed that the EIA met Peruvian and international standards. The Company is currently in the process of evaluating the recommendations contained in the independent report, and additional recommendations from
the central government related to the report, to assess the impact on the project economics. For additional information, see Newmont‟s most recent Form 10-K filed with the SEC, under the heading “Risk Factors - Our
operations at Yanacocha and the development of our Conga Project in Peru are subject to political and social unrest risks, which have resulted most recently in the suspension of construction activities in our Conga
project.”
5. When used in this presentation, the phrase “potential production” represents the sum for all projects of the current estimated average annual production targets for 2017 for each such project anticipated to be
commissioned by 2017. Additionally, unless otherwise indicated, references to potential production used in this presentation mean that portion that is attributable to Newmont's ownership or economic interest. Such
estimates are subject to change based upon risks, future events and potential modifications to the business plan as indicated on slide 2. Newmont currently forecasts 2017 attributable gold and copper production of
approximately 7Moz and 400 Mlbs, respectively.
6. Refer to slide 34 for reconciliation to GAAP net income attributable to Newmont stockholders.
7. Refer to slide 34 for reconciliation to GAAP net income per share attributable to Newmont stockholders.
8. Average realized gold price is determined for each preceding quarter net of applicable treatment and refining costs incurred during the quarter and provisional pricing mark-to-market adjustments, if any.
9. Gold operating margin calculated as average realized gold price per ounce, less gold cost applicable to sales per ounce.
10. Copper operating margin calculated as average realized copper price per pound, less copper cost applicable to sales per pound.
11. Figures shown for projects are on an attributable basis.
12. See Note 4 above.
13. In January 2011, Fronteer Gold released an interim resource estimate for Long Canyon, which reported Measured and Indicated resources of approximately 0.071 and 1.324 million gold ounces, respectively, and an
additional Inferred resource of approximately 0.8 million gold ounces. U.S. investors are cautioned that Fronteer Gold provided its public disclosures at the time of acquisition in the terms of "Measured resources",
“Indicated resources” and "Inferred resource.” While these terms are recognized and required by Canadian regulations, these terms are not defined terms under the SEC‟s Industry Guide 7. U.S. Investors are cautioned
not to assume that any part or all of mineral deposits in the "Measured resources” and “Indicated resources" categories will ever be converted into Reserves. Additionally, "Inferred resources" have a great amount of
uncertainty as to their existence, and great uncertainty as to their economic and legal feasibility. It cannot be assumed that all or any part of an inferred mineral resource will ever be upgraded to a higher category.
Under Canadian rules, estimates of Inferred resources may not form the basis of a feasibility study or prefeasibility studies, except in rare cases. Accordingly, U.S. Investors are cautioned not to assume that any part or
all of an Inferred resource exists or is economically or legally minable. No ounces are currently in the Company‟s Reserves or NRM for Long Canyon. Additionally, drill results illustrated on slide 10 are not necessarily
indicative of future drill results, NRM, Reserves or production.
14. See Note 2 above. NRM used in this presentation and on slides 12 and 13 refers to Measured, Indicated and/or Inferred materials that would be additional to Reserves. Newmont has determined that such NRM would
be substantively the same as those prepared using the Guidelines established by the Society of Mining, Metallurgy and Exploration and defined as Resources. The conversion of NRM to Reserves is subject to
substantive risks inherent in the mining industry, and no assurance can be given that NRM will be converted to Reserves or of the timing or terms of any such conversion. Even if significant mineralization is discovered
and converted to reserves, it will likely take many years from the initial phases of exploration to development and to production, during which time the economic feasibility of production may change. As a result, there is
greater uncertainty of the conversion of NRM to production than in the case of Reserves. NRM and Reserve estimates in this presentation are as of 12/31/11. See slides 36-43 for more information.
15. Newmont has established a gold price-linked dividend policy that serves as a non-binding guideline for Newmont‟s Board of Directors (the “Board”). The Board reserves all powers related to the declaration and payment
of dividends. In addition, the declaration and payment of future dividends remain at the discretion of the Board and will be determined based on Newmont‟s financial results, cash and liquidity requirements, future
prospects and other factors deemed relevant by the Board. In determining the dividend to be declared and paid on the common stock of the Company, the Board may revise or terminate such policy at any time without
prior notice. See slide 44 for additional information.
16. Not adjusted for inflation or other cost pressure estimates.
17. Current drill results and drilled mineralization are not indicative of future results, NRM, Reserves, or production.