05 epc contractors
TRANSCRIPT
®
EPC Contractors: Changing with the Industry
Larry Bolander
AIChE Management Division ConferenceApril 2007
HO20060444_001.ppt2®
AgendaAgenda
What makes EPC Contractors Successful?
The World Yesterday
The World Today
Where are the Resources?
Staying Up with the Changing Technologies
Market Uncertainty – Procurement Challenges
EPC Challenges
Future State of Industry

HO20060444_001.ppt3®
What Makes EPC Contractors Successful?What Makes EPC Contractors Successful?
Meeting Owner’s
Objectives
Delivering Value• Technology experience• Resources & services• Improving lifecycle costs
Delivering Quality Work
Economic Compensation
HO20060444_001.ppt4®
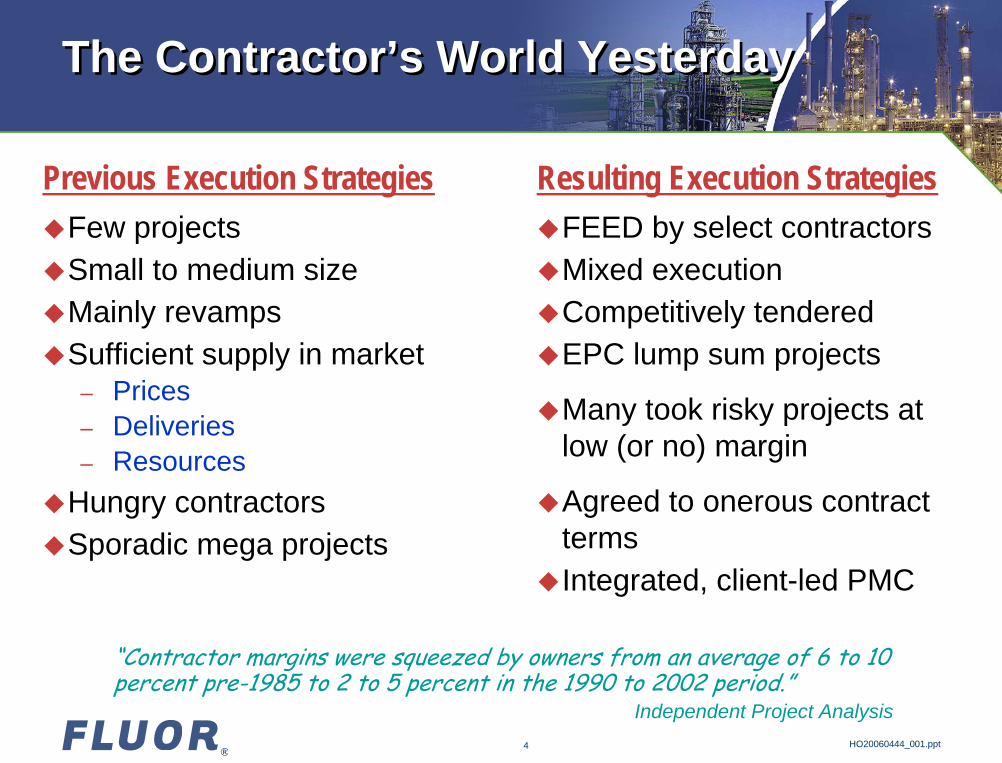
The Contractor’s World YesterdayThe Contractor’s World Yesterday
Few projectsSmall to medium size Mainly revampsSufficient supply in market
– Prices– Deliveries– Resources
Hungry contractorsSporadic mega projects
FEED by select contractorsMixed execution Competitively tendered EPC lump sum projects
Many took risky projects at low (or no) margin
Agreed to onerous contract termsIntegrated, client-led PMC
Previous Execution Strategies Resulting Execution Strategies
“Contractor margins were squeezed by owners from an average of 6 to 10 percent pre-1985 to 2 to 5 percent in the 1990 to 2002 period.”
Independent Project Analysis
HO20060444_001.ppt5®
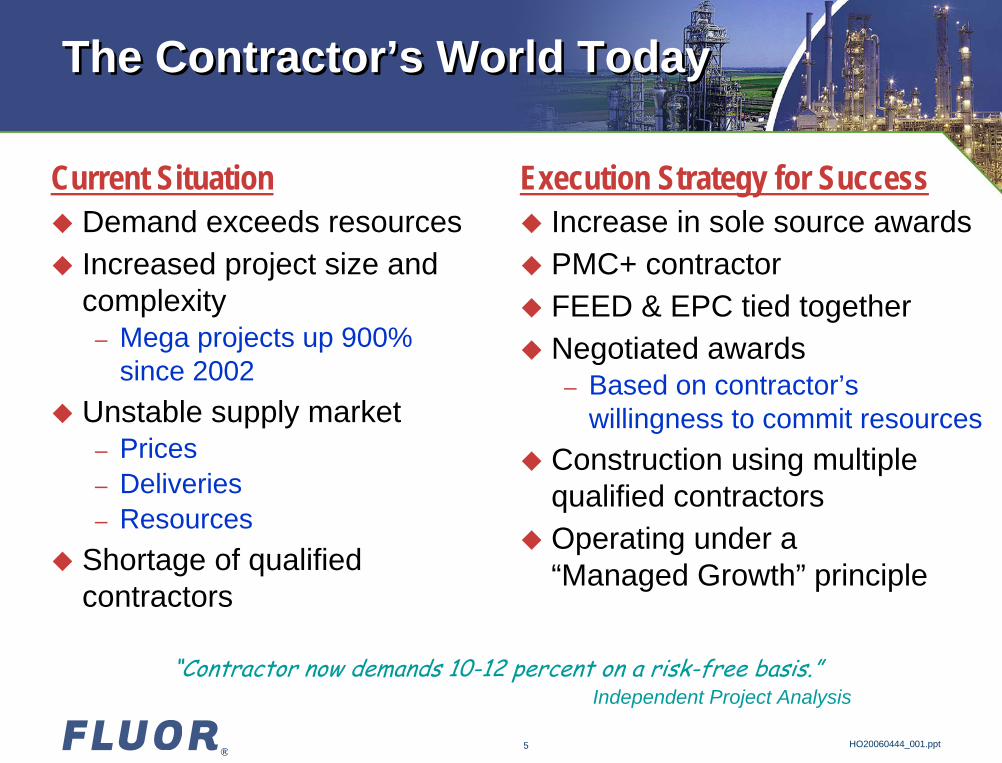
The Contractor’s World TodayThe Contractor’s World Today
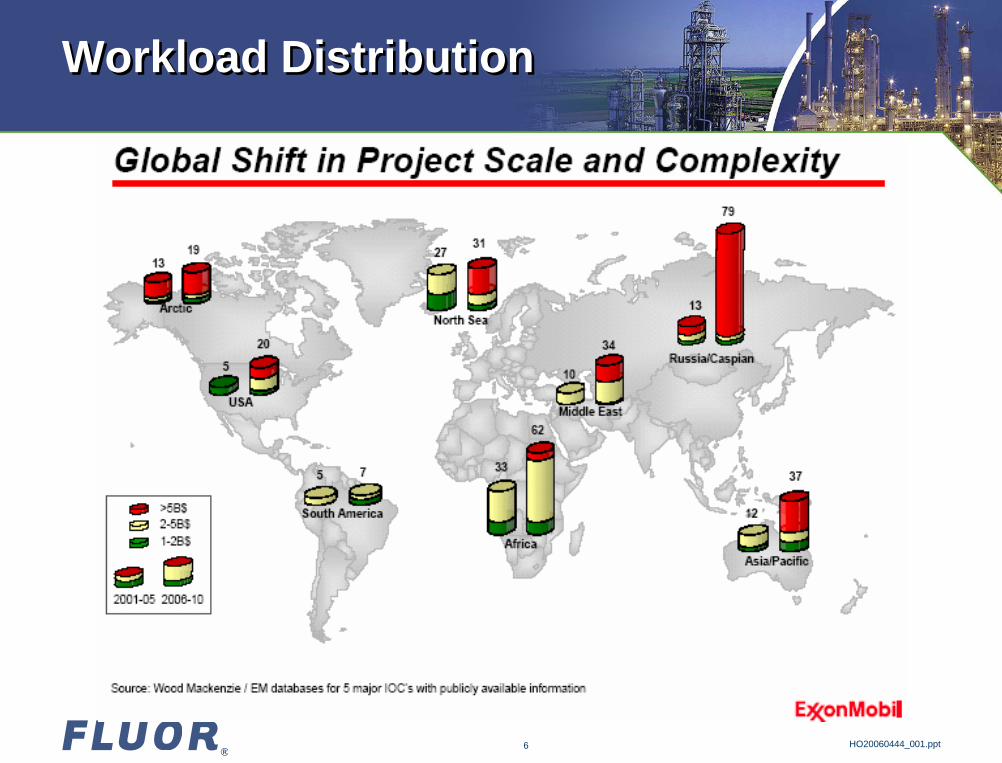
Current SituationDemand exceeds resourcesIncreased project size and complexity
– Mega projects up 900% since 2002
Unstable supply market– Prices– Deliveries– Resources
Shortage of qualified contractors
Execution Strategy for SuccessIncrease in sole source awardsPMC+ contractor FEED & EPC tied togetherNegotiated awards
– Based on contractor’s willingness to commit resources
Construction using multiple qualified contractorsOperating under a “Managed Growth” principle
“Contractor now demands 10-12 percent on a risk-free basis.”Independent Project Analysis
HO20060444_001.ppt6®
Workload DistributionWorkload Distribution

HO20060444_001.ppt7®
IPA Regional Risk Distribution(Regions Displaying Highest Risk Premiums)IPA Regional Risk Distribution(Regions Displaying Highest Risk Premiums)
HO20060444_001.ppt8®
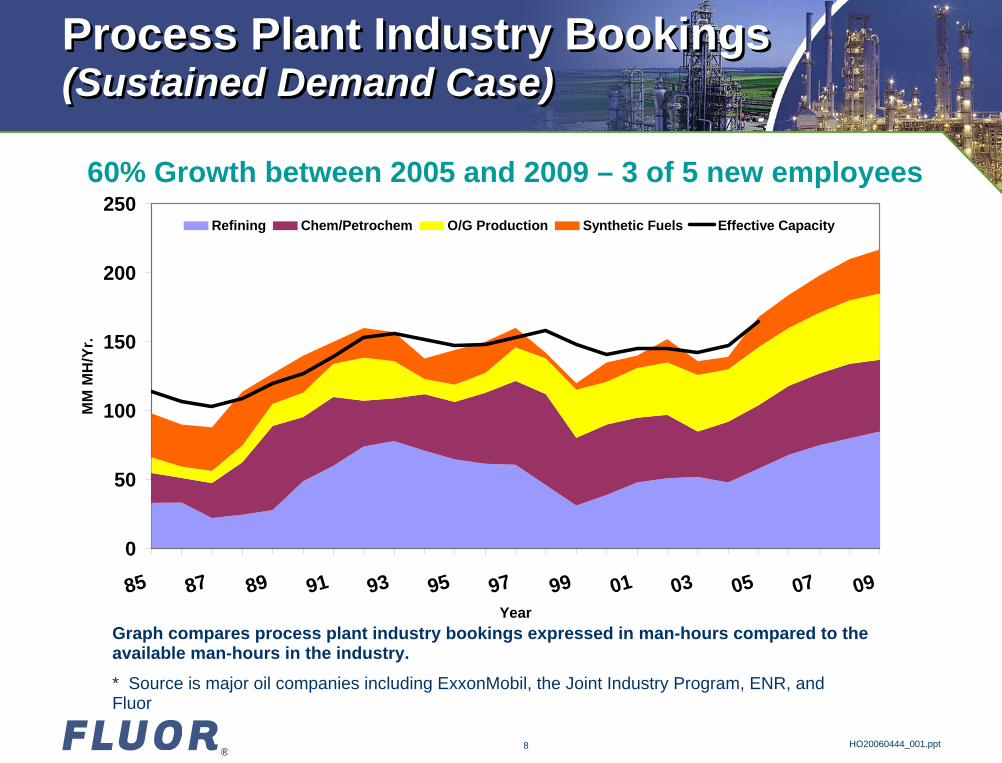
Process Plant Industry Bookings(Sustained Demand Case)Process Plant Industry Bookings(Sustained Demand Case)
Graph compares process plant industry bookings expressed in man-hours compared to the available man-hours in the industry.
* Source is major oil companies including ExxonMobil, the Joint Industry Program, ENR, and Fluor
0
50
100
150
200
250
85 87 89 91 93 95 97 99 01 03 05 07 09Year
MM
MH
/Yr.
Refining Chem/Petrochem O/G Production Synthetic Fuels Effective Capacity
60% Growth between 2005 and 2009 – 3 of 5 new employees

HO20060444_001.ppt9®
Where Are the Resources? N. America Bachelor’s Degrees from 1999-2005Where Are the Resources? N. America Bachelor’s Degrees from 1999-2005
0
10000
20000
30000
40000
50000
60000
70000
80000
1999 2001 2003 2005
Total Disciplines EPC DisciplinesInformation from 334 USA & 7 Canadian Engineering Colleges
Source Michael T. GibbonsAmerican Society for Engineering Education
20% increase in Engineering Bachelor Degrees since 1999
3% increase in 5 major areas for EPC contractors since 1999
27% decrease in Chemical Engineering from 1999 to 2005
12% decrease in Civil Engineering from 1999 to 2005
HO20060444_001.ppt10®
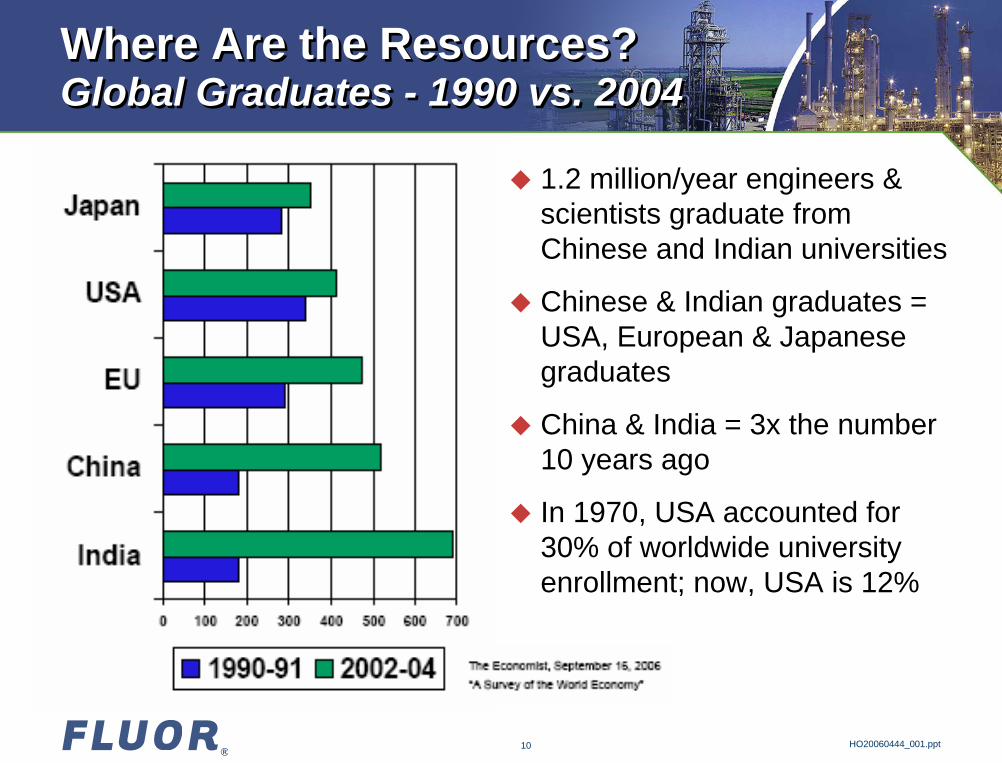
Where Are the Resources? Global Graduates - 1990 vs. 2004Where Are the Resources? Global Graduates - 1990 vs. 2004
1.2 million/year engineers & scientists graduate from Chinese and Indian universities
Chinese & Indian graduates = USA, European & Japanese graduates
China & India = 3x the number 10 years ago
In 1970, USA accounted for 30% of worldwide university enrollment; now, USA is 12%
HO20060444_001.ppt11®
Where are the Resources?Fluor Support Of Educational ProgramsWhere are the Resources?Fluor Support Of Educational Programs
Actively recruit at 100 universities/technical institutes globally
Teaching at US, Kuwaiti, Poland & Chinese universities/schools
Developing global internship opportunities
Strategic partnerships with 15 US universities including:– Philanthropic contributions - engineering/construction departments,
student associations, scholarships– Participation in University Advisory Boards– Teaching & influencing curriculum development – Mentoring, summer internships & new grad recruiting
Commitment to diversity liaison programs– Society of Women Engineers (SWE)– National Society of Black Engineers (NSBE)– Society of Hispanic Professional Engineers (SHPE)
Outreach to 21,000+ elementary, middle school, high school students in 16 countries to raise profile / awareness of engineering
HO20060444_001.ppt12®
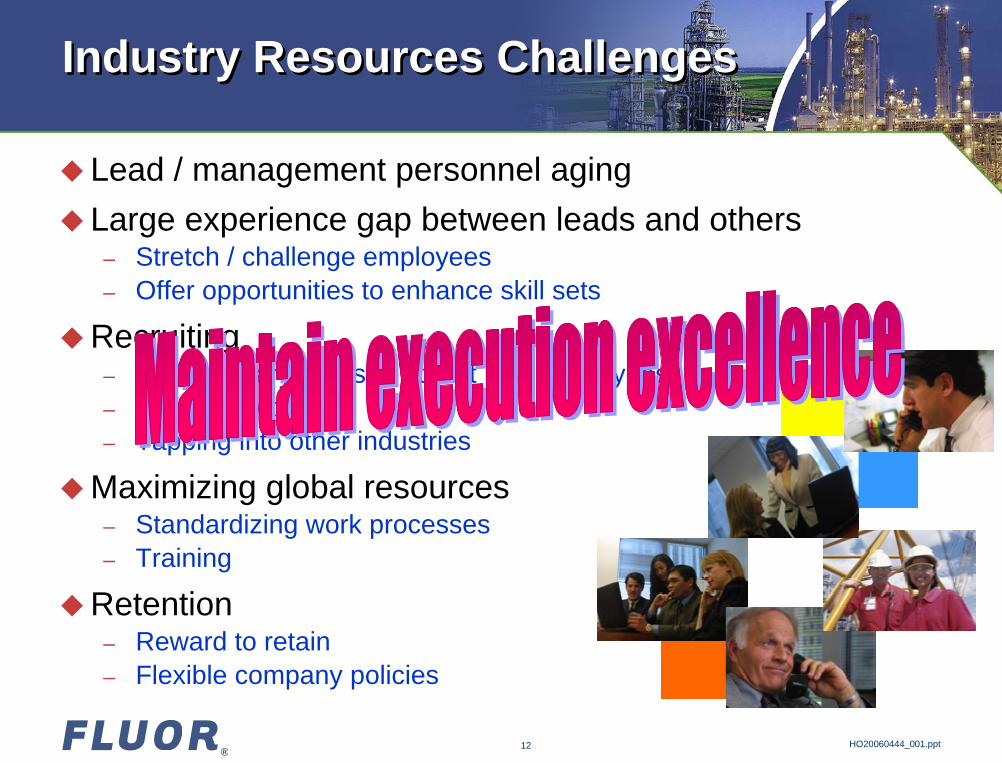
Industry Resources ChallengesIndustry Resources Challenges
Lead / management personnel agingLarge experience gap between leads and others
– Stretch / challenge employees– Offer opportunities to enhance skill sets
Recruiting– Higher salary offers to attract new employees– Hiring new grads – Tapping into other industries
Maximizing global resources– Standardizing work processes– Training
Retention– Reward to retain– Flexible company policies
HO20060444_001.ppt13®
Staying Up with the Changing TechnologiesStaying Up with the Changing Technologies
Schools teach “how it’s been done”
Contractors must anticipate trends before owners– Develop expertise– Begin process planning– Connect with licensors / suppliers
Investments shifting to non-petroleum-based plants– Ex. – Nuclear, coal gasification, bio-fuels
Writing the future on modifying processes – Ex. – CAD modified design / construction work processes
Large fabricators/suppliers doing more design work
HO20060444_001.ppt14®
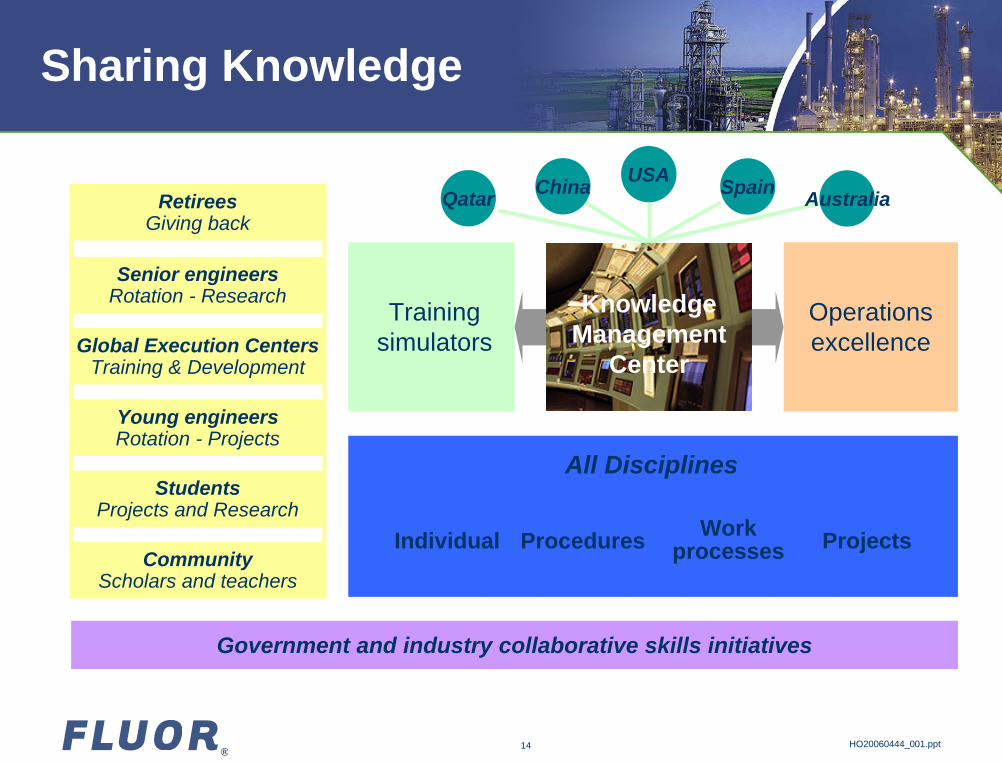
Sharing Knowledge
Senior engineersRotation - Research
Young engineersRotation - Projects
StudentsProjects and Research
CommunityScholars and teachers
Global Execution CentersTraining & Development
RetireesGiving back
Individual Procedures Work processes Projects
All Disciplines
Government and industry collaborative skills initiatives
Training simulators
Operations excellence
Qatar China USA Spain Australia
Knowledge Management
Center

HO20060444_001.ppt15®
Procurement Challenges:Market Uncertainty
Extremely volatile commodity, material and equipment prices
Extending lead times
Higher shop loads
Reasons:– Sustained raw material supply
and demand imbalance– Constraints throughout the
supply chain– Capacity not being added– Consolidation of 21 key
suppliers down to 4
Major Equipment EscalationGeneral Fabricated Equipment
Bulk Materials EscalationFabricated Pipe

HO20060444_001.ppt16®
EPC ChallengesEPC Challenges
Employees’ market – People jumping from company to company– Salaries increasing exponentially– Must market industry better to attract workers
Sharing knowledge
Expand fabricator resource base– Train third-world fabricators– Help them be successful
Owners need contractors to be execution partners– Higher investments (mega projects) require more commitment– Greater investment for contractors to grow business
(salaries, real estate, equipment, training, etc.)– Higher fees – Wall Street expectations
HO20060444_001.ppt17®
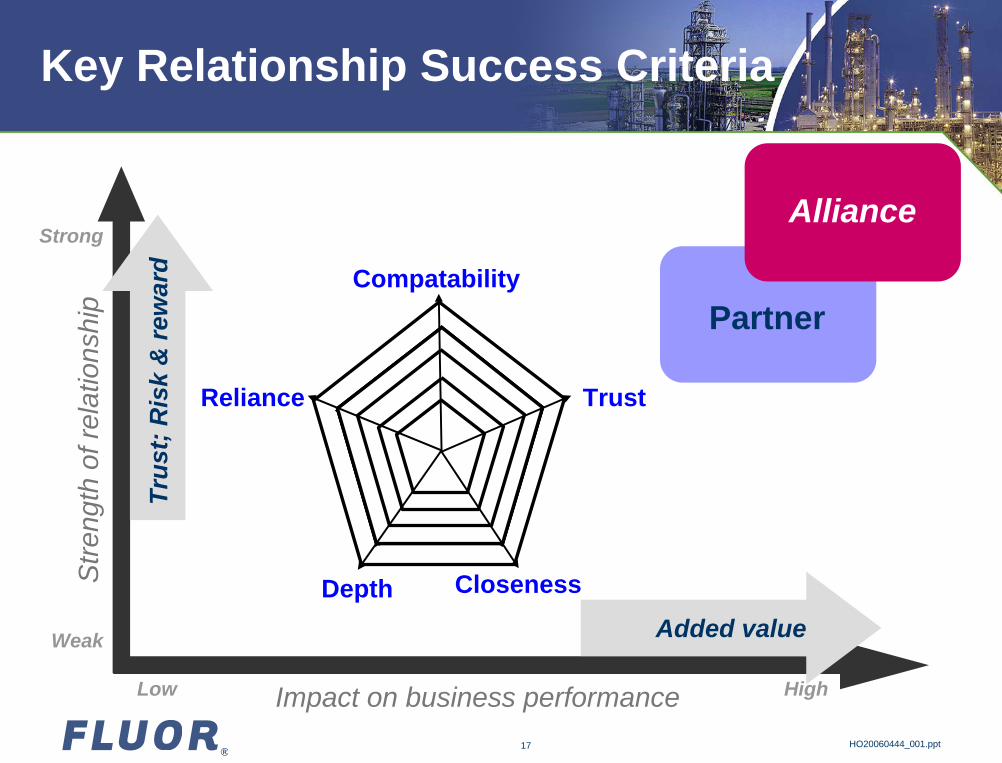
Key Relationship Success CriteriaS
treng
th o
f rel
atio
nshi
p
Impact on business performance
Weak
Strong
HighLow
Partner
Trus
t; R
isk
& re
war
d
Added value
Alliance
Compatability
Trust
ClosenessDepth
Reliance
HO20060444_001.ppt18®
Future State of IndustryFuture State of Industry
EPC workload to peak in 2009 – Large drop in “lead” resources in 2-5 years– More projects awarded to less qualified contractor teams– More projects will miss on costs and schedules– Contractors with best teams / tools / processes will succeed– Promoting engineering careers in schools
Contractors / owners / suppliers teaming on new technologies
Continued volatility for commodities / material / equipment
Owners adopting contracting strategies to meet market realities will experience best results
Large fabricators/suppliers doing more design work

®
Questions?
Larry Bolander
AIChE Management Division ConferenceApril 2007