06 inclusions in ellwood ingots isij ver3
TRANSCRIPT

1
Zhang, L., B. Rietow, B.G. Thomas, and K. Eakin, “Large Inclusions in Plain-Carbon Steel Ingots Cast by Bottom Teeming” ISIJ International, Vol. 46, No. 5, 2006; pp.670-679.
Large Inclusions in Plain-Carbon Steel Ingots Cast by Bottom Teeming
By
Prof. Lifeng Zhang (correspondence author)
Department of Materials Science and Engineering
Norwegian University of Science and Technology (NTNU)
Høgskoleringen 8,
7491 Trondheim, Norway.
Tel: 0047-73594123 Fax: 0047-73550203
Email: [email protected]
Mr. Bret Rietow
Formerly master student at Department of Mechanical & Industrial Engineering
University of Illinois at Urbana-Champaign
1206 W. Green St., Urbana,
IL 61801, USA
Prof. Brian G. Thomas
Department of Mechanical & Industrial Engineering
University of Illinois at Urbana-Champaign
1206 W. Green St., Urbana
IL 61801, USA
Tel: 1-217-333-6919 Fax: 1-217-244-6534
Email: [email protected]
Ken Eakin
Ellwood Quality Steel Company
700 Moravia St., New Castle, PA 16101
Email: [email protected]
2
Abstract
Inclusions in industrial-cast bottom-teemed ingots and runners of plain carbon steel are investigated
using ultrasonic detection, optical microscope observation, and SEM analysis. The composition, size
distribution, entrapment locations, and sources of ingot inclusions were revealed by examining all the
macro-inclusions (larger than 20µm) that were observed in 35,000 mm2 of sample surface area. Based
on 78 non-sulfide inclusions observed, around 3.23107 macro-inclusions per m
3 steel exist in the
ingot, with a size distribution increasing with decreasing size. Inclusions are distributed uniformly
within a given horizontal section through the ingot, but with more found towards the bottom. The
largest inclusions exceed 7mm and originated from mold flux in the ingot. The largest inclusion source
appears to be reoxidation, as evidenced by 59% of the ingot inclusions composed of pure alumina
clusters and lumps. Eroded refractories from the ladle well block and ladle inner nozzle bricks
accounted for 31% of the ingot inclusions. Reaction between the high-Mn steel, reoxidation with air,
and reaction with silica in the runner bricks caused very large (>7mm) compound inclusions of SiO2-
MnO-Al2O3 in the center of runners.
Key words: Steel Ingot, Inclusions, Runner, Mold flux, Alumina, Exogenous Inclusions

3
1. Introduction and Methodology
Although the fraction of steel produced in the world via ingot casting has decreased to 11.2% in
2003, this still comprised 108.7 million metric tonnes, including about 2.5 million tonnes in US 1).
Ingot casting is still important because some low-alloy steel grades and steel for special applications
can only be produced by this process. These include high carbon chromium bearing steel, 2) thick plate,
seamless tube, forgings, bars and wire rods.3)
The ever-increasing demands for high quality have made the steelmaker increasingly aware of the
necessity for products to meet stringent “cleanliness” requirements. Non-metallic inclusions are a
significant problem in cast steels that can lead to problems in castings that require expensive casting
repairs or rejection. The mechanical properties of steel are controlled to a large degree by the volume
fraction, size, distribution, composition and morphology of inclusions and precipitates, which act as
stress raisers. For example, ductility is appreciably decreased with increasing amounts of either oxides
or sulphides. 4) Fracture toughness decreases when inclusions are present, especially in higher-strength
lower-ductility alloys. Similar pronounced property degradation caused by inclusions is observed in
tests that reflect slow, rapid, or cyclic strain rates, such as creep, impact, and fatigue testing. 4) Pomey
and Trentini studied the inclusion removal in ingots from with various deoxidants. 5) Franklin 6), and
Miki et al 7) obtained a rough inclusion size distribution in steel ingots. Hilty and Kay 8), Pickering 9),
and Lunner 10)) investigated the compound exogenous inclusions in steel ingots by microscope and
SEM analysis. Thomas et al 11) and Leach 12) investigated the sources of exogenous nonmetallic
inclusions in steel ingots. Inclusions, especially large exogenous inclusions are perhaps the most
serious problem affecting steel ingots, and arise primarily from the incidental chemical and mechanical
interaction of the liquid steel with its surroundings. Refractory erosion of the ladle and metal delivery
system introduce inclusions that can impair the quality of what was otherwise very clean refined steel. 3,
9, 13-18) In addition, air entrainment 8, 19) during teeming generates reoxidation inclusions, such as alumina
clusters in Al-killed steels, and the turbulent flow and mixing with the teeming flux during the initial
entry of steel into the mold can induce flux entrainment 20-26) 27) during solidification. Inclusion
distribution in an ingot is affected by fluid flow, heat transfer and solidification of the steel. Two
studies 10, 28)of top-poured ingots found larger slag inclusions concentrate in the central bottom portion
of the ingot, and in the outer portions of the ingot top. It was reported that increased teeming
temperature decreases the amount of inclusions, because it facilitates their floatation removal by
natural convection. For a bottom-poured 2t ingot (with taper) of 0.50% C, Al-Si-Killed steel, the high-
melting-point inclusions (high alumina) predominate at the bottom of the ingot, while low-melting-
point inclusions (sulphide and silicates) are more abundant in its top central portion, due to the
mechanism of positive segregation. 29) It should be noticed that most of these papers on inclusions in
steel ingots were published before 1990s, and very few are published in recent 15 years.
This current work is part of a larger project to investigate inclusions in bottom-teemed steel ingots
by combining computational models and plant experiments conducted at member companies of the
Ingot Metallurgy Forum. A survey with responses from six steel ingot producers in the US revealed
that the total annual tonnage of bottom-poured ingots where cleanliness is a concern is at least 700,000
tons. Rejections at these companies due to inclusion defects range from 0.2 - 5% with a cost of $900-
3600/tonne (depending on grade). This corresponds to $10 million per year (assuming a typical
rejection rate of 1% at $1500/ton). From the survey replies, 10-25% of defects sources are estimated
to be related to ladle sand/packing sand entrapment, 25-50 from mold flux entrainment, 0-5% from
runner erosion, and 0-35% related to other exogenous inclusion sources. In addition to the above
exogenous inclusion sources, the companies estimated that 0-15% of their defects were from alumina
inclusions (deoxidation products), 0-20% from air absorption, 0-5% from reoxidation reactions with
slag and refractory, and 0-10% from unknown sources . Clearly, exogenous defects are the greatest
problem. The actual amount and nature of these inclusion sources is investigated in the present work,
based on industrial trials conducted at Ellwood Quality Steels Co.
4
2. Process Description and Methodology
This work investigates large inclusions measured in a bottom-teemed ingot of 1022 carbon steel,
with a composition (ladle analysis) shown in Table 1.
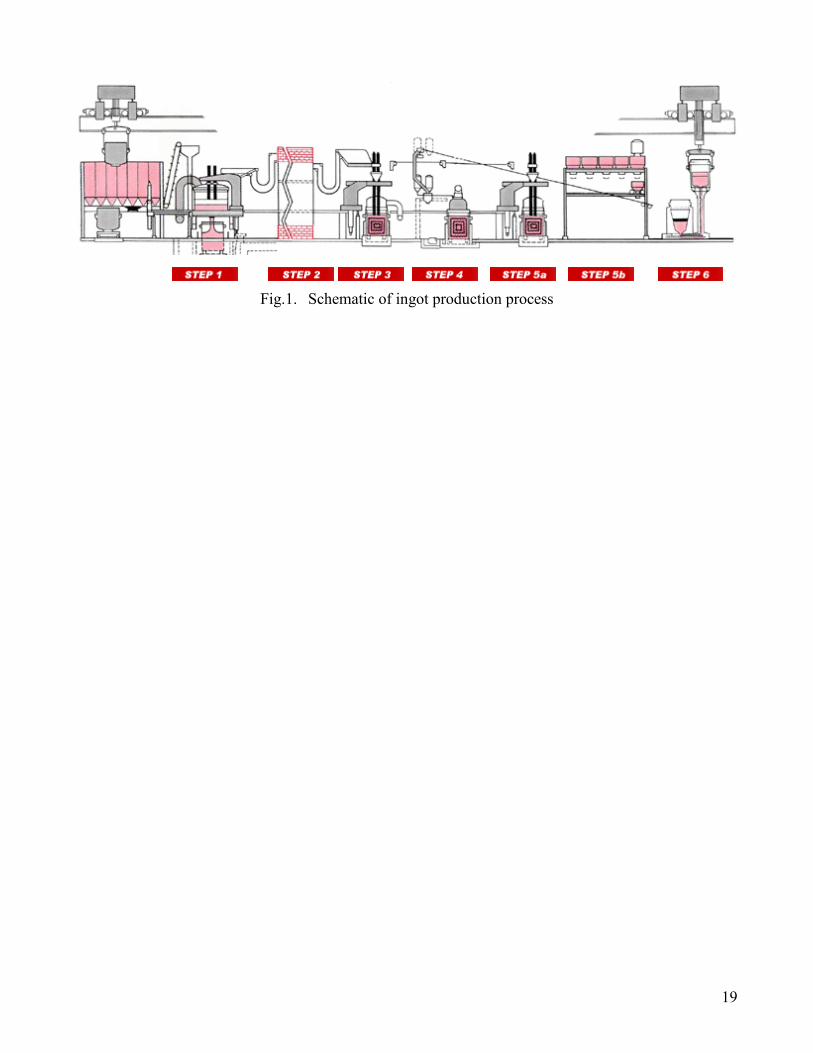
The ingot production process of concern is shown figure 1 and is described as follows:
Step1: Scrap is loaded into clam-shell buckets and charged into an ultra high powered (UHP)
eccentric bottom tapping furnace (EBT) electric arc furnace. The scrap is melted and
refined to remove carbon and phosphorus using an oxidizing slag.
Step2: The EBT feature minimizes heat loss and allows the liquid steel to be tapped relatively
slag-free into the ladle for further refining. During tapping, alloy additions are charged,
including aluminum for deoxidation, followed by the addition of a reducing top slag.
Step3: The ladle is transferred to a treatment station for heating, alloy adjustment and further
refining. Arc heating and induction stirring at this step ensures mixing and interaction
between the steel and the slag.
Step4: The steel bath undergoes vacuum degassing where the hydrogen level is lowered to less
than 1ppm. Induction and argon gas stirring are combined during this step to optimize
stirring energy.
Step5: The ladle is transferred to a second treatment station, where the steel may be reheated,
calcium treated via wire feeding. Final alloy adjustments are made as needed.
Step6: Heats are bottom teemed into ingots at a designated temperature and a controlled rate of
rise. Argon shrouding may be employed prior to teeming to minimize reoxidation and the
pick-up of hydrogen and nitrogen. Argon shrouding was not used on the test ingots of this
study, however.
For ladle opening, a slide gate is used. The free-open percentage is only about 50%. This low
percentage is a concern because it is well known from studies of continuous casting that lance-opening
of ladles induces serious reoxidation, increasing total oxygen (T.O.) oxygen in the tundish to 10ppm
higher than that by free opening. 30) The ladle slag was mainly CaO. Visual observation is the only
method used to detect and prevent slag carryover into the trumpet during teeming, so the standard
practice also requires extra metal in the ladle, so no slag pours into the trumpet. The teeming process
delivers the steel down a trumpet, through a “spider” distributing the flow into 7-8 round-section
runners with inner diameter of 50.8mm, across and up through inlets with the same diameter into each
mold in a cluster of 7-8 ingots. The compositions of the mold flux and refractories are shown in Table
2 and Figure 2, including the ladle lining, well block, filler sand, trumpet, and runner bricks, . Some of
the refractory contains high SiO2, which is known to cause severe reoxidization of molten steel. 31)
The ingots in this study were round with 0.33m diameter, 4.70m height and 2.91 metric tonnes in
weight. The total filling rate was around 1.4 tonne/min (23kg/s), with 3.3kg/s to each ingot. This
increased the ingot level at 4.87mm/s. The typical filling time was 13-18 minutes, Mold powder was
added by placing a 5-kg bag on the bottom of each ingot prior to teeming. Some operations suspend
the bags of powder above the bottom to lessen powder entrapment during the start of filling.25)
Important topics of interest include the filling rate (rate of rise), the delivery-system geometry, which
may cause turbulence and encourage mold powder entrapment, slag entrapment by vortexing near the
ladle nozzle at the end of teeming, argon shrouding, and the erosion of refractories.
After final solidification, the ingot was sectioned. Figure 3 diagrams how the samples were
obtained, where “A” indicates the direction away from runner from the trumpet. In total, 54 cube-
shaped steel samples of 25.4mm (1inch) per side were examined for inclusions. The total observation
area was almost 35,000mm2. In addition, the solidified runner bar/spider for this ingot was also
examined. After polishing, the samples were first observed under an optical microscope to mark the
locations of all inclusions larger than 20μm in diameter. Then, the detailed morphology and
composition of each inclusion was analyzed by scanning electron microscope (SEM) using Energy

5
Dispersive X-Ray Analysis. Almost all of the large non-sulfide inclusions were photographed. In
addition, several sample photographs were taken of the much more common indigenous sulfide
inclusions, and of the numerous holes (voids) that were larger than 20 m.
The results of these detailed tests were compared with standard industrial tests of ingot cleanliness.
Another ingot from the same cluster was cut into two 84-inch lengths with the hot top and ingate left
intact. These pieces were forged into 7.5 inch bars, measuring 238 inch in length. After machining
away 6mm (0.25in.) of the surface layer, inclusions in the resulting 7inch bars, were detected using
standard Ultra Sonic Scanning (USS).
2. Ingot Inclusions Analysis
2.1 Ultra Sonic Detection
In the forged bar samples detected by Submerged Ultra Sonic Scanning 32). This method is used for
detecting large inclusions or defects in the steel sample (as large as in tones), which is submerged in
water in a tank during detection. Using this method in the current study, only two inclusions were
detected. As shown in Figure 4, one of these macro-size nonmetallic inclusions was uncovered at the
top end of the bottom bar while trimming the end. This huge defect exceeded 20mm in length, even
after forging. It contained O, Na, Mg, Al, Si, K, Mn, S, and Ca, indicating it to originate from mold
flux. The fact that so few exogenous inclusions were found by Ultra Sonic Detection indicates that this
method can reveal only large inclusions, exceeding ~1mm in diameter. It is crucial to detect such large
and rare inclusions. However, determining the true cleanliness of the steel also requires microscope
observation and SEM detection.
2.2 Microscope Observation and SEM Detection
Typical inclusions detected by optical microscope observations and the corresponding SEM image
of the same inclusions/holes are compared in Table 3. The SEM reveals the true morphology of the
defects more clearly than the microscope observations. Defects S1 and S5 appear to look like
inclusions under microscope observation. However, the SEM images clearly reveal that S1 is an
inclusion cluster with a hole, and S5 is interdendritic porosity. The SEM images also show that S2 is
an inclusion cluster rather than a square-shaped inclusion as it appears under the microscope; S4 is a an
irregular-shaped hole remaining after the inclusions were polished away, rather than a simple inclusion;
and S6 is a bubble-shaped circle rather than an inclusion. These results indicate the short-comings of
inclusion detection by ultra-sonic detection or optical microscopy alone, and the power of the
combining these two methods with detailed SEM analysis of previously-detected inclusions.
2.3 Inclusion Amount and Size Distribution
The total of 78 non-sulfide inclusions larger than 20µm that were detected in the ingot are plotted
in Figures 5 & 6 according to their location along each bar-sample . In the 11613 mm2 total area
observed at each of three ingot heights, most (47) of these large inclusions were observed on the
section near the ingot bottom (sample 5), 29 on the half-height samples, and no inclusions were found
on the ingot upper section. Thus, the most important trend in entrapment location is a decrease in
inclusions with height up the ingot. At the ingot bottom, inclusions appear to concentrate in two
regions, peaking at 40mm from the center line and at 20mm from the surface. At the ingot half height,
inclusions are distributed more randomly, although there may be a slight concentration at the ingot
surface. At every height, inclusions are randomly distributed around the ingot perimeter, but there may
be a slight trend of more inclusions towards the trumpet side of the ingot near the ingot bottom.
The inclusion size distribution from the two-dimensional microscope observations is shown in figure 7,
and was converted into the three-dimensional size distribution in figure 8, using Eq.(1).
6
1223 10
p
DD
d
nn (1)
where n2D is the number of inclusions per mm2 of steel surface area, dp is inclusion diameter in µm
under 2-Dimensional (2D) microscope observation, n3D is the number of inclusions per m3 of steel
volume. Here it is assumed that the diameter of inclusions under 2D microscope observation is the
same as that of the real 3D inclusions. Actually, the observed 2D diameter of the spherical inclusion is
usually smaller than its 3D real diameter because the observed section surface is rarely just across the
sphere’s diameter, which means that the observed steel cleanliness underpredicts the inclusion fraction
in the steel. This equation assumes that each inclusion is roughly cylindrical in shape, with height (into
the plane) equal to its observed diameter. There are ~3.23107 total inclusions larger than 20μm per
m3 of steel, including 9.5710
5 inclusions larger than 200 μm per m
3 steel. The total mass of inclusions
larger than 20μm is 62.7 mg/10kg steel, assuming inclusion and steel densities of 3000kg/m3 and
7800kg/m3 respectively. If all of these inclusions were Al2O3, they would correspond to 6.27ppm mass
fraction and 3ppm total oxygen in the steel. The total number of inclusions in the ingot is much larger
than this, however, considering that most of the inclusions are smaller than 20μm. and sulfide
inclusions are not counted. Note in Figs 7 and 8 that the number of inclusions increases consistently
with decreasing size, except for the few largest inclusions, which have random sizes, likely due to the
small sample size. Assuming the same ~85% fraction of inclusions smaller than 20μm as was
measured in continuous cast steel (30ppm) 33), the ingot likely contains more than 40ppm total
inclusions, or 19ppm total oxygen.
2.4 Inclusion Types (Composition)
2.4.1 Pure alumina Clusters
Typical clusters of pure alumina inclusions are shown as S1 and S2 in Table 3 and in figure 9. Of
the 78 total non-sulfide inclusions observed in the ingot, the majority (46) were pure alumina, which
were almost all larger than 50m. Roughly half (25) of these were alumina clusters, while the others
were irregular-shaped lumps of alumina. The clusters range from being partially surrounded by steel,
as shown in S7 and S10, to being relatively exposed, as shown in S9. Some clusters even had steel
trapped inside them, such as S8. Some alumina clusters were caught together in the liquid steel, as
shown in S11. The center of S11 was dislodged during polishing and became dirty inside. The
individual particles in the alumina clusters range from 1-5µm in diameter.
Possible sources of alumina clusters include deoxidation products, reoxidation by air absorption,
Ostwald-Ripening of dendritic alumina, and sintering together (by collision) of many small alumina
inclusions. Their composition was measured to be almost pure alumina, so they could not arise from
refractory brick or slag. The clustering of deoxidation products is a possible source, but the strong
refining practice should have prevented such large quantities with such high purity. The most likely
source, at least of the large clusters, is air reoxidation. No perfect dendritic alumina inclusions were
observed, which suggests that significant time has passed since original formation of the dendritic
alumina in a high-oxygen environment. Air absorption likely took place between the ladle and the
trumpet during teeming, or at the top surface of the molten steel in the ingot during filling. During the
teeming process of this trial, there was no protection where the ladle drains into the trumpet, so air
absorption is likely very severe at that location.
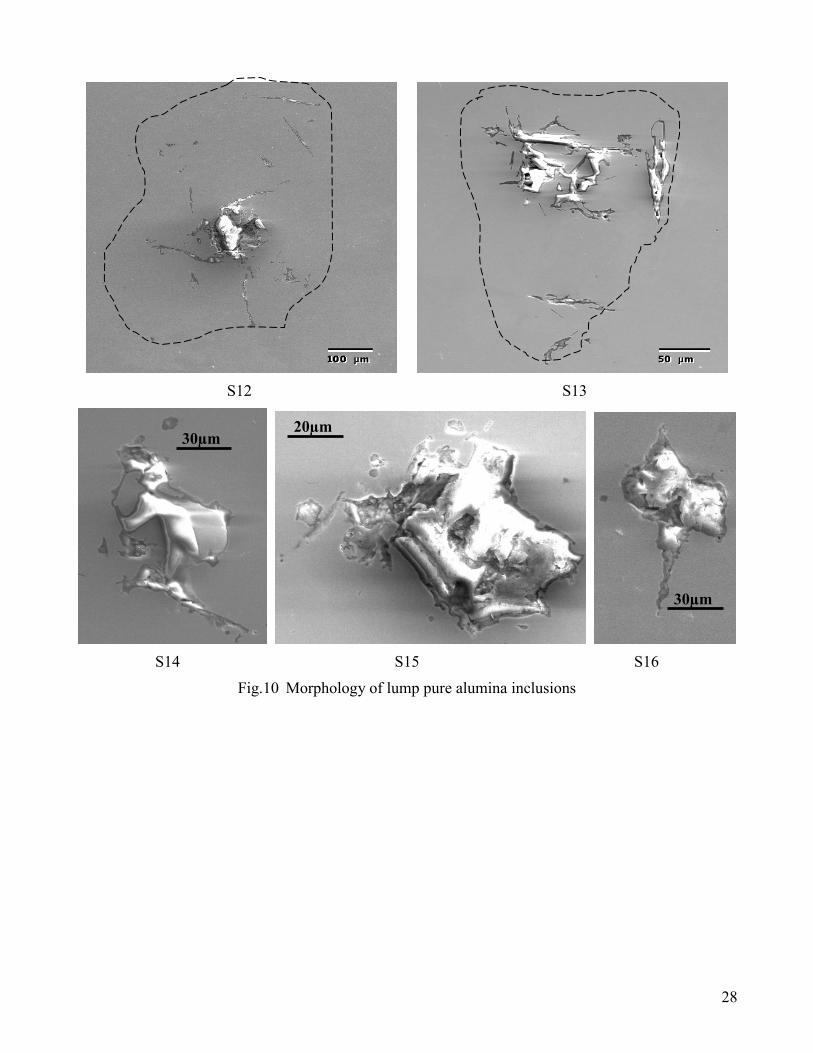
2.4.2 Pure alumina lump inclusions
21 Lump-shaped inclusions of pure alumina were observed on many samples, such as shown in
Table 3 (S3) and figure 10. Some inclusions were sliced near their center, while others were sliced
through an edge. Some inclusions lumps appear to be an aggregation of many thick needle-shaped
alumina inclusions that collided together, such as shown in S3, S12, and S13. Others are simply

7
alumina lumps, such as S14, S15 and S16. The formation mechanism of these lump inclusions needs
further investigation.
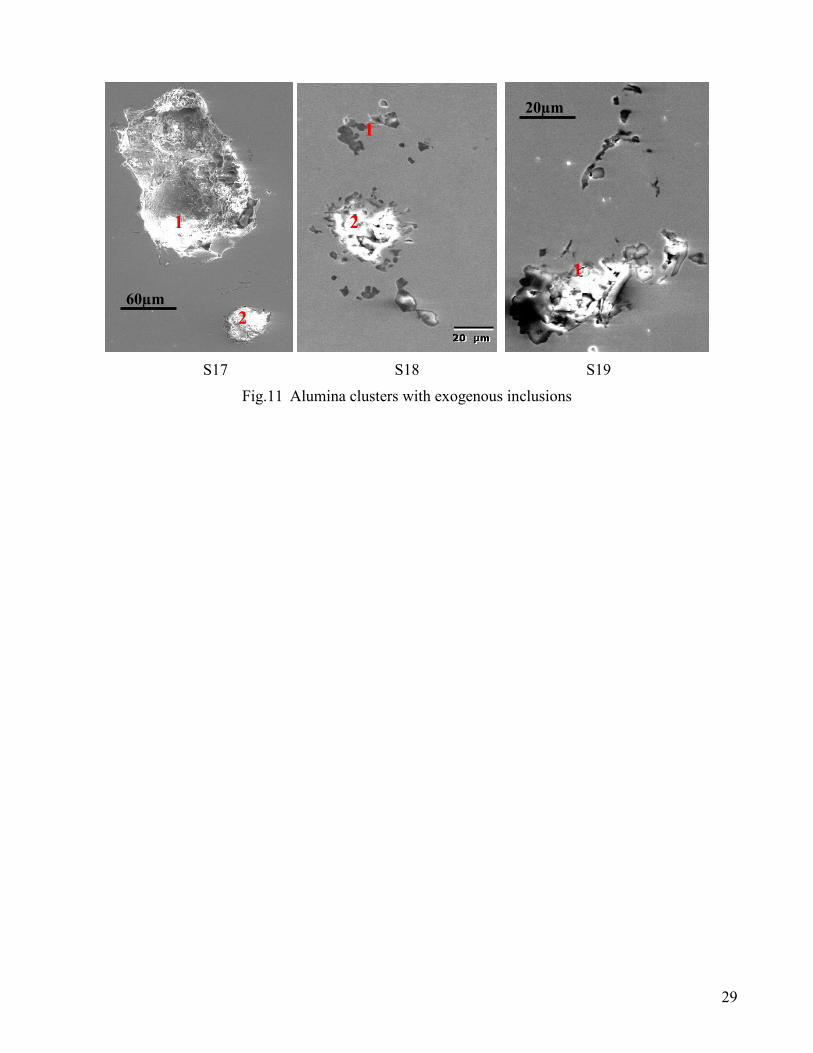
2.4.3. Alumina clusters with exogenous inclusions
Several multi-component clusters that contained alumina and other exogenous inclusions were
observed, as shown in Figure 11. These inclusions likely have a multi-stage formation mechanism.
Their complicated composition suggests that alumina particles combined with mold flux, broken lining
refractory, and / or ladle slag. Micrograph S17 shows a ~250µm irregular cavity with some inclusions
remaining inside, which means that most of the inclusion was polished away. The composition at
location 1 is Al2O3 69.94%, MgO 15.84%, FeO 4.79%, K2O 7.32%, Na2O 0.76%, ZrO2 1.37%, which
suggests that this inclusion was from mold flux. The inclusion at location 2 is a pure alumina cluster,
larger than 50µm. When large exogenous inclusions move through the liquid steel, they may grow by
nucleating other compounds from the supersaturated molten steel, or by simply colliding with other
inclusions. Inclusions S18 and S19 are examples of a large alumina cluster capturing exogenous
inclusions from the lining refractory (Al2O3 84.41%, MgO 5.77%, FeO 2.96%, CaO 2.57%). Inclusion
S19 is comprised of Al2O3 76.71%, MgO 23.29%, and is a compound inclusion cluster.
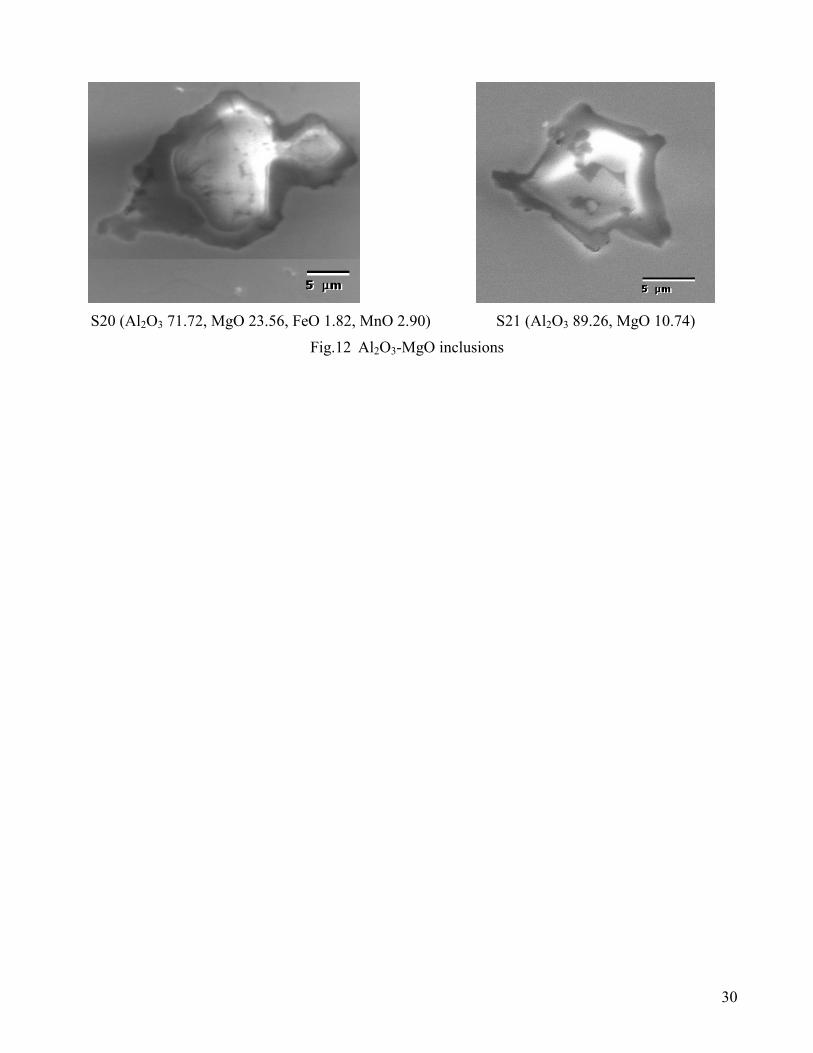
2.4.4. Al2O3-MgO inclusions
Many (17) large inclusions of Al2O3-MgO were found, such as shown in S18, S19 in Fig.11, and
S20, S21 in figure 12. Their compositions are similar to ladle well block, and their shape is irregular
with 20-30 µm size. These inclusions may have formed by erosion of the ladle well block, or by
alumina clusters firstly attaching to the surface of the well block as a clog, later becoming dislodged
into the liquid steel, perhaps reacting with well block material, and finally being captured by the
solidified shell. The detailed formation mechanism of Al2O3-MgO inclusions needs to be further
studied. The following mechanism was reported 34, 35):
(MgO)in lining+Cin steel or lining[Mg]+CO (2)
3[Mg]+(Al2O3)in lining or inclusion2[Al]+3(MgO)in inclusion (3)
4 (Al2O3)in inclusion or lining+ 3[Mg] = 3(MgO·Al2O3)in inclusion + 2[Al] (4)
(Al2O3)in inclusion or lining+ [Mg] + [O] = (MgO·Al2O3)in inclusion (5)
(MgO) in lining+(Al2O3)in inclusion (MgO Al2O3)in inclusion (6)
By these reactions, more MgO builds onto inclusions than Al2O3, thus MgO content of inclusions is
higher than that of original ladle well block.
2.4.5. Exogenous inclusions from ladle inner nozzle
Seven inclusions were found to contain Al2O3 94-98%, ZrO2 2-6%, which is very similar to the
composition of the ladle inner nozzle. The ladle inner nozzle (Al2O3 94.00%, ZrO2 2.50, SiO2 1.00%,
others 2.50%) is the only lining refractory that contains zirconium oxide. Thus, during the teeming
process, it appears that the ladle inner nozzle was eroded and dislodged inclusions into the liquid steel,
likely due to excessive fluid velocity, high temperature and / or long time. These inclusions are shown
in Figure 13. Inclusions S24 and S25 have been partially pulled out during polishing process.
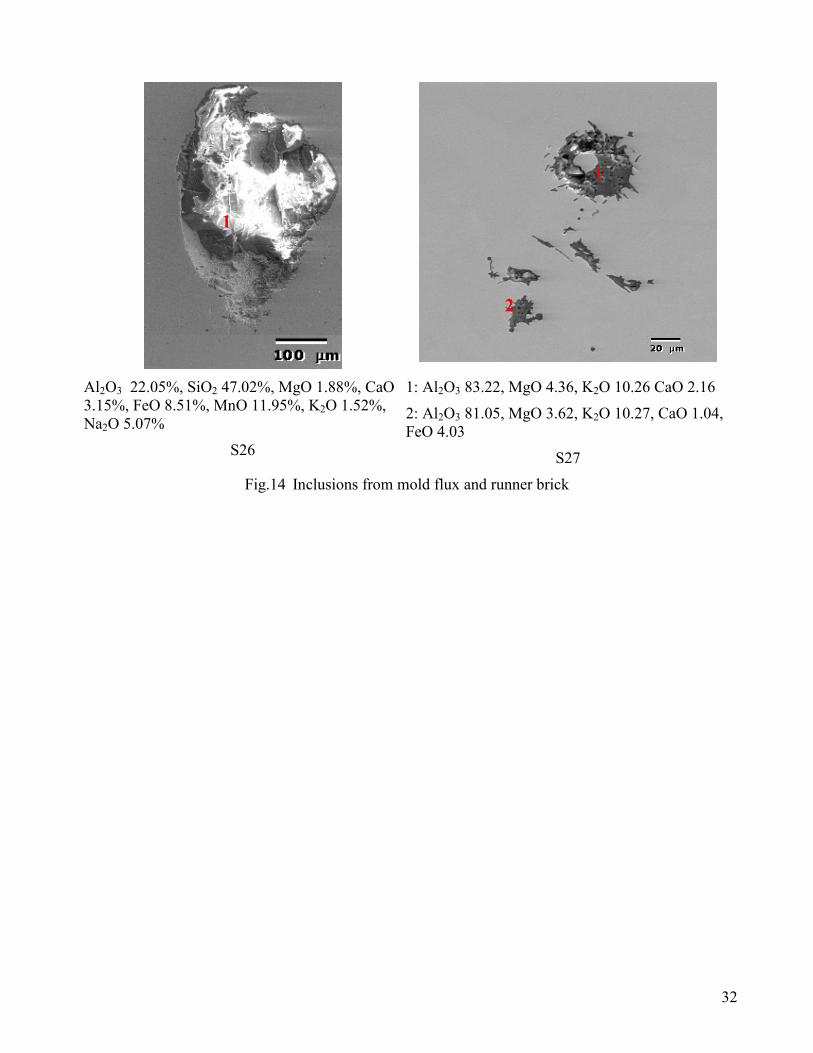
2.4.6. Inclusions from mold flux
Six inclusions were observed that contained high K2O or Na2O composition. These inclusions are
likely from entrapped mold flux, (S26), or perhaps from broken runner brick, (S27), as shown in figure
14. Some of these inclusions are very large, exceeding 150-600µm.
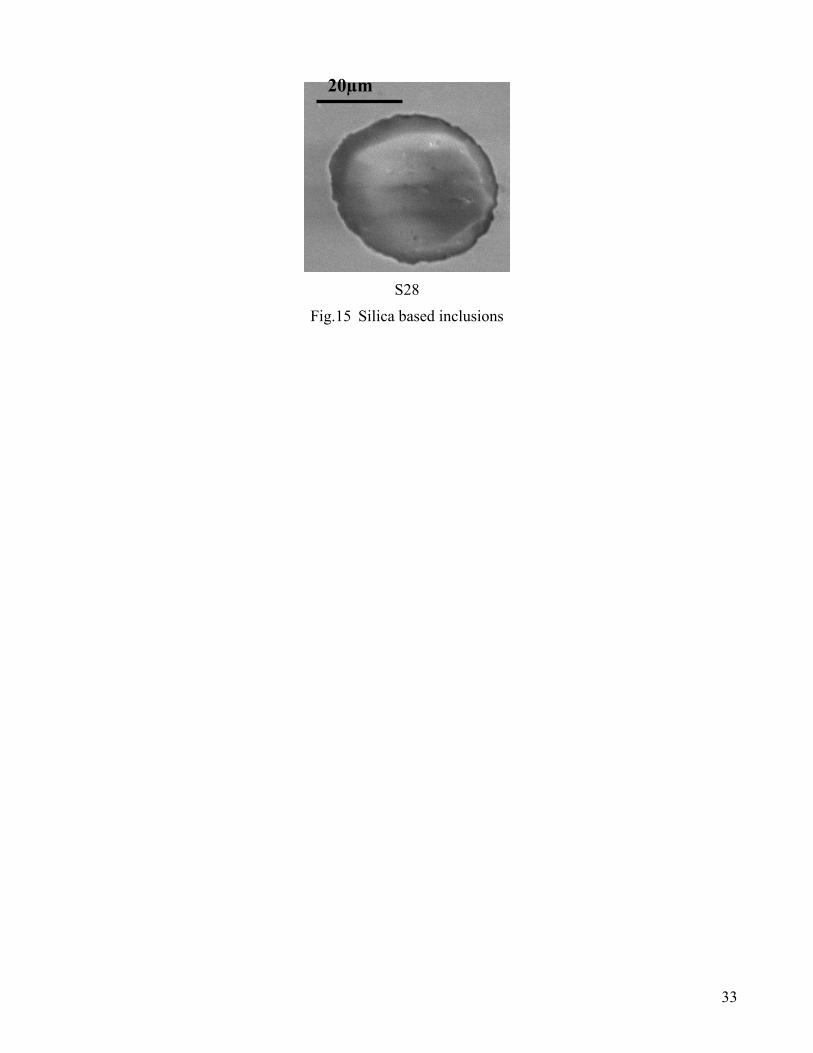
2.4.7. Silica based inclusions
8
Two spherical silica-based inclusions larger than 20µm were observed. An example is shown in
figure 15, with composition Al2O3 61.23%, SiO2 2.83%, CaO 35.94%. These inclusions may have
originated from ladle slag. They are not mold flux because there is no K2O and Na2O.
2.4.8. Bubble-shaped inclusions
Several different kinds of bubble-shaped defects were observed in the steel samples, such as shown
in Table 1 (S6) and in Table 4. These defects contain a ring of inclusions around the former boundary
of the bubble, or in its wake. Their composition varies widely, but always include inclusions of pure
sulfides (MnS) and usually also compound Al2O3-MgO inclusions. Although the individual inclusions
are small, the entire defect is dangerously large, with diameter of 50-300µm. These defects are
believed to arise through the following mechanism:
Step 1: A moving bubble collides with inclusions which attach to most of its surface;
Step 2: Inclusions form a shell around most of the bubble surface;
Step 3: The gas bubble escapes (argon or CO) or reacts / absorbs in the steel (air bubbles);
Step 4: The shell of inclusions is filled in with molten steel;
Step 5: Sulfides precipitate during solidification.
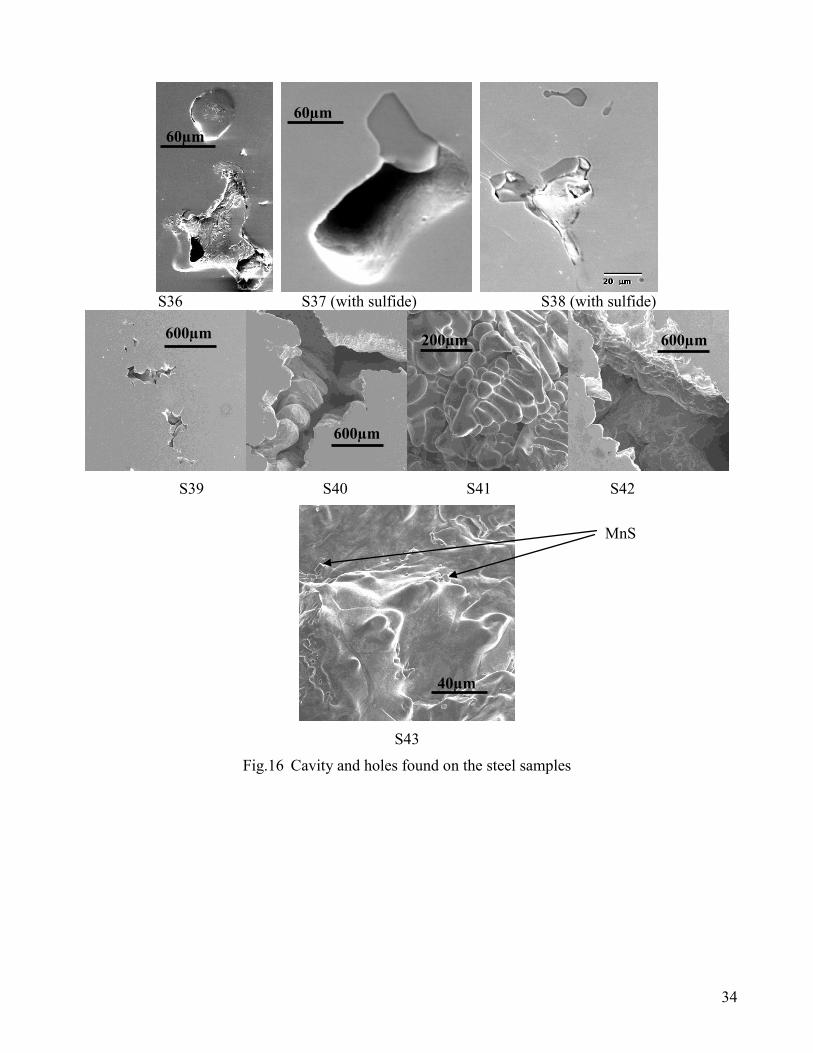
2.4.9. Cavity and Holes
Many different types of cavities and holes were found in the samples. Some of these simply arose
during polishing by dislodging inclusions, such as shown in Table 1 (S1, S4), Fig.9 (S11), Fig.11 (S17),
Fig.13 (S24 and S25). Spherical bubble-shaped holes were likely created during solidification by the
escape of gas bubbles (N2 bubble, CO bubble, and possible argon bubble), such as shown in S29 and
S30 in Table 4. Irregular-shaped holes were created during the final stages of solidification comprise
interdendritic cavities called “micro-porosity”. Examples are shown in S5 in Table 1, S36-42 in Table
5, and in Figure 16.
The cavities from micro-porosity form due to liquid feeding problems into the interdendritic spaces,
so were more often observed near the ingot center where the mushy zone is larger and liquid feeding is
more difficult. They are often associated with sulfides, which concentrate in the same region due to
microsegregation of S and Mn. Fig.16 shows several interesting examples. Sulfides are present along
the dendrite boundaries (holes) in S37 and S38. The void cluster in S39 illustrates mild microporosity.
Closeups of severe microporosity near the ingot centerline, shown in S40 and S42, show the jagged
nature of the interior of voids. The void edges are the surfaces of dendrites, as revealed in S41,
complete with classic secondary arms. A closeup of the dendrite surface in S43 shows MnS inclusions
on the dendrite edges, which are likely the precipitated remnants of an interdendritic liquid film.
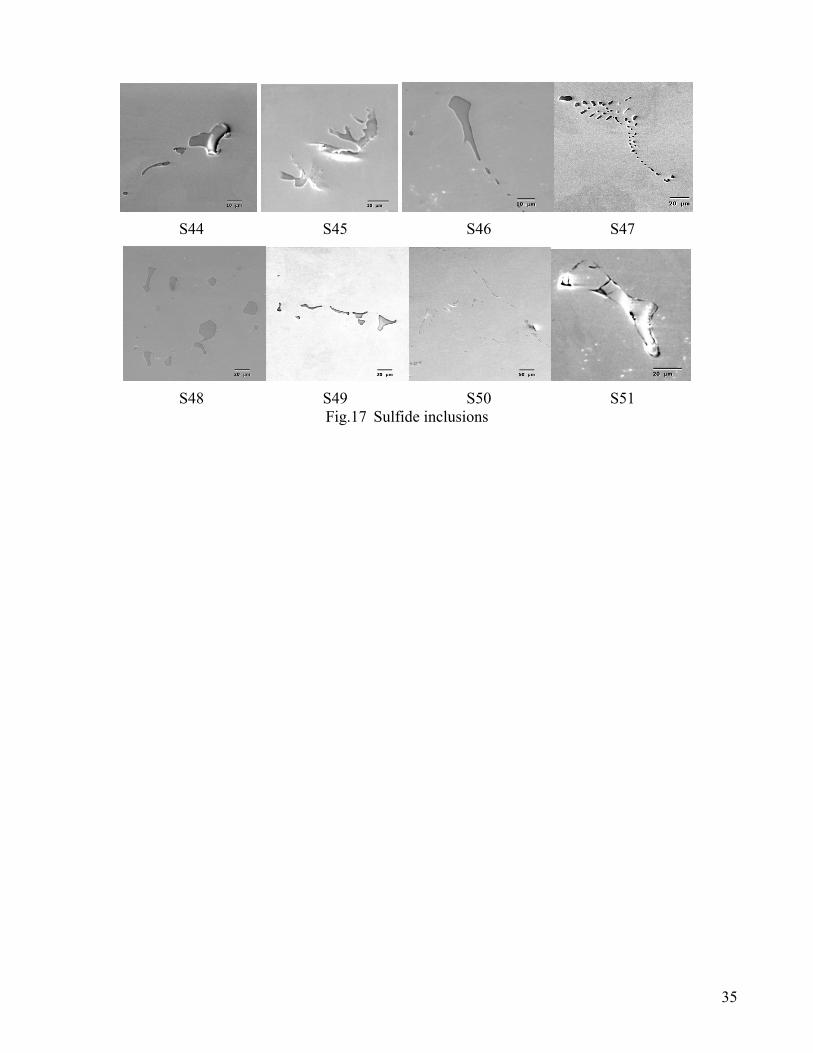
2.4.10. Sulfide inclusions
A great number of pure sulfide (MnS) inclusions were found in the steel samples. A few examples,
are shown in S6 in Table 1, S29,30,31,32,35 in Table 4, S37, 38 and 43 in Fig.16, and in figure 17.
These inclusions often appear in clusters with a large size (exceeding >100m) and are generally much
greater than the individual inclusions. Sulfides tend to concentrate around the boundaries of former
bubbles and near interdendritic cavities (S6 in Table 1, S29, 30, 31, 32, 35 in Table 4, S37, 38, 43 in
Table 5).
2.5. Summary of Ingot Inclusion Sources
The compositions of all 78 of the observed non-sulfide inclusions are plotted on the ternary phase
diagram in Figure 18. In total, 59% of the large inclusions (>20µm) were pure alumina or alumina/FeO
inclusions. These inclusions are believed to arise mainly from air reoxidation. The most likely places
for air absorption are the connection between ladle and trumpet during teeming, and the top surface of
the molten steel in the ingot during filling. Of the remaining inclusions having complex composition,

9
22% were from ladle well block refractory, 9% from the ladle inner nozzle, 8% from mold flux, and
2% from slag inclusions (not mold flux), as shown in Table 5. No inclusions from runner or trumpet
brick were found. Mold flux inclusions are more important than indicated here, because the two huge
inclusions detected by ultra-sonic detection are not included. In addition, a much larger number of
pure sulfide inclusions and smaller inclusions of all types were also observed.
3. Summary and Conclusions
- A comprehensive investigation of inclusions in industrial bottom-teemed ingots of plain carbon
steel was undertaken using ultrasonic detection, optical microscope observation, and SEM analysis.
The composition, size distribution, entrapment locations, and sources of ingot inclusions were
revealed from the inclusions larger than 20µm that were observed.
- The largest inclusions exceeded 20mm and originated from mold flux in the ingot.
- Extrapolation from the 35000mm2 of samples observed to the total volume suggests total 3.2310
7
inclusions larger than 20μm per m3 steel in the ingot, with a size distribution increasing in number
with decreasing size.
- At every height, inclusions are randomly distributed around the ingot perimeter, but there is slight
trend of more inclusions towards the trumpet side of the ingot near the ingot bottom.
- The largest inclusion source appears to be reoxidation, as evidenced by 59% of the ingot inclusions
composed of pure alumina clusters and lumps.
- Eroded refractories from the ladle well block and ladle inner nozzle bricks accounted for 31% of
the ingot inclusions.
- Evaluation of ingot macro-inclusions requires a combination of detection methods, including
ultrasonic detection to find the large rare inclusions, optical microscope observation to find the
inclusions > 20 microns, and SEM evaluation to confirm the composition and origin of previously-
detected inclusions.

10
Acknowledgements:
This work was supported by a grant from the Ingot Metallurgy Forum, which is gratefully
acknowledged. Thanks are also extended to Elwood Quality Castings for conducting the industrial
trials, and to Danielle Q. Baird at Timken, Inc. for help with planning. Microscopy was performed
using the facilities at the Center for Microanalysis of Materials at the University of Illinois, which is
partially supported by the U.S. Department of Energy under grant DEFG02-91-ER45439. Finally,
thanks are owed to Jim Mabon and to the Machine Shop at the Department of Mechanical & Industrial
Engineering for help with sample preparation.

11
References:
1) Steel Statistical Yearbook 2002, ed., eds., International Iron and Steel Institute, Brussels, (2002).
2) E. Fuchs and P. Jonsson: High Temperature Materials and Processes,19(2000), 333.
3) K. Sumitomo, M. Hashio, T. Kishida and A. Kawami: Iron and Steel Engineer,(1985), 54.
4) P. K. Trojan: ASM International, ASM Handbook,15 (Casting)(1988), 88.
5) G. Pomey and B. Trentini, in International Conference on Production and Application of Clean
Steels, The Iron and Steel Institute, London, Balatonfured, Hungary, (1970), 1-14.
6) A. G. Franklin, in International Conference on Production and Application of Clean Steels, The
Iron and Steel Institute, London, Balatonfured, Hungary, (1970), 241-247.
7) Y. Miki, H. Kitaoka, T. Sakuraya and T. Fujii: Tetsu-to-Hagane,78(1992), 431.
8) D. C. Hilty and D. A. R. Kay: Electric Furnace Steelmaking Conference Proceedings,43(1985),
237.
9) F. B. Pickering, in International Conference on Production and Application of Clean Steels,
The Iron and Steel Institute, London, Balatonfured, Hungary, (1970), 75.
10) S. E. Lunner, in International Conference on Production and Application of Clean Steels, The
Iron and Steel Institute, London, Balatonfured, Hungary, (1970), 124.
11) J. D. Thomas, R. O. Russell and T. R. Garcia, in 69th Steelmaking Conference Proceedings,
ISS, Warrendale, PA, (1986), 300.
12) J. C. C. Leach, in International Conference on Production and Application of Clean Steels, The
Iron and Steel Institute, London, Balatonfured, Hungary, (1970), 105.
13) M. M. McDonald and D. C. Ludwigson: the American Society for Tesing and Materials,
Journal of Tesing and Evaluation,11(1983), 165.
14) Special Report No.63: Ingot Surface Defects Sub-Committee (Steelmaking Division) of the
British Iron and Steel Research Association, Report No., (1958).
15) P. W. Wright: Metals Forum,2(1979), 82.
16) S. Riaz, K. C. Mills and K. Bain: Ironmaking and Steelmaking,29(2002), 107.
17) G. B. Hassall, KG; Jones, N; Warman, M: 29(2002), 383.
18) R. L. Shultz: Steelmaking Conference Proceedings,62(1979), 232.
19) R. Schlatter: Steel Times,(1986), 432.
20) A. Staronka and W. Golas: Arch. Eisenhuttenwes.,51(1980), 403.
21) P. Kazakevitch and M. Olette, in International Conference on Production and Application of
Clean Steels, The Iron and Steel Institute, London, Balatonfured, Hungary, (1970), 42.
22) A. W. Cramb and I. Jimbo: Iron & Steelmaker (ISS Trans.),11(1990), 67.
23) K. Suzuki, K. Taniguchi and T. Takenouchi: Tetsu-to-Hagane,61(1975), S96.
24) I. Manabu, S. Yutaka, O. Ryusuke and M. Zen-Ichiro: Tetsu-to-Hagane,79(1993), 33.
25) H. F. Marston, in 69th Steelmaking Conference Proceedings, ISS, Warrendale, PA, (1986), 107.
26) J. G. Bartholomew, R. L. Harvey and D. J. Hurtuk, in 69th Steelmaking Conference
Proceedings, ISS, Warrendale, PA, (1986), 121.
27) A. P. Ogurtsov: Steel in the USSR,18(1988), 225.
28) Z. Chen, J. Liu and J. Zeng: Iron & Steel (China),18(1983), 43.
29) M. D. Maheshwari and T. Mukherjee: Tisco,26(1979), 9.
30) K. P. Hughes, C. T. Schade and M. A. Shepherd: Iron & Steel Maker,22(1995), 35.
31) L. Zhang and B. G. Thomas: ISIJ Internationla,43(2003), 271.
32) J. Cheng, R. Eriksson and P. Jonsson: Ironmaking and Steelmaking,30(2003), 66.
33) L. Zhang, B. G. Thomas, K. Cai, L. Zhu and J. Cui, in ISSTech2003, ISS, Warrandale, PA,
(2003), 141.
34) V. Brabie: ISIJ Internationla,36(1996), S109.
35) K. Fujii, T. Nagasaka and M. Hino: ISIJ Int.,40(2000), 1059.
12
Captions:
Table 1 Steel composition in the trial
Table 2 Composition of flux and linings used at ladle, trumpet, runner and ingot mold
Table 3 Comparison of 2D microscope and 3D SEM images of typical inclusion-related defects
Table 4 Bubble-shaped inclusion defects
Table 5 Sources of >20μm inclusions in ingot
Fig.1. Schematic of ingot production process
Fig.2 Schematic of bottom teeming process
Fig.3 Schematic of sampling locations in 13inch round ingot (A is away from the trumpet)
Fig.4 Large nonmetallic inclusions found in the forged ingot
Fig.5 Inclusions (>20µm) observed at 280mm from bottom (left) and half height (2350mm from
the bottom) (right) of the ingot
Fig.6 Inclusions (>20µm) in ingot samples (A: direct away from trumpet, B & C: close to the
trumpet)
Fig.7 Two-dimensional size distribution of inclusions by microscope observation
Fig.8 Three-dimensional inclusion size distribution
Fig.9 Morphology of pure alumina clusters
Fig.10 Morphology of lump pure alumina inclusions
Fig.11 Alumina clusters with exogenous inclusions
Fig.12 Al2O3-MgO inclusions
Fig.13 Exogenous inclusions from ladle inner nozzle
Fig.14 Inclusions from mold flux and runner brick
Fig.15 Silica based inclusions
Fig.16 Cavity and holes found on the steel samples
Fig.17 Sulfide inclusions
Fig.18 Composition of non-sulfide inclusions observed in the samples

13
Table 1 Steel composition in the trial
Elements [C] [P] [S] [Al] [Si] [Mn] [Ni] [Cr] [Mo] [Cu]
% .22 .011 .014 .029 .26 1.01 .09 .11 .02 .17

14
Table 2 Composition of flux and linings used at ladle, trumpet, runner and ingot mold
Ladle Lining Nozzle
Sand
Trumpet & Runner Mold Flux
Wall Bottom Well
block
Inner
Nozzle
Slide
gates
Collector
Nozzle
Brick Filler
SiO2 0-5 0.8 0.10 1.00 0.5 10-13 27.6 50.8 0.9 29.0-36.0
Al2O3 0-5 0.5 91.22 94.00 83-87 11.8 44.5 0.8 15.0-21.0
MgO 80-100 40.1 6.01 Trace 97.0 7.1 0.1 37.7 <2.0
CaO 57.6 2.51 Trace 1.8 0 0.1 55.6 1.0-5.0
Fe2O3 0.5 0.9 0.03 0.2 1-2 18.6 1.0 4.2 5.0-11.0
Na2O <0.02 0.20
<1
0.47 4.0-6.0
K2O <2.0
TiO2 0.02 1-3 2.1 <1.5
ZrO2 2.50 0
Cr2O3 32.9
MnO <1.0
F <0.5
Ctotal 5-15 0.6 23.0-26.0

15
Table 3. Comparison of 2D microscope and 3D SEM images of typical inclusion-related defects
Two dimensional
microscope observation
Three-dimensional SEM
detection
S1
Partially-
dislodged
pure
alumina
cluster
S2
Pure
alumina
cluster
S3
Pure
alumina
lumps
S4
Irregular-
shaped hole
remaining
after
inclusion
was
polished
away
S5
Hole
between
dendrite
arms caused
by micro-
porosity
S6
Bubble-
shaped
cavity with
sulfide
inclusions in
its wake.
40µm
30µm
20µm
100µm
70µm

16
Table 4 Bubble-shaped inclusion defects
SEM detection Composition (%) Description / Source
S29
MnS Sulfide (likely
precipitated onto former
bubble surface during
solidification)
S30
MnS Sulfide (likely
precipitated onto former
bubble surface during
solidification)
S31
1
2
Al2O3 90.76
FeO 9.24
MnS 100
Alumina aluster (from
reoxidation) and sulfide
inclusions around the
surface of a bubble-like
cap (air)
S32
1
2
3
SiO2 21.84
MnO 1.00
FeO 77.16
MgO 15.52
SiO2 0.60
MnS 15.42
CaO 1.51
MnO 18.75
FeO 48.20
MnS 100
Mold flux, reoxidation
Inclusions around the
boundary of a bubble-cap
(Sulfide)
1
2
1
2
3
40µm
40µm

17
S33
1
2
Al2O3 78.17
MgO 11.61
FeO 10.22
Al2O3 76.23
MgO 15.61
FeO 8.16
Inclusion cluster
(alumina from
reoxidation plus ladle
lining) at the boundary of
a former air bubble
S34
1
2
Al2O3 83.32
MgO 16.68
Al2O3 83.88
MgO 5.97
CaO 7.29
FeO 2.85
Inclusion cluster
(alumina from
reoxidation plus runner,
trumpet or ladle bottom
lining ) attached to the
boundary of a former air
bubble
S35
1
2
Al2O3 84.05
MgO 15.95
MnS
Compound inclusion
(alumina from
reoxidation and ladle
lining) along boundary of
a former air bubble
Sulfide
1
2
1
2
1
2
50µm
30µm

18
Table 5 Sources of >20μm inclusions in ingot
Number Percentage (%)
Alumina (air reoxidation) 46 59%
ladle well block 17 22%
Ladle inner nozzle 7 9%
Mold flux 6 8%
slag inclusions (not mold flux) 2 2%
trumpet and runner bricks 0 0%
19
Fig.1. Schematic of ingot production process

20
(a) Ladle lining materials
(b) Trumpet, runner and ingot mold
Fig.2 Schematic of bottom teeming process
Ladle body lining
Ladle inner lining
Well block
Inner nozzle
Slide gate plate
Collector nozzle
trumpet body lining
Trumpet filer lining
Trumpet and runner brick
Stool lining
Lining attach to mold bottom
Upgate lining
Ingot mold materials
Trumpet
Runner
Ingot mold

21
Fig.3 Schematic of sampling locations in 13inch round ingot (A is away from the trumpet)

22
Fig.4 Large nonmetallic inclusions found in the forged ingot

23
0 20 40 60 80 100 120 140 160
0
1
2
3
4
5
6
7
8
Inclu
sio
n n
um
ber
pe
r 6
45
mm
2
Distance Away from the center (mm)
A
B
C
(a)
0 20 40 60 80 100 120 140 160
0
1
2
3
4
5
6
7
8
Inclu
sio
n n
um
ber
pe
r 6
45
mm
2
Distance Away from the center (mm)
A
B
C
(b)
Fig.5 Inclusions (>20µm) observed at 280mm from bottom (a) and half height (2350mm from the
bottom) (b) of the ingot

24
A B C
0
5
10
15
20
25
Inclu
sio
n n
um
ber
per
3871 m
m2
280mm from the bottom
half height of the ingot
280mm from the top
Fig.6 Inclusions (>20µm) in ingot samples (A: direct away from trumpet, B & C: close to the trumpet)

25
<50 50-75 75-100 100-125 125-150 150-175 175-200 200-225 225-250 260 263 325 358 667
0
5
10
15
20
Inclu
sio
n n
um
be
r p
er
34
83
9 m
m2 s
tee
l su
rfa
ce
Inclusion diameter (m)
Fig.7 Two-dimensional size distribution of inclusions by microscope observation

26
25 50 75 100 125 150 175 200
105
106
107
108
Inclu
sio
m n
um
be
r d
en
sity (
nu
mb
er
pe
r m
3)
Inclusion diameter (m)
>200
Fig.8 Three-dimensional inclusion size distribution

27
S7 S8 S9 S10
S11
Fig.9 Morphology of pure alumina clusters
15µm 40µm
60µm
28
S12 S13
S14 S15 S16
Fig.10 Morphology of lump pure alumina inclusions
20µm 30µm
30µm
29
S17 S18 S19
Fig.11 Alumina clusters with exogenous inclusions
1
1
2
1
2 60µm
20µm
30
S20 (Al2O3 71.72, MgO 23.56, FeO 1.82, MnO 2.90) S21 (Al2O3 89.26, MgO 10.74)
Fig.12 Al2O3-MgO inclusions

31
S22 S23 S24 S25
Fig.13 Exogenous inclusions from ladle inner nozzle
60µm
32
Al2O3 22.05%, SiO2 47.02%, MgO 1.88%, CaO
3.15%, FeO 8.51%, MnO 11.95%, K2O 1.52%,
Na2O 5.07%
S26
1: Al2O3 83.22, MgO 4.36, K2O 10.26 CaO 2.16
2: Al2O3 81.05, MgO 3.62, K2O 10.27, CaO 1.04,
FeO 4.03
S27
Fig.14 Inclusions from mold flux and runner brick
1
2
1
33
S28
Fig.15 Silica based inclusions
20µm
34
S36 S37 (with sulfide) S38 (with sulfide)
S39 S40 S41 S42
S43
Fig.16 Cavity and holes found on the steel samples
MnS
60µm
60µm
40µm
200µm 600µm
600µm
600µm
35
S44 S45 S46 S47
S48 S49 S50 S51
Fig.17 Sulfide inclusions

36
0.00 0.25 0.50 0.75 1.00
0.00
0.25
0.50
0.75
1.000.0
0.2
0.4
0.6
0.8
1.0
FeO
+M
nO
Oth
ers
Others
(Others:MgO+CaO+K2O+Na
2O+ZrO
2+TiO
2+SiO
2)
FeO+MnO
Al2O
3Al
2O
3
Fig.18 Composition of non-sulfide inclusions observed in the samples