07 sept2012 alembic
DESCRIPTION
07 Sept2012 AlembicTRANSCRIPT

Alembic Pharmaceuticals Limited
Investor Presentation September 2012
www.alembic-india.com
BSE:
NSE:
Symbol: ALEMPHARM
Code: 533573
Symbol: APLLTD
ISIN: INE901L01018

Safe Harbour Statement
Materials and information provided during this presentation may contain ‘forward-looking statements’. These statements
are based on current expectations, forecasts and assumptions that are subject to risks and uncertainties which could cause
actual outcomes and results to differ materially from these statements.
Risks and uncertainties include general industry and market conditions and general domestic and international economic
conditions such as interest rate and currency exchange fluctuations. Risks and uncertainties particularly apply with respect
to product-related forward-looking statements. Product risks and uncertainties include, but are not limited, to technological
advances and patents attained by competitors, challenges inherent in new product development including completion of
clinical trials; claims and concerns about product safety and efficacy; obtaining regulatory approvals; domestic and foreign
healthcare reforms; trend towards managed care and healthcare cost containment and governmental laws and regulations
affecting domestic and foreign operations.
Also, for products that are approved, there are manufacturing and marketing risks and uncertainties, which include, but are
not limited, to inability to build production capacity to meet demand, unavailability of raw materials and failure to gain
market acceptance.

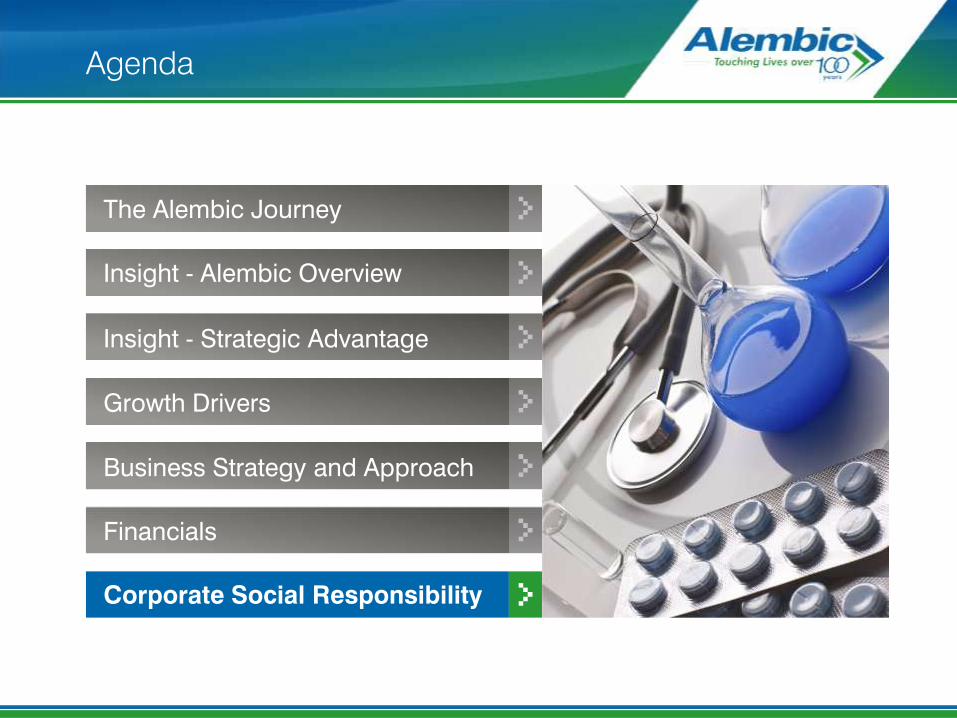
Agenda
The Alembic Journey
Insight - Alembic Overview
Insight - Strategic Advantage
Growth Drivers
Business Strategy and Approach
Financials
Corporate Social Responsibility

The Alembic Journey
Insight - Alembic Overview
Insight - Strategic Advantage
Growth Drivers
Business Strategy and Approach
Financials
Corporate Social Responsibility
Agenda

Started
manufacturing
tinctures and
alcohol at
Vadodara
Started
manufacturing
cough syrup,
vitamins, tonics
and sculpture
drugs
Lal Bahadur
Shastri,
the then
Prime minister
inaugurates the
Penicillin plant
Erythromycin
manufactured
for the first
time in India
"Althrocin"- a
brand of
Erythromycin
launched
Starts
manufacturing
of
Cephalosporin C
State-of-the-art
Formulations
facility for
Regulatory
Markets
1907
1940
1961
1971
1972
2001
2003
The Alembic Journey

The Alembic Journey
State-of-the-art
Research
Centre
established
in Vadodara
US FDA
approvals for
API and
Formulation
Plants
Acquisition of
Non-Oncology
Business of
M/s Dabur
Pharma Ltd.
Addressed
chronic therapies
through
multiple
marketing
divisions
- Azithral sales
Reach INR
1000 million
mark
- Cumulatively
50 ANDAs filed,
(21 approved)
and 66 DMFs filed
- ANVISA
- Para IV filed
2004
2006
2007
2009
2010
2011
2012
- Aggressive
ANDAs and
DMFs filing
approvals
- Demerger AL-APL

The Alembic Journey
Insight - Alembic Overview
Agenda
Insight - Strategic Advantage
Growth Drivers
Business Strategy and Approach
Financials
Corporate Social Responsibility

Insight - Alembic Overview
Revenue of INR 7830 million
in the domestic market for
the financial year 2011-12
Ranked 22nd in the
Indian Formulations
market with a market
share of 1.74%*
Ranked 15th in
Doctors Prescription
Universe**
Well equipped
Formulations Plant
located at Baddi,
Himachal Pradesh
Robust product basket
with export sales of
INR 570 million in the financial
year 2011-12 in International
Strong presence in
anti-infective,
pain management,
cough & cold
Branded Formulations
Thrust on Cardiology,
Gynecology, GI,
Diabetes, Orthopedics,
Rheumatology and
Ophthalmology segments
*Source: ORG August, 2012 **Source: ORG Prescription Audit
Dermatology division
launched
Branded Formulations
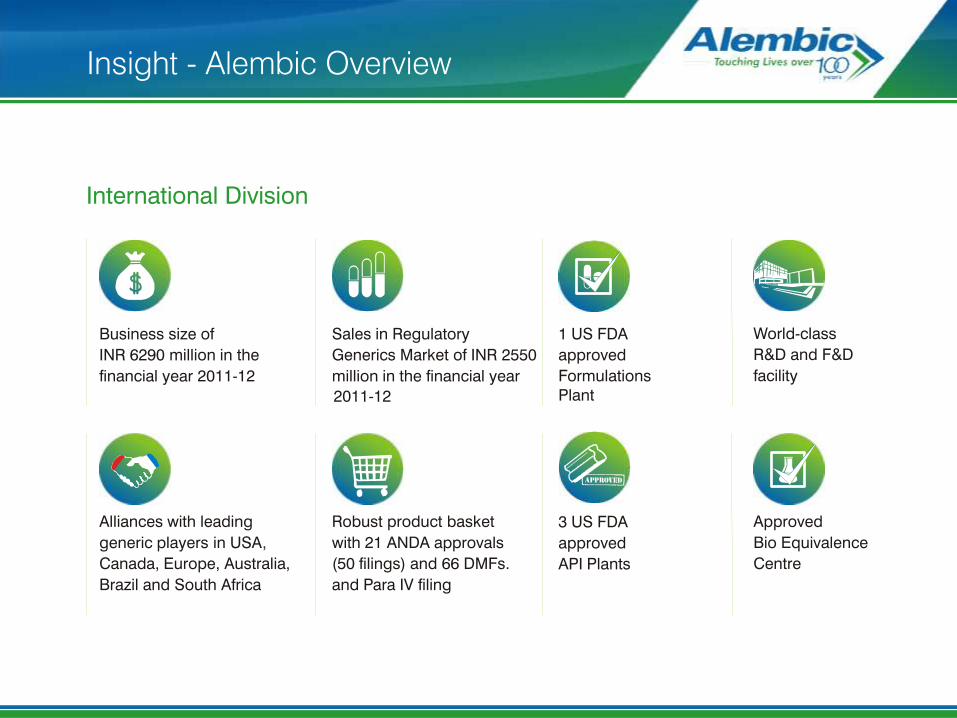
Insight - Alembic Overview
Business size of
INR 6290 million in the
financial year 2011-12
Sales in Regulatory
Generics Market of INR 2550
million in the financial year
1 US FDA
approved
Formulations
Plant
3 US FDA
approved
API Plants
International Division
Approved
Bio Equivalence
Centre
Alliances with leading
generic players in USA,
Canada, Europe, Australia,
Brazil and South Africa
Robust product basket
with 21 ANDA approvals
(50 filings) and 66 DMFs.
and Para IV filing
World-class
R&D and F&D
facility
2011-12

Business Portfolio
API BRANDED
FORMULATIONS
INTERNATIONAL
GENERICS
Manufacturing
Efficiency
Alliances
R&D
Quality
Business
Synergies

Agenda
Insight - Strategic Advantage
The Alembic Journey
Insight - Alembic Overview
Growth Drivers
Business Strategy and Approach
Financials
Corporate Social Responsibility
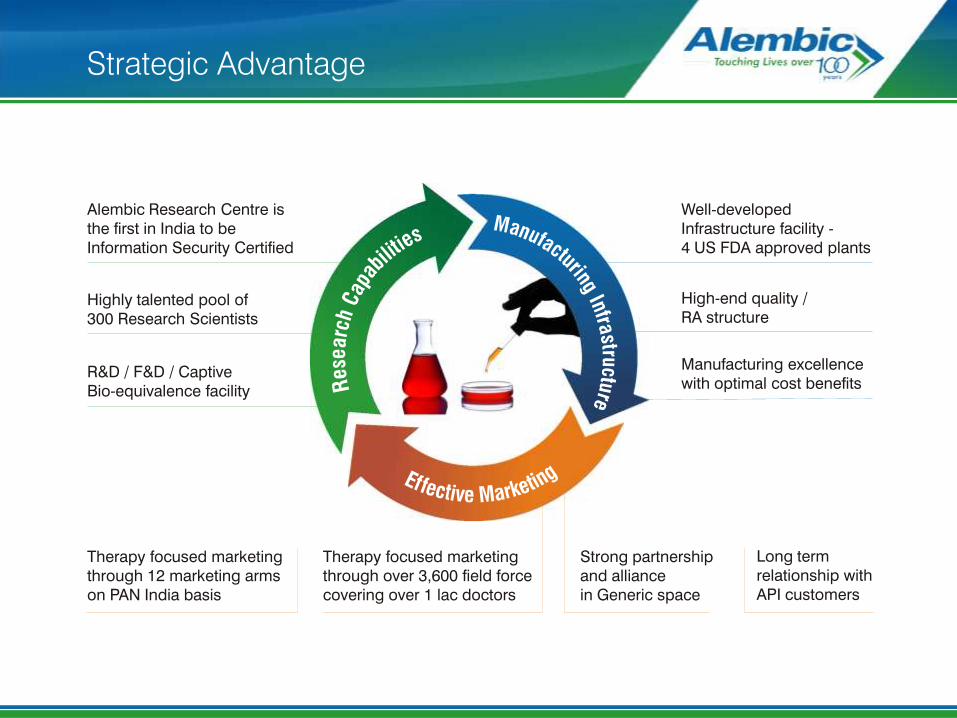
Strategic Advantage
Alembic Research Centre is
the first in India to be
Information Security Certified
Highly talented pool of
300 Research Scientists
R&D / F&D / Captive
Bio-equivalence facility
Well-developed
Infrastructure facility -
4 US FDA approved plants
High-end quality /
RA structure
Manufacturing excellence
with optimal cost benefits
Therapy focused marketing
through 12 marketing arms
on PAN India basis
Therapy focused marketing
through over 3,600 field force
covering over 1 lac doctors
Strong partnership
and alliance
in Generic space
Long term
relationship with
API customers

USFDA, MCC, MHRA,
ANVISA, TPD approved
formulations facility at Panelav
Current annual production
capacity of 2.6 billion
tablets/capsules
Expansion to 4 billion in
financial year 2012-13
Manufacturing Infrastructure
Formulations plant at
Baddi, Himachal Pradesh
USFDA, EDQM, TGA, WHO
approved API facility at
Panelav (2 units) and at
Karkhadi (1 unit)
Formulations - Generics (Regulatory Markets)
Branded Formulations API

Manufacturing Infrastructure
Certifications

R&D Centre has been
recognized by DSIR,
Govt. of India
High-end R&D Equipment -
NMR XRD, TGA, DSC, LCMS
World-class Infrastructure
R&D FACILITY
Expertise in Drug Deliveries
and Niche Formulations
Well-defined Processes
and Quality Systems
Capabilities in Solid Oral,
Liquid Oral Products
F&D CAPABILITIES
State-of-the-art 90-bedded new
Bio Centre
100 Bio Pilot Studies
25 Pivotal Studies (Capabilities)
BIO EQUIVALENCE CENTRE
Alembic Research Centre
State-of-the-art Analytical & IPR infrastructure
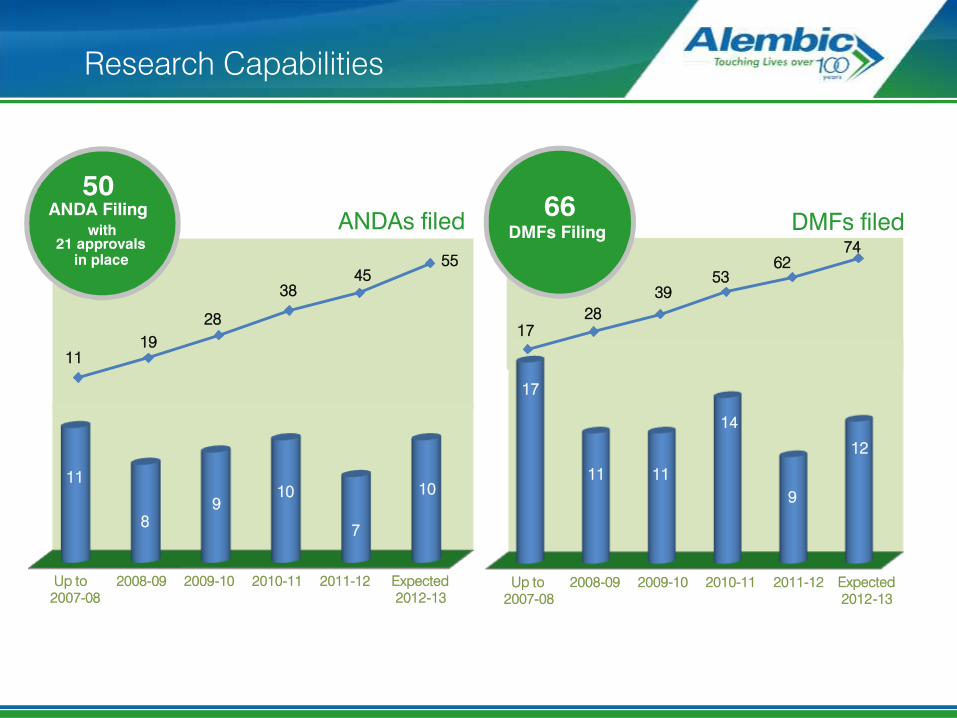
74
50 ANDA Filing
with 21 approvals
in place
66
DMFs Filing DMFs filed ANDAs filed
Research Capabilities
11
8
9
10
7
10
38
45
55
Up to 2008-09 2009-10 2010-11 2011-12 Expected
2007-08 2012-13
Up to 2008-09 2009-10 2010-11 2011-12 Expected
2007-08 2012-13
11
19
28
17
28
39
53
62
17
11 11
14
9
12

Global Presence
Pramipexole Dihydrochloride Tablets
Famotidine Tablets USP
Venlafaxine Hydrochloride Tablets
Lithium Carbonate Capsules USP
Metronidazole Tablets USP
Metronidazole Capsules
Meprobamate Tablets USP
Working on complex
generics products
Filings from Indian site
Metronidazole ER Tablets
Fluoxetine Capsules USP
Irbesartan and Hydrochlorothiazide Tablets USP
Theophylline Extended - Release Tablets
Lamotrigine Tablets
Losartan Potassium Tablets (Para IV)
Irbesartan Tablets USP (Para IV)
Hydrochlorothiazide Capsules USA /
CANADA Generics
EUROPE
Generics
Map not to scale
21 ANDA Approvals:
Clonidine Hydrochloride Tablets USP
Leflunomide Tablets USP
Ropinirole Hydrochloride Tablets
Losartan Potassium-Hydrochlorothiazide Tablets
Rivastigmine Tartrate Capsules
Modafinil Tablets USP
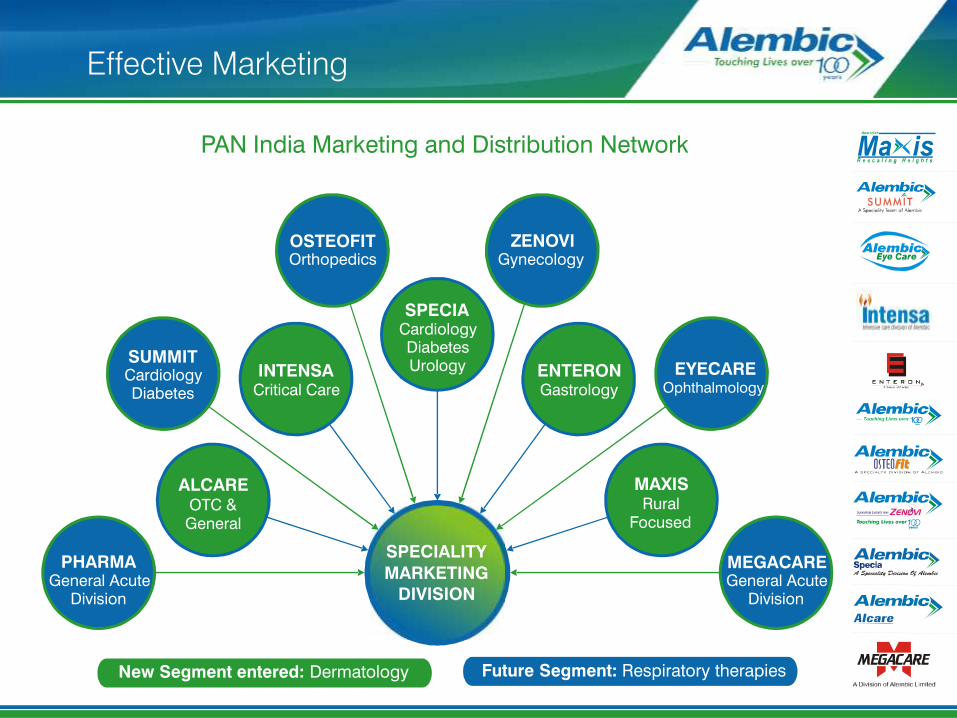
SPECIALITY
MARKETING
DIVISION
Effective Marketing
PAN India Marketing and Distribution Network
SPECIA Cardiology Diabetes Urology
ENTERON Gastrology
SUMMIT Cardiology Diabetes
EYECARE Ophthalmology
OSTEOFIT Orthopedics
ZENOVI Gynecology
INTENSA Critical Care
ALCARE OTC & General
MEGACARE General Acute
Division
PHARMA General Acute
Division
MAXIS Rural
Focused
New Segment entered: Dermatology Future Segment: Respiratory therapies

Effective Marketing
OTHER
PRODUCT
PORTFOLIO
VETERINARY GENERICS & NSA
PAN India Marketing and Distribution Network

Major Product Portfolio
Top Products
Azithral
Althrocin
Roxid
Wikoryl
Therapatic Area
Ranking *
Anti Infective
Anti Infective
Anti Infective
Cough & Cold
26
44
126
144
Other Products
Therapatic Area
Ulgel
Zeet/Bro-Zeet
Tellzy
Gestofit
Sharkoferrol
Tetan
Livfit
Glisen
Glycodin
Zofix
Revas
Antacid and Anti Flatulant
Cough & Cold
Cardiology
Gynecology
Tonic
Cardiology
Hepaprotectives
Anti Diabetic
Cough & Cold
Anti Infective
Cardiology
* Source: ORG August, 2012

Agenda
Growth Drivers
The Alembic Journey
Insight - Alembic Overview
Insight - Strategic Advantage
Business Strategy and Approach
Financials
Corporate Social Responsibility
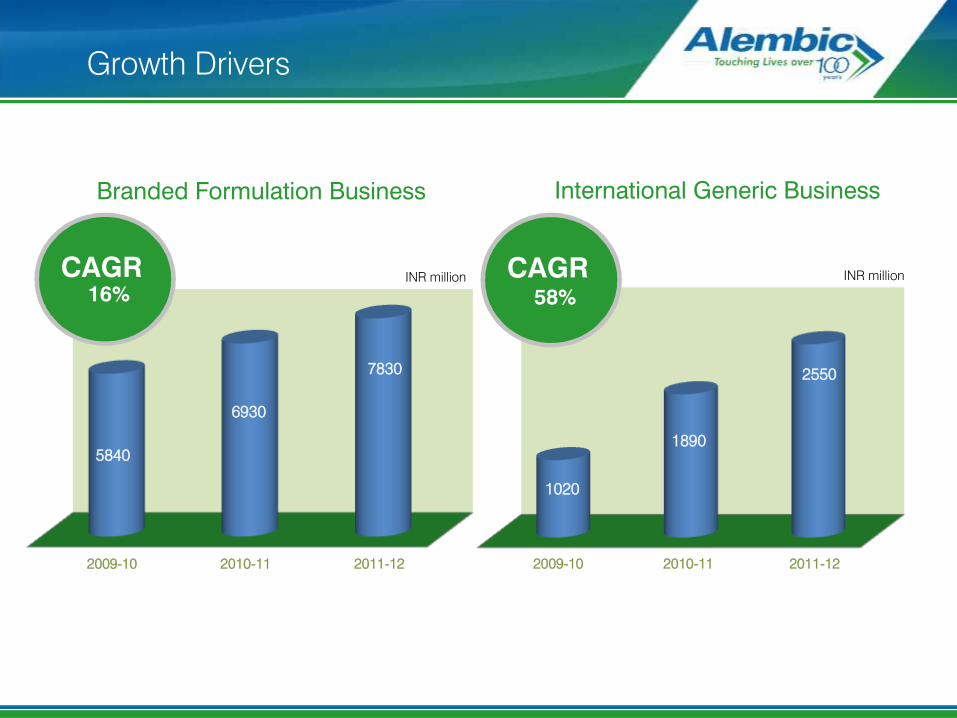
Growth Drivers
2009-10 2010-11 2011-12
2009-10 2010-11 2011-12
INR million INR million
International Generic Business Branded Formulation Business
9 % 37 %
5840
6930
7830
CAGR 16%
1020
1890
2550
CAGR 58%

Launch 20-25 new products
Growth Drivers
Expected
annual growth
15%
Enhanced focus on
existing branded business
Through effective pan-India distribution
network and therapy based marketing
and by pushing ahead acute and chronic
segments like anti-infectives and cough
& cold medications
Branded Formulations
Launch of new products to boost sales
momentum and brand build up

Enter into new therapeutic
segment
Future indentified therapy – Respiratory will
further expand the company’s spread
.
Growth Drivers
Continued capitalization
of Dabur Pharma’s assets
The non-oncology business of Dabur
Pharma was acquired in 2007. Further
capitalization of its assets will yield a
stronger product line.
Domestic Market
Expected
annual growth
15%

Expanded annual
production capacity
Annual production to increase from 2.6 billion
tablets/capsules to 5 billion tablets/capsules
Growth Drivers
Expected
CAGR of 25%
Position Alembic as a cost efficient
dependable quality manufacturer
Superior cost efficiency
International Generics

Growth Drivers
Expected
CAGR of 25%
Global alliances with leading
Generic Businesses
Leverage on the core competencies of
leading generic manufacturers in
different markets
Over the next five years, products that
currently generate more than USD 142 billion
In sales are expected to go off-patent. Alembic
can tap these opportunities by launching
new generic products at appropriate times.
ANDA filings and approvals
for off-patent drugs
International Generic Formulation

Agenda
The Alembic Journey
Business Strategy and Approach
Insight - Alembic Overview
Insight - Strategic Advantage
Growth Drivers
Financials
Corporate Social Responsibility

Sustainable
Business Streams
Business Strategy & Approach
Retaining and consolidating
strong presence in acute
therapies in the domestic
market
Growing chronic therapies
through multiple marketing
divisions
Vertical integration in R&D
and manufacturing of
intermediates, APIs and
dosage forms.
Cost efficient processes
Partner in international
market through alliances
with big pharma,
leading generic players
and MNC distributors
Para IV and NDA Filings
Vertical
Integration
High Growth in
Advanced Markets

Agenda
Financials
The Alembic Journey
Insight - Alembic Overview
Insight - Strategic Advantage
Growth Drivers
Business Strategy and Approach
Corporate Social Responsibility

Financial Highlights – Quarterly
Consolidated Q II - FY 12-13 INR million
Formulation
Branded Domestic
Generic & NSA
Branded International
International Generics
Total
International Division
API Domestic
API Export
Total
Export Incentive
Grand Total
Total Domestic
Total Export
Sales Q II / 12-13 Q II / 11-12 Business Share '12 Growth %
2,198
340
87
510
1,954
315
120
714
2,389
54%
8%
2%
13%
64%
13%
8%
( 28)%
(29)%
10%
334
576
1,420
220
604
1,538
8%
14%
35%
52%
(5)%
(8)%
30 53 1% (43)%
4,075 3,980 100% 2%
2,891 2,490 71% 16%
1,184 1,490 29% (20)%
2,625

Financial Highlights – Quarterly
Result Highlight (Consolidated) Q II - FY 12-13 INR million
EBDITA
(Before R&D)
R&D Expenses
EBDITA
(Post R&D)
PBT
Particulars Q II / 12-13 Q II / 11-12 Year 2011-12
807
160
647
530
751
146
605
7%
7%
2,790
586
2,204
1,610
Growth %
450 18%
PAT 425 380 12% 1,301
-

Financial Highlights – Half Yearly
Consolidated H I - FY 12-13 INR million
Formulation
Branded Domestic
Generic & NSA
Branded International
International Generics
Total
International Division
API Domestic
API Export
Total
Export Incentive
Grand Total
Total Domestic
Total Export
Sales H I / 12-13 H I / 11-12 Business Share '12 Growth %
3.901
610
162
971
3,458
535
234
1,325
4,227
50%
8%
2%
13%
60%
13%
14%
(31)%
(27)%
11%
638
1,411
3,020
568
1212
3,105
8%
18%
39%
12%
16%
(3)%
63 96 1% (34)%
7,756 7,428 100% 4%
5,178 4,563 67% 13%
2,578 2,865 33% (9)%
4,673
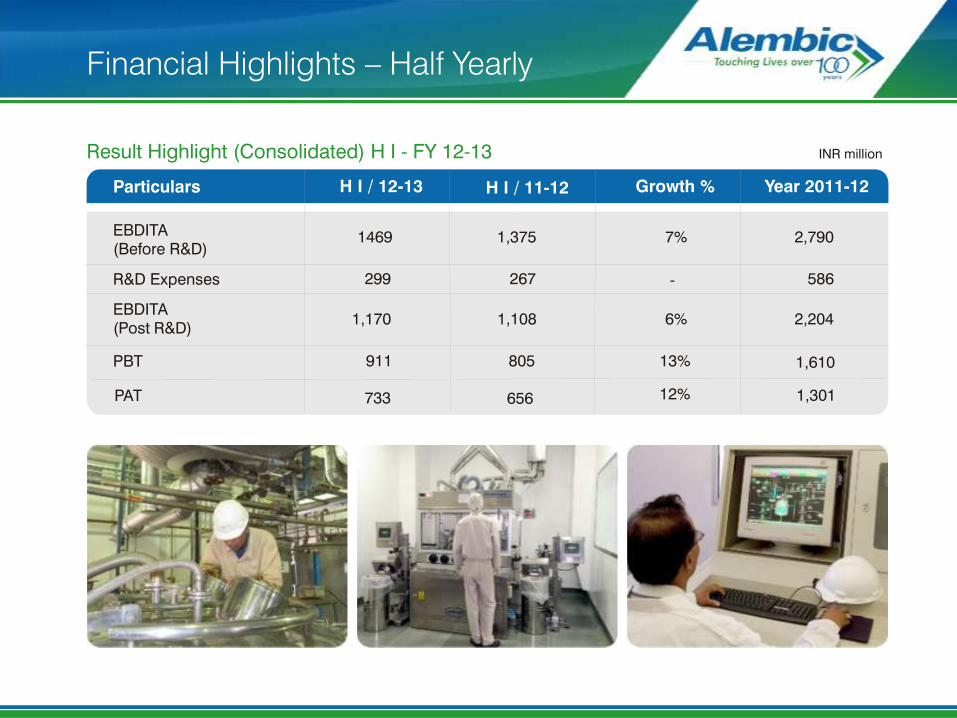
Financial Highlights – Half Yearly
Result Highlight (Consolidated) H I - FY 12-13 INR million
EBDITA
(Before R&D)
R&D Expenses
EBDITA
(Post R&D)
PBT
Particulars H I / 12-13 H I / 11-12 Year 2011-12
1469
299
1,170
911
1,375
267
1,108
7%
6%
2,790
586
2,204
1,610
Growth %
805 13%
PAT 733 656 12% 1,301
-
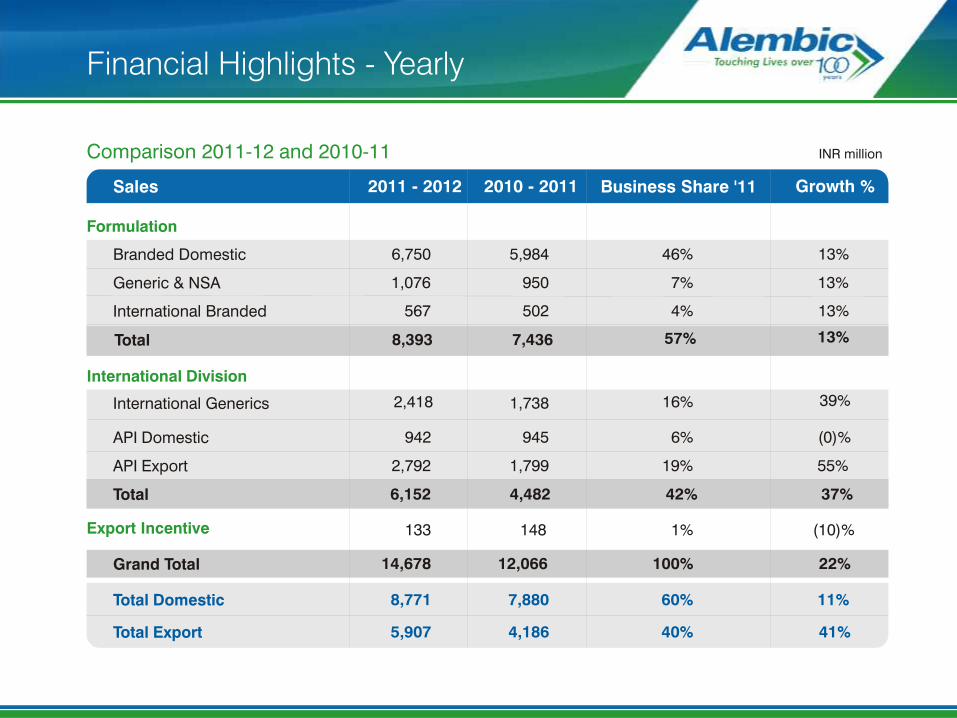
Financial Highlights - Yearly
Comparison 2011-12 and 2010-11 INR million
Formulation
Branded Domestic
Generic & NSA
International Branded
International Generics
Total
International Division
API Domestic
API Export
Total
Export Incentive
Grand Total
Total Domestic
Total Export
Sales 2011 - 2012 2010 - 2011 Business Share '11
6,750
1,076
567
2,418
8,393
5,984
950
502
1,738
7,436
46%
7%
4%
16%
57%
13%
13%
13%
39%
13%
942
2,792
6,152
945
1,799
4,482
6%
19%
42%
(0)%
55%
37%
133 148 1% (10)%
14,678 12,066 100% 22%
8,771 7,880 60% 11%
5,907 4,186 40% 41%
Growth %

Financial Highlights - Yearly
Result Highlight (Comparison 2011-12 and 2010-11) INR million
EBDITA
(Before R&D)
R&D Expenses (incl. CAPEX)
EBDITA
(Post R&D)
PBT
Particulars 2011-2012 2010-2011 Growth %
2,900
696
2,204
1,069
2,087
484
1,603
39%
38%
51%
52% 854 1,301 PAT
1,610
-
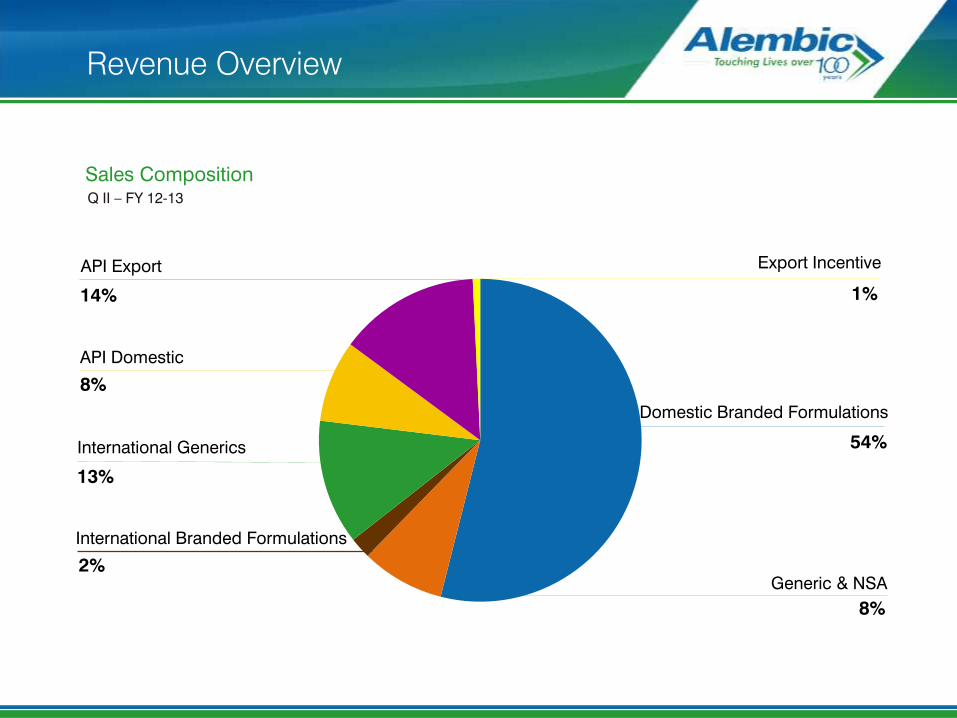
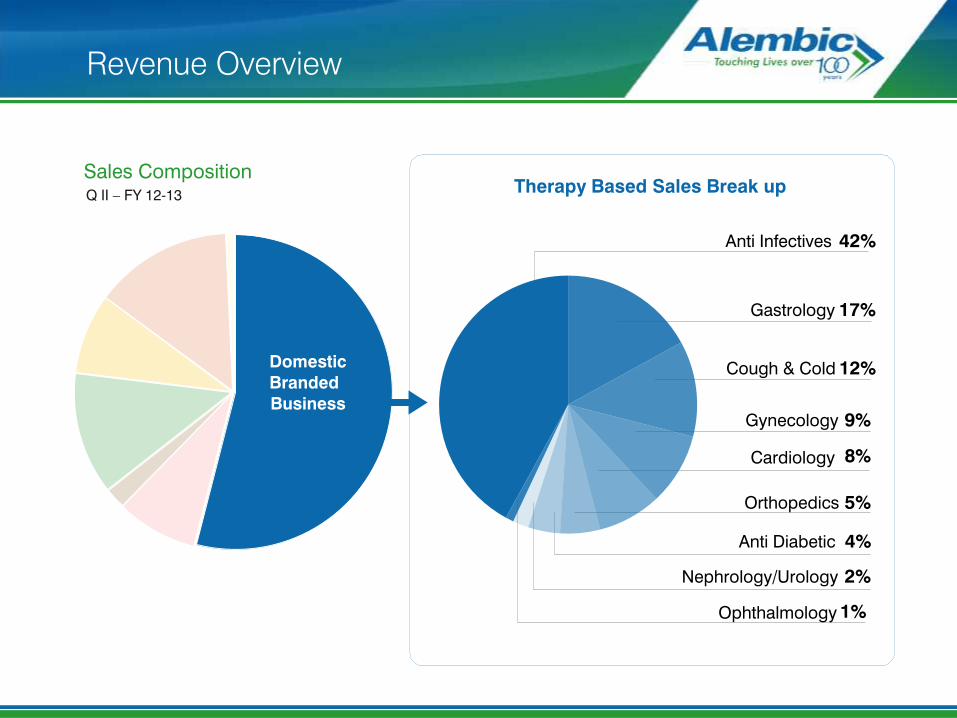
Revenue Overview
Sales Composition Q II – FY 12-13
Domestic Branded Formulations
54%
International Branded Formulations
2%
Export Incentive
1%
API Export
13%
API Domestic
8%
International Generics
14%
Generic & NSA
8%
Domestic
Branded
Business
Revenue Overview
Sales Composition Q II – FY 12-13
Anti Infectives 42%
Nephrology/Urology
1%
2%
Gastrology 17%
Orthopedics 5%
Cardiology 8%
Gynecology 9%
Cough & Cold 12%
Therapy Based Sales Break up
Anti Diabetic 4%
Ophthalmology

Revenue Overview
Sales Composition
International Generics
Q II - 2012
Global Sales break up
Europe
64% USA / Canada
36%
Generics
International
Business
Generics International

Revenue Overview
Sales Composition 2011 - 2012
Domestic Branded Formulations
46%
Generic & NSA International Branded Formulations
4%
Export Incentive
1%
API Export
17%
API Domestic
6%
International Generics
19%
7%

Revenue Overview
Sales Composition
Domestic
Branded
Business
2011 - 2012
Anti Infectives 43%
Ophthalmology 1%
Nephrology/Urology 2%
Gastrology 16%
Orthopedics 5%
Cardiology 8%
Gynecology 9%
Cough & Cold 13%
Therapy Based Sales Break up
Domestic
Branded
Formulations
Anti Diabetic 3%
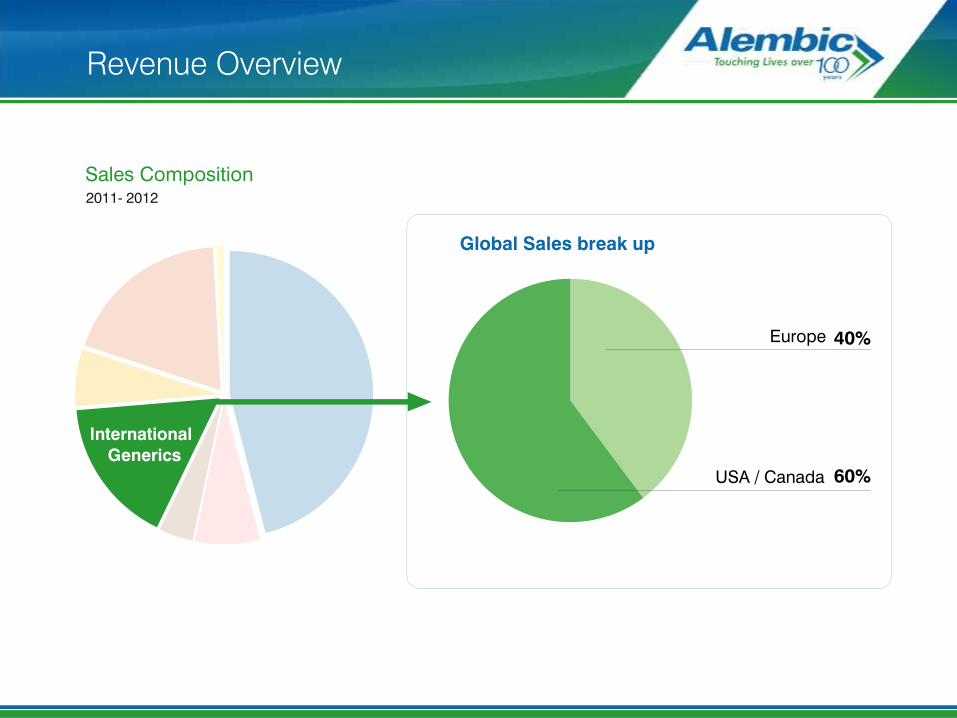
Revenue Overview
Sales Composition
International Generics
2011- 2012
Global Sales break up
Europe
60% USA / Canada
40%
Generics
International
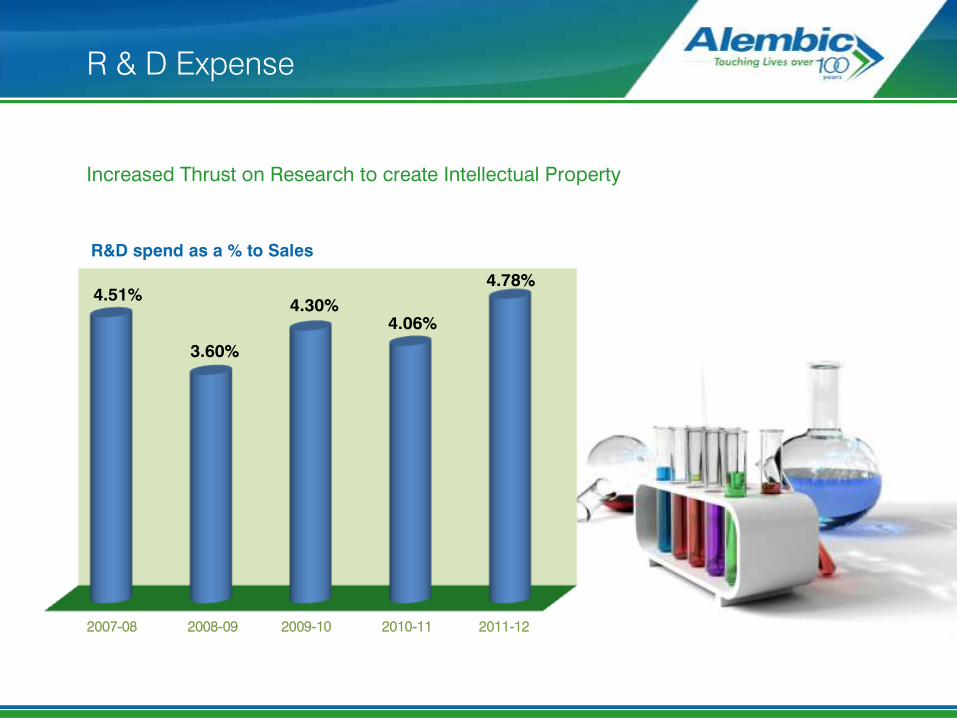
R & D Expense
Increased Thrust on Research to create Intellectual Property
R&D spend as a % to Sales
2007-08 2008-09 2009-10 2010-11 2011-12
4.51%
3.60%
4.30%
4.06%
4.78%

2009-10 2010-11 2011-12
2009-10 2010-11 2011-12
SALES PBIDTA
INR million INR million
Financial Snapshot
7 % 21 %
11487
12066
14679
CAGR 13%
1168
1603
2204
CAGR 37 %

Shareholding Pattern
As on 30th September 2012
Total Paid up Capital
INR 377.03 million
188.52 million
Total No. of Shareholders
50,378
Promoters & Promoter Group
45% Alembic Limited
29% Public
18%
FI / FII / MF
8%
Alembic Pharmaceuticals Limited
Agenda
Corporate Social Responsibility
The Alembic Journey
Insight - Alembic Overview
Insight - Strategic Advantage
Growth Drivers
Business Strategy and Approach
Financials

Corporate Social Responsibility
Rural Development Society
Rural Development Society
is a Social Responsibility
Initiative of Alembic
founded in 1979
Enhancement for
self employment and
income generation for
economic development
School, hostel and medical
facilities for local villagers
Corporate Social Responsibility
Environment
Alembic believes in clean
and green chemistry
Zero discharge facilities
comprising of
state-of-the-art aeration
system, ultra filtration and
reverse osmosis plant,
evaporation and
incineration plant
Dedicated scrubbing system
for process gas emissions
Mitanshu Shah
Tel.: 0265 - 300 7630 • Fax: 0265 - 228 2506
For updates and specific queries, please visit:
or feel free to contact
www.alembic-india.com
Alembic Pharmaceuticals Limited Alembic Road, Vadodara 390 003, India .Tel.: 0265 – 300 7000

Thank You