07 td rankin klauzijus
TRANSCRIPT
1
8.5 Idealisations in the Clausius Rankine Cycle or How to Assess a Real-LifeSteam Power Plant?
Recall the steps of the idealised Claudius-Rankine cycle depicted in Figure 8.5.1 and
8.5.2.
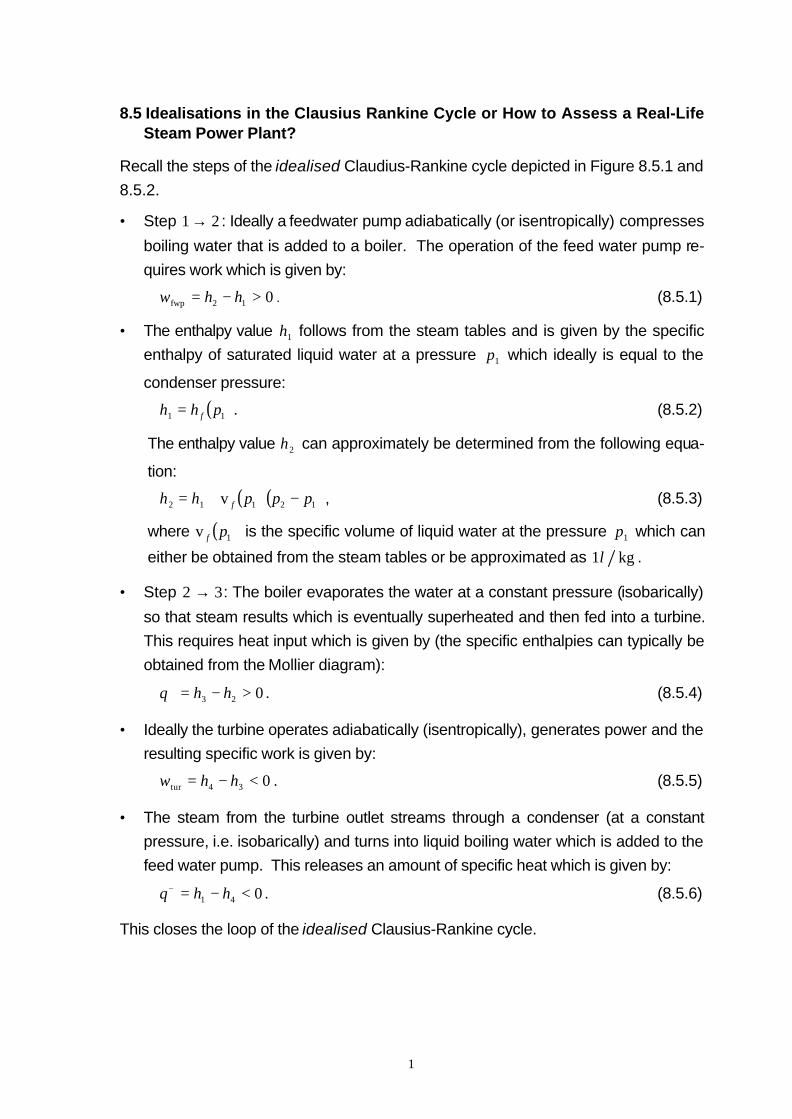
• Step 21→ : Ideally a feedwater pump adiabatically (or isentropically) compresses
boiling water that is added to a boiler. The operation of the feed water pump re-
quires work which is given by:
012fwp >−= hhw . (8.5.1)
• The enthalpy value 1h follows from the steam tables and is given by the specific
enthalpy of saturated liquid water at a pressure 1p which ideally is equal to the
condenser pressure:
( )11 phh f= . (8.5.2)
The enthalpy value 2h can approximately be determined from the following equa-
tion:
( ) ( )12112 v ppphh f −+= , (8.5.3)
where ( )1v pf is the specific volume of liquid water at the pressure 1p which can
either be obtained from the steam tables or be approximated as kg1l .
• Step 32 → : The boiler evaporates the water at a constant pressure (isobarically)
so that steam results which is eventually superheated and then fed into a turbine.
This requires heat input which is given by (the specific enthalpies can typically be
obtained from the Mollier diagram):
023 >−=+ hhq . (8.5.4)
• Ideally the turbine operates adiabatically (isentropically), generates power and the
resulting specific work is given by:
034tur <−= hhw . (8.5.5)
• The steam from the turbine outlet streams through a condenser (at a constant
pressure, i.e. isobarically) and turns into liquid boiling water which is added to the
feed water pump. This releases an amount of specific heat which is given by:
041 <−=− hhq . (8.5.6)
This closes the loop of the idealised Clausius-Rankine cycle.
2
2
boiler2
q+
FWP
condenser
turbine
3
4
1
1q
-
wtur
wfwp (η fwp)
(η tur)
3
4
Figure 8.5.1: Schematic of the components and steps during a Clausius-Rankine cycle.
h
c
1
2
3
4
s s
T
4
3
1
2
c
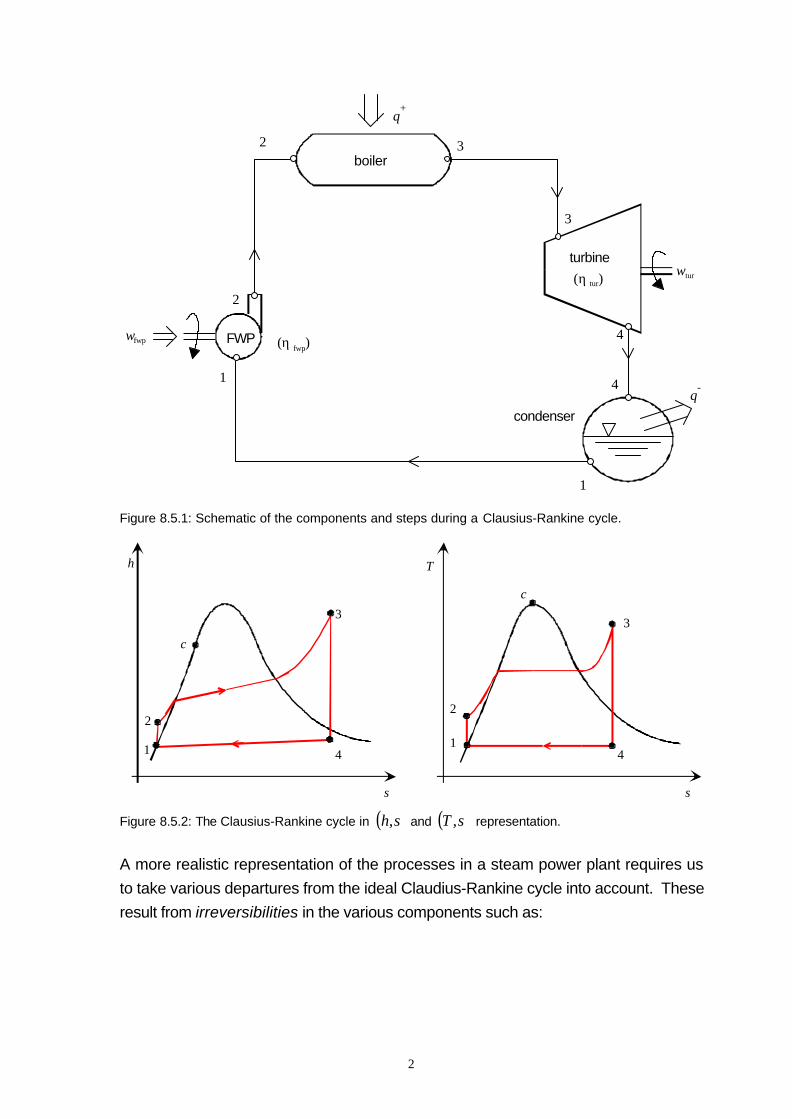
Figure 8.5.2: The Clausius-Rankine cycle in ( )sh, and ( )sT , representation.
A more realistic representation of the processes in a steam power plant requires us
to take various departures from the ideal Claudius-Rankine cycle into account. These
result from irreversibilities in the various components such as:
3
• friction and
• heat losses.
More specifically, there will always be fluid friction in the various pipes which connect
the feed water pump, the boiler, the turbine, as well as the condenser. And there will
also be fluid friction in the boiler and in the condenser (which, naively speaking, is
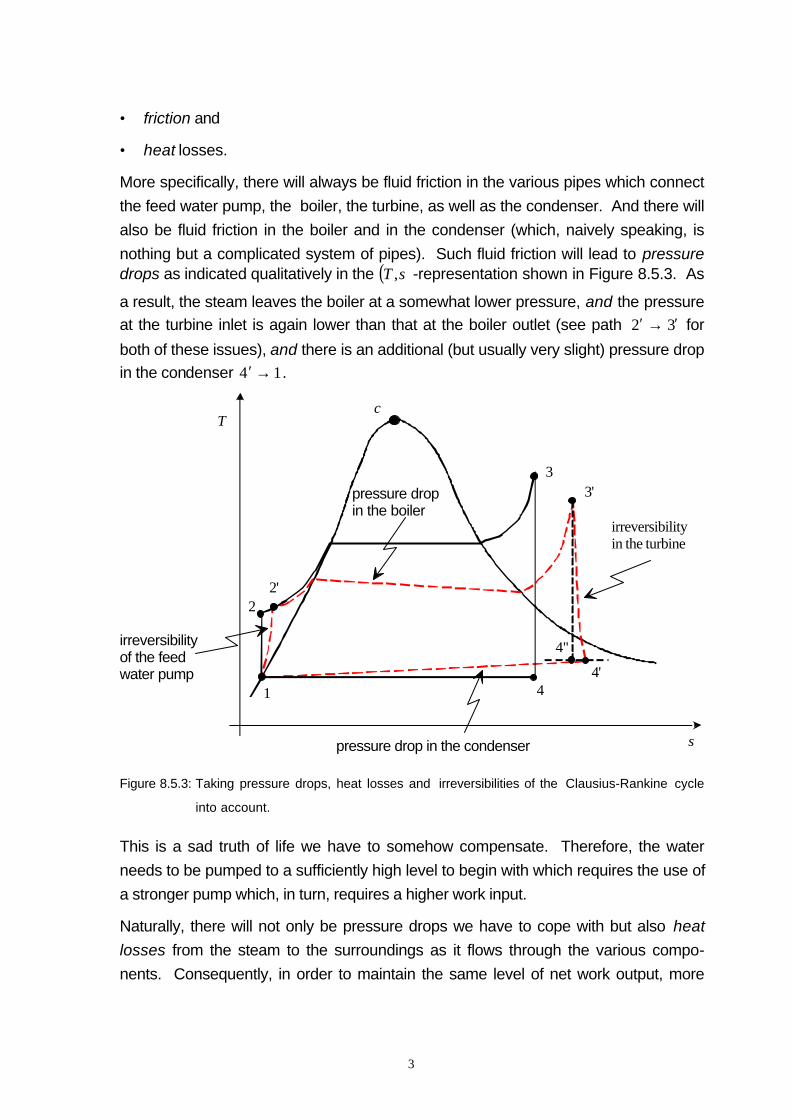
nothing but a complicated system of pipes). Such fluid friction will lead to pressuredrops as indicated qualitatively in the ( )sT , -representation shown in Figure 8.5.3. As
a result, the steam leaves the boiler at a somewhat lower pressure, and the pressure
at the turbine inlet is again lower than that at the boiler outlet (see path 32 ′→′ for
both of these issues), and there is an additional (but usually very slight) pressure drop
in the condenser 14 →′ .
1
2
3
4
s
T
irreversibilityof the feed water pump
pressure dropin the boiler
irreversibilityin the turbine
4'
3'
pressure drop in the condenser
2'
4''
c
Figure 8.5.3: Taking pressure drops, heat losses and irreversibilities of the Clausius-Rankine cycle
into account.
This is a sad truth of life we have to somehow compensate. Therefore, the water
needs to be pumped to a sufficiently high level to begin with which requires the use of
a stronger pump which, in turn, requires a higher work input.
Naturally, there will not only be pressure drops we have to cope with but also heat
losses from the steam to the surroundings as it flows through the various compo-
nents. Consequently, in order to maintain the same level of net work output, more
4
heat has to be added to the boiler which increases the running costs and decreases
the efficiency.
Finally, neither the pump nor the turbine operate perfectly. It was mentioned already
that more work is required to operate the pump at higher pressure levels. However,
the pure operation of a pump, being a non-reversible machine, naturally requires
more work input than theoretically necessary to reach this desired pressure level. In
other words, the pump does not operate adiabatically / isentropically. Rather entropy
increases during its operation as indicated by the slightly curved line 21 ′→ in Figure
8.5.3. Similarly, the turbine does not operate adiabatically / isentropically either. As
a result of irreversibility the entropy level will also increase as shown in path 43 ′→′
of Figure 8.5.3.
It is customary to assess the irreversible losses in the pump as well as in the turbine
through so-called adiabatic efficiencies which are given by the ratio of theoretical and
real work input or the ratio of real work output to theoretical output, respectively. In
terms of specific enthalpy data which correspond to the points of Figure 8.5.3 they
are defined as follows (the point 4 ′′ lies along the vertical line through 3′ at the same
pressure level as point 4′ ):
112
12realfwp
adiafwp
fwp <−′−==η
hhhh
w
w , ( )434
34
34
adiatur
realtur
tur ,,1 ppsshhhh
hh
w
w ′=′==′′<′−′′′−′
==η . (8.5.7)
But this is not the end of a very intricate situation. Many other things have to be con-
sidered when dealing with a real-life power plant. For example, the liquid in the con-
denser is frequently subcooled. This is done to prevent cavitation, rapid vaporisa-
tion and condensation of the liquid water near the blades at the low-pressure side of
the pump, all of which can lead to potential damage. Similarly, the turbine blades can
be destroyed when they are hit by high speed water droplets as it will happen if a
state in the wet-vapour region is reached resulting in partial condensation. Also:
Water / steam (which preferably is of relatively high purity) can get lost on its way
through the various plant components and loss due to such leaks has to be replaced.
Finally, additional power necessary to operate the plant (for example for the operation
of the fans which transport air to the boiler furnaces) should be considered when the
net performance of the plant is assessed.
8.6 Numerical Treatment of a Somewhat Realistic Power Cycle
Consider the idealised power cycle as indicated in Figure 8.6.1. The objective is tooperate the plant between bar150 turbine inlet pressure at C600 ° and bar1.0 con-
denser pressure.
5
boiler + superheater
FWP
turbine
condenserI
II
II III
I
III
IV
I
II
III
IV
T
s
150 bar
0.1 bar
600 °C
c
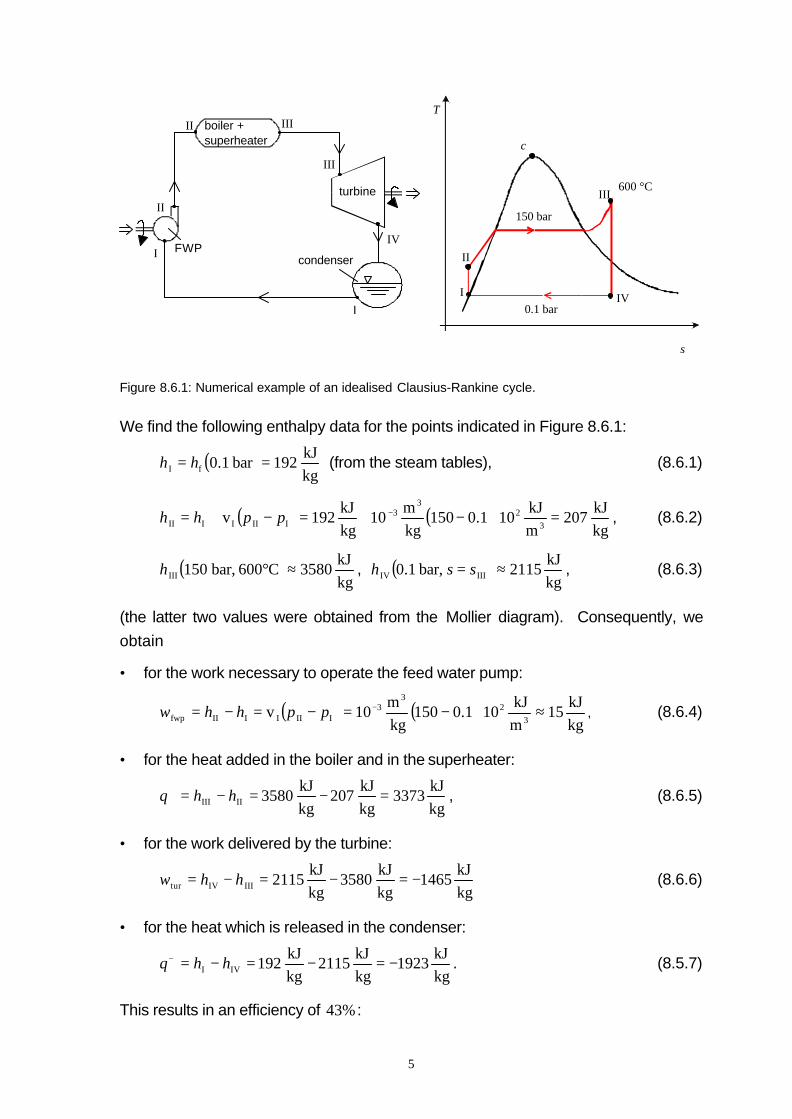
Figure 8.6.1: Numerical example of an idealised Clausius-Rankine cycle.
We find the following enthalpy data for the points indicated in Figure 8.6.1:
( )kgkJ
192bar1.0fI == hh (from the steam tables), (8.6.1)
( ) ( )kgkJ
207mkJ
101.0150kgm
10kgkJ
192v3
23
3IIIIIII =⋅−+=−+= −pphh , (8.6.2)
( )kgkJ
3580C600,bar150III šh , ( )kgkJ
2115,bar1.0 IIIIV ≈= ssh , (8.6.3)
(the latter two values were obtained from the Mollier diagram). Consequently, we
obtain
• for the work necessary to operate the feed water pump:
( ) ( )kgkJ
15mkJ
101.0150kgm
10v3
23
3IIIIIIIfwp ≈⋅−=−=−= −pphhw , (8.6.4)
• for the heat added in the boiler and in the superheater:
kgkJ
3373kgkJ
207kgkJ
3580IIIII =−=−=+ hhq , (8.6.5)
• for the work delivered by the turbine:
kgkJ
1465kgkJ
3580kgkJ
2115IIIIVtur −=−=−= hhw (8.6.6)
• for the heat which is released in the condenser:
kgkJ
1923kgkJ
2115kgkJ
192IVI −=−=−=− hhq . (8.5.7)
This results in an efficiency of %43 :
6
( )43.0
3373151465
effortwork net""profit
IIIII
IIIIIIIVfwptur =−=−
−−−=
−===
+ hh
hhhh
q
wwe , (8.5.8)
if we do not neglect the work of the feed water pump.
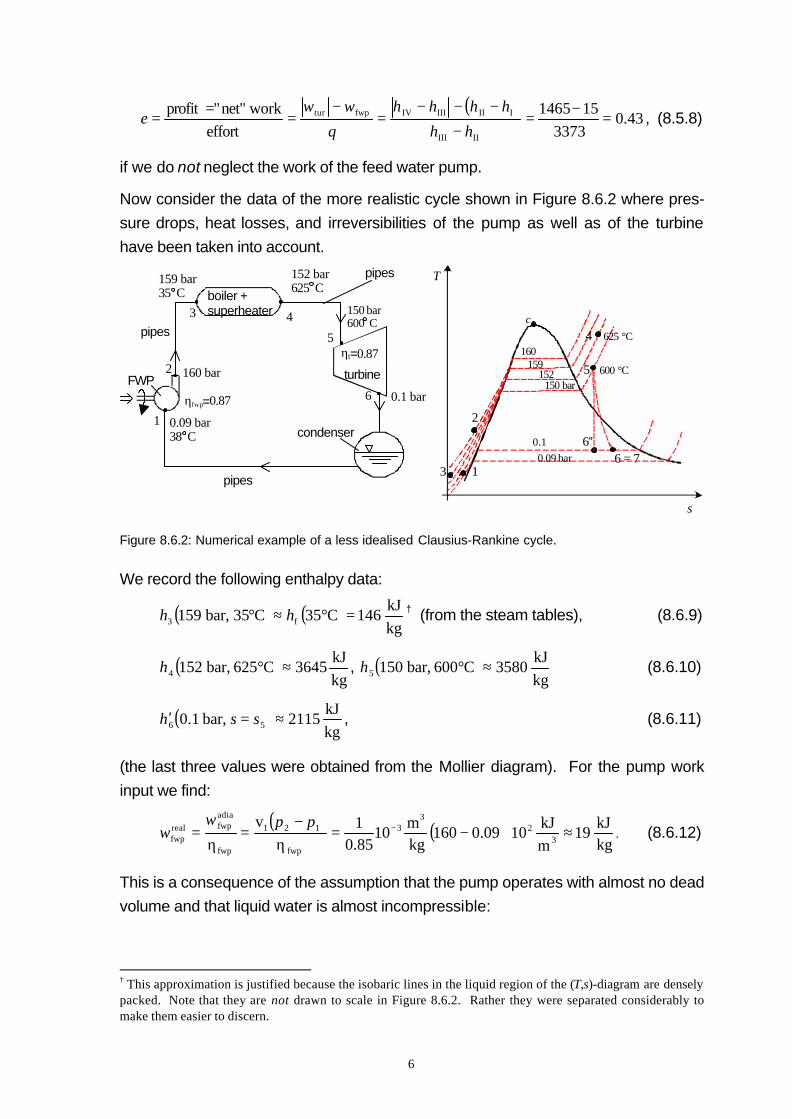
Now consider the data of the more realistic cycle shown in Figure 8.6.2 where pres-
sure drops, heat losses, and irreversibilities of the pump as well as of the turbine
have been taken into account.
FWP
boiler +superheater
turbine
condenser
pipes
1
2
3 4
5
6
ηt=0.87
ηfwp=0.87
0.09 bar38 C
159 bar35 C
152 bar625 C
150 bar600 C
1
2
36 = 7
6''
T
s
pipes
160 bar
0.1 bar
pipes
160159
150 bar600 °C5
0.1
0.09 bar
152
c
4 625 °C
Figure 8.6.2: Numerical example of a less idealised Clausius-Rankine cycle.
We record the following enthalpy data:
( ) ( )kgkJ
146C35C35,bar159 f3 =°≈° hh † (from the steam tables), (8.6.9)
( )kgkJ
3645C625,bar1524 šh , ( )kgkJ
3580C600,bar1505 šh (8.6.10)
( )kgkJ
2115,bar1.0 56 ≈=′ ssh , (8.6.11)
(the last three values were obtained from the Mollier diagram). For the pump work
input we find:
( ) ( )kgkJ
19mkJ
1009.0160kgm
1085.01v
32
33
fwp
121
fwp
adiafwpreal
fwp ≈⋅−=η
−=
η= −ppw
w . (8.6.12)
This is a consequence of the assumption that the pump operates with almost no dead
volume and that liquid water is almost incompressible:
† This approximation is justified because the isobaric lines in the liquid region of the (T,s)-diagram are denselypacked. Note that they are not drawn to scale in Figure 8.6.2. Rather they were separated considerably tomake them easier to discern.
7
( ) ( )121
2
1
1
2
1
adiafwp vdvdv0dvvddv pppppppw −==+=+−=−= ∫∫ ∫∫∫
′′
. (8.6.12)
Next we take a look at the turbine work output:
( ) ( )kgkJ
1245kgkJ
3580211587.056turadiaturtur
realtur −=−⋅=−′η=η= hhww . (8.6.13)
For the boiler heat input which is required to guarantee the necessary plant perform-
ance we find:
kgkJ
3499kgkJ
146kgkJ
364534 =−=−=+ hhq , (8.6.14)
and the efficiency becomes:
35.03499
191245effort
work net""profitrealfwp
realtur =−=
−===
+q
wwe , (8.6.15)
which is considerably lower than the efficiency of the idealised Clausius-Rankine
process.
8.7 Efficiency Improvements Revisited
In Section 8.2 it was already briefly discussed how the efficiency of the Clausius-
Rankine Cycle can be improved. In general, the idea behind all these improvements
is
• to increase or
• to decrease
the average temperature at which heat is transferred to or rejected from the working
fluid, i.e. the steam / the water, respectively. Technically speaking, this enlarges thearea enclosed in the ( )sT , -diagram representation of the cycle which, as outlined in
Section 5.6, represents the work gained. Typically three measures are taken to im-
prove on the efficiency that way: Lowering of the condenser pressure, superheating of
the steam, and increasing the boiler pressure. A few technical details will be outlined
in the following subsections.
8.7.1 Lowering the Condenser Pressure
Recall that the steam is in a state of wet vapour when it enters the condenser. In other
words, it exists as a saturated mix of liquid and water vapour at a saturation tem-
perature which corresponds one-to-one to the pressure inside of the condenser. How
the pressure and the temperature are correlated to each other can be read off from
the steam tables (say). Consequently, lowering the condenser pressure will straight-
forwardly result in a temperature decrease at which heat is rejected. The effect of
8
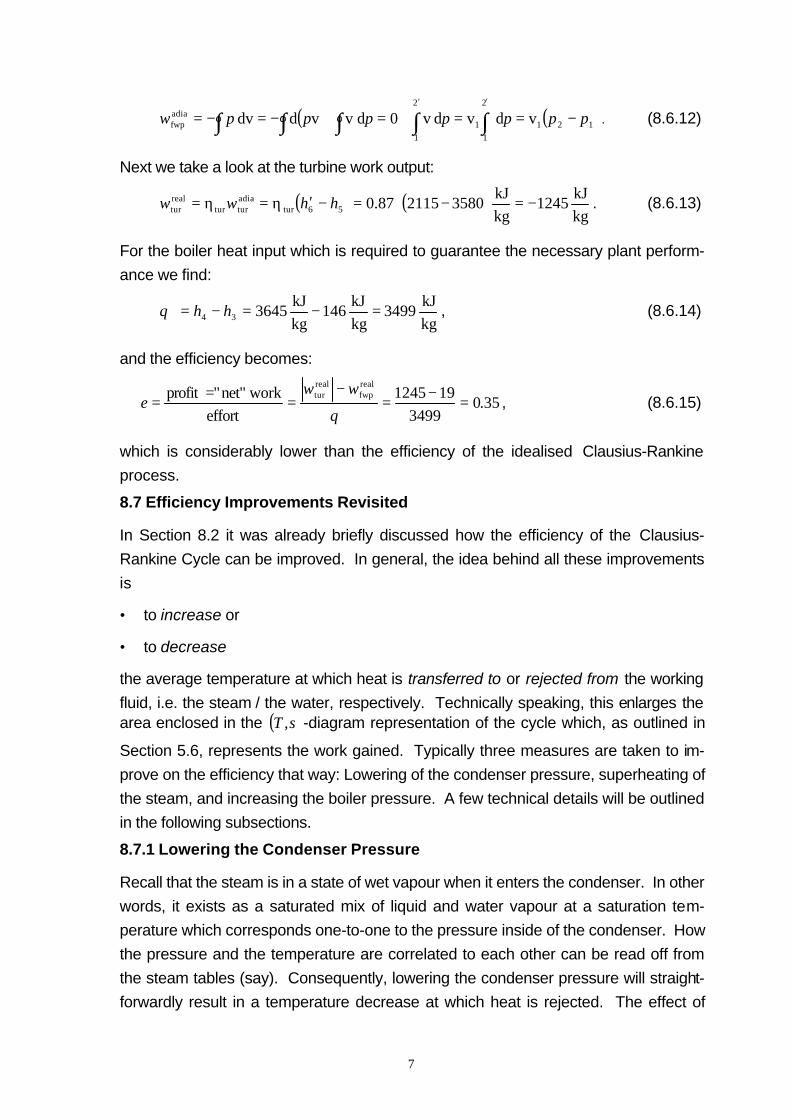
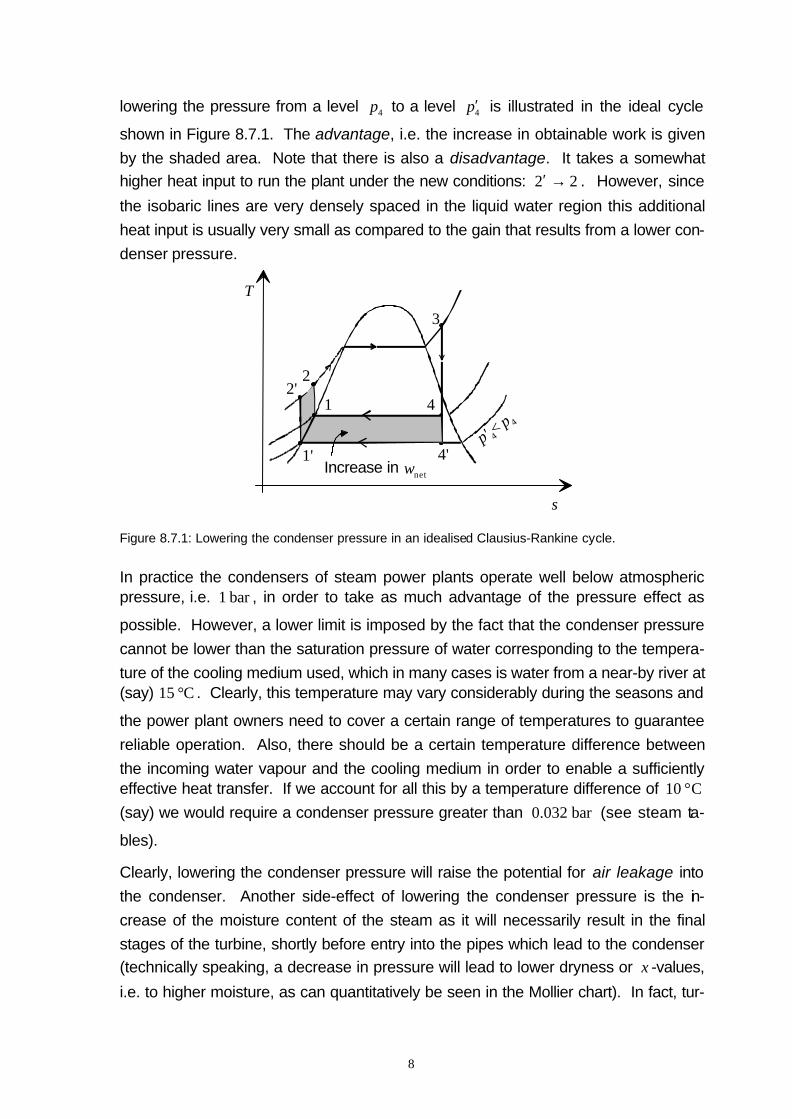
lowering the pressure from a level 4p to a level 4p′ is illustrated in the ideal cycle
shown in Figure 8.7.1. The advantage, i.e. the increase in obtainable work is given
by the shaded area. Note that there is also a disadvantage. It takes a somewhat
higher heat input to run the plant under the new conditions: 22 →′ . However, since
the isobaric lines are very densely spaced in the liquid water region this additional
heat input is usually very small as compared to the gain that results from a lower con-
denser pressure.
1'
12'
2
3
4
4'p' 4<
p 4
s
T
Increase in wnet
Figure 8.7.1: Lowering the condenser pressure in an idealised Clausius-Rankine cycle.
In practice the condensers of steam power plants operate well below atmosphericpressure, i.e. bar1 , in order to take as much advantage of the pressure effect as
possible. However, a lower limit is imposed by the fact that the condenser pressure
cannot be lower than the saturation pressure of water corresponding to the tempera-
ture of the cooling medium used, which in many cases is water from a near-by river at(say) C15 ° . Clearly, this temperature may vary considerably during the seasons and
the power plant owners need to cover a certain range of temperatures to guarantee
reliable operation. Also, there should be a certain temperature difference between
the incoming water vapour and the cooling medium in order to enable a sufficientlyeffective heat transfer. If we account for all this by a temperature difference of C10 °(say) we would require a condenser pressure greater than bar032.0 (see steam ta-
bles).
Clearly, lowering the condenser pressure will raise the potential for air leakage into
the condenser. Another side-effect of lowering the condenser pressure is the in-
crease of the moisture content of the steam as it will necessarily result in the final
stages of the turbine, shortly before entry into the pipes which lead to the condenser
(technically speaking, a decrease in pressure will lead to lower dryness or x -values,
i.e. to higher moisture, as can quantitatively be seen in the Mollier chart). In fact, tur-
9
bine manufacturers dislike the presence of large quantities of moisture, i.e. high-
speed / high temperature water droplets, in their machinery which will lead to erosion
and, consequently, puts extremely high demands on the materials used for manufac-
ture. A way of correcting this problem, at least partially, is superheating and the use
of reheat stages which will be discussed later.
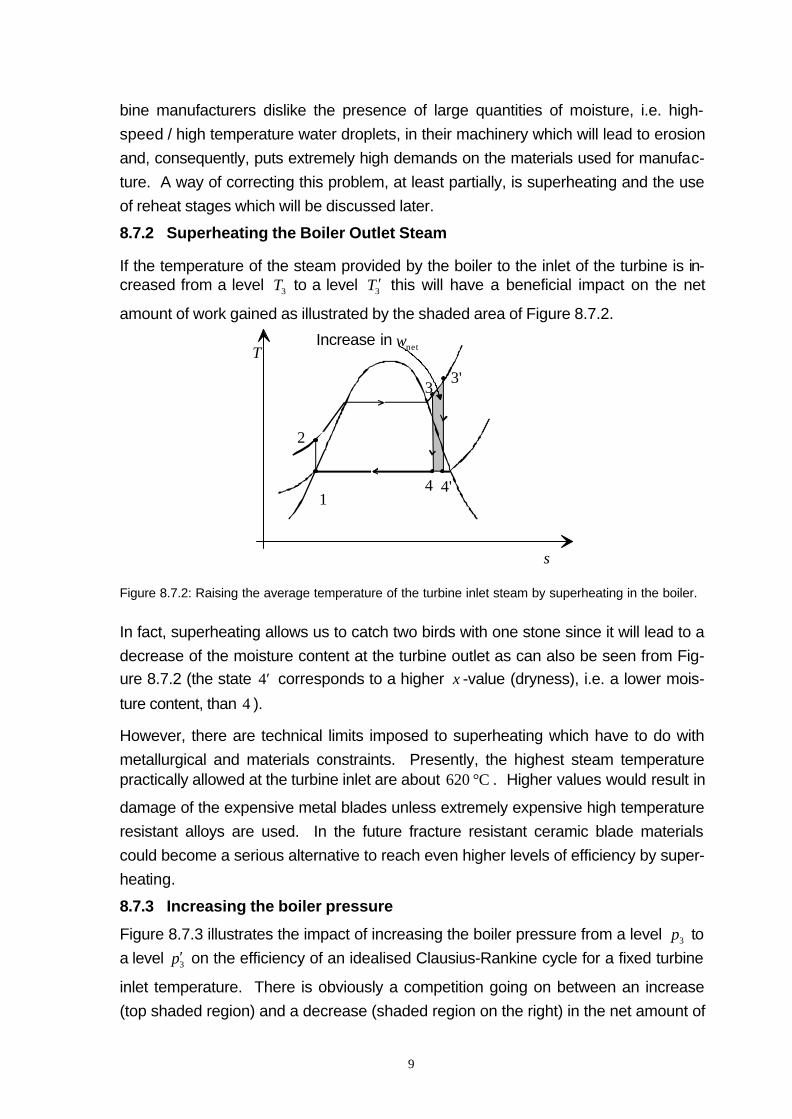
8.7.2 Superheating the Boiler Outlet Steam
If the temperature of the steam provided by the boiler to the inlet of the turbine is in-creased from a level 3T to a level 3T ′ this will have a beneficial impact on the net
amount of work gained as illustrated by the shaded area of Figure 8.7.2.
Increase in wnet
1
2
3
4 4'
3'
T
s
Figure 8.7.2: Raising the average temperature of the turbine inlet steam by superheating in the boiler.
In fact, superheating allows us to catch two birds with one stone since it will lead to a
decrease of the moisture content at the turbine outlet as can also be seen from Fig-
ure 8.7.2 (the state 4′ corresponds to a higher x -value (dryness), i.e. a lower mois-
ture content, than 4 ).
However, there are technical limits imposed to superheating which have to do with
metallurgical and materials constraints. Presently, the highest steam temperaturepractically allowed at the turbine inlet are about C620 ° . Higher values would result in
damage of the expensive metal blades unless extremely expensive high temperature
resistant alloys are used. In the future fracture resistant ceramic blade materials
could become a serious alternative to reach even higher levels of efficiency by super-
heating.
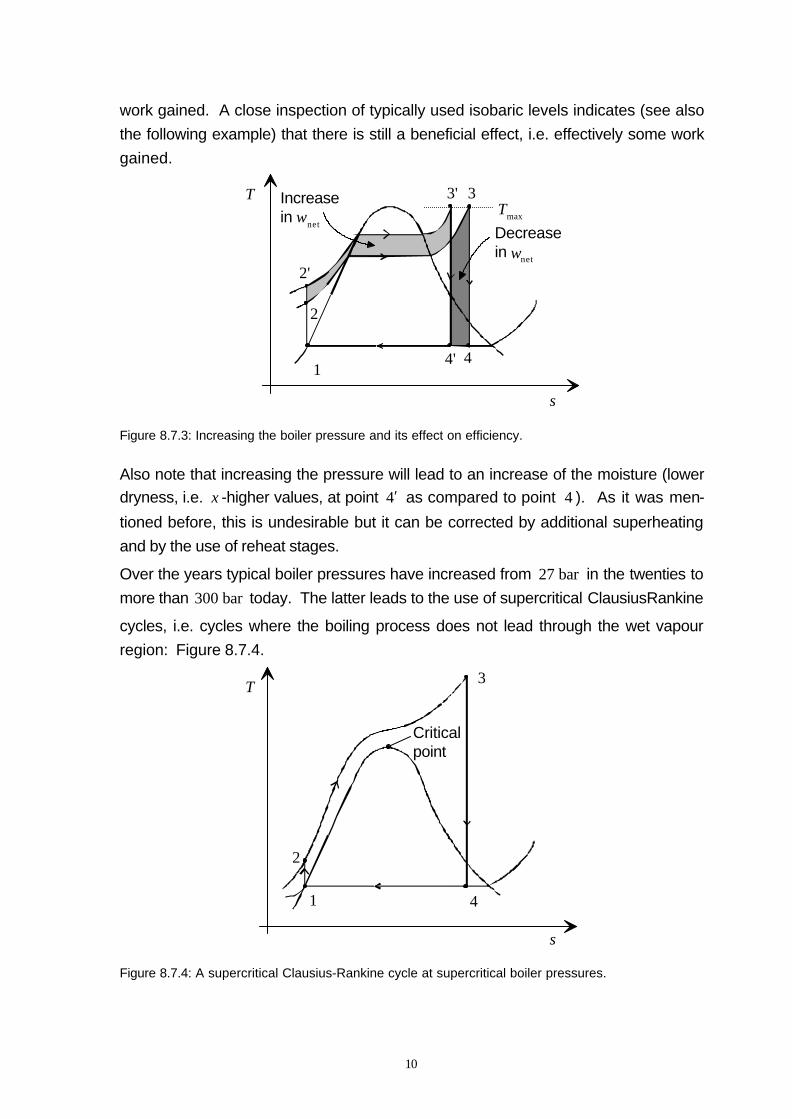
8.7.3 Increasing the boiler pressure
Figure 8.7.3 illustrates the impact of increasing the boiler pressure from a level 3p to
a level 3p′ on the efficiency of an idealised Clausius-Rankine cycle for a fixed turbine
inlet temperature. There is obviously a competition going on between an increase
(top shaded region) and a decrease (shaded region on the right) in the net amount of
10
work gained. A close inspection of typically used isobaric levels indicates (see also
the following example) that there is still a beneficial effect, i.e. effectively some work
gained.
Increase in wnet
Decreasein wnet
1
2
3
4
3'
4'
2'
T
s
Tmax
Figure 8.7.3: Increasing the boiler pressure and its effect on efficiency.
Also note that increasing the pressure will lead to an increase of the moisture (lower
dryness, i.e. x -higher values, at point 4′ as compared to point 4 ). As it was men-
tioned before, this is undesirable but it can be corrected by additional superheating
and by the use of reheat stages.
Over the years typical boiler pressures have increased from bar27 in the twenties to
more than bar300 today. The latter leads to the use of supercritical ClausiusRankine
cycles, i.e. cycles where the boiling process does not lead through the wet vapour
region: Figure 8.7.4.
T
Criticalpoint
1
2
3
4
s
Figure 8.7.4: A supercritical Clausius-Rankine cycle at supercritical boiler pressures.
11
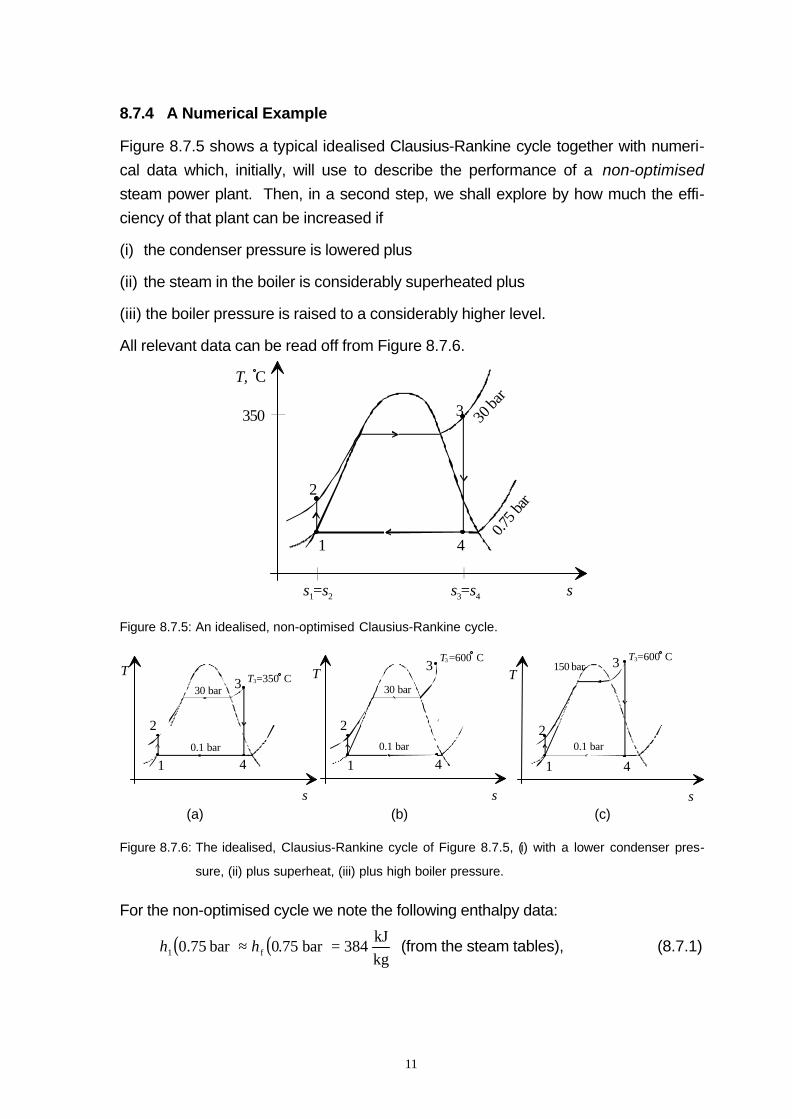
8.7.4 A Numerical Example
Figure 8.7.5 shows a typical idealised Clausius-Rankine cycle together with numeri-
cal data which, initially, will use to describe the performance of a non-optimised
steam power plant. Then, in a second step, we shall explore by how much the effi-
ciency of that plant can be increased if
(i) the condenser pressure is lowered plus
(ii) the steam in the boiler is considerably superheated plus
(iii) the boiler pressure is raised to a considerably higher level.
All relevant data can be read off from Figure 8.7.6.
T, C
350
s1=s2 s3=s4
30 ba
r0.7
5 bar
3
41
2
s
Figure 8.7.5: An idealised, non-optimised Clausius-Rankine cycle.
1 11
22 2
3
33
444
s ss
150 bar
30 bar30 bar
0.1 bar 0.1 bar0.1 bar
TT TT3=350 C
T3=600 C T3=600 C
(a) (b) (c)
Figure 8.7.6: The idealised, Clausius-Rankine cycle of Figure 8.7.5, (i) with a lower condenser pres-
sure, (ii) plus superheat, (iii) plus high boiler pressure.
For the non-optimised cycle we note the following enthalpy data:
( ) ( )kgkJ
384bar75.0bar75.0 f1 =≈ hh (from the steam tables), (8.7.1)
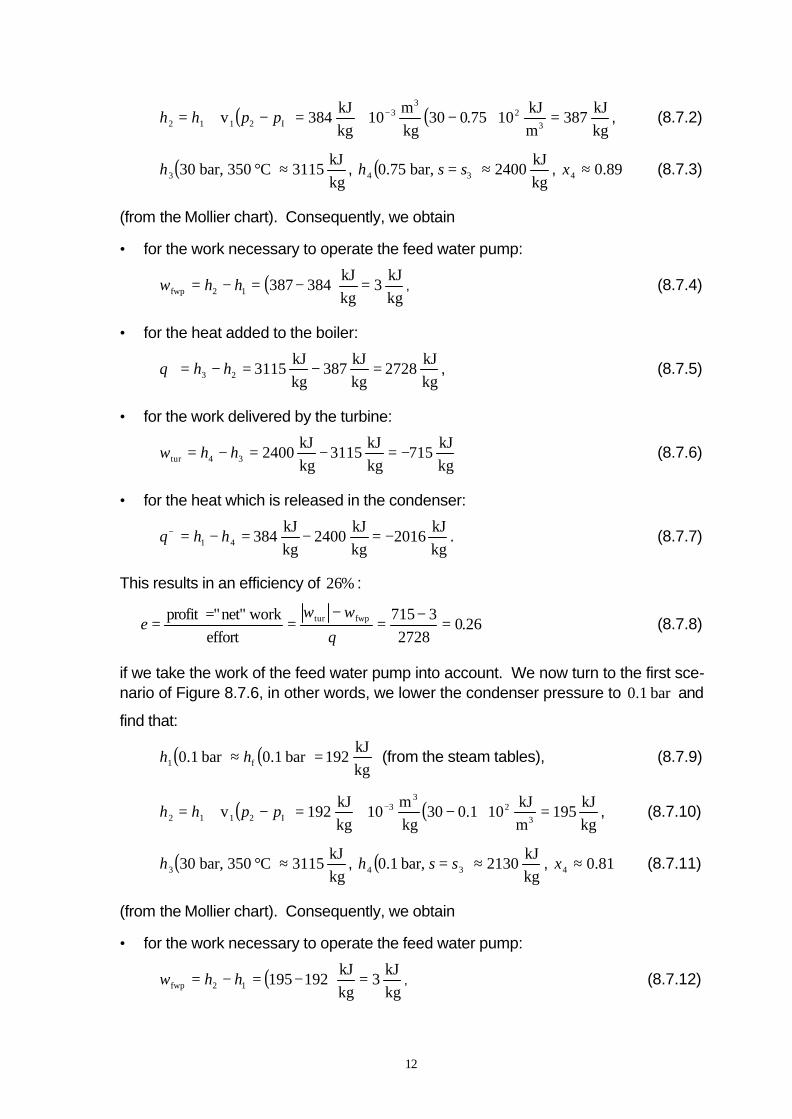
12
( ) ( )kgkJ
387mkJ
1075.030kgm
10kgkJ
384v3
23
3I2112 =⋅−+=−+= −pphh , (8.7.2)
( )kgkJ
3115C350,bar303 šh , ( )kgkJ
2400,bar75.0 34 ≈= ssh , 89.04 ≈x (8.7.3)
(from the Mollier chart). Consequently, we obtain
• for the work necessary to operate the feed water pump:
( )kgkJ
3kgkJ
38438712fwp =−=−= hhw , (8.7.4)
• for the heat added to the boiler:
kgkJ
2728kgkJ
387kgkJ
311523 =−=−=+ hhq , (8.7.5)
• for the work delivered by the turbine:
kgkJ
715kgkJ
3115kgkJ
240034tur −=−=−= hhw (8.7.6)
• for the heat which is released in the condenser:
kgkJ
2016kgkJ
2400kgkJ
38441 −=−=−=− hhq . (8.7.7)
This results in an efficiency of %26 :
26.02728
3715effort
work net""profit fwptur =−=−
===+q
wwe (8.7.8)
if we take the work of the feed water pump into account. We now turn to the first sce-nario of Figure 8.7.6, in other words, we lower the condenser pressure to bar1.0 and
find that:
( ) ( )kgkJ
192bar1.0bar1.0 f1 =≈ hh (from the steam tables), (8.7.9)
( ) ( )kgkJ
195mkJ
101.030kgm
10kgkJ
192v3
23
3I2112 =⋅−+=−+= −pphh , (8.7.10)
( )kgkJ
3115C350,bar303 šh , ( )kgkJ
2130,bar1.0 34 ≈= ssh , 81.04 ≈x (8.7.11)
(from the Mollier chart). Consequently, we obtain
• for the work necessary to operate the feed water pump:
( )kgkJ
3kgkJ
19219512fwp =−=−= hhw , (8.7.12)
13
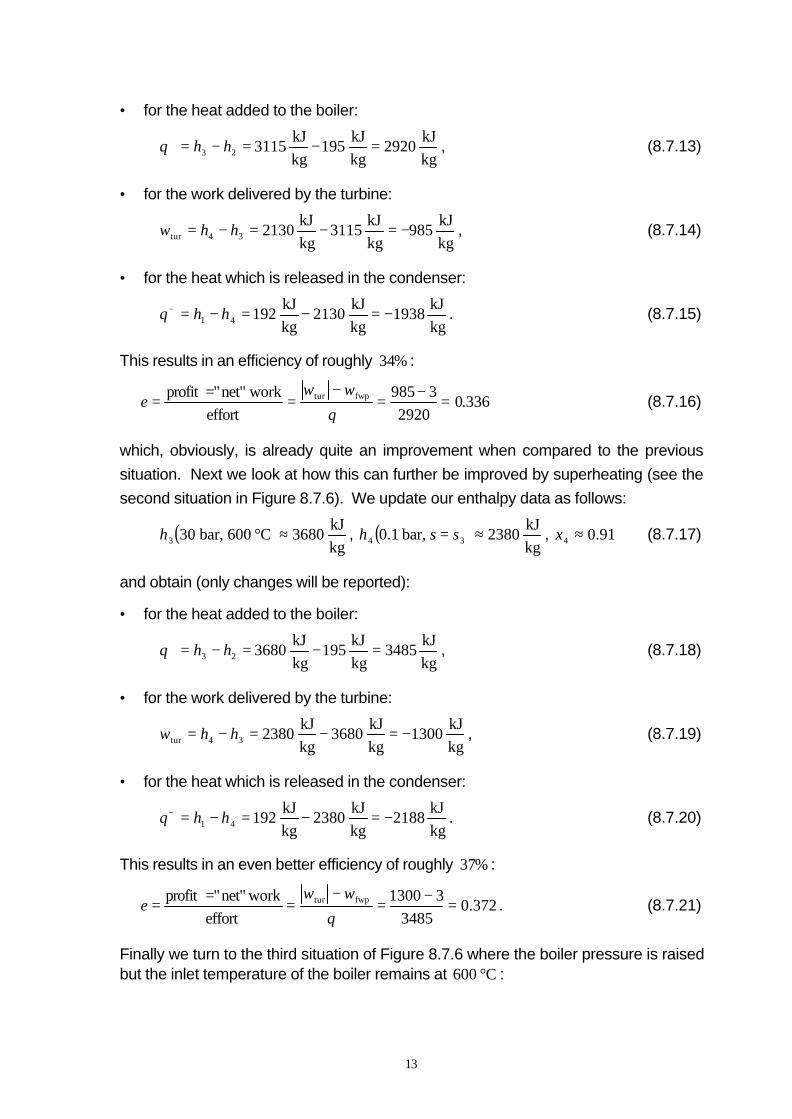
• for the heat added to the boiler:
kgkJ
2920kgkJ
195kgkJ
311523 =−=−=+ hhq , (8.7.13)
• for the work delivered by the turbine:
kgkJ
985kgkJ
3115kgkJ
213034tur −=−=−= hhw , (8.7.14)
• for the heat which is released in the condenser:
kgkJ
1938kgkJ
2130kgkJ
19241 −=−=−=− hhq . (8.7.15)
This results in an efficiency of roughly %34 :
336.02920
3985effort
work net""profit fwptur =−=−
===+q
wwe (8.7.16)
which, obviously, is already quite an improvement when compared to the previous
situation. Next we look at how this can further be improved by superheating (see the
second situation in Figure 8.7.6). We update our enthalpy data as follows:
( )kgkJ
3680C600,bar303 šh , ( )kgkJ
2380,bar1.0 34 ≈= ssh , 91.04 ≈x (8.7.17)
and obtain (only changes will be reported):
• for the heat added to the boiler:
kgkJ
3485kgkJ
195kgkJ
368023 =−=−=+ hhq , (8.7.18)
• for the work delivered by the turbine:
kgkJ
1300kgkJ
3680kgkJ
238034tur −=−=−= hhw , (8.7.19)
• for the heat which is released in the condenser:
kgkJ
2188kgkJ
2380kgkJ
19241 −=−=−=− hhq . (8.7.20)
This results in an even better efficiency of roughly %37 :
372.03485
31300effort
work net""profit fwptur =−=−
===+q
wwe . (8.7.21)
Finally we turn to the third situation of Figure 8.7.6 where the boiler pressure is raisedbut the inlet temperature of the boiler remains at C600 ° :
14
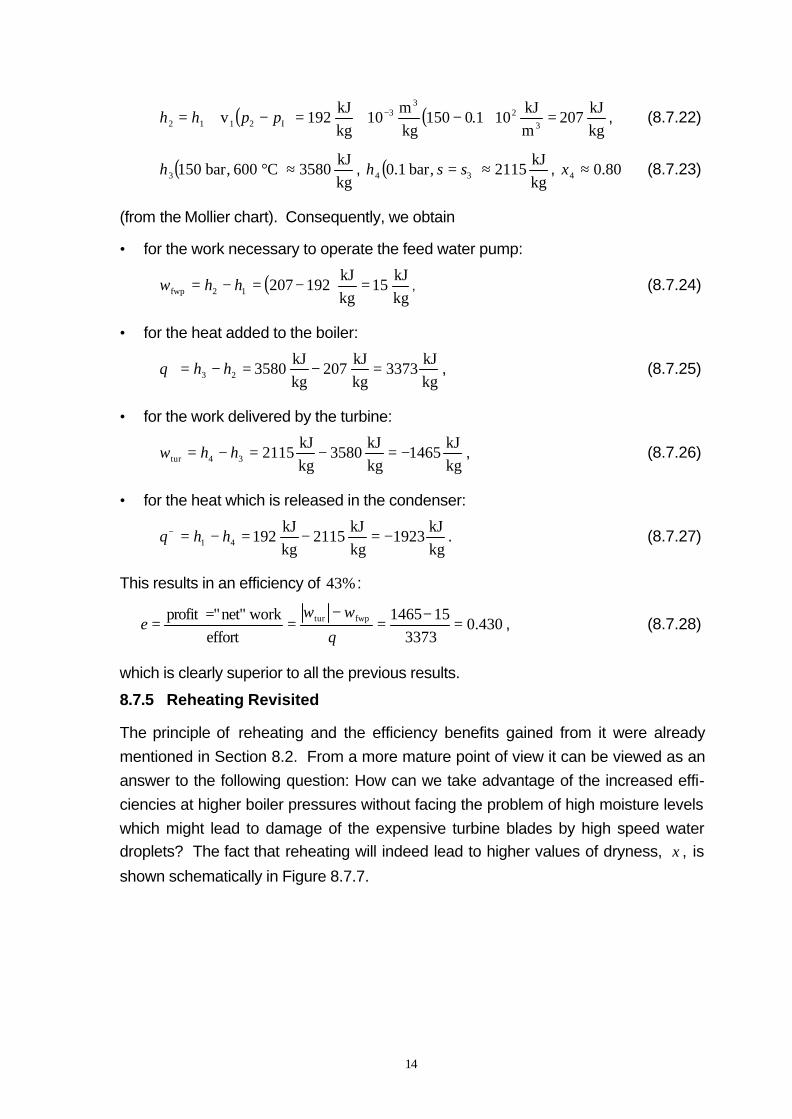
( ) ( )kgkJ
207mkJ
101.0150kgm
10kgkJ
192v3
23
3I2112 =⋅−+=−+= −pphh , (8.7.22)
( )kgkJ
3580C600,bar1503 šh , ( )kgkJ
2115,bar1.0 34 ≈= ssh , 80.04 ≈x (8.7.23)
(from the Mollier chart). Consequently, we obtain
• for the work necessary to operate the feed water pump:
( )kgkJ
15kgkJ
19220712fwp =−=−= hhw , (8.7.24)
• for the heat added to the boiler:
kgkJ
3373kgkJ
207kgkJ
358023 =−=−=+ hhq , (8.7.25)
• for the work delivered by the turbine:
kgkJ
1465kgkJ
3580kgkJ
211534tur −=−=−= hhw , (8.7.26)
• for the heat which is released in the condenser:
kgkJ
1923kgkJ
2115kgkJ
19241 −=−=−=− hhq . (8.7.27)
This results in an efficiency of %43 :
430.03373
151465effort
work net""profit fwptur =−=−
===+q
wwe , (8.7.28)
which is clearly superior to all the previous results.
8.7.5 Reheating Revisited
The principle of reheating and the efficiency benefits gained from it were already
mentioned in Section 8.2. From a more mature point of view it can be viewed as an
answer to the following question: How can we take advantage of the increased effi-
ciencies at higher boiler pressures without facing the problem of high moisture levels
which might lead to damage of the expensive turbine blades by high speed water
droplets? The fact that reheating will indeed lead to higher values of dryness, x , is
shown schematically in Figure 8.7.7.
15
3
4
1
2
s
5
6
high-pressureturbine reheating
low-pressure turbine
T
FWP
condenserboiler
super-heater
high-pressureturbine low-pressure
turbine
reheater
12
3
45
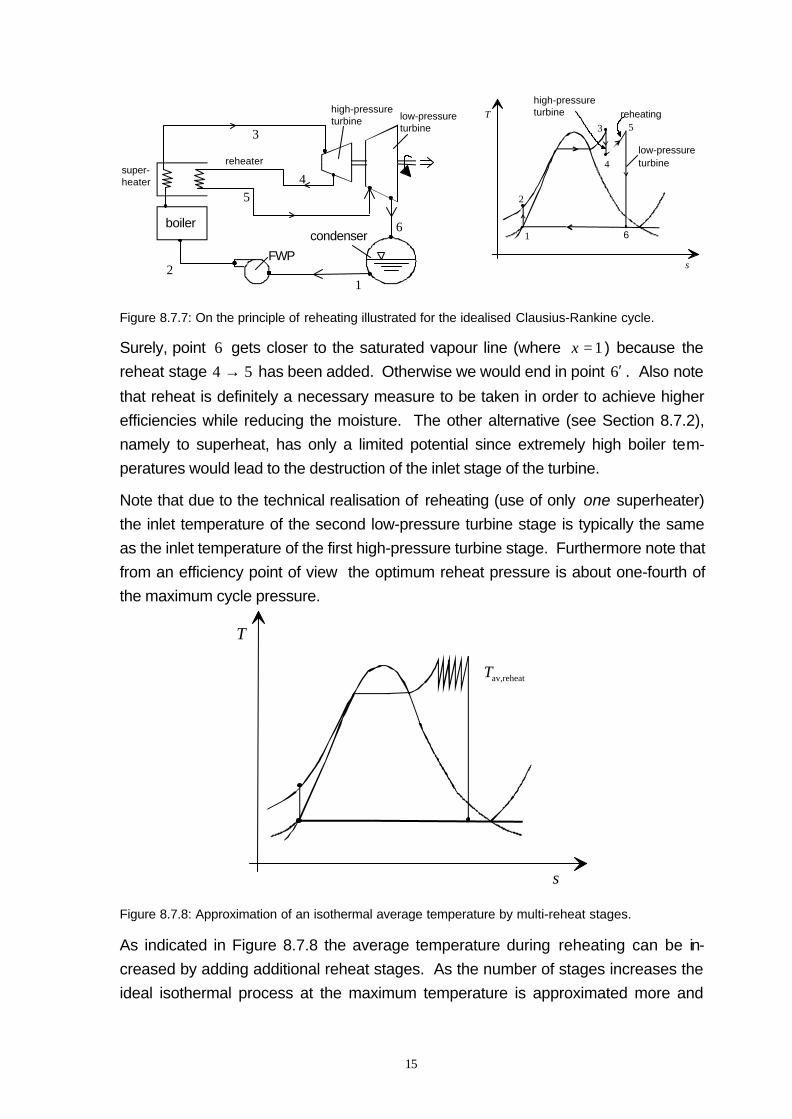
6
Figure 8.7.7: On the principle of reheating illustrated for the idealised Clausius-Rankine cycle.
Surely, point 6 gets closer to the saturated vapour line (where 1=x ) because the
reheat stage 54 → has been added. Otherwise we would end in point 6′ . Also note
that reheat is definitely a necessary measure to be taken in order to achieve higher
efficiencies while reducing the moisture. The other alternative (see Section 8.7.2),
namely to superheat, has only a limited potential since extremely high boiler tem-
peratures would lead to the destruction of the inlet stage of the turbine.
Note that due to the technical realisation of reheating (use of only one superheater)
the inlet temperature of the second low-pressure turbine stage is typically the same
as the inlet temperature of the first high-pressure turbine stage. Furthermore note that
from an efficiency point of view the optimum reheat pressure is about one-fourth of
the maximum cycle pressure.
s
T
Tav,reheat
Figure 8.7.8: Approximation of an isothermal average temperature by multi-reheat stages.
As indicated in Figure 8.7.8 the average temperature during reheating can be in-
creased by adding additional reheat stages. As the number of stages increases the
ideal isothermal process at the maximum temperature is approximated more and
16
more and this would lead to a further increase of the efficiency while reducing the final
moisture level at the same time. However, it is impractical to use more than two re-
heat stages mainly because of the additional costs and added complexity so that the
gain in efficiency cannot be justified.
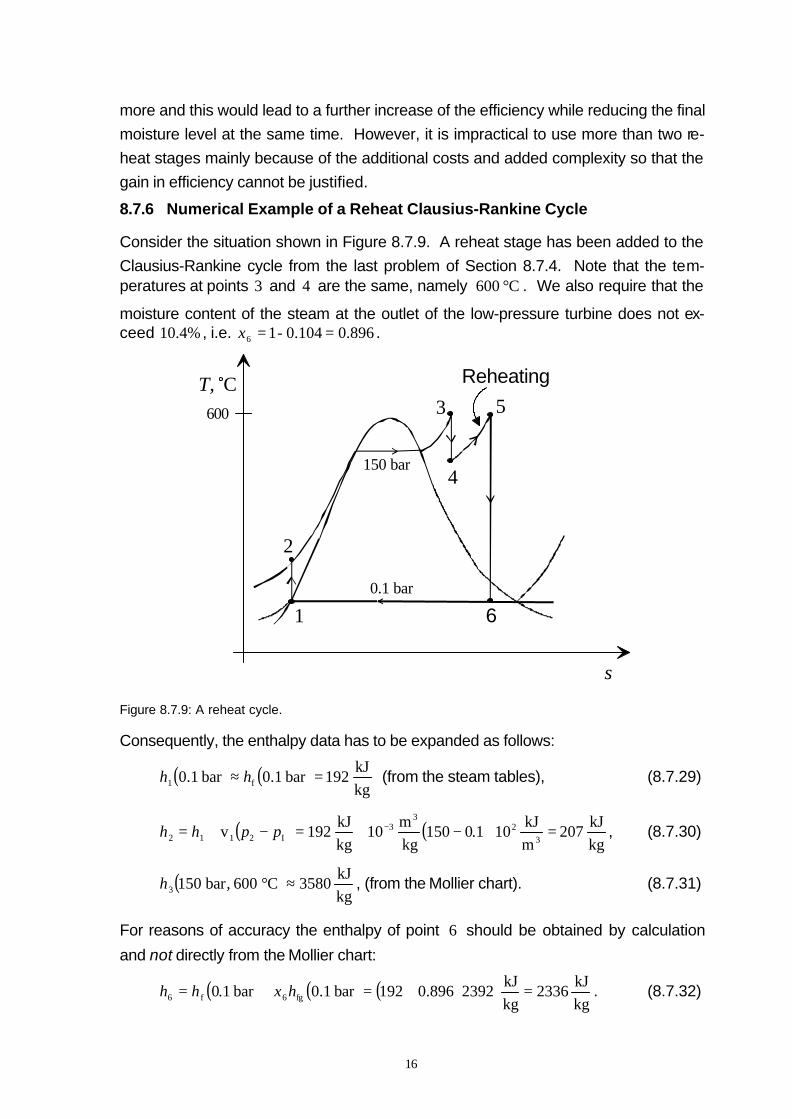
8.7.6 Numerical Example of a Reheat Clausius-Rankine Cycle
Consider the situation shown in Figure 8.7.9. A reheat stage has been added to the
Clausius-Rankine cycle from the last problem of Section 8.7.4. Note that the tem-peratures at points 3 and 4 are the same, namely C600 ° . We also require that the
moisture content of the steam at the outlet of the low-pressure turbine does not ex-ceed 10.4% , i.e. 0.8960.104-16 ==x .
3
4
1
2
s
5
6
ReheatingT, C
150 bar
0.1 bar
600
Figure 8.7.9: A reheat cycle.
Consequently, the enthalpy data has to be expanded as follows:
( ) ( )kgkJ
192bar1.0bar1.0 f1 =≈ hh (from the steam tables), (8.7.29)
( ) ( )kgkJ
207mkJ
101.0150kgm
10kgkJ
192v3
23
3I2112 =⋅−+=−+= −pphh , (8.7.30)
( )kgkJ
3580C600,bar1503 šh , (from the Mollier chart). (8.7.31)
For reasons of accuracy the enthalpy of point 6 should be obtained by calculation
and not directly from the Mollier chart:
( ) ( ) ( )kgkJ
2336kgkJ
2392896.0192bar1.0bar1.0 fg6f6 =⋅+=+= hxhh . (8.7.32)
17
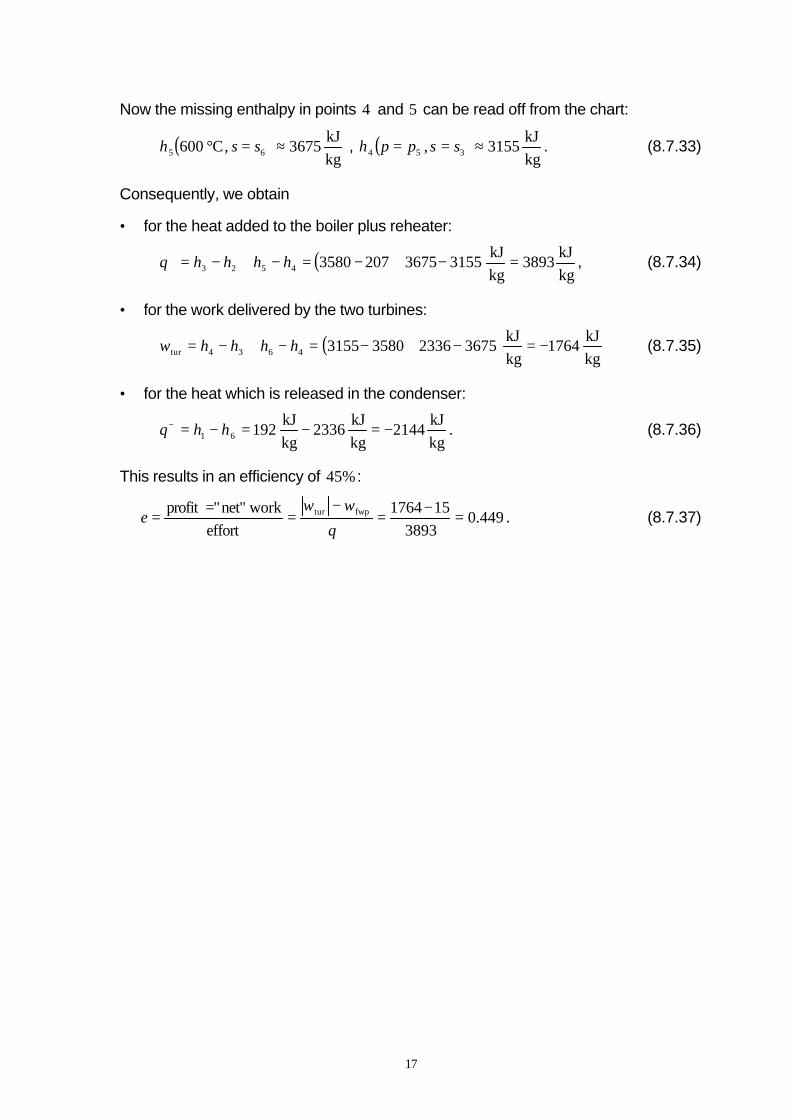
Now the missing enthalpy in points 4 and 5 can be read off from the chart:
( )kgkJ
3675 ,C600 65 ≈=° ssh , ( )kgkJ
3155 , 354 ≈== sspph . (8.7.33)
Consequently, we obtain
• for the heat added to the boiler plus reheater:
( )kgkJ
3893kgkJ
3155367520735804523 =−+−=−+−=+ hhhhq , (8.7.34)
• for the work delivered by the two turbines:
( )kgkJ
1764kgkJ
36752336358031554634tur −=−+−=−+−= hhhhw (8.7.35)
• for the heat which is released in the condenser:
kgkJ
2144kgkJ
2336kgkJ
19261 −=−=−=− hhq . (8.7.36)
This results in an efficiency of %45 :
449.03893
151764effort
work net""profit fwptur =−=−
===+q
wwe . (8.7.37)