08 final report
TRANSCRIPT

8/3/2019 08 Final Report
http://slidepdf.com/reader/full/08-final-report 1/81
Senior Design Final Report
Engineering 340
Team 8: Batteries Not Included
David Dickensheets
Knoa Knapper
David Qu
Matt Scholten
Advisor: J. Aubrey Sykes
May 12, 2006
© 2006, Calvin College and David Dickensheets, Knoa Knapper, David Qu, and Matthew Scholten

8/3/2019 08 Final Report
http://slidepdf.com/reader/full/08-final-report 2/81
Table of Contents
Executive Summary….……………………………………………………………………….ii
1. Introduction………………………………………………………………………………..1
2. Project Goal……………………………………………………………………………….2
3. Project Objectives…………………………………………………………………………3
4. Alternative Solution Designs……………………………………………………………...6
5. Feasibility Study…………………………………………………………………………..10
6. Preliminary Design………………………………………………………………………..12
7. Preliminary Business Plan...……………………………………………………………....13
8. Test Method………..……………………………………………………………………...20
9. Design Implementation…………………………………………………………………….23
10. Christian Perspective……………………………………………………………………..40
11. Costs……………………………………………………………………………………...41
References ………………………………………………………………………………........42
Appendices……………………………………………………………………………………43
i

8/3/2019 08 Final Report
http://slidepdf.com/reader/full/08-final-report 3/81
Executive Summary
Tire Pressure Monitoring Systems (TPMS) enhance automobile safety by keeping drivers
informed of their tire pressure. A problem with the pressure sensors is their reliance on battery-power;
batteries eventually wear out. The goal of Batteries Not Included is to design and build an alternative
energy source that provides reliable, longer-lasting power to the sensors. Magnetic induction is the
proposed solution to the problem of powering the sensors. This design essentially converts the kinetic
energy of the rotating wheels to electric energy by passing a coil through a magnetic field; relative motion
of a coil in relation to a magnet produces current in the coil which can power the pressure sensors.
Induction was used to generate power successfully; however, signal shielding issues must be resolved
before a robust system can be produced.
ii

8/3/2019 08 Final Report
http://slidepdf.com/reader/full/08-final-report 4/81
1. Introduction
Tire Pressure Monitoring Systems are becoming more and more popular on vehicles each year.
They are an important safety feature that helps to prevent accidents caused by blown tires. A TPMS
offers real-time monitoring of tire pressure so that the driver can be notified if a slow leak is present.
Figure 1 shows a typical TPMS [2]. Current systems use wireless sensors located inside the tires to send
pressure readings to a receiver; the reading is then displayed to the driver. A downside with these sensors
is their limited battery life and consequent necessary battery/sensor replacement work. Battery or sensor
replacement is either a hassle for the user to carry out or an expense that the user must pay in order to
further use the TPMS. The goal of this project is to develop an alternative energy source for pressure
sensors that will last longer than conventional batteries. Thus, the proposed power system should
significantly extend the working life of pressure sensors, perhaps to second and even third owners of
vehicles. The proposed design should also alleviate the burden of system maintenance by eliminating the
need for battery replacement.
Figure 1. A Typical Tire Pressure Monitoring System [2]
1

8/3/2019 08 Final Report
http://slidepdf.com/reader/full/08-final-report 5/81
2. Project Goal
The goal of this project is to eliminate the need for batteries on TPMS sensors. An alternative
energy source for pressure sensors that will last longer than conventional batteries is desired. Thus, the
proposed power system should significantly extend the working life of pressure sensors. The new design
should also alleviate the burden of system maintenance by eliminating the need for battery replacement.
Furthermore, the new power system cannot significantly increase the price of a TPMS.
The challenge in this project is to design a method to generate, use, and store enough electric
power to enable the tire pressure sensor to operate continuously. Once the power system has been created,
it needs to be attached to the rim inside the tire and field tested. Challenges also lie in the mechanical
setup of the power system as the proposed design should not interfere with any other existing vehicle
systems. The complete product could be used in a variety of tire applications in the commercial
automotive market. Figure 2 shows a typical setup of the tire pressure sensor [4].
The team’s Christian faith plays into the design consideration. Stewardship is a concept closely
associated with the project; a battery-free system conserves resources by eliminating batteries. The
design also shows care and concern for others. Prolonging the working life of tire pressure sensors
increases the safety of automobiles. Finally, the project is culturally appropriate as millions of Americans
drive automobiles with pressurized tires daily. The proposed technology could positively impact the
average driver.
Figure 2. A TPMS Sensor [4]
2

8/3/2019 08 Final Report
http://slidepdf.com/reader/full/08-final-report 6/81
3. Project Objectives
The objectives for this project are threefold. First, our main goal is to attain battery-free tire
pressure sensor operation. This will hopefully extend the working life of pressure sensors significantly.
Complementing the goal of battery-free sensor operation is the need for an innovative mounting solution
to hold the proposed power system. The mounting implementation must be both robust and easy to
replace. Finally, the power system along with its mounting apparatus must be priced competitively. A
tire pressure monitoring system incorporating the proposed power system must not be significantly more
expensive than current models. An explanation of design functionality and design requirements will more
fully articulate our project objectives.
3.1 Design Functionality
The proposed power system’s functionality must be specified. Sensors using the alternative
power system must run as they are intended to when using battery power. Mounting will have great
influence on the strength and rigidity of the system.
3.1.1 Increased Operating Life of Sensors
Regardless of the solution design chosen, the main purpose of the project is to increase the
operating life of a tire pressure monitoring system. The working lifetime of the sensors should be
extended by the realization of a new power generation system. An extended working lifetime of the tire
pressure monitoring system should allow both original and successive vehicle owners to benefit from this
safety feature.
3.1.2 Continuous Sensor Operation
The proposed design must implement continuous sensor operation; continuous operation includes
the initial start of the vehicle. A driver should be able to know his or her tire pressure before they leave
the house. Ideally, design solutions will use energy generated from the motion of the automobile (energy
that is normally wasted) to power tire pressure sensors. Regardless of the solution design chosen, the
system will require some type of external power storage which will allow the sensors to give an initialreading before the vehicle has moved.
3.1.3 Alternative Energy Operation
The final design must include an alternative energy source for sensor operation. The idea of a
rechargeable battery is in consideration, but this design would still require an external energy source for
3

8/3/2019 08 Final Report
http://slidepdf.com/reader/full/08-final-report 7/81
battery charging. The power source chosen will ideally use kinetic energy associated with a moving
vehicle to power the sensors, eliminating the need for a battery. The power source must be able to
operate the sensor continuously. Any option chosen to power the sensor must provide for an increase in
the system’s working lifetime.
3.1.4 Innovative Mounting Technique
The design must provide a strong, robust solution for mounting the new power system. In
addition, the power system must be easy to replace in the event that it is damaged. Furthermore, inherent
pitfalls seen in current sensor designs must be avoided. For example, current sensors mounted in the
valve stem are often broken when tires are being replaced. The valve stems are cracked to release
pressure from the tire, which in turn damages the sensors and requires them to be replaced. The new
design must include a mounting solution that allows tires to be serviced and replaced without damaging
the sensors.
3.1.5 Transmission Signal Considerations
Due to the fact that the sensors transmit wireless signals, they are regulated by the Federal
Communications Commission (FCC). Changes in sensor design can in no way affect the sensors’
compliance with FCC regulations. Signal integrity is also important for the functionality of the tire
pressure monitoring system. A power generation system creating any adverse effects on a sensor’s
transmission of data to the driver’s display inside the vehicle is not desirable.
3.2. Design Requirements
In addition to meeting the specified design functionality criteria, successful completion of this
project requires the implementation of certain requirements inherent to designing a battery-free tire
pressure sensor. Market factors such as pricing, consumer need, and vehicle system interference must be
considered. Federal laws must also be considered and obeyed.
3.2.1 Competitive Industry Pricing
Mass-production of the proposed design must be economically feasible. The increased safety
benefits of a battery-free tire pressure sensor will only be realized in the market if the product can be
produced at a cost low enough to make it economically viable for production companies. The aspect of
price is extremely important to consumers and, in turn, automotive suppliers; this will be a large focus of
the design.
4

8/3/2019 08 Final Report
http://slidepdf.com/reader/full/08-final-report 8/81
3.2.2 Design Serviceability
Due to the fact that serviceability is a major issue with existing systems, this will be a large focus
of the design work. The final design must be robust, but it must also be easily replaceable if damaged.
The design must function in such a way that damage to the system components is not an issue during
vehicle services such as tire replacement.
3.2.3 Vehicle Systems Effects
The final design can in no way impede vehicle performance. Research must be done to insure
that introducing the new power generation design to the vehicle will not affect performance of anti-lock
braking systems (ABS), normal braking systems, wheel rotation, or other important vehicle operations.
Effects on the vehicle will be different for each design, so this will be a factor that helps narrow down the
design alternatives to a final option.
5

8/3/2019 08 Final Report
http://slidepdf.com/reader/full/08-final-report 9/81
4. Alternative Solution Designs
After several brainstorming sessions, the design team considered possible alternative solution
designs. The proposed solutions below represent the most reasonable ideas generated by brainstorming
sessions. All alternatives generate power for the tire pressure sensors by converting energy produced by
normal automobile operation to electric power. The following power generation ideas will be expounded
upon in this section: magnetic induction, piezoelectric power generation, thermal energy recovery, wind
power generation, and pressure-induced power generation.
4.1 Magnetic Induction
The kinetic energy of the rotating wheel can be converted to electrical energy. Electromagnetic
induction could be used for this energy conversion. If a magnetic field is moved in close proximity to a
coil, a current is induced in that coil. Motion of an automobile wheel could be used to induce a current
that could potentially power a pressure sensor.
The electrical aspect of this design is obvious; enough electric power must be generated in order
for a tire pressure sensor to function normally. The mechanical aspect of this solution is mounting the
power generation system. There is a significant challenge in the mounting of both the magnet and the coil.
Our initial solution would be to mount the magnet on top of the caliper, which is stationary in relation to
the spinning wheel. A coil would be mounted on the inside of the rim parallel with the magnet so that as
the wheel spins, the coil passes by the magnet and induces a current. Leads off the coil would pass
through the wall of the rim and connect to the sensor inside. (see Figure 3 below)
Figure 3. Magnetic Induction Design Solution
6

8/3/2019 08 Final Report
http://slidepdf.com/reader/full/08-final-report 10/81
4.2 Piezoelectric Application
Another option for the conversion of kinetic energy is the conversion of wheel vibration and
rotational energy to electricity. A piezoelectric device could be mounted in the suspension system or
wheel of the vehicle. Piezoelectric devices produce electric energy when they are mechanically stressed.
Using this technology, road vibration and wheel rotation could be used to power the pressure sensor.
For the piezoelectric option, the challenge in mounting would be to find a way to place the whole
sensor inside the tire and retain proper wheel balance. Due to the nature of the energy conversion, there
would be no need for wires to pass through the wall of the rim. Instead, the piezoelectric device would be
mounted inside the rim, presumably mounted opposite the sensor so that the wheel could be more easily
balanced. This power system would be able to take advantage of vibration of the wheel, the rotation of
the wheel, and/or the air pressure inside the tire to produce electric power. (see Figure 4 on the next page)
Figure 4. Piezoelectric Power Generation
4.3 Thermal Energy Recovery
Another option considered is that of converting heat energy associated with braking activity to
electric energy. Thermocouples are a proposed means of accomplishing this energy conversion. A
thermocouple is a pair of dissimilar metals joined together which produces a voltage when the two sides
of the metal junction are exposed to different temperatures. Brake pads and rotors are hot under normal
driving conditions. If one side of the thermocouple could be mounted inside or next to the brake pad, and
the other side of the thermocouple could be mounted in an ambient temperature environment, perhaps
enough electric energy could be produced to power the tire pressure sensor. An auxiliary system would
be desirable for use when the brakes are not hot.
The mounting for the thermocouple approach would require that a wire be run through the wall of
the rim. The idea behind this approach would be to mount the joint end of the thermocouple to the rotor
or brake pad. The thermocouple would be run down the rotor to a contact that would join to a similar
contact on the inside of the wheel. The thermocouple voltage signal will travel up a lead to a point below
7

8/3/2019 08 Final Report
http://slidepdf.com/reader/full/08-final-report 11/81
the sensor. A hole could be drilled through the rim, and the power signal of the thermocouple could be
applied to the sensor. (see Figure 5 below)
Figure 5. Thermal Energy Recovery Power System
4.4 Wind Power Conversion
Wind power generation was proposed as a solution to the problem. Brakes are often cooled by
directing air from the front fascia to the brakes via air ducts. “Wind” is created in the ducts by the relative
motion of the vehicle with respect to the air around it. A small turbine could be placed in a brake duct.
As the wind spins the turbine, the rotational energy of the turbine could be used to power a small electric
generator. This generator could potentially power a pressure sensor and charge an auxiliary power
storage element. Auxiliary power will be necessary as the turbine will not rotate when the automobile is
stopped.
Mounting the wind power system would be product specific. Applications would be limited to
vehicles with openings in the front fascia large enough to accommodate the fan-generator unit housed in
an air duct. Transmitting the power to a rotating object, such as an automobile wheel where the tire
pressure sensor resides, requires some application of motor brushes. This could be done via caliper –
rotor interaction. (see Figure 6 below)
8

8/3/2019 08 Final Report
http://slidepdf.com/reader/full/08-final-report 12/81
Figure 6. Wind Power Generation System
4.5 Pressure Induced Power
Another option was found in the Engineering Index research database: the abstract for a journalarticle mentioned a way to change a physical pressure signal directly to electric power. Not many of the
details on this option are known as the Hekman Library did not have the article; it had to be ordered
through inter-library loan. A guess is that this device could be a form of sensitive piezoelectric
technology. When pressure is exerted on the device, a proportional voltage is produced.
The mounting solution for this approach would largely depend on the size of the device itself. If
the device is very large, additional calculations would be needed to assess the forces caused by the
rotation of the wheel during normal use.
4.6 Extended Battery Life
Should the aforementioned solutions prove unfeasible, a method to drastically increase battery
life will be implemented. Power generation methods explained above could be used to charge a sensor’s
rechargeable battery.
9

8/3/2019 08 Final Report
http://slidepdf.com/reader/full/08-final-report 13/81
5. Feasibility Study
The alternative solutions presented above were researched in order to gage the viability of each.
Component cost and power generation capability were the most important factors in deciding whether or
not a design was feasible. Design complexity was another factor considered.
5.1 Magnetic Induction
Research into the feasibility of the power induction solution proved to be fruitful. Wire used for
the coil is assumed to be less than $10. Also, powerful magnets can be attained online for relatively low
cost. About 10in.2 of magnetic material can be bought for $15.30 [1] (see Appendix 1). Thus, it seems
that this option is economically feasible. The magnetic material has a rating of N40, which corresponds to
a magnetic field strength of 12,600 – 12,900 Gauss. Preliminary power generation calculations indicate
that this option does give adequate power generation. See Appendix 2.a for preliminary calculations and
magnet specifications.
5.2 Piezoelectric Application
Research into piezoelectric devices has shown that this option is not economically feasible.
Piezoelectric devices online range in price from $200 to $1000. This price is unacceptable for production
purposes because one of the reasons for this project is to make a tire pressure monitoring system and the
maintenance associated with it more economically accessible to the public. Furthermore, a $300 power
generation system is too expensive considering that the tire pressure monitoring system itself costs only
about $200. Consumers probably will not want to pay twice the price of a normal TPMS for a longer-
lasting one. Finally, a piezoelectric device is economically unacceptable for this project because just
about the entire allotted budget would have to be spent on a piezoelectric device. See Appendix 3 for
sample piezoelectric device pricing.
5.3 Thermal Energy Recovery
There are different types of thermocouples that could be used to implement the proposed thermal
energy recovery design. However, the type of thermocouple found to generate the most power onlyproduces about 75mV. This does not meet average voltage requirements for tire pressure sensors, which
is about 3V. See Appendix 4 for thermocouple specifications.
10

8/3/2019 08 Final Report
http://slidepdf.com/reader/full/08-final-report 14/81
5.4 Wind Power Conversion
Turbines small enough to fit inside of a brake duct could not be found online. The smallest
turbine found was the size of a small refrigerator. In addition to this setback, this option makes the power
system design more complicated than necessary. A turbine would turn a generator, which would produce
electricity. Essentially, this option transforms kinetic energy to electric energy using induction via a
magnet and coil. This is basically the same idea as the magnetic induction alternative; however, this
option is far more complicated. Furthermore, the connection between the generator and the sensor would
be complex since electric power from the stationary generator would need to be taken to the rotating
sensor. Research and thought has given rise to the conclusion that the wind power generation design only
adds potential problems and complexity.
5.5 Pressure Induced Power
This article has not yet been received. This alternative solution is currently suspended indefinitely.
11

8/3/2019 08 Final Report
http://slidepdf.com/reader/full/08-final-report 15/81
6. Preliminary Design
Based on comparison of the feasibility information compiled above, the magnetic induction
design is going to be pursued as the solution to the problem of battery-powered tire pressure sensors.
This option gives the best balance of performance, cost, and serviceability issues. The team also
consulted with Professor Platt at the Calvin Physics Department, and he confirmed that the induction
method is indeed feasible. The related power feasibility calculation is attached in Appendix 2.a.
Although Professor Platt thinks that this design is feasible, he also thinks that getting this design right will
require much testing. Correct placement of the magnet in relation to the coil will be essential for the
proper function of the final design. Therefore, various placements of the coil and magnet should be tested
extensively to ensure correct operation of the power system. Testing will be more extensively explained
in the next section. The magnetic induction design is shown below.
Figure 7. Magnetic Induction Design Solution
12

8/3/2019 08 Final Report
http://slidepdf.com/reader/full/08-final-report 16/81
7. Preliminary Business Plan
7.1 Industry Profile and Overview
7.1.1 Industry Analysis:
Industry background and overview: There is no industry background. Our product is the
first of its kind. The market right now is using battery powered sensors and has little research
into further power methods. This is our market niche.
7.1.2 Major customer groups:
These customers include tier one suppliers to automotive companies and aftermarket
manufacturers. Our unit will be universally applicable, and every supplier will have demand for
the product.
7.1.3 Regulatory restrictions, if any:
There are no restrictions on placing magnets within the wheel well of an automobile. We
have looked into the effect of our magnets on ABS sensors and have concluded that our product
produces no adverse affects in ABS sensor operation.
7.1.4 Significant trends:
There are no significant trends. However, we have discovered another battery-less tirepressure sensor which has a patent. We feel the market will support our product and nurture
future research and development.
7.1.5 Growth rate:
Growth would be exponential since we are the only supplier of an induction based tire
pressure sensor. Our manufacturing capabilities would have to be easily increasable due to
increased demand once our product gets to the market.
7.1.6 Barriers to entry:
Our first barrier to entry would be acceptance from the market share holders of current
battery powered tire pressure sensors. Once suppliers are convinced to adopt the induction
power generation system, the next barrier would be manufacturing costs. With our company
13

8/3/2019 08 Final Report
http://slidepdf.com/reader/full/08-final-report 17/81
consisting of only the four founding members, manufacturing an estimated 1 million power units
would be difficult.
7.1.7 Key success factors in the industry:
Building a simple and reliable power generation system that is applicable to a
wide variety of products is instrumental. Our sales force is also a key factor to success. As a
new company trying to break into the industry, we will be selling our product with low margins
in order to attract purchases. This in turn requires a large sales volume in order to turn a profit.
7.1.8 Outlook for the future:
There is a large market ahead due to the TREAD act of 2003 which requires all
automobiles manufactured after October 1, 2006 to be equipped with a TPMS.
7.2 Product Features
Environmental responsibility, energy efficiency, and reliability are some of the main
features of our product. Existing tire pressure sensors need to have battery to operate. Our
product features a battery-free mechanism to give solutions to the battery problem in the sensors
used in TPMS. Magnetic induction is used to provide the needed power. Utilizing the rotation
of the wheels, the design passes a coil through a magnetic field and thus converts kinetic energy
to electric energy. The generated electric energy is in turn used to power the TPMS sensor. Our
product is designed to function without interfering with other mechanical and electrical
components in the wheel, and it also functions in all environmental conditions.
7.3 Customer Benefits
Our solution to the tire pressure sensor is hassle free, and it is user-friendly. Existing tire
pressure sensors have to have the battery replacement every five to seven years. The work
involved with replacing the battery is normally done by mechanics, and the drivers will have lots
of hassle if they decide to replace the sensors on their own; inexperienced users might
accidentally damage the sensors. By making the sensor battery-independent, our product saves
the auto users from having to go through the hassle of battery replacement. The product
increases the lifetime of the TPMS by eliminating sensors’ dependency on battery-power; thus, it
offers continuous safety benefits to future users of the vehicle. Most importantly, by offering a
14

8/3/2019 08 Final Report
http://slidepdf.com/reader/full/08-final-report 18/81
reliable power source to the sensors, our product assures that the TPMS gives the drivers the
correct information of the tire pressure.
7.4 Uniqueness
Our product gets rid of tire pressure sensors’ reliance on batteries; it uses the available
kinetic energy to produce electric power. Therefore, we provide an energy-efficiency solution to
the current TPMS sensors. This unique feature also projects a long-term benefit on the
environment. The amount of batteries thrown into landfills would be reduced when our product
comes to the market.
7.5 Materials and Cost
The major raw materials for production are coils, magnets, capacitors, diodes, voltage
regulators and printed circuit boards. We estimated a cost of $5.21 per unit for materials
assuming the costs for raw materials are $0.38 per coil, $0.97 per magnet, $0.26 per system set
of capacitors, $0.01 per printed circuit board and $0.06 per diode, and $0.62 for voltage
regulators. The production would also involve labor which is needed to make the final assembly
of the product. Assuming each unit takes 15 minutes (0.25 hour) to assemble and labor costs
$40/hour (assuming production in U.S.), each unit will cost $10 per unit in labor.
7.6 Marketing Strategy
7.6.1 Target Market:
Existing tire pressure sensor systems use batteries, which need to be replaced. When
these batteries wear out, many system owners choose not to replace them; battery replacement is
expensive. Wheels must be taken off rotors, and tires must be removed from rims. Many people
think the added safety of a tire pressure monitoring system is not worth the hassle or extra money
associated with system replacement. A battery-free system would eliminate the need for
pressure sensor system owners to disassemble their wheels (and empty their wallets) every few
years.
Our company’s target market consists of automobile manufacturers and tire pressure
sensor manufacturers. We will focus our marketing strategy on these two groups. If we are able
to convince automobile manufacturers that our product is worth having on their vehicles, the
manufacturer can suggest that their sensor suppliers cooperate with us in integrating our power
15

8/3/2019 08 Final Report
http://slidepdf.com/reader/full/08-final-report 19/81
system with their tire pressure monitoring systems. We will also market to sensor manufacturers
in hopes that they will desire the increased durability that our power system provides. This boost
in sensor quality will hopefully give sensor manufacturers who integrate our system a market
advantage over traditional battery-operated sensor makers. Once TPMS manufacturers are sold
on our design, wheel makers will have to be brought into the integration process. If our power
system is mounted on the outside of the rim (for magnetic shielding purposes), electric leads will
need to be brought from the outside of the rim to the inside in order for power to reach the
sensors. This will require leads to go through the rim, and wheel makers will most likely be
responsible for making this happen. See Appendix 5 for a list of potential customers.
7.6.2 Customer’s Motivation to Buy:
The power system of a tire pressure monitoring system will be a relatively small factor in
a consumer’s decision to buy a new car. Thus, an automobile manufacturer may not see our
product as integral to a new vehicle’s selling success. Nonetheless, our system would be a small
selling point that increases the durability of a TPMS and in turn raises the standard of safety
associated new vehicles that incorporate the technology.
TPMS manufacturers have seemingly more motivation to buy our design. Our power
system would differentiate their sensor system from other battery-operated sensor systems on the
market. A battery-free power source could perhaps be the factor that prompts an automobile
maker to choose one TPMS over another.
7.6.3 Market Size and Trends:
The market for our product is uniquely poised to take off over the next few years.
Whereas four years ago, no new vehicle had to incorporate tire pressure monitoring systems, at
least 65% of new vehicles must be equipped with a TPMS by October 2006 due to government
mandate. Over the last twenty years, new car sales have consistently been between twelve and
seventeen million. If 2007 is a slow year for auto sales with roughly twelve million new vehicles
sold, a 65% TPMS mandate means that 7.8 million new cars must be equipped with a TPMS. As
far as we know, all sensor systems currently on the market use batteries. This indicates that a
huge new market that is relatively untapped exists for our sensor power system. See Appendix 6
for new vehicle selling statistics.
16

8/3/2019 08 Final Report
http://slidepdf.com/reader/full/08-final-report 20/81
7.6.4 Selling Efforts:
The company’s sales department will have two divisions. One division will focus on
selling to automobiles manufacturers, and the other division will focus on selling to TPMS
manufacturers. Each division will consist of one salesman, and these two salesmen must be in
constant communication. When one division makes a sale, that sale will most likely affect the
complementary division. For example, if the automotive division sells 10,000 units to Ford,
Ford’s TPMS supplier will need to integrate our product into their design. Our company’s
TPMS division representative should be aware of this, and he should get in contact with Ford’s
supplier to make the proper arrangements.
An average sale should be about 10000 units. Salesmen must maintain good working
relationships with existing customers as well as expand the company’s customer base
consistently. Ideally, 2-5% sales growth per year for the first five years of the company’s
existence would be desirable. In order to attract salesmen with at least five years of experience,
we will compensate them with $60K per year.
7.6.5 Advertising and Promotion:
Our product will not be marketed to the general public. Our marketing strategy focuses
on automobile and TPMS manufacturers. A website describing our product will be constructed;
interested OEM personnel will be able to access our product information at their leisure online.
However, the bulk of our advertising will be done by our salesmen in their dealings with
manufacturers. Phone calls, meetings, presentations, and literature will be prepared by our sales
department in order to inform our potential customers. Thus, our media costs are inherently
covered in our salesmen’s salaries. Overhead such as salesmen’s computers and literature to
distribute to customers will be accounted for in our financial forecasts.
7.6.6 Pricing:
Our cost structure takes both fixed and variable costs into account. Our fixed costs
include rent for our building, utilities, and employee salaries. Variable costs include our cost of
good sold (direct material and direct labor). Direct Material and Labor were mentioned earlier;
this information is also noted in Appendix 7. Fixed costs are estimated in Appendix 19.
We need our product to be cheap enough that manufacturers will be willing to implement
it with their sensors. However, we want our product to be known for quality. A functional,
17
8/3/2019 08 Final Report
http://slidepdf.com/reader/full/08-final-report 21/81
robust design is desirable. Our power system will most likely make a competitively priced
sensor system more expensive to manufacture. Our hope is that the added quality associated
with our power system will outweigh any excess integration costs. Obviously, our company
must make a profit. The price of our system will be determined with break-even analysis. Our
gross profit margin (sales – cost of goods sold) is shown in Appendix 19.
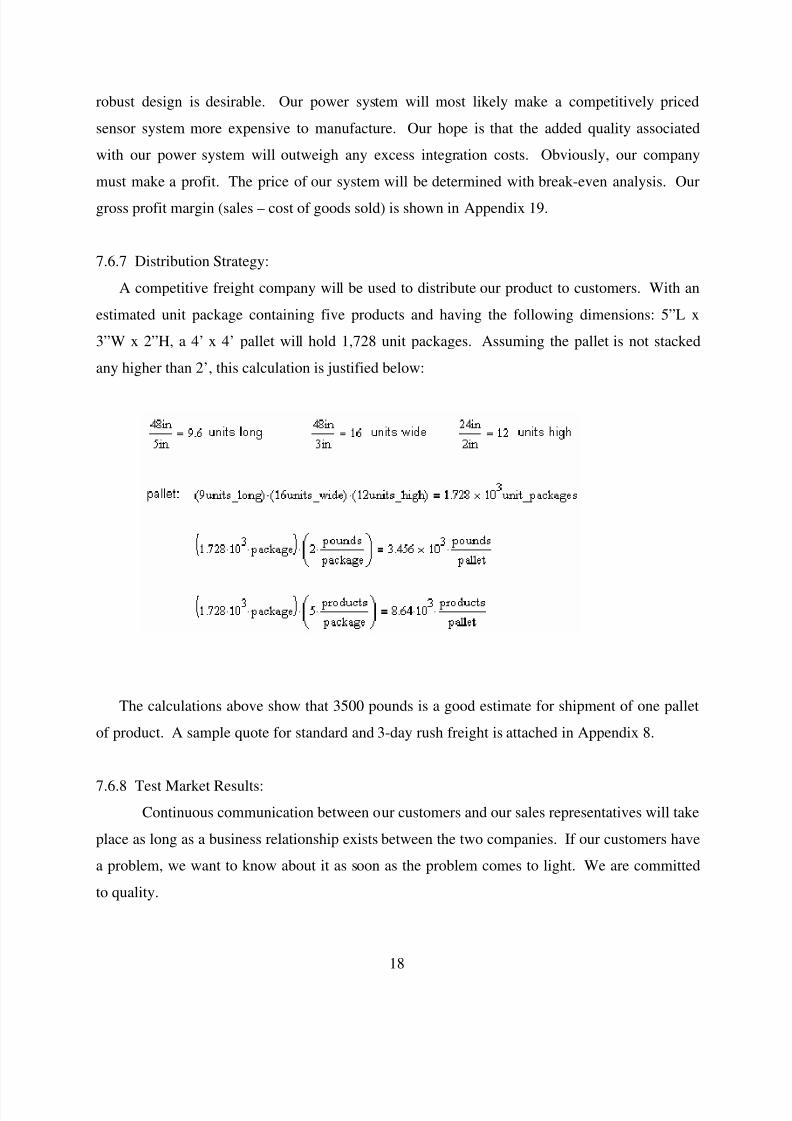
7.6.7 Distribution Strategy:
A competitive freight company will be used to distribute our product to customers. With an
estimated unit package containing five products and having the following dimensions: 5”L x
3”W x 2”H, a 4’ x 4’ pallet will hold 1,728 unit packages. Assuming the pallet is not stacked
any higher than 2’, this calculation is justified below:
The calculations above show that 3500 pounds is a good estimate for shipment of one pallet
of product. A sample quote for standard and 3-day rush freight is attached in Appendix 8.
7.6.8 Test Market Results:
Continuous communication between our customers and our sales representatives will take
place as long as a business relationship exists between the two companies. If our customers have
a problem, we want to know about it as soon as the problem comes to light. We are committed
to quality.
18

8/3/2019 08 Final Report
http://slidepdf.com/reader/full/08-final-report 22/81
7.7 Location and Labor
The location of our company would be in Michigan. In this way it would be easier to
make communications with some of the major auto manufacturers such as Ford and GM.
Having the company located in Michigan would also help us coordinate with these auto
manufactures and obtain customer feedback. The location of the company would be adjusted
accordingly based on the needs of the customers and contracts made with different auto
manufacturers. The wage for labor is estimated at $30/hour. If the production is of considerable
size, outsourcing might be considered to reduce the labor cost.
7.8 Competitor Analysis
7.8.1 Existing Competitors:
We have found one other product in the battery-less sensor market but have yet to find
any information about them trying to market this product. They could possibly become a
competitor, but we believe our product is further along in development than their RF signal
sensor.
7.8.2 Strengths:
Our ingenious design is efficient and compact. It also uses a minimal number of
components which decreases total cost. Our manufacturing is also easily outsourced to foreign
regions where labor is inexpensive. However, it could also be easily transformed into an
automated process and done here in MI close to the prospective market.
7.8.3 Impact on the business if competitors enter:
Since our product would be first to market, we would have contracts and a customer base
before other businesses would enter. It would be very difficult for another company to enter the
market and compete with us.
19

8/3/2019 08 Final Report
http://slidepdf.com/reader/full/08-final-report 23/81
8. Test Method
The nature of our project mandates that a large part of the design process be dedicated to testing.
As noted previously, Professor Platt believes that extensive testing will be necessary in order to determine
proper placement of the magnet in relation to the coil.
Variation in the application for tire pressure monitoring systems is quite significant. Systems
could be applied to a wide range of vehicles with tires including the following: semi-trucks, light trucks,
cars, motorcycles, trailers etc. This range of applicable vehicles has a wide variety of wheel sizes and
brake setups.
Figure 8. Test Apparatus
8.1 Test Apparatus Construction
The test apparatus allows variation of the position of the coil by using an adjustable platform
shown in Figure 9 below. The coil is attached to the adjustable platform, and two sets of magnets are
affixed to the inside of a rim.
20

8/3/2019 08 Final Report
http://slidepdf.com/reader/full/08-final-report 24/81
Figure 9. Adjustable Test Platform
A motor is an integral part of the test apparatus. Due to the wide variety of vehicle applications,
it is necessary to test the magnetic induction design at various wheel speeds. The motor obtained for
testing is a 1/8 horsepower electric motor with variable speed. The variable speed motor runs over a
range from 0 to 1750 rotations per minute (RPM). For a 25.6 inch diameter tire, this variable motor speed
is analogous to vehicle speeds of 0 to 135 miles per hour. A plot of the conversion from RPMs to MPH is
shown below. Complete motor specifications can be found at the end of this section.
0 10 20 30 40 50
0
200
400
600
800
1000
1200
1400
1600
speed [m/sec]
R P M
[ 1 / m i n ]
Figure 10. Speed vs. RPM Relationship
The final part of the test apparatus is the wheel attachment. Three rims were procured for testing
purposes. A hub was built and attached directly to the motor using a long shaft, a coupling joint, and two
21

8/3/2019 08 Final Report
http://slidepdf.com/reader/full/08-final-report 25/81
support bearings. The coupling was secured to the shaft using woodruff keys and set screws. The hub
was welded to the end of the steel shaft.
8.2 Test Procedure
A large number of variables mandated an accurate and easily repeatable testing procedure. A list
of test parameters was compiled. These parameters were broken down into two main categories: coil
parameters and magnetic parameters.
There are four major coil parameters. First, the coil diameter was varied. Coil diameter refers to
the diameter of the windings of the coil. The second parameter was to vary the number of turns in the coil.
Again, more turns in the coil correlates to more magnetic flux and consequently more current. The
relationship between magnetic field strength and the number of turns in the coil is shown in Appendix 2.b.
A consideration was also made for wire thickness. It is unsure as to how wire thickness affects the
current generated in the coil. However, thickness of the wire has a direct influence on the overall size of
the coil. Another consideration concerning the coil is what type of protective coating to use. There are a
variety of options including the use of a coated wire, a corrosion resistant wire, or an epoxy resin potted
coil. It is unsure as to how differences in wire coating will affect the induction of the coil; however, these
alternatives were tested. Finally, one of the largest difficulties concerning the coil was the connection
between the coil and the sensor. Different connection methods were tested for their strength, durability,
and functionality.
Magnet parameters were also varied during testing. The distance between the magnet and coil
was an obvious testing point. The use of multiple magnets to increase field strength is something that has
been considered, but Calvin College Physics professors have stated that magnetic fields do not combine
proportionally. This adds another dimension of complexity to the testing as multiple magnets do not give
predictable fields.
Finally, all previously mentioned test parameters will be examined using a reasonable
motor speed range. Variable speed motor specifications for the test apparatus are shown below.
Model Power Voltage Current Misc.
Century Motors
DN EMI 9-208222-01 DC Motor 1/8 Hp 115 Volt 1.12 Amp
1750 RPM
Max
Boston Gear R12 DC Control Box 1/8 Hp 115 Volt 20 Amp Max
22

8/3/2019 08 Final Report
http://slidepdf.com/reader/full/08-final-report 26/81
9. Design Implementation
When test apparatus construction was complete, the team began testing different magnet and coil
configurations to produce electric power. Once the proper voltage level was produced by the magnet and
coil, power regulation was necessary for proper sensor function. A power regulation circuit was designed
and implemented. Fine coil adjustments were then made to ensure proper power would reach the sensor
at the predetermined speed of 15 mph.
9.1 Magnet/Coil Configuration
The strength of the magnetic field and the cross-sectional area of the coil are the key factors that
determine the performance of the power system. The plate magnets are magnetized through the thickness;
therefore, the magnetic field lines pass through the thickness of the magnets as shown below:
Figure 11. Magnetic Field Lines of Magnets Used
In the early stages of the testing, it was assumed that more magnets would give a stronger
magnetic field. In general, this is true; however, the field critically depends on how the magnets are
positioned in relation to each other. The power generated by a magnet and coil is proportional to the
change in magnetic flux over the area of the coil. The first test utilized two magnets which were
positioned side by side. The coil was fixed at a stationary platform, and the magnets were passed by the
coil as illustrated below:
Figure 12. Magnet Orientation - Two Magnets
23
8/3/2019 08 Final Report
http://slidepdf.com/reader/full/08-final-report 27/81
The test revealed that the voltage generated by the magnet configuration above was in fact
smaller than the voltage generated by only one magnet. This went against the team’s expectation. It was
assumed that more magnets would increase the magnetic field strength, which in turn would increase the
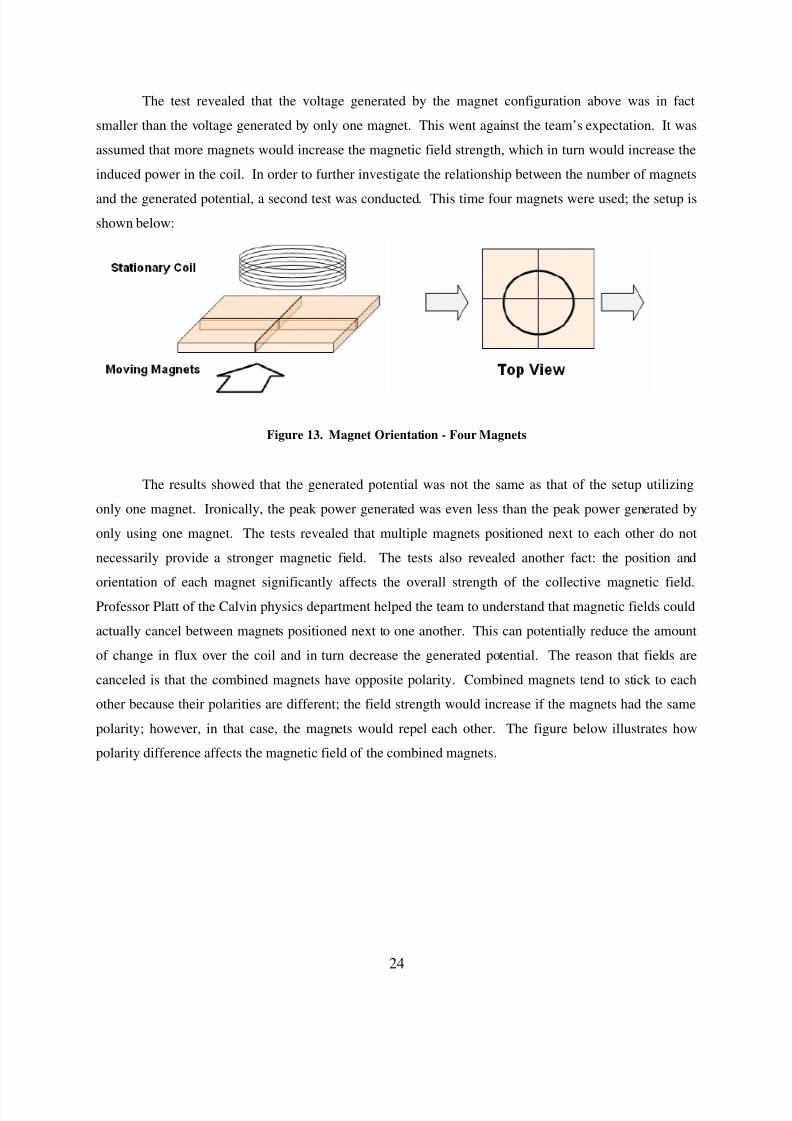
induced power in the coil. In order to further investigate the relationship between the number of magnets
and the generated potential, a second test was conducted. This time four magnets were used; the setup is
shown below:
Figure 13. Magnet Orientation - Four Magnets
The results showed that the generated potential was not the same as that of the setup utilizing
only one magnet. Ironically, the peak power generated was even less than the peak power generated by
only using one magnet. The tests revealed that multiple magnets positioned next to each other do not
necessarily provide a stronger magnetic field. The tests also revealed another fact: the position and
orientation of each magnet significantly affects the overall strength of the collective magnetic field.Professor Platt of the Calvin physics department helped the team to understand that magnetic fields could
actually cancel between magnets positioned next to one another. This can potentially reduce the amount
of change in flux over the coil and in turn decrease the generated potential. The reason that fields are
canceled is that the combined magnets have opposite polarity. Combined magnets tend to stick to each
other because their polarities are different; the field strength would increase if the magnets had the same
polarity; however, in that case, the magnets would repel each other. The figure below illustrates how
polarity difference affects the magnetic field of the combined magnets.
24

8/3/2019 08 Final Report
http://slidepdf.com/reader/full/08-final-report 28/81
Figure 14. Magnetic Field Cancellation
Figure 15. Magnetic Field Cancellation - Top View
This explains how the field strength is actually reduced. The new magnetic field gets weaker in themiddle of the magnet configuration due to the cancellation of the fields at the boundary area. This
significantly affects the generated potential because the coil passes right by the shaded region shown
above, which is where the fields get canceled.
25

8/3/2019 08 Final Report
http://slidepdf.com/reader/full/08-final-report 29/81
The final setup utilized only one magnet. The coil passes right by the surface of the magnet
where the field lines cut through it. A single magnet ensures that there is no cancellation of magnetic
fields. The setup is shown below:
Figure 16. Magnet Orientation - One Magnet
The size of the coil also affects the generated potential. Determining the optimal cross-sectional
area of the coil is key to optimizing the overall performance of the power generation system. The
generated potential in the coil is proportional to both the area of the coil and the change in flux over the
area of the coil. The equation below describes the aforementioned relationship:
emf N A⋅
dB
dt⋅
where emf is the electromotive force (voltage), N is the number of turns of the coil, A is the cross-
sectional area of the coil, B is the magnetic field density, and t is time.
Different sizes of coils were tested, and it became apparent that in order to maintain the
maximum rate of change of the magnetic field, the area of the coil should be kept very close to the surface
area of the magnet. A cross-sectional coil area larger or smaller than the area of the magnet would reduce
the rate of change in magnetic flux over the coil and in turn reduce the generated potential. The figure
below demonstrates this idea.
26

8/3/2019 08 Final Report
http://slidepdf.com/reader/full/08-final-report 30/81
Figure 17. Inadequate Flux Change Due to Large Coil Size (Left) and Small Coil Size (Right)
As shown above, if the coil is either larger or smaller than the magnet’s area, there is a period of
time when the coil does not “cut” the magnetic field lines. The flux does not change during this period of
time; thus, no electric potential is generated. For the best result, the coil area was matched to the magnet
surface area as closely as possible. The figure below illustrates the sequence of coil passing by the
magnet. The coil and magnet have comparable cross-sectional areas; this causes magnetic flux to
continually change as the coil passes by the magnet.
27

8/3/2019 08 Final Report
http://slidepdf.com/reader/full/08-final-report 31/81
Figure 18. Optimal Coil Size for Flux Change
28

8/3/2019 08 Final Report
http://slidepdf.com/reader/full/08-final-report 32/81
9.1 Coil Design
During preliminary feasibility studies, a graph of coil size vs. magnet strength was made that
correlated to the required 3 volts necessary to operate the sensors. The graph, located in Appendix 2.b,
shows the need for more coil turns when using weaker magnets. Using small plate magnets, (PN: Q125F
from www.amazingmagnets.com) the final coil contains 1000 turns of wire. Coils constructed for testing
were wound on an aluminum rod with 0.5 inch diameter. Final coil construction can be done using
existing methods for mass coil production. After testing and prototype building was completed, it was
discovered that using a ferromagnetic substance as a coil core would enhance the coils performance. The
placement of a steel core in the coil has the effect of focusing the magnetic field creating a denser
magnetic field gradient. This in turn would produce more flux and thus more induced EMF. A 1000 turn
coil would theoretically produce more voltage with a ferromagnetic core than it currently does without.
Using a steel core in the coil would lower the operating speed of the system due to the increased voltage
production. An alternate option to using the steel core is reducing the amount of turns in the coil; this
would maintain the current operating speed of the system but reduce the amount of material needed to
produce the coil. Since this discovery was made after testing had concluded, these findings have not been
quantified. They are listed here for future use and/or testing.
9.2 Coil Placement and Potting
The final placement of the coil is dependent on the type of wheel the system is being used on. Steel
wheels shield magnetic fields; the coil would need to be mounted on the inside of the wheel for these
applications. Mounting the coil on the inside of the wheel allows for a closer proximity to the magnets
which benefits voltage production. The leads from the coil could either pass through a hole drilled in the
wheel and seal with a pressure fitting or be run around the outside of the rim underneath the tire bead.
Aluminum wheels provide two modes of mounting. The coil could be mounted on the inside of the wheel
as is the case with steel wheels, or the coil could be mounted next to the sensor within the tire. Placing the
coil within the tire leads to the option of creating one self contained sensor box instead of having the coil
be a separate entity from the sensor. The coil is also protected from the wheel well environment which
would affect the style of potting used. During prototype testing, the coil was potted with epoxy and
secured to the inside of the rim using high temperature RTV compound. The coil leads were run over the
surface of the wheel underneath the tire and to the sensor. RTV compound was again used to secure the
wire leads on the wheel from the coil to the sensor.
29

8/3/2019 08 Final Report
http://slidepdf.com/reader/full/08-final-report 33/81
9.3 Coil Testing
In order to fully understand the functionality of the procured TPMS, a pressure tube was constructed
which enabled quick access to a pressurized environment without the need to mount and dismount tires
frequently. Once functionality of the TPMS system was understood, the battery from a sensor was
removed and wires were soldered to the battery terminals. The wires passed through the end cap of the
pressure tube where they were connected to a proto-board. Using the pressure tube to vary pressure, the
sensor functionality was tested with varying circuit components. Once a final circuit was built, the entire
sensor/circuit assembly was placed in the pressure tube to test effectiveness.
The initial goal when designing coils was to produce 3 volts with the given magnet strength. As
understanding of magnetism increased magnet configuration, coil size and shape were revised. Initial
coils where very large and long made from heavy gauge wire. After research, coils were then made with
large diameters and very thin wire. Further research led to coils roughly the size of the magnet, or
approximately 0.75 inch in diameter. Testing with these smaller coils and revised magnet arrangement
produced the required 3 volts of energy. Power was produced at a very high speed so it was necessary to
further refine the coil size. Initial small coils were produced with 500 turns of wire. Increasing the number
of turns to 800 effectively lowered the speed required to produce 3 volts from 40 to 20 mph. After a
discussion on safety, it was decided that the system should operate at 15 mph instead of 20. 15 mph was
chosen to correlate with most automatic locks that self lock at 15 mph. Coil size was increased to 1000
turns to accomplish this.
9.4 Power Regulation
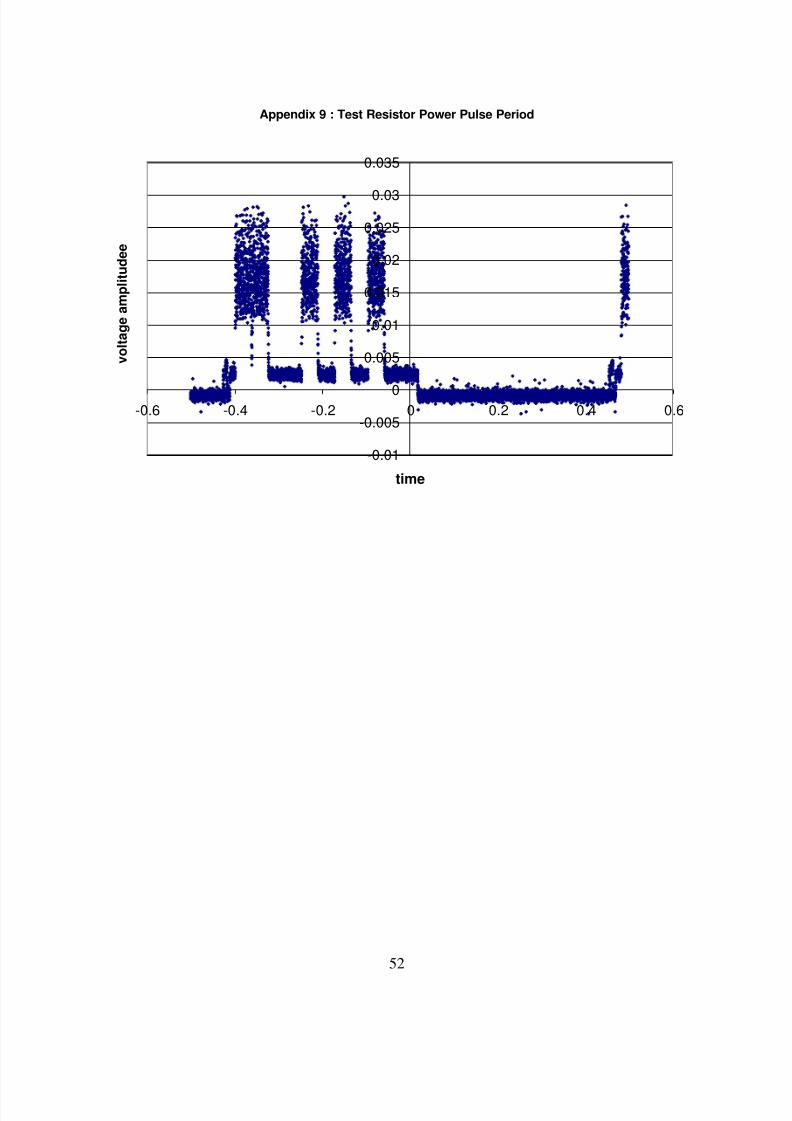
Raw power was taken from the coil in pulses. Power was generated at the coil leads every time a
magnet was driven past the coil. The nature of the power generation system produced a voltage
waveform that looks similar to an electrocardiogram. A sample voltage waveform from the team’s test
apparatus is shown below:
30
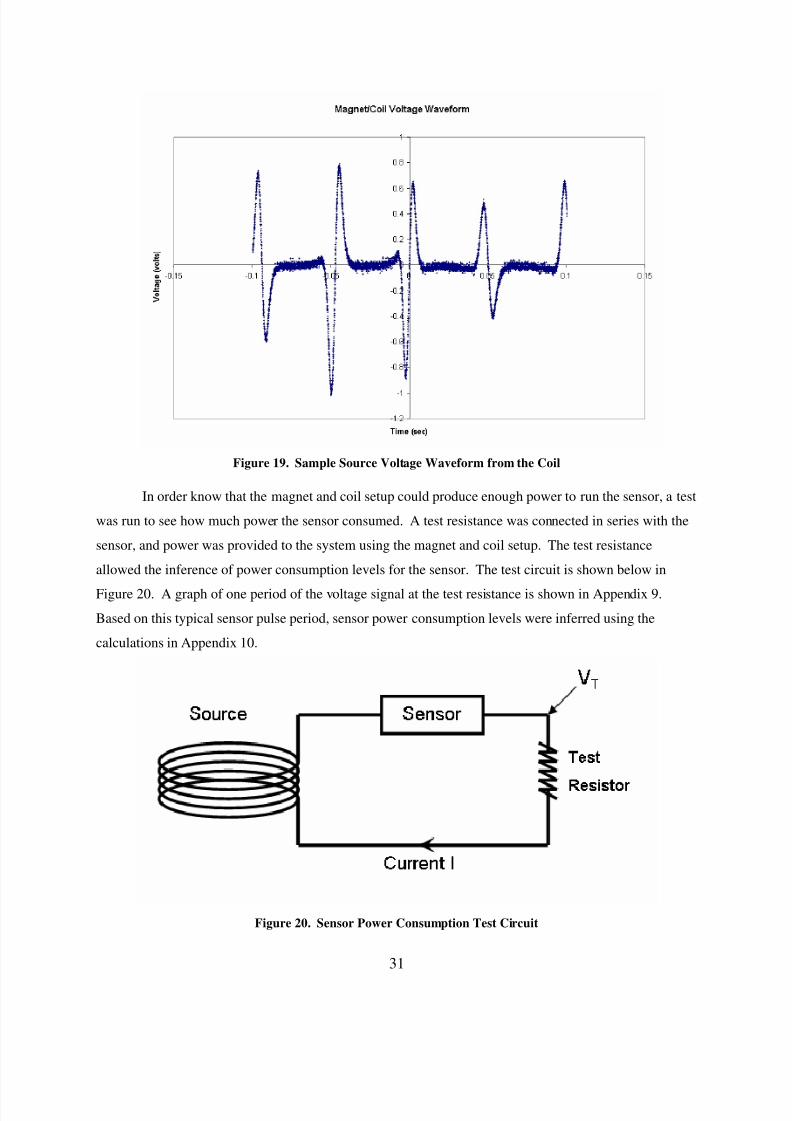
8/3/2019 08 Final Report
http://slidepdf.com/reader/full/08-final-report 34/81
Figure 19. Sample Source Voltage Waveform from the Coil
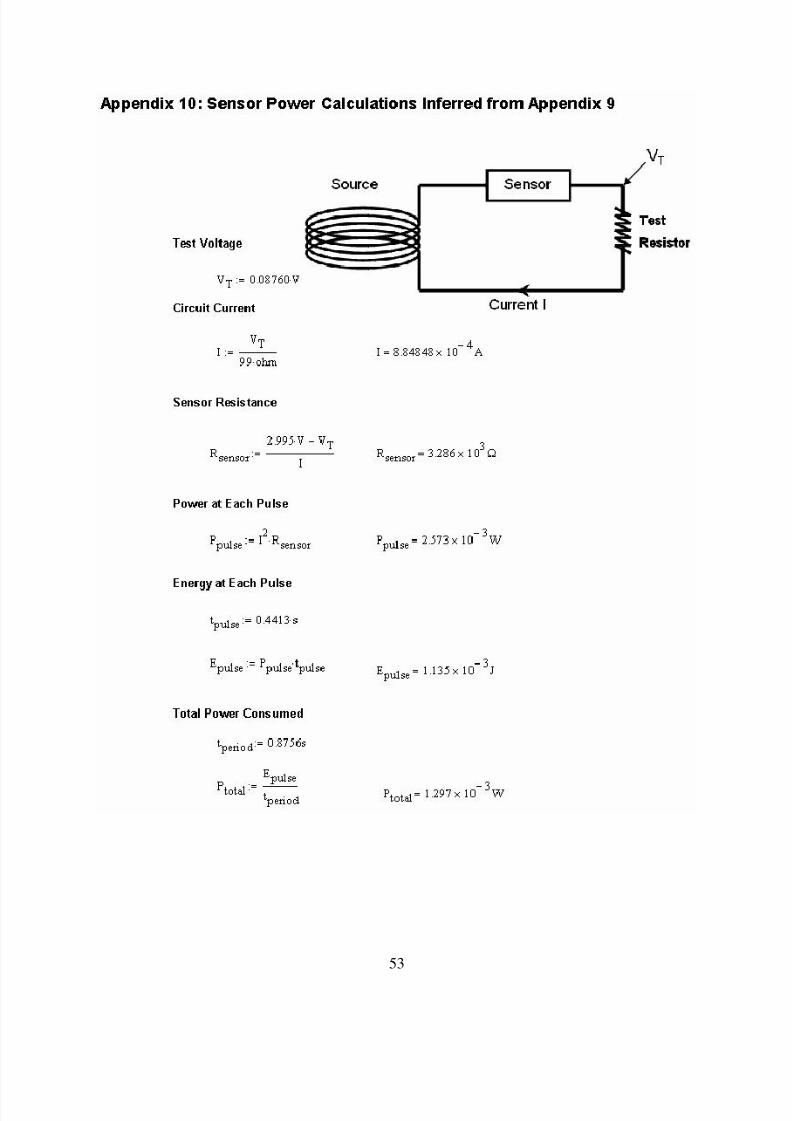
In order know that the magnet and coil setup could produce enough power to run the sensor, a test
was run to see how much power the sensor consumed. A test resistance was connected in series with the
sensor, and power was provided to the system using the magnet and coil setup. The test resistance
allowed the inference of power consumption levels for the sensor. The test circuit is shown below in
Figure 20. A graph of one period of the voltage signal at the test resistance is shown in Appendix 9.
Based on this typical sensor pulse period, sensor power consumption levels were inferred using the
calculations in Appendix 10.
Figure 20. Sensor Power Consumption Test Circuit
31

8/3/2019 08 Final Report
http://slidepdf.com/reader/full/08-final-report 35/81
The calculations in Appendix 10 showed that the average power consumed by an operating sensor is
about 0.0013W. A raw power calculation showed that our test apparatus could provide 0.0045W at a
relatively low wheel speed (about 10mph). This information showed that the test apparatus was capable
of powering the sensor. Raw power calculation test numbers are shown in Appendix 11.
Once sufficient voltage was obtained from the test apparatus, it was necessary to implement
a power regulation circuit to harness the raw power from the coil. As stated above, power was taken from
the coil in pulses. Pulsing power would not allow for proper functionality of the sensors. The tire
pressure sensors used for the project required 3 volts DC to operate correctly. The team’s new challenge
was to turn the pulses from the coil into a DC power source for the sensors. Power regulation testing
commenced with the acquisition of a breadboard. A breadboard was used to implement different power
regulation circuits; it allowed the team to easily swap out circuit components for testing purposes.
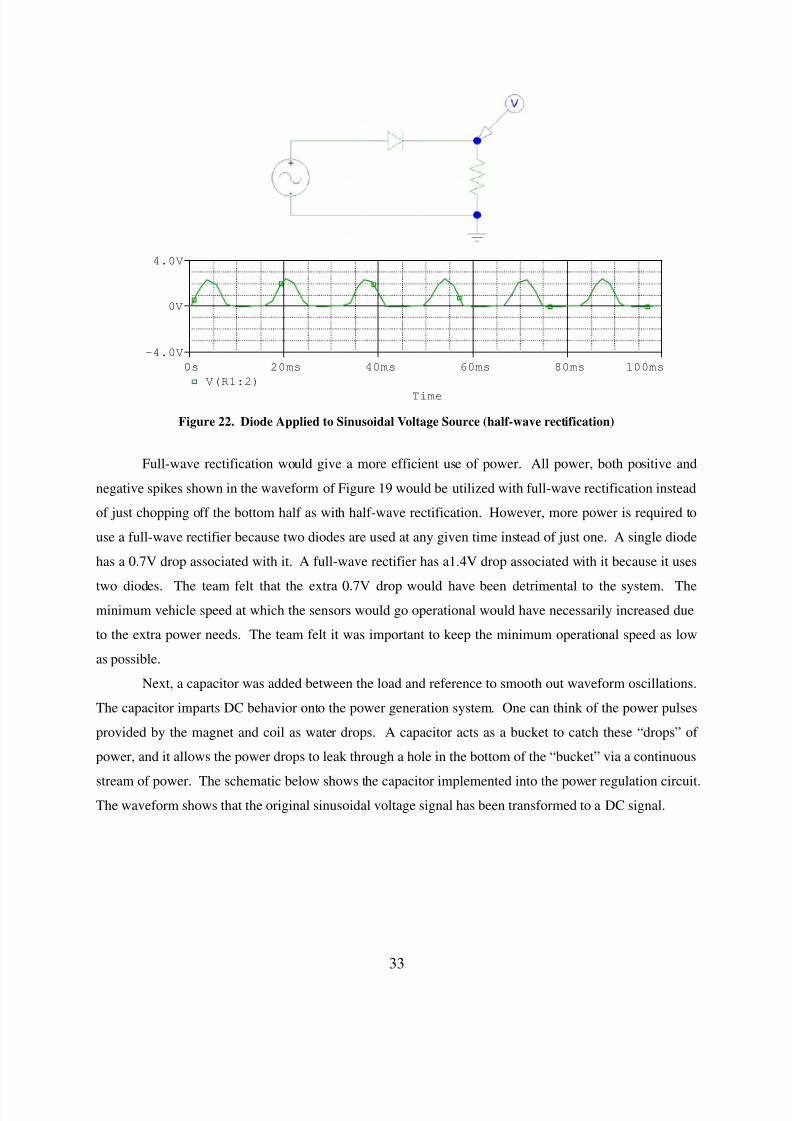
First, a diode was added to one side of the coil for half-wave rectification of the waveform. This
diode effectively nullifies the bottom half of the waveform generated by the magnet and coil. Instead of a
full wave oscillating about a reference point, half of the power wave is cut out of the picture. This
rectification of the waveform is necessary as current can only be allowed to flow one way through the
pressure sensor. The schematic below shows a 3V sinusoidal voltage source placed across a load. The
waveform across the load is not rectified.
Time
0s 20ms 40ms 60ms 80ms 100ms
V(R1:2)
-4.0V
0V
4.0V
Figure 21. Sinusoidal Voltage Source and Accompanying Waveform
The schematic below shows the same 3V sinusoidal voltage source; however, a diode is rectifying this
circuit. The waveform shows the half-wave rectification.
32
8/3/2019 08 Final Report
http://slidepdf.com/reader/full/08-final-report 36/81
Time
0s 20ms 40ms 60ms 80ms 100ms
V(R1:2)
-4.0V
0V
4.0V
Figure 22. Diode Applied to Sinusoidal Voltage Source (half-wave rectification)
Full-wave rectification would give a more efficient use of power. All power, both positive and
negative spikes shown in the waveform of Figure 19 would be utilized with full-wave rectification instead
of just chopping off the bottom half as with half-wave rectification. However, more power is required to
use a full-wave rectifier because two diodes are used at any given time instead of just one. A single diode
has a 0.7V drop associated with it. A full-wave rectifier has a1.4V drop associated with it because it uses
two diodes. The team felt that the extra 0.7V drop would have been detrimental to the system. Theminimum vehicle speed at which the sensors would go operational would have necessarily increased due
to the extra power needs. The team felt it was important to keep the minimum operational speed as low
as possible.
Next, a capacitor was added between the load and reference to smooth out waveform oscillations.
The capacitor imparts DC behavior onto the power generation system. One can think of the power pulses
provided by the magnet and coil as water drops. A capacitor acts as a bucket to catch these “drops” of
power, and it allows the power drops to leak through a hole in the bottom of the “bucket” via a continuous
stream of power. The schematic below shows the capacitor implemented into the power regulation circuit.The waveform shows that the original sinusoidal voltage signal has been transformed to a DC signal.
33

8/3/2019 08 Final Report
http://slidepdf.com/reader/full/08-final-report 37/81
Time
0s 20ms 40ms 60ms 80ms 100ms
V(R1:2)
0V
2.0V
4.0V
Figure 23. Filtering Capacitor Applied — Effective DC Voltage Obtained
Once DC power behavior was accomplished, the next problem the team faced was voltage
regulation. A higher wheel speed corresponds to a greater change in flux and a consequent greater
voltage at the coil leads. As stated above, the sensors used for the project required 3 volts DC. A voltage
above 3V was not desirable for fear that the sensor might be damaged. DC-DC voltage regulators were
used to ensure that the proper voltage level (3VDC) was applied to the sensors. The particular voltage
regulators used for this project (National Instruments LP2950) had a “sawtooth” waveform output
associated with them. Thus, a small filtering capacitor (2.2uF) was required to be across the voltage
regulator output and the reference voltage. Using a relatively large electrolytic capacitor (3300uF) in the
power regulation circuit for main power storage, the team successfully powered a tire pressure sensor
using a magnet and coil. The circuit as it is described above is shown in the figure below. Though this
regulation circuit gave limited success, the power regulation project was not complete.
Figure 24. 3V Regulation Protects Sensor
Proper sensor function using the proposed power system required that the wheel spin in order for
power to be generated. Once the wheel stopped spinning, power would cease to be generated, and the
34
8/3/2019 08 Final Report
http://slidepdf.com/reader/full/08-final-report 38/81
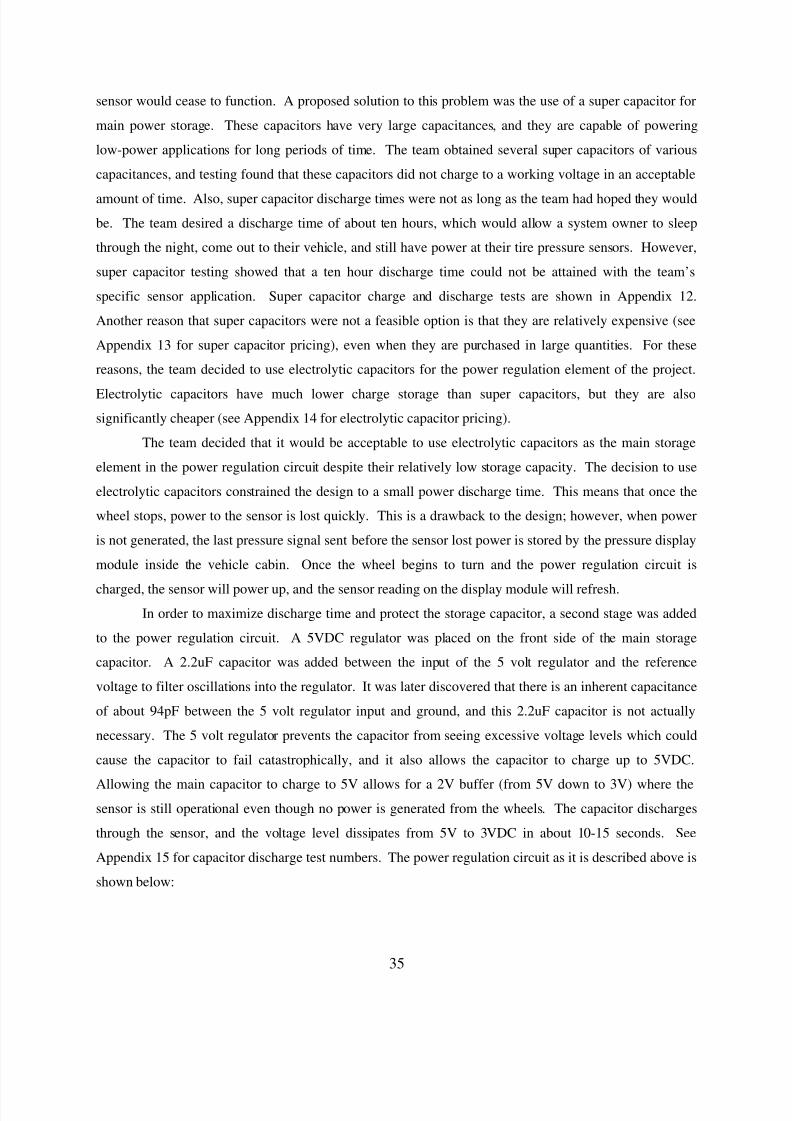
sensor would cease to function. A proposed solution to this problem was the use of a super capacitor for
main power storage. These capacitors have very large capacitances, and they are capable of powering
low-power applications for long periods of time. The team obtained several super capacitors of various
capacitances, and testing found that these capacitors did not charge to a working voltage in an acceptable
amount of time. Also, super capacitor discharge times were not as long as the team had hoped they would
be. The team desired a discharge time of about ten hours, which would allow a system owner to sleep
through the night, come out to their vehicle, and still have power at their tire pressure sensors. However,
super capacitor testing showed that a ten hour discharge time could not be attained with the team’s
specific sensor application. Super capacitor charge and discharge tests are shown in Appendix 12.
Another reason that super capacitors were not a feasible option is that they are relatively expensive (see
Appendix 13 for super capacitor pricing), even when they are purchased in large quantities. For these
reasons, the team decided to use electrolytic capacitors for the power regulation element of the project.
Electrolytic capacitors have much lower charge storage than super capacitors, but they are also
significantly cheaper (see Appendix 14 for electrolytic capacitor pricing).
The team decided that it would be acceptable to use electrolytic capacitors as the main storage
element in the power regulation circuit despite their relatively low storage capacity. The decision to use
electrolytic capacitors constrained the design to a small power discharge time. This means that once the
wheel stops, power to the sensor is lost quickly. This is a drawback to the design; however, when power
is not generated, the last pressure signal sent before the sensor lost power is stored by the pressure display
module inside the vehicle cabin. Once the wheel begins to turn and the power regulation circuit is
charged, the sensor will power up, and the sensor reading on the display module will refresh.
In order to maximize discharge time and protect the storage capacitor, a second stage was added
to the power regulation circuit. A 5VDC regulator was placed on the front side of the main storage
capacitor. A 2.2uF capacitor was added between the input of the 5 volt regulator and the reference
voltage to filter oscillations into the regulator. It was later discovered that there is an inherent capacitance
of about 94pF between the 5 volt regulator input and ground, and this 2.2uF capacitor is not actually
necessary. The 5 volt regulator prevents the capacitor from seeing excessive voltage levels which could
cause the capacitor to fail catastrophically, and it also allows the capacitor to charge up to 5VDC.
Allowing the main capacitor to charge to 5V allows for a 2V buffer (from 5V down to 3V) where the
sensor is still operational even though no power is generated from the wheels. The capacitor discharges
through the sensor, and the voltage level dissipates from 5V to 3VDC in about 10-15 seconds. See
Appendix 15 for capacitor discharge test numbers. The power regulation circuit as it is described above is
shown below:
35

8/3/2019 08 Final Report
http://slidepdf.com/reader/full/08-final-report 39/81
Figure 25. Final Circuit Layout
9.5 PCB Manufacturing
In order to make the electrical design compact so that the circuit can actually fit with the sensorand inside the sensor bracket, a small printed circuit board (PCB) was manufactured. The PCBlayout is shown below.
Figure 26. PCB Layout
9.6 Finite Element Analysis
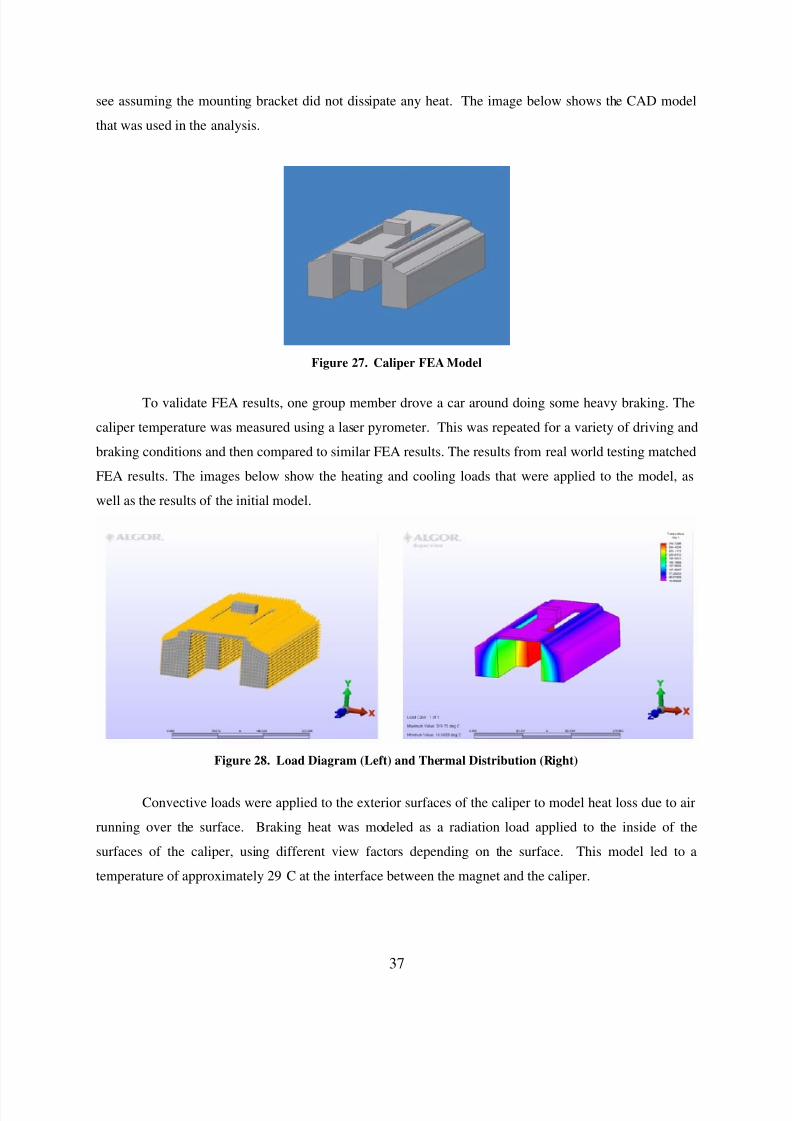
One obstacle encountered during the design process was sensor operating environment; more
specifically, the magnets mounted to the brake caliper. Due to friction during braking, the temperature of
the brake assembly can become very high. Final mounting consists of attaching magnets to the brake
caliper. This raised the question whether or not the magnets would lose magnetic field strength at the high
temperatures. A model was developed using a worst-case scenario having the magnet mounted directly to
the top of a caliper on a hot day. This test would produce a maximum temperature that the magnet would
36
8/3/2019 08 Final Report
http://slidepdf.com/reader/full/08-final-report 40/81
see assuming the mounting bracket did not dissipate any heat. The image below shows the CAD model
that was used in the analysis.
Figure 27. Caliper FEA Model
To validate FEA results, one group member drove a car around doing some heavy braking. The
caliper temperature was measured using a laser pyrometer. This was repeated for a variety of driving and
braking conditions and then compared to similar FEA results. The results from real world testing matched
FEA results. The images below show the heating and cooling loads that were applied to the model, as
well as the results of the initial model.
Figure 28. Load Diagram (Left) and Thermal Distribution (Right)
Convective loads were applied to the exterior surfaces of the caliper to model heat loss due to air
running over the surface. Braking heat was modeled as a radiation load applied to the inside of the
surfaces of the caliper, using different view factors depending on the surface. This model led to a
temperature of approximately 29˚C at the interface between the magnet and the caliper.
37

8/3/2019 08 Final Report
http://slidepdf.com/reader/full/08-final-report 41/81
Once the model was verified, other simulations were run with higher and lower ambient air
temperatures. The extreme low test assumed –20˚C air and the extreme high test assumed 40˚C air. The
images below show the results and temperature distributions for each model.
Figure 29. -20C Temperature Results (Left) and 40C Temperature Results (Right)
Though there was a similar temperature distribution in the setups, the interface temperatures
varied by over 60˚C. For the cold model, the interface temperature was approximately 2˚C. For the hot
model, the interface temperature was approximately 65˚C. The magnets that were purchased have a max
temperature rating of 80˚C before their magnetism begins to fade. From the finite element analysis it was
shown that the proposed mounting solution does not degrade magnet performance due to temperature.
9.7 Mounting
One of the mechanical challenges of this project was mounting the magnets. The design called
for the magnets to be mounted inside the wheel well. The wheel well of a car is a very harsh environment
that experiences many types of mechanical and thermal stresses. It also has very limited space. The
magnet mounting design had to be robust to handle environmental stresses and compact so that it could fit
inside the wheel well. The team produced two ideas for mounting magnets inside the wheel well. One
mounting option adapts a magnet mounting bracket to a brake caliper as an aftermarket addition. The
bracket would be secured to the caliper using the existing caliper mounting holes; it holds a threaded boss
that allows fine magnet height adjustments for different vehicles. Since the power in the coil heavily
depends on the proximity of the magnet to the coil, it is important that the magnet height be adjustable for
vehicle portability. The figure below shows a prototype drawing of the aftermarket bracket design.
38

8/3/2019 08 Final Report
http://slidepdf.com/reader/full/08-final-report 42/81
Figure 30. Aftermarket Magnet Bracket
The other design idea would be implemented during brake manufacturing. The production design
would implement a threaded boss either welded or cast right onto the caliper. This would be a simple yet
robust design that would still allow for the use of an adjustable rod to set magnet height. The magnets are
mounted on a long platform contoured to the curvature of the wheel. The platform allows two sets of
magnets to be mounted on each caliper while keeping enough distance between the magnets to keep the
fields from interfering with each other. The image below shows a picture of a production model.
Figure 31. Production Bracket Assembly
39

8/3/2019 08 Final Report
http://slidepdf.com/reader/full/08-final-report 43/81
10. Christian Perspective
A moral perspective is important in any undertaking in life, including technological design.
Christian engineers in particular have an obligation to consider the ethical implications of their ideas and
products. The design norms presented in lecture give a guide to conscious decision-making with respect
to engineering design. Several design norms are apparent in the implementation of this particular project:
stewardship, caring, and cultural appropriateness.
First, stewardship could be defined as properly managing the resources one is given. Design of a
battery-free device displays this idea of stewardship through consciously trying to conserve natural
resources. By designing an alternative power generation system for tire pressure sensors, the need for
batteries will hopefully be eliminated, thereby reducing the amount of waste to landfills. Secondly, the
project saves energy. The magnetic induction design essentially transforms energy from one form to
another. The induction method increases energy efficiency associated with a moving automobile by
converting kinetic energy that would normally be wasted into electric energy.
The design norm of cultural appropriateness is also evident in the new design. The pressure
sensor power system could be applied to any automobile because all automobiles use pressurized tires.
Most families in the United States have at least one automobile, and many have multiple vehicles. The
proposed technology could easily be used by millions of American drivers if it were implemented by
automotive manufacturers.
Finally, the proposed design also addresses the design norm of caring. People that cannot afford
to replace their TPMS would be at a disadvantage with a conventional system. By prolonging the
working life of tire pressure sensors, the new pressure sensor power system increases the safety of
automobiles. In extreme cases, knowledge of tire pressure could prevent a blowout and save lives.
40

8/3/2019 08 Final Report
http://slidepdf.com/reader/full/08-final-report 44/81
11. Costs
Team 8Preliminary Budget11/11/2005
Project Expenses:
R&DCosts
Sensors/Sensor System $65 Labor $20/hr
Batteries $0 Total Hrs (24hrs/week) 1080
Test Apparatus: $0 Total Cost $21,600
Steel (buy)
Electric motor (borrow) Professor Time $30/hr
Wheels (have) 45 hrs $1,350
Bearing (buy)
Wheels studs (buy) Industrial consultant time $40/hr Misc. hardware (buy) JCI 2 hrs $80
Magnets $30 Greg Bock 2 hrs $80
Coils/Wires$0
Subtotal: LaborCost $160
Electronic Components $91
Contingency expenses $60
Total Cost: $246
Total MaterialCost:
$246
Labor Cost: $23,110
Total Cost: $23,356
41

8/3/2019 08 Final Report
http://slidepdf.com/reader/full/08-final-report 45/81
References
1. Amazing Magnets. http://www.amazingmagnets.com/index.asp.
2
.DeGaspari, John. Mechanical Engineering Magazine Online.
http://www.memagazine.org/backissues/april05/features/pumpedup/pumpedup.html.
3. Goto, Hyroyuki. "Feasibility of Using the Automatic Generating System for Quartz Watches as a Leadless Pacemaker Power
Source." Medical & Biological Engineering & Computing 37, no. 3 (1999): 377-80.
4. Machine Design Magazine. "Where the Smart Rubber Meets the Road." Machine Design.
http://www.machinedesign.com/ASP/strArticleID/56605/strSite/MDSite/viewSelectedArticle.asp.
5. Mark Michmerhuizen – Johnson Controls, Holland
6. Steve Platt – Professor of Physics, Calvin College
7. Steve Ramsey – Pridgeon and Clay, Grand Rapids
8. SuperLogics: Simplifying Data Acquisition. http://www.superlogics.com/pressure-sensor/pressure-sensors/93.htm.
9. Varadan, Vijay K. "Design and Development of Passive MEMS-IDT Sensors for Continuous Monitoring of Tire Pressure."
Proceedings of SPIE - the International Society for Optical Engineering 4236 (2001): 242-51.
10. Wyczalek, Floyd A. "Electric Vehicle Regenerative Braking." Proceedings of the Intersociety Energy Conversion
Engineering Conference (1992): 3.185-90.
42

8/3/2019 08 Final Report
http://slidepdf.com/reader/full/08-final-report 46/81
Appendix 1: Magnet Pricing [1]
43

8/3/2019 08 Final Report
http://slidepdf.com/reader/full/08-final-report 47/81
Appendix 2.a: Preliminary Calculations and Magnet Specifications
d = 0.00635 [m] a = 0.25 · 3 .14 · d 2
n = 500 t =
l
n· 39.3701 ·
in
m l = 0.0508 [m] emf = 3 [V]
emf = n · a ·
δ b
δ t speed = 13.4 [m/sec] diam = 0.6604 [m] circ = 3.14 · diam RPM =
speed
circ· 60 [sec/min]
δ t =
l
speed req b = δ b · 10000 ·
gauss
tesla
44

8/3/2019 08 Final Report
http://slidepdf.com/reader/full/08-final-report 48/81
Appendix 2.b: Preliminary Correlations
0 100 200 300 400 500
0
10000
20000
30000
40000
50000
60000
70000
80000
90000
100000
n
r e q b
[ g a u s s ]
Required Magnetic Field Strength (reqb) Vs. Number of Turns in Coil (n)
0 10 20 30 40 50
0
200
400
600
800
1000
1200
1400
1600
speed [m/sec]
R P M
[ 1 / m i n ]
Motor Speed (RPM) Vs. Vehicle Speed (m/sec)
45

8/3/2019 08 Final Report
http://slidepdf.com/reader/full/08-final-report 49/81
Appendix 3: Piezoelectric Specifications [8]
46

8/3/2019 08 Final Report
http://slidepdf.com/reader/full/08-final-report 50/81
Appendix 4: Thermocouple Specifications (Type E)
47

8/3/2019 08 Final Report
http://slidepdf.com/reader/full/08-final-report 51/81
Appendix 5: List of Potential Customers
1. Auto Makersa. BMW
b. DCXc. Fordd. Freightlinere. GMf. Hondag. Hyundaih. Internationali. Kenworth j. Kiak. Nissanl. Peterbilt
m. Toyotan. VWo. Western
2. Tire Pressure Monitoring System Makersa. American Products Companyb. Beruc. Doran Pressure Prod. Entire Solutionse. Fleetwood Industriesf. Freescale
g. Orange-Electronich. Pacifici. Schrader j. Smartire
48

8/3/2019 08 Final Report
http://slidepdf.com/reader/full/08-final-report 52/81
Appendix 6: Number of New Cars Sold Yearly (1986-2004)
49

8/3/2019 08 Final Report
http://slidepdf.com/reader/full/08-final-report 53/81
Appendix 7: Direct Material and Labor Cost
Item Quantity Unit Pricereg - 3V 25000 0.3372 digikey
reg - 5V 25000 0.28175 digikeycap -2.2uF 25000 0.045 digikeycap -2.2uF 25000 0.045 digikeycap -3.3mF 25000 0.1608 digikey
diode 25000 0.0552 digikey
pcb 25000 0.010333 PCB123
coil 25000 0.383972Paramount WireCo.
0.975Material Cost / Wheel
5.219255
Total Direct Material - 4 Wheels
20.87702
Labor/Overhead Work Time / Unit
$40/hr. 0.25 hrs.
Total Labor Cost / Unit
$10
50

8/3/2019 08 Final Report
http://slidepdf.com/reader/full/08-final-report 54/81
Appendix 8: Sample Shipping Quote
(from Grand Rapids, MI to Lake Worth, FL)
51
8/3/2019 08 Final Report
http://slidepdf.com/reader/full/08-final-report 55/81
Appendix 9 : Test Resistor Power Pulse Period
-0.01
-0.005
0
0.005
0.01
0.015
0.02
0.025
0.03
0.035
-0.6 -0.4 -0.2 0 0.2 0.4 0.6
time
v o l t a g e a m p l i t u d e e
52
8/3/2019 08 Final Report
http://slidepdf.com/reader/full/08-final-report 56/81
53

8/3/2019 08 Final Report
http://slidepdf.com/reader/full/08-final-report 57/81
Appendix 11: Raw Power Generation
4/27/2006
Coil Voltage Across 981 Ohms Test Resistance = 981 Ohms
Motor Speed(%)
Voltage Amplitude(V) Power Pulse (W)
10 2.1 0.004495413
20 5.5 0.030835882
30 9 0.082568807
40 12 0.146788991
50 16 0.260958206
Coil Voltage Across 99 Ohms Test Resistance = 99 Ohms
Motor Speed(%)
Voltage Amplitude(V) Power Pulse (W)
10 1.8 0.032727273
20 5 0.252525253
30 8 0.646464646
40 11.5 1.335858586
50 13 1.707070707
54

8/3/2019 08 Final Report
http://slidepdf.com/reader/full/08-final-report 58/81
Appendix 12:
Super Capacitor Discharge Test (1)
SuperCap Discharge (0.47F) 3/11/2006Drained Across 100kOhms
Time (s) Voltage (V)
30 4.95
60 4.92
90 4.89
120 4.87
150 4.84
180 4.82
210 4.8
240 4.78
270 4.76
300 4.74330 4.72
360 4.7
390 4.68
420 4.66
450 4.65
480 4.63
55

8/3/2019 08 Final Report
http://slidepdf.com/reader/full/08-final-report 59/81
Super Capacitor Discharge Test (2)
SuperCap Discharge 2 (0.47F) Drained Across 1kOhm 3/29/2006
0.5 2.9
1 2.9
1.5 2.9
2 2.899
2.5 2.899
3 2.899
3.5 2.899
4 2.9
4.5 2.901
5 2.905
5.5 2.907
6 2.912
6.5 2.9177 2.923
7.5 2.928
8 2.932
8.5 2.936
9 2.941
9.5 2.957
10 2.947
10.5 2.93
11 2.911
11.5 2.889
12 2.868
12.5 2.84713 2.826
13.5 2.804
14 2.78
14.5 2.758
15 2.733
15.5 2.709
16 2.691
16.5 2.669
17 2.647
17.5 2.624
18 2.602
18.5 2.5819 2.557
19.5 2.536
20 2.515
56

8/3/2019 08 Final Report
http://slidepdf.com/reader/full/08-final-report 60/81
Super Capacitor Discharge Test (3)
SuperCap Discharge (1.0 F) 4/1/2006
Drained Across Sensor
Time (min.)Voltage(V)
0.5 4.83
1 4.73
1.5 4.67
2 4.61
2.5 4.56
3 4.52
3.5 4.49
4 4.47
4.5 4.45
5 4.435.5 4.41
6 4.4
6.5 4.38
7 4.37
7.5 4.35
8 4.34
8.5 4.33
9 4.32
9.5 4.31
10 4.3
10.5 4.29
11 4.2811.5 4.27
12 4.26
12.5 4.25
13 4.24
13.5 4.23
14 4.22
14.5 4.21
15 4.2
15.5 4.19
16 4.19
16.5 4.18
17 4.1717.5 4.16
18 4.15
18.5 4.14
19 4.14
19.5 4.13
20 4.12
20.5 4.12
21 4.11
57
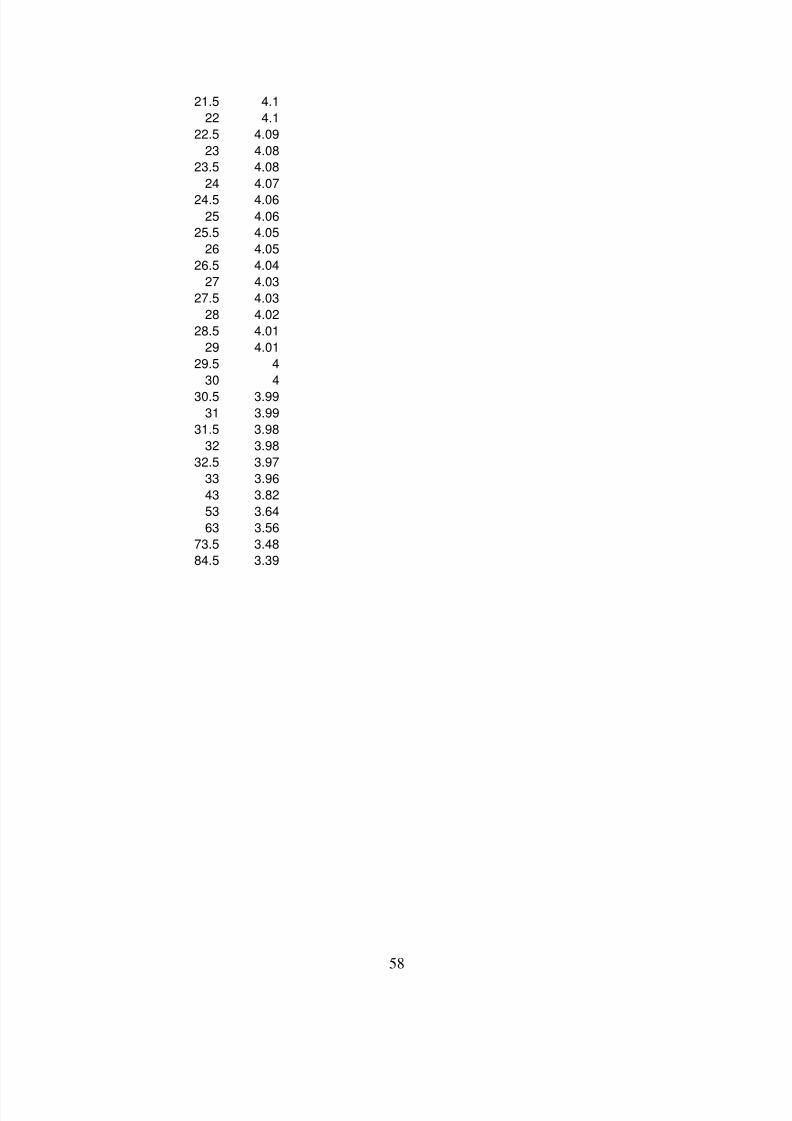
8/3/2019 08 Final Report
http://slidepdf.com/reader/full/08-final-report 61/81
21.5 4.1
22 4.1
22.5 4.09
23 4.08
23.5 4.08
24 4.07
24.5 4.0625 4.06
25.5 4.05
26 4.05
26.5 4.04
27 4.03
27.5 4.03
28 4.02
28.5 4.01
29 4.01
29.5 4
30 4
30.5 3.9931 3.99
31.5 3.98
32 3.98
32.5 3.97
33 3.96
43 3.82
53 3.64
63 3.56
73.5 3.48
84.5 3.39
58

8/3/2019 08 Final Report
http://slidepdf.com/reader/full/08-final-report 62/81
Super Capacitor Recharge Test (4)
SuperCap Recharge (1.0 F), 500 turn coil, 2 sets of 2 magnets stacked
Time (min.) Voltage(V)
0 3.36
0.5 3.59
1 3.75
1.5666 3.91
2 4.02
2.5 4.14
3.1 4.29
3.5 4.34
4 4.42
4.5 4.51
5 4.595.5 4.65
6 4.72
6.5 4.78
7 4.84
7.5 4.89
8.05 4.94
8.666 4.99
9 5.02
59
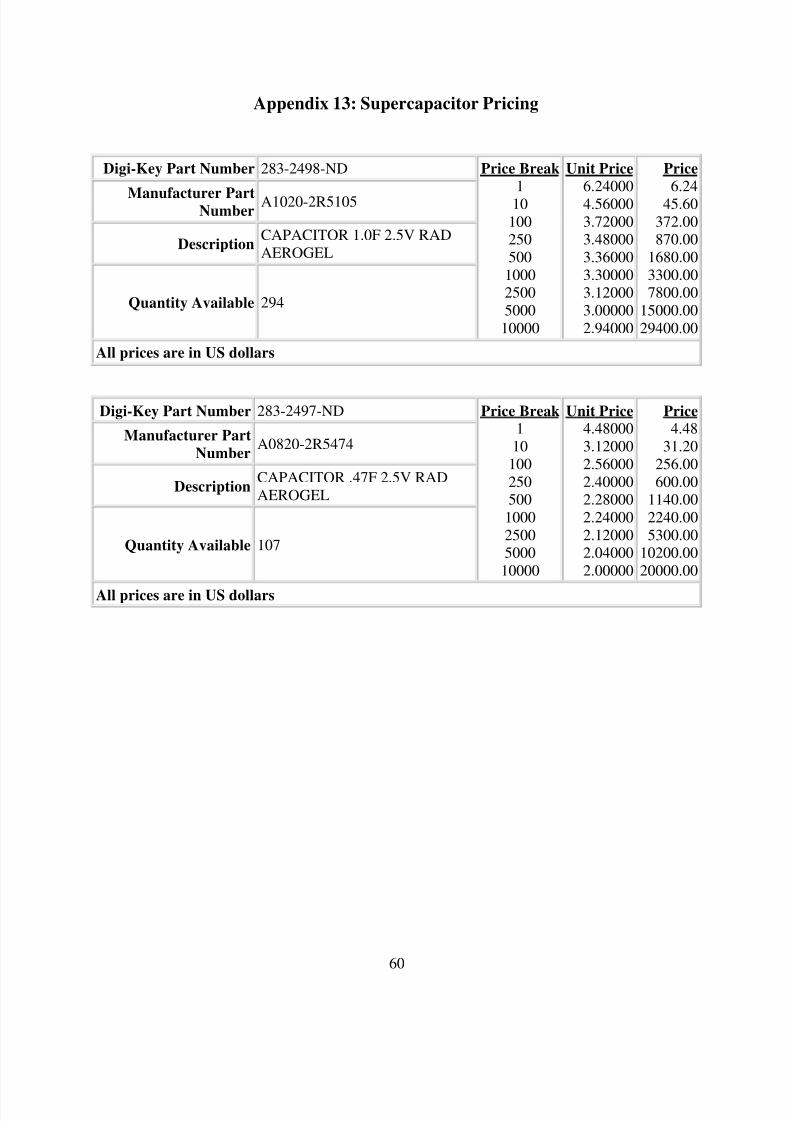
8/3/2019 08 Final Report
http://slidepdf.com/reader/full/08-final-report 63/81
Appendix 13: Supercapacitor Pricing
Digi-Key Part Number 283-2498-ND
Manufacturer PartNumber
A1020-2R5105
Description CAPACITOR 1.0F 2.5V RADAEROGEL
Quantity Available 294
Price Break 11010025050010002500500010000
Unit Price 6.240004.560003.720003.480003.360003.300003.120003.000002.94000
Price6.24
45.60372.00870.00
1680.003300.007800.00
15000.0029400.00
All prices are in US dollars
Digi-Key Part Number 283-2497-ND
Manufacturer PartNumber
A0820-2R5474
Description CAPACITOR .47F 2.5V RADAEROGEL
Quantity Available 107
Price Break 11010025050010002500500010000
Unit Price 4.480003.120002.560002.400002.280002.240002.120002.040002.00000
Price4.48
31.20256.00600.00
1140.002240.005300.00
10200.0020000.00
All prices are in US dollars
60

8/3/2019 08 Final Report
http://slidepdf.com/reader/full/08-final-report 64/81
Appendix 14: Electrolytic Capacitor Pricing
Digi-Key Part Number 565-1651-ND
Manufacturer PartNumber
EKZE100ELL332MK25S
Description CAP 3300UF 10V ELECT KZERAD
Quantity Available 168
Price Break 1101001000500010000
Unit Price0.570000.423000.310800.178540.171930.16531
Price0.574.23
31.08178.54859.63
1653.13
All prices are in US dollars
Digi-Key Part Number 565-1635-ND
Manufacturer PartNumber EKZE6R3ELL332MK20S
Description CAP 3300UF 6.3V ELECT KZERAD
Quantity Available 1581
Price Break 1
101001000500010000
Unit Price0.49000
0.361000.258200.144580.134250.12909
Price0.49
3.6125.82
144.58671.26
1290.88
All prices are in US dollars
Digi-Key Part Number 565-1670-ND
Manufacturer Part
Number EKZE160ELL332MK35S
Description CAP 3300UF 16V ELECT KZERAD
Quantity Available 2771
Price Break 1
101001000500010000
Unit Price0.67000
0.499000.366600.210610.202810.19501
Price0.67
4.9936.66
210.611014.071950.13
All prices are in US dollars
61

8/3/2019 08 Final Report
http://slidepdf.com/reader/full/08-final-report 65/81
Appendix 15:
Electrolytic Capacitor Discharge Test (1)
Capacitor Testing (sensor load) 4/19/2006
Capacitor Charge Time Discharge Time ThroughLetterCode Capacitance
VoltageRating (0-5V) sec. Sensor Load (5-3V)
lxz 6800uF 6.3 14 23
13 20
lxz 3300uF 16 11 12
10 12
kze 5600uF 10 12 17
11 16
lxz 12000uF 10 18 3718 36
kze 1200uF 10 10 5
9 5
kze 3300uF 10 10 11
10 11
lxz 3300uF 6.3 11 11
10 12
kze 3300uF 6.3 11 11
10 11
lxz 1500uF 10 9 6
9 7
kze 1500uF 6.3 10 69 6
lxz 3300uF 10 10 12
10 12
kze 1000uF 6.3 10 4
9 4
lxz 1200uF 6.3 9 4
9 5
lxz 1500uF 16 10 5
9 6
kze 6800uF 6.3 12 19
12 19
lxz 820uF 6.3 9 39 4
kze 1000uF 16 9 4
9 4
kze 3900uF 16 10 12
10 13
lxz 6800uF 10 12 19
12 20
lxz 15000uF 6.3 21 41
21 43
62

8/3/2019 08 Final Report
http://slidepdf.com/reader/full/08-final-report 66/81
Electrolytic Capacitor Discharge Test (2)
Capacitor Testing 4/18/2006
Capacitor
Letter Code CapacitanceVoltageRating
Charge Time(0 - 5V) (sec.) Discharge Time Through 100Ohm Load (5-3V) (s
lxz 6800uF 10V 13 79
lxz 15000uF 6.3V 21 185
kze 3900uF 16V 12 52
kze 6800uF 6.3V 14 79
lxz 1500uF 16V 10 21
lxz 820uF 6.3V 10 13
kze 1000uF 16V 10 14
kze 1000uF 6.3V 10 15
lxz 1200uF 6.3V 11 17
surfacemount 3300uF 10V 11 40
63

8/3/2019 08 Final Report
http://slidepdf.com/reader/full/08-final-report 67/81
Electrolytic Capacitor Discharge Test (3)
Capacitor Testing 4/17/2006
CapacitorLetterCode Capacitance
VoltageRating
Charge Time (0 -5V) Discharge Time Through 100Ohm Load (5-3V)
kze 3300uF 10V 25sec 44sec
kze 3300uF 6.3V 29sec 42sec
kze 5600uF 10V 18sec 62sec
kze 1200uF 10V 13sec 18sec
lxz 1500uF 6.3V 13sec 22sec
lxz 6800uF 6.3V 17sec 84sec
lxz 12000uF 10V 22sec 144sec
lxz 1500uF 10V 13sec 21sec
lxz 3300uF 16V 14sec 43sec
lxz 3300uF 6.3V 14sec 46sec3300uF 10V 14sec 43sec
64

8/3/2019 08 Final Report
http://slidepdf.com/reader/full/08-final-report 68/81
Appendix 16: Motor Speed Test
Motor Speed Test with Tire On 5/2/2006
Motor Speed (%) RPM MPH20 246 18.6 25 313 23.7 30 393 29.8 35 464 35.2 40 551 41.7 45 626 47.4 50 694 52.6
65

8/3/2019 08 Final Report
http://slidepdf.com/reader/full/08-final-report 69/81
Appendix 17: Voltage Regulator Input/Output Test
Voltage Regulator Test (input-output) 5/2/2006
5V Regulator 3V Regulator
Vin Vout Vin Vout
0.5 0 0.5 0
1 0.01 1 0.01
1.51 1.49 1.5 1.48
2.01 1.99 2 1.98
2.51 2.49 2.51 2.49
3.01 3 3.01 2.97
3.52 3.5 3.07 2.99
4.02 4.01 1 0.01
4.52 4.5
5.03 4.985.08 5
1 0.01
0.5 0
66

8/3/2019 08 Final Report
http://slidepdf.com/reader/full/08-final-report 70/81
Appendix 18: Sensor Power Pulse Test
Tests 1, 2, 3, 4 under low pressure (<15psi)
Test 5 under high pressure (>20psi)
Test 1 Test 2 Test 3
Time (sec.) Event Time (sec.) EventTime(sec.) Event
0 flatline 0 flatline 0 flatline
50 pulse 50 pulse once 50 pulse once
105 pulse again 105 pulse again
135 pulse continuous 135 pulse continuous
362 flatline
Test 4 Test 5
Time (sec.) Event Time (min.) Event
0 flatline 6.38 pusle continuous48 pulse 10.24 flatline
102 pulse 10.42 pulse continuous
158 pulse 14.32 flatline
213 pulse 14.45 pulse continuous
267 pulse 18.34 flatline
321 pulse 18.46 pulse continuous
376 pulse
67

8/3/2019 08 Final Report
http://slidepdf.com/reader/full/08-final-report 71/81
Appendix 19 - Financial Forecast Documents:
19 A……………………….….. 2007 Balance Sheet for Each Month
19 B…….…………….………2008 Balance Sheet for Each Quarter
19 C….........................2009 Balance Sheet for Each Quarter Ending
19 D……………2007 Budgeted Income Statement for Each Month
19 E………2008/2009 Budgeted Income Statement for Each Month
19 F……………..…2007 Statement of Cash Flows for Each Month
19 G……………….2008 Statement of Cash Flows for Each Month
19 H…………….…2009 Statement of Cash Flows for Each Month
19 I……………………………………………Break Even Analysis
19 J…………………………………………………..Ratio Analysis
68

8/3/2019 08 Final Report
http://slidepdf.com/reader/full/08-final-report 72/81
69

8/3/2019 08 Final Report
http://slidepdf.com/reader/full/08-final-report 73/81
Team 8 : QMKD Inc.
2008 Balance Sheet
For Each Quarter
March June September DecemberAssets
Current assets:
Cash $ 10,000 $ 10,000 $ 10,000 $ 10,000
Accounts receivable 140,000 140,000 140,000 140,000
Office Supplies 2,000 2,000 2,000 2,000
Inventories 44,900 44,900 44,900 44,900
Total current assets 196,900 196,900 196,900 196,900
Property, plant, and equipment:
Equipment 5,000 5,000 5,000 5,000
Furniture & Fixtures 12,000 12,000 12,000 12,000
Less: Accumulated depreciation (2,130) (2,556) (2,982) (3,408)
Net property, plant, and equipment
Total assets$
211,770$211,344
$210,918
$210,492
Liabilities and Shareholders' Equity
Current liabilities:
Accounts payable$
120,000$120,000
$120,000
$120,000
Wages & Salary Payable 9,840 9,840 9,840 9,840
Notes payable 321,412 337,484 353,556 369,628Total current liabilities 451,252 467,324 483,396 499,468
Long-term liabilities:
Notes payable 0 0 0 0
Total long-term liabilities
Shareholders' equity:
Additional Paid-in Capital 54,000 54,000 54,000 54,000
Retained earnings (239,482) (255,980) (272,478) (288,976)
Total shareholders' equity (185,482) (201,980) (218,478) (234,976)
Total liabilities and shareholders' equity$
211,770$211,344
$210,918
$210,492
70

8/3/2019 08 Final Report
http://slidepdf.com/reader/full/08-final-report 74/81
Team 8 : QMKD Inc.
2009 Balance Sheet
For Each Quater Ending
March June September DecemberAssets
Current assets:
Cash $ 10,000 $ 10,000 $ 10,000 $ 10,000
Accounts receivable 150,000 150,000 150,000 150,000
Office Supplies 2,000 2,000 2,000 2,000
Inventories 50,000 50,000 50,000 50,000
Total current assets 212,000 212,000 212,000 212,000
Property, plant, and equipment:
Equipment 5,000 5,000 5,000 5,000
Furniture & Fixtures 12,000 12,000 12,000 12,000
Less: Accumulated depreciation (3,834) (4,260) (4,686) (5,112)
Net property, plant, and equipment
Total assets$
225,166$224,740
$224,314
$223,888
Liabilities and Shareholders' Equity
Current liabilities:
Accounts payable$
120,000$120,000
$120,000
$120,000
Wages & Salary Payable 9,840 9,840 9,840 9,840
Notes payable 313,718 296,810 279,902 262,994Total current liabilities 443,558 426,650 409,742 392,834
Long-term liabilities:
Notes payable 0 0 0 0
Total long-term liabilities 0 0 0 0
Shareholders' equity:
Additional Paid-in Capital 54,000 54,000 54,000 54,000
Retained earnings (272,392) (255,910) (239,428) (222,946)
Total shareholders' equity (218,392) (201,910) (185,428) (168,946)
Total liabilities and shareholders' equity
$
225,166
$
224,740
$
224,314
$
223,888
71

8/3/2019 08 Final Report
http://slidepdf.com/reader/full/08-final-report 75/81
7272

8/3/2019 08 Final Report
http://slidepdf.com/reader/full/08-final-report 76/81
73

8/3/2019 08 Final Report
http://slidepdf.com/reader/full/08-final-report 77/81
7474

8/3/2019 08 Final Report
http://slidepdf.com/reader/full/08-final-report 78/81
75
8/3/2019 08 Final Report
http://slidepdf.com/reader/full/08-final-report 79/81
76

8/3/2019 08 Final Report
http://slidepdf.com/reader/full/08-final-report 80/81
77

8/3/2019 08 Final Report
http://slidepdf.com/reader/full/08-final-report 81/81