09 july 2021 1qfy22 results preview autos & transportation
TRANSCRIPT

09 July 2021 1QFY22 Results Preview
Autos & Transportation
HSIE Research is also available on Bloomberg ERH HDF <GO> & Thomson Reuters
Mixed recovery trends While auto demand will benefit from the expected pick-up in economic growth,
the pent-up demand has been low in the current unlock phase vis-à-vis last year
due to higher fuel prices (+40% YoY) and price hikes taken by OEMs. 2W
demand has been tepid while that of PVs is more resilient, given the relatively
better income profiles of car customers. We see limited room for EPS upgrades,
going ahead, due to (1) elevated growth expectations and (2) margin headwinds
on the back of firm commodity prices. Consequently, the auto index is expected
to perform in line with the broader market. We reiterate our preference for
stocks that have a diversified geographic presence - Bajaj Auto, Tata Motors
and Bharat Forge. We also have a BUY on Maruti amongst the domestic-centric
OEMs due to its product portfolio comprising alternate fuel variants (CNG and
upcoming hybrid models).
Pent-up demand is low in the current unlock phase: In the current unlock
phase, the pent-up demand is lukewarm (unlike last year) as customer
sentiment has been partially impacted by (1) higher fuel prices - petrol prices
are more than INR 100 (+40% YoY) in several states, which has resulted in
high running costs and (2) price hikes taken by the OEMs to offset rising
commodity prices. Further, demand in the rural segment has not been as
resilient as that in the previous year, with 2W OEMs reporting flattish sales in
Jun-21. However, demand for PVs is holding up (as the higher income
consumers have been relatively less impacted by COVID). The progress of the
south-west monsoon will be a key variable to determine the extent of
recovery.
Margin headwinds in 1QFY22: Commodity prices have remained firm, with
OEMs raising prices to partially offset the above. Further, the sudden outburst
of the COVID wave in Apr-May 2021 had resulted in temporary production
shutdowns, which will impact profitability this quarter.
Sector returns are converging with the broader market: The NIFTY Auto
index has performed in line with the broader market in 1QFY22 (+7% QoQ)
due to commodity cost inflation and moderating growth trends across 2Ws.
The sector returns have been normalising over the past six months due to
inflationary cost pressures/elevated valuations. We foresee limited scope for
EPS upgrades as growth rates are adequately factoring in the expected
recovery.
Key recommendations: We are downgrading Endurance Technologies to an
ADD. While the company will continue to outperform the industry due to its
increasing content per vehicle, the overall recovery in the 2W industry has
been tepid. We believe the current valuations of 30x forward PE are
adequately factoring in future growth prospects. We prefer stocks that have a
diverse business mix across geographies and reiterate our BUY rating on Bajaj
Auto, Tata Motors, and Bharat Forge. We also have a BUY on Maruti due to
its product portfolio comprising alternate fuels (CNG and upcoming hybrid
models). We prefer Subros amongst the domestic auto ancillaries.
Logistic/aviation: As the trial runs have started on the 650km stretch between
Palanpur (Gujarat) and Haryana, we believe that Gateway (BUY) and
CONCOR (ADD) will benefit from the shift towards the rail. We have a
REDUCE on Indigo as we believe its margins will be impacted by firming
crude prices.
RECO
CMP
(INR)
*
TP
(INR)
Ashok
Leyland REDUCE 124 115
Bajaj Auto BUY 4,048 4,860
Eicher REDUCE 2,715 2,500
Escorts ADD 1,204 1,325
Hero Moto ADD 2,914 3,320
Mahindra ADD 777 900
Maruti BUY 7,451 8,680
Tata Motors BUY 317 380
Amara Raja ADD 739 840
Bharat Forge BUY 807 940
Endurance ADD 1,633 1,660
Gulf Oil BUY 687 850
Subros BUY 322 410
Sundram
Fasteners ADD 793 810
IndiGo REDUCE 1,809 1,725
CONCOR ADD 693 740
Gateway
Distriparks BUY 290 360
*CMP as of 7th Jul-21
NIFTY Auto index
Source: Bloomberg, HSIE Research;
indexes rebased to 100
Aditya Makharia
+91-22-6171-7316
Mansi Lall
+91-22-6171-7357
80
100
120
140
160
180
Ap
r-20
May
-20
Jun
-20
Jul-
20A
ug
-20
Sep
-20
Oct
-20
No
v-2
0D
ec-2
0Ja
n-2
1F
eb-2
1M
ar-2
1A
pr-
21M
ay-2
1Ju
n-2
1Ju
l-21
NIFTY NIFTY AUTO

Page | 2
Autos & Transportation: 1QFY22E Results Preview
1QFY22E earnings preview
Volume (in units '000) NET SALES (INR bn) EBITDA margin (%) APAT (INR bn) Adj. EPS (INR)
1Q
FY22E
QoQ
(%)
YoY
(%)
1Q
FY22E
QoQ
(%)
YoY
(%)
1Q
FY22E
QoQ
(bps)
YoY
(bps)
1Q
FY22E
QoQ
(%)
YoY
(%)
1Q
FY22E
4Q
FY21
1Q
FY21
AUTOS
Ashok
Leyland 18 (59) 372 30.0 (57) 361 6.3 (133) NA (0.1) NA NA (0.0) 0.7 (1.3)
Bajaj Auto 1,006 (14) 127 75.4 (12) 145 17.4 (33) 413 11.9 (10) 126 41.3 46.0 18.2
Eicher 124 (40) 116 17.4 (41) 113 20.5 (108) 2,004 2.8 (46) NA 10.4 19.3 (2.0)
Escorts 26 (20) 43 17.4 (21) 64 15.2 (39) 393 2.1 (24) 124 20.5 26.9 9.1
Hero Moto 1,024 (35) 82 55.3 (36) 86 13.5 (44) 986 5.6 (35) 820 28.2 43.3 3.1
Mahindra 187 (8) 96 119.5 (10) 114 14.0 (70) 375 8.7 (13) 2,146 7.3 8.4 0.3
Maruti 354 (28) 362 173.3 (28) 322 9.0 71 NA 13.9 19 (658) 46.1 38.6 (8.3)
Tata Motors 115 (40) 358 131.8 (34) 390 6.9 (179) NA (5.7) NA NA (1.6) 0.9 (5.9)
Aggregate 2,853 (27) 122 620.1 (29) 196 11.3 (14) 1,459 39.4 (31) (288)
Source: Company, HSIE Research
NET SALES (INR mn) EBITDA margin (%) APAT (INR mn) Adj. EPS (INR)
1QF
Y22E QoQ (%) YoY (%)
1QF
Y22E
QoQ
(bps)
YoY
(bps)
1Q
FY22E QoQ (%) YoY (%)
1Q
FY22E
4Q
FY21
1Q
FY21
AUTO ANCS
Amara Raja 17,266 (18) 50 14.5 (55) 126 1,713 (10) 173 10.0 11.1 3.7
Bharat Forge 8,354 (36) 96 26.5 (97) NA 1,110 (46) NA 2.4 4.4 (1.2)
Endurance 12,062 (43) 100 15.7 15 864 685 (63) NA 4.9 13.3 (1.8)
Gulf Oil 4,222 (18) 75 14.7 (39) 416 492 (18) 186 9.9 12.0 3.5
Subros 5,076 (23) 588 9.5 (18) NA 164 (36) NA 2.5 3.9 (3.7)
Sundram Fasteners 5,971 (53) 60 18.0 (60) 1,394 615 (56) NA 2.9 6.7 (1.3)
Source: Company, HSIE Research
NET SALES (INR mn) EBITDA margin (%) APAT (INR mn) Adj. EPS (INR)
1QFY22E QoQ (%) YoY (%) 1QFY22E QoQ
(bps)
YoY
(bps) 1QFY22E QoQ (%) YoY (%) 1QFY22E 4QFY21 1QFY21
TRANSPORTATION
CONCOR 17,520 (10) 47 18.0 825 463 1,428 83 132 2.3 1.3 1.0
Gateway Distriparks 3,356 (4) 33 26.5 (70) (114) 343 (26) 208 3.2 4.2 1.0
Interglobe Aviation 47,152 (20) 525 14.0 350 NA (7,890) NA NA (20.5) (22.7) (74.2)
Source: Company, HSIE Research

Page | 3
Autos & Transportation: 1QFY22E Results Preview
Change in estimates and target price
Coverage
companies
Old
Rating
New
Rating
Old
TP
(INR)
New
TP ^
(INR)
Old target
multiple
New target
multiple
Old EPS (INR) New EPS (INR) % change
FY
22E
FY
23E
FY
24E
FY
22E
FY
23E
FY
24E
FY
22E
FY
23E
FY
24E
Ashok
Leyland REDUCE REDUCE 115 115
11x
EV/EBITDA
11x
EV/EBITDA 3.0 5.6 7.2 3.0 5.6 7.2 - - -
Bajaj Auto BUY BUY 4,360 4,860 20x 20x 186.9 217.6 - 188.2 232.6 274.0 0.7 6.9 -
Eicher REDUCE REDUCE 2,400 2,500
23x core
business
16x VECV
23x core
business
16x VECV
82.3 109.5 - 82.3 109.5 125.9 - - -
Escorts ADD ADD 1,300 1,325 14x 14x 84.2 93.0 - 84.2 93.0 99.4 - - -
Hero
Motocorp ADD ADD 3,240 3,320 17.5x 17.5x 171.2 185.3 - 171.2 185.3 202.7 - - -
Mahindra ADD ADD 890 900 15x core
business
15x core
business 40.1 48.5 - 39.9 48.3 53.7 -0.5 -0.5 -
Maruti
Suzuki BUY BUY 7,750 8,680 27x 27x 219.5 287.4 - 220.9 299.7 386.2 0.6 4.3 -
Tata Motors BUY BUY 380 380
11x
EV/EBITDA
on core
business
11x
EV/EBITDA
on core
business
10.2 18.8 - 1.2 16.1 25.3 NA -14.2 -
Amara Raja ADD ADD 910 840 19x 19x 40.4 47.8 - 38.6 42.8 47.6 -4.4 -10.5 -
Bharat Forge BUY BUY 860 940 34.5x 35x 16.4 24.8 - 16.5 25.3 31.3 1.1 2.0 -
Endurance BUY ADD 1,600 1,660 30x 30x 45.7 53.4 - 45.7 53.4 61.5 - - -
Gulf Oil BUY BUY 840 850 19x 19x 40.8 44.0 - 40.8 44.0 47.4 - - -
Subros BUY BUY 410 410 22x 22x 12.7 17.4 22.8 12.7 17.4 22.8 - - -
Sundram
Fasteners ADD ADD 750 810 27.5x 28x 21.2 27.0 - 21.2 27.5 33.6 - 1.9 -
CONCOR ADD ADD 690 740 28x 28x 16.8 24.5 - 16.6 24.5 32.4 -1.1 0.1 -
Gateway
Distriparks BUY BUY 235 360
10x
EV/EBITDA
Rail business
14x
EV/EBITDA
Rail business
9.2 12.8 - 9.3 12.9 17.7 1.4 1.2 -
IndiGo REDUCE REDUCE 1,580 1,725 7x
EV/EBITDA
7x
EV/EBITDA -52.2 68.6 - -52.2 63.5 103.8 - -7.5 -
Source: Company, HSIE Research, ^Jun-23E TP

Page | 4
Autos & Transportation: 1QFY22E Results Preview
Peerset comparison
Mcap
(Rs bn)
CMP*
(Rs/sh) Reco
TP
(Rs)
Adj EPS (Rs/sh) P/E (x) RoE (%) EV/EBITDA (x)
FY
22E
FY
23E
FY
24E
FY
22E
FY
23E
FY
24E
FY
22E
FY
23E
FY
24E
FY
22E
FY
23E
FY
24E
AUTOS
Ashok Leyland 363 124 REDUCE 115 3.0 5.6 7.2 40.6 22.2 17.2 12.7 20.9 23.7 20.5 12.7 10.1
Bajaj Auto 1,171 4,048 BUY 4,860 188.2 232.6 274.0 21.5 17.4 14.8 21.4 25.6 28.9 16.7 13.7 11.5
Eicher 74 2,715 REDUCE 2,500 82.3 109.5 125.9 33.0 24.8 21.6 19.4 22.1 21.6 24.9 18.7 15.6
Escorts Ltd. 162 1,204 ADD 1,325 84.2 93.0 99.4 14.3 12.9 12.1 14.7 14.1 13.2 7.8 6.5 5.4
Hero Moto 582 2,914 ADD 3,320 171.2 185.3 202.7 17.0 15.7 14.4 21.9 21.9 22.1 11.1 9.8 8.7
Mahindra 926 777 ADD 900 39.9 48.3 53.7 19.5 16.1 14.5 13.1 14.2 14.0 11.4 9.5 8.0
Maruti 2,250 7,451 BUY 8,680 220.9 299.7 386.2 33.7 24.9 19.3 12.4 15.3 17.6 21.6 15.7 11.6
Tata Motors 1,141 317 BUY 380 1.2 16.1 25.3 NA 19.6 12.5 0.8 10.6 14.7 5.7 4.3 3.5
AUTO ANCS
Amara Raja 126 739 ADD 840 38.6 42.8 47.6 19.1 17.3 15.5 14.9 14.6 14.5 9.8 8.3 7.0
Bharat Forge 376 807 BUY 940 16.5 25.3 31.3 48.8 31.9 25.8 13.1 17.7 18.6 30.1 21.8 18.5
Endurance 230 1,633 ADD 1,660 45.7 53.4 61.5 35.7 30.6 26.5 17.4 17.5 17.3 18.2 15.4 13.1
Gulf Oil 34 687 BUY 850 40.8 44.0 47.4 16.9 15.6 14.5 22.2 21.4 20.7 10.1 8.7 7.4
Subros 21 322 BUY 410 12.7 17.4 22.8 25.4 18.5 14.1 10.0 12.4 14.4 9.6 7.4 5.7
Sundram
Fasteners 167 793 ADD 810 21.2 27.5 33.6 37.5 28.9 23.6 18.6 20.8 21.1 22.8 18.6 15.5
TRANSPORTA
TION
CONCOR 422 693 ADD 740 16.6 24.5 32.4 41.6 28.3 21.4 9.7 13.5 16.6 24.1 18.4 14.3
Gateway
Distriparks 32 290 BUY 360 9.3 12.9 17.7 31.1 22.5 16.3 7.9 10.6 13.8 12.2 10.3 8.2
Interglobe 696 1,809 REDUCE 1,725 (52.2) 63.5 103.8 NA 28.5 17.4 NA NA NA 20.1 8.1 5.7
Source: Company, HSIE Research, *CMP as of 7th Jul-21
Page | 5
Autos & Transportation: 1QFY22E Results Preview
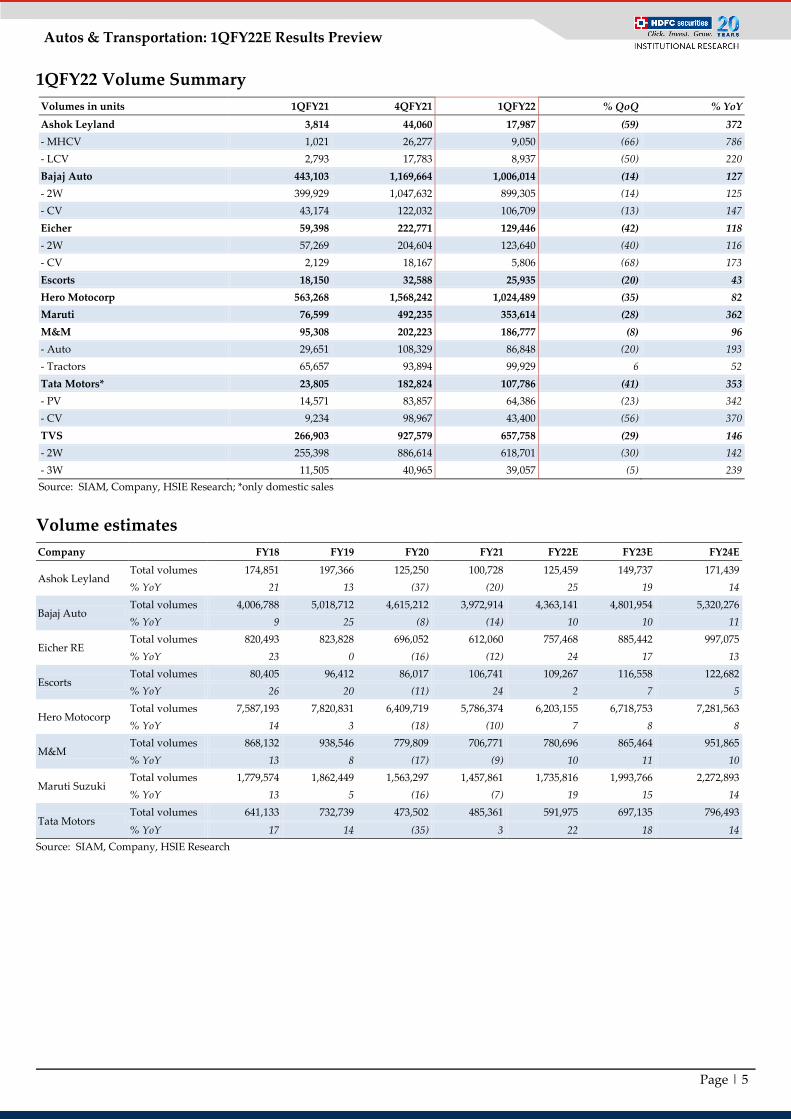
1QFY22 Volume Summary
Volumes in units 1QFY21 4QFY21 1QFY22 % QoQ % YoY
Ashok Leyland 3,814 44,060 17,987 (59) 372
- MHCV 1,021 26,277 9,050 (66) 786
- LCV 2,793 17,783 8,937 (50) 220
Bajaj Auto 443,103 1,169,664 1,006,014 (14) 127
- 2W 399,929 1,047,632 899,305 (14) 125
- CV 43,174 122,032 106,709 (13) 147
Eicher 59,398 222,771 129,446 (42) 118
- 2W 57,269 204,604 123,640 (40) 116
- CV 2,129 18,167 5,806 (68) 173
Escorts 18,150 32,588 25,935 (20) 43
Hero Motocorp 563,268 1,568,242 1,024,489 (35) 82
Maruti 76,599 492,235 353,614 (28) 362
M&M 95,308 202,223 186,777 (8) 96
- Auto 29,651 108,329 86,848 (20) 193
- Tractors 65,657 93,894 99,929 6 52
Tata Motors* 23,805 182,824 107,786 (41) 353
- PV 14,571 83,857 64,386 (23) 342
- CV 9,234 98,967 43,400 (56) 370
TVS 266,903 927,579 657,758 (29) 146
- 2W 255,398 886,614 618,701 (30) 142
- 3W 11,505 40,965 39,057 (5) 239
Source: SIAM, Company, HSIE Research; *only domestic sales
Volume estimates
Company FY18 FY19 FY20 FY21 FY22E FY23E FY24E
Ashok Leyland Total volumes 174,851 197,366 125,250 100,728 125,459 149,737 171,439
% YoY 21 13 (37) (20) 25 19 14
Bajaj Auto Total volumes 4,006,788 5,018,712 4,615,212 3,972,914 4,363,141 4,801,954 5,320,276
% YoY 9 25 (8) (14) 10 10 11
Eicher RE Total volumes 820,493 823,828 696,052 612,060 757,468 885,442 997,075
% YoY 23 0 (16) (12) 24 17 13
Escorts Total volumes 80,405 96,412 86,017 106,741 109,267 116,558 122,682
% YoY 26 20 (11) 24 2 7 5
Hero Motocorp Total volumes 7,587,193 7,820,831 6,409,719 5,786,374 6,203,155 6,718,753 7,281,563
% YoY 14 3 (18) (10) 7 8 8
M&M Total volumes 868,132 938,546 779,809 706,771 780,696 865,464 951,865
% YoY 13 8 (17) (9) 10 11 10
Maruti Suzuki Total volumes 1,779,574 1,862,449 1,563,297 1,457,861 1,735,816 1,993,766 2,272,893
% YoY 13 5 (16) (7) 19 15 14
Tata Motors Total volumes 641,133 732,739 473,502 485,361 591,975 697,135 796,493
% YoY 17 14 (35) 3 22 18 14
Source: SIAM, Company, HSIE Research

Page | 6
Autos & Transportation: 1QFY22E Results Preview
Monthly volumes (in units)
Ashok Leyland: MHCV volumes to recover from
2HFY22 onwards
Bajaj Auto: Volume momentum sustaining due to
exports
Source: SIAM, Company, HSIE Research Source: SIAM, Company, HSIE Research
Royal Enfield: Volumes have moderated from the
earlier 65k+ levels
Hero Motocorp: Volume growth has moderated over the
past few months
Source: SIAM, Company, HSIE Research Source: SIAM, Company, HSIE Research
Escorts: Tractor sales have risen in anticipation of
normal monsoons
Maruti Suzuki: PV demand is holding up
Source: SIAM, Company, HSIE Research Source: SIAM, Company, HSIE Research
-
3,000
6,000
9,000
12,000
15,000
18,000
Ap
r-20
May
-20
Jun
-20
Jul-
20
Au
g-2
0
Sep
-20
Oct
-20
No
v-2
0
Dec
-20
Jan
-21
Feb
-21
Mar
-21
Ap
r-21
May
-21
Jun
-21
-
50,000
100,000
150,000
200,000
250,000
300,000
Ap
r-20
May
-20
Jun
-20
Jul-
20
Au
g-2
0
Sep
-20
Oct
-20
No
v-2
0
Dec
-20
Jan
-21
Feb
-21
Mar
-21
Ap
r-21
May
-21
Jun
-21
-
20,000
40,000
60,000
80,000
Ap
r-20
May
-20
Jun
-20
Jul-
20
Au
g-2
0
Sep
-20
Oct
-20
No
v-2
0
Dec
-20
Jan
-21
Feb
-21
Mar
-21
Ap
r-21
May
-21
Jun
-21
-
150,000
300,000
450,000
600,000
750,000
900,000
Ap
r-20
May
-20
Jun
-20
Jul-
20
Au
g-2
0
Sep
-20
Oct
-20
No
v-2
0
Dec
-20
Jan
-21
Feb
-21
Mar
-21
Ap
r-21
May
-21
Jun
-21
-
3,000
6,000
9,000
12,000
15,000
Ap
r-20
May
-20
Jun
-20
Jul-
20
Au
g-2
0
Sep
-20
Oct
-20
No
v-2
0
Dec
-20
Jan
-21
Feb
-21
Mar
-21
Ap
r-21
May
-21
Jun
-21
-
50,000
100,000
150,000
200,000
Ap
r-20
May
-20
Jun
-20
Jul-
20
Au
g-2
0
Sep
-20
Oct
-20
No
v-2
0
Dec
-20
Jan
-21
Feb
-21
Mar
-21
Ap
r-21
May
-21
Jun
-21
Page | 7
Autos & Transportation: 1QFY22E Results Preview
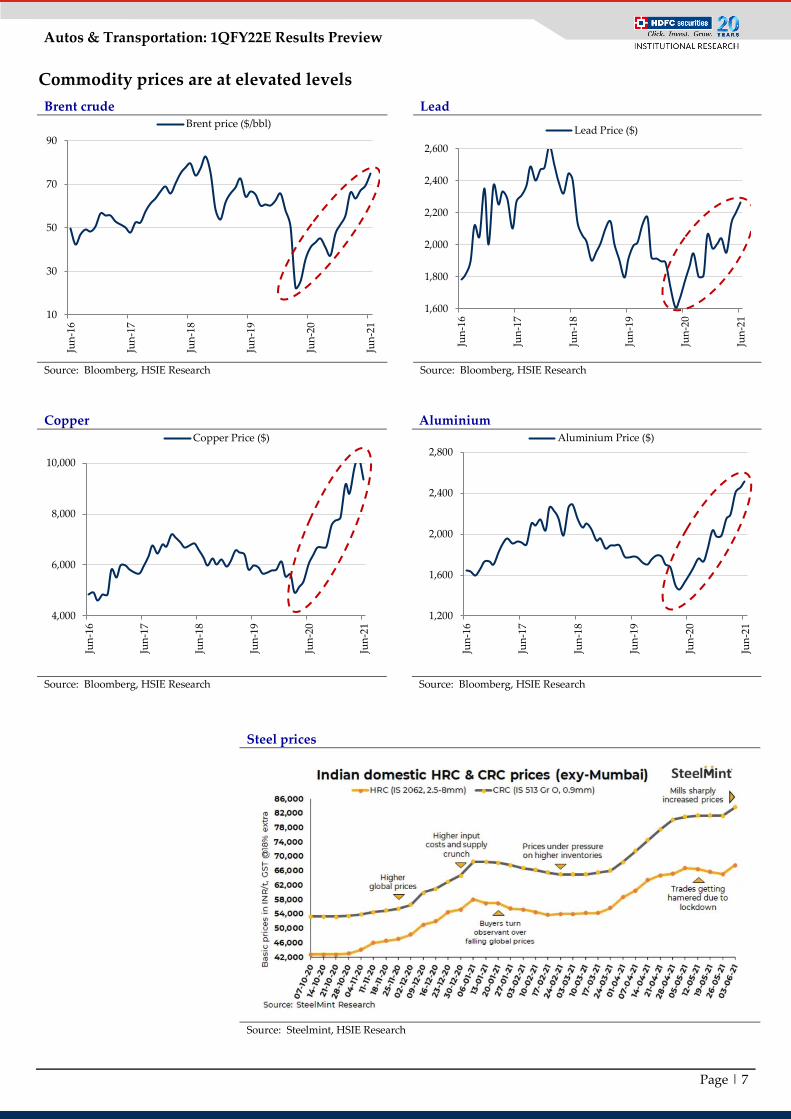
Commodity prices are at elevated levels
Brent crude Lead
Source: Bloomberg, HSIE Research Source: Bloomberg, HSIE Research
Copper Aluminium
Source: Bloomberg, HSIE Research Source: Bloomberg, HSIE Research
Steel prices
Source: Steelmint, HSIE Research
10
30
50
70
90
Jun
-16
Jun
-17
Jun
-18
Jun
-19
Jun
-20
Jun
-21
Brent price ($/bbl)
1,600
1,800
2,000
2,200
2,400
2,600
Jun
-16
Jun
-17
Jun
-18
Jun
-19
Jun
-20
Jun
-21
Lead Price ($)
4,000
6,000
8,000
10,000
Jun
-16
Jun
-17
Jun
-18
Jun
-19
Jun
-20
Jun
-21
Copper Price ($)
1,200
1,600
2,000
2,400
2,800Ju
n-1
6
Jun
-17
Jun
-18
Jun
-19
Jun
-20
Jun
-21
Aluminium Price ($)

Page | 8
Autos & Transportation: 1QFY22E Results Preview
Index and stock price performance
Market price
as of 30th
Jun-21
% return
3M 6M 9M 1Y
NIFTY 15,722 7% 12% 40% 53%
NIFTY Auto 10,600 7% 15% 34% 58%
Ashok Leyland 123 8% 28% 65% 161%
Bajaj Auto 4,134 13% 20% 43% 46%
Eicher 2,671 3% 6% 21% 46%
Escorts 1,220 -5% -3% -7% 17%
Hero Motocorp 2,903 0% -7% -8% 14%
Mahindra 778 -2% 8% 28% 52%
Maruti Suzuki 7,516 10% -2% 11% 29%
Tata Motors 340 13% 85% 155% 246%
Bharat Forge 762 28% 45% 70% 139%
Source: Bloomberg, HSIE Research
Ashok Leyland 1-yr forward
EV/EBITDA
Bajaj Auto 1-yr forward P/E band Eicher Motors 1-yr forward P/E band
Source: Bloomberg, Company, HSIE Research
Escorts 1-yr forward P/E band Hero Motocorp 1-yr forward P/E
band
M&M 1-yr forward P/E band
Source: Bloomberg, Company, HSIE Research
0
8
16
24
32
40
Jul-
14Ja
n-1
5Ju
l-15
Jan
-16
Jul-
16Ja
n-1
7Ju
l-17
Jan
-18
Jul-
18Ja
n-1
9Ju
l-19
Jan
-20
Jul-
20Ja
n-2
1Ju
l-21
EV/EBITDA Mean
8
12
16
20
24
Jul-
10
Jul-
11
Jul-
12
Jul-
13
Jul-
14
Jul-
15
Jul-
16
Jul-
17
Jul-
18
Jul-
19
Jul-
20
Jul-
21
PE Mean+1 SD -1 SD
5
10
15
20
Jul-
16
Jan
-17
Jul-
17
Jan
-18
Jul-
18
Jan
-19
Jul-
19
Jan
-20
Jul-
20
Jan
-21
Jul-
21
P/E Mean
+1 SD -1 SD
6
12
18
24
Jul-
07
Jul-
08
Jul-
09
Jul-
10
Jul-
11
Jul-
12
Jul-
13
Jul-
14
Jul-
15
Jul-
16
Jul-
17
Jul-
18
Jul-
19
Jul-
20
Jul-
21
PE Mean
+1 SD -1 SD
0
5
10
15
20
25
30
Jul-
07Ju
l-08
Jul-
09Ju
l-10
Jul-
11Ju
l-12
Jul-
13Ju
l-14
Jul-
15Ju
l-16
Jul-
17Ju
l-18
Jul-
19Ju
l-20
Jul-
21P/E Mean
+1 SD -1 SD
20
25
30
35
40
45
Jul-
15
Jan
-16
Jul-
16
Jan
-17
Jul-
17
Jan
-18
Jul-
18
Jan
-19
Jul-
19
Jan
-20
Jul-
20
Jan
-21
Jul-
21
P/E Mean
+1 SD -1 SD
Page | 9
Autos & Transportation: 1QFY22E Results Preview
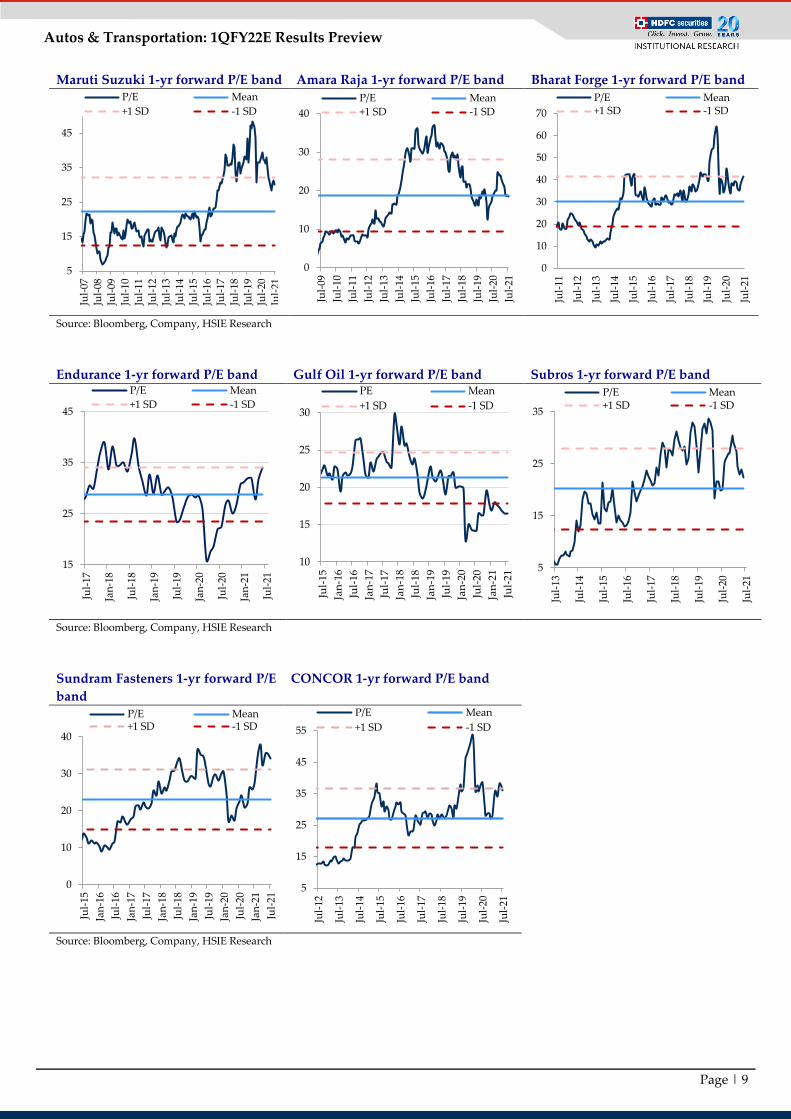
Maruti Suzuki 1-yr forward P/E band Amara Raja 1-yr forward P/E band Bharat Forge 1-yr forward P/E band
Source: Bloomberg, Company, HSIE Research
Endurance 1-yr forward P/E band Gulf Oil 1-yr forward P/E band Subros 1-yr forward P/E band
Source: Bloomberg, Company, HSIE Research
Sundram Fasteners 1-yr forward P/E
band
CONCOR 1-yr forward P/E band
Source: Bloomberg, Company, HSIE Research
5
15
25
35
45
Jul-
07
Jul-
08
Jul-
09
Jul-
10
Jul-
11
Jul-
12
Jul-
13
Jul-
14
Jul-
15
Jul-
16
Jul-
17
Jul-
18
Jul-
19
Jul-
20
Jul-
21
P/E Mean
+1 SD -1 SD
0
10
20
30
40
Jul-
09
Jul-
10
Jul-
11
Jul-
12
Jul-
13
Jul-
14
Jul-
15
Jul-
16
Jul-
17
Jul-
18
Jul-
19
Jul-
20
Jul-
21
P/E Mean
+1 SD -1 SD
0
10
20
30
40
50
60
70
Jul-
11
Jul-
12
Jul-
13
Jul-
14
Jul-
15
Jul-
16
Jul-
17
Jul-
18
Jul-
19
Jul-
20
Jul-
21
P/E Mean+1 SD -1 SD
10
15
20
25
30
Jul-
15
Jan
-16
Jul-
16
Jan
-17
Jul-
17
Jan
-18
Jul-
18
Jan
-19
Jul-
19
Jan
-20
Jul-
20
Jan
-21
Jul-
21
PE Mean
+1 SD -1 SD
0
10
20
30
40
Jul-
15
Jan
-16
Jul-
16
Jan
-17
Jul-
17
Jan
-18
Jul-
18
Jan
-19
Jul-
19
Jan
-20
Jul-
20
Jan
-21
Jul-
21
P/E Mean+1 SD -1 SD
15
25
35
45
Jul-
17
Jan
-18
Jul-
18
Jan
-19
Jul-
19
Jan
-20
Jul-
20
Jan
-21
Jul-
21
P/E Mean
+1 SD -1 SD
5
15
25
35
Jul-
13
Jul-
14
Jul-
15
Jul-
16
Jul-
17
Jul-
18
Jul-
19
Jul-
20
Jul-
21
P/E Mean+1 SD -1 SD
5
15
25
35
45
55
Jul-
12
Jul-
13
Jul-
14
Jul-
15
Jul-
16
Jul-
17
Jul-
18
Jul-
19
Jul-
20
Jul-
21
P/E Mean
+1 SD -1 SD
Page | 10
Autos & Transportation: 1QFY22E Results Preview
HDFC securities
Institutional Equities
Unit No. 1602, 16th Floor, Tower A, Peninsula Business Park,
Senapati Bapat Marg, Lower Parel, Mumbai - 400 013
Board: +91-22-6171-7330 www.hdfcsec.com
Disclosure:
We, Aditya Makharia, CA & Mansi Lall, MBA, authors and the names subscribed to this report, hereby certify that all of the views expressed in this research report
accurately reflect our views about the subject issuer(s) or securities. HSL has no material adverse disciplinary history as on the date of publication of this report. We also
certify that no part of our compensation was, is, or will be directly or indirectly related to the specific recommendation(s) or view(s) in this report.
Research Analyst or his/her relative or HDFC Securities Ltd. does not have any financial interest in the subject company. Also Research Analyst or his relative or HDFC
Securities Ltd. or its Associate may have beneficial ownership of 1% or more in the subject company at the end of the month immediately preceding the date of publication
of the Research Report. Further Research Analyst or his relative or HDFC Securities Ltd. or its associate does not have any material conflict of interest.
Any holding in stock –YES
HDFC Securities Limited (HSL) is a SEBI Registered Research Analyst having registration no. INH000002475.
Disclaimer:
This report has been prepared by HDFC Securities Ltd and is solely for information of the recipient only. The report must not be used as a singular basis of any investment
decision. The views herein are of a general nature and do not consider the risk appetite or the particular circumstances of an individual investor; readers are requested to
take professional advice before investing. Nothing in this document should be construed as investment advice. Each recipient of this document should make such
investigations as they deem necessary to arrive at an independent evaluation of an investment in securities of the companies referred to in this document (including merits
and risks) and should consult their own advisors to determine merits and risks of such investment. The information and opinions contained herein have been compiled or
arrived at, based upon information obtained in good faith from sources believed to be reliable. Such information has not been independently verified and no guaranty,
representation of warranty, express or implied, is made as to its accuracy, completeness or correctness. All such information and opinions are subject to change without
notice. Descriptions of any company or companies or their securities mentioned herein are not intended to be complete. HSL is not obliged to update this report for such
changes. HSL has the right to make changes and modifications at any time.
This report is not directed to, or intended for display, downloading, printing, reproducing or for distribution to or use by, any person or entity who is a citizen or resident
or located in any locality, state, country or other jurisdiction where such distribution, publication, reproduction, availability or use would be contrary to law or regulation
or what would subject HSL or its affiliates to any registration or licensing requirement within such jurisdiction.
If this report is inadvertently sent or has reached any person in such country, especially, United States of America, the same should be ignored and brought to the attention
of the sender. This document may not be reproduced, distributed or published in whole or in part, directly or indirectly, for any purposes or in any manner.
Foreign currencies denominated securities, wherever mentioned, are subject to exchange rate fluctuations, which could have an adverse effect on their value or price, or the
income derived from them. In addition, investors in securities such as ADRs, the values of which are influenced by foreign currencies effectively assume currency risk. It
should not be considered to be taken as an offer to sell or a solicitation to buy any security.
This document is not, and should not, be construed as an offer or solicitation of an offer, to buy or sell any securities or other financial instruments. This report should not
be construed as an invitation or solicitation to do business with HSL. HSL may from time to time solicit from, or perform broking, or other services for, any company
mentioned in this mail and/or its attachments.
HSL and its affiliated company(ies), their directors and employees may; (a) from time to time, have a long or short position in, and buy or sell the securities of the
company(ies) mentioned herein or (b) be engaged in any other transaction involving such securities and earn brokerage or other compensation or act as a market maker in
the financial instruments of the company(ies) discussed herein or act as an advisor or lender/borrower to such company(ies) or may have any other potential conflict of
interests with respect to any recommendation and other related information and opinions.
HSL, its directors, analysts or employees do not take any responsibility, financial or otherwise, of the losses or the damages sustained due to the investments made or any
action taken on basis of this report, including but not restricted to, fluctuation in the prices of shares and bonds, changes in the currency rates, diminution in the NAVs,
reduction in the dividend or income, etc.
HSL and other group companies, its directors, associates, employees may have various positions in any of the stocks, securities and financial instruments dealt in the report,
or may make sell or purchase or other deals in these securities from time to time or may deal in other securities of the companies / organizations described in this report.
HSL or its associates might have managed or co-managed public offering of securities for the subject company or might have been mandated by the subject company for
any other assignment in the past twelve months.
HSL or its associates might have received any compensation from the companies mentioned in the report during the period preceding twelve months from t date of this
report for services in respect of managing or co-managing public offerings, corporate finance, investment banking or merchant banking, brokerage services or other advisory
service in a merger or specific transaction in the normal course of business.
HSL or its analysts did not receive any compensation or other benefits from the companies mentioned in the report or third party in connection with preparation of the
research report. Accordingly, neither HSL nor Research Analysts have any material conflict of interest at the time of publication of this report. Compensation of our Research
Analysts is not based on any specific merchant banking, investment banking or brokerage service transactions. HSL may have issued other reports that are inconsistent with
and reach different conclusion from the information presented in this report.
Research entity has not been engaged in market making activity for the subject company. Research analyst has not served as an officer, director or employee of the subject
company. We have not received any compensation/benefits from the subject company or third party in connection with the Research Report.
HDFC securities Limited, I Think Techno Campus, Building - B, "Alpha", Office Floor 8, Near Kanjurmarg Station, Opp. Crompton Greaves, Kanjurmarg (East), Mumbai
400 042 Phone: (022) 3075 3400 Fax: (022) 2496 5066 Compliance Officer: Binkle R. Oza Email: [email protected] Phone: (022) 3045 3600 HDFC Securities
Limited, SEBI Reg. No.: NSE, BSE, MSEI, MCX: INZ000186937; AMFI Reg. No. ARN: 13549; PFRDA Reg. No. POP: 11092018; IRDA Corporate Agent License No.:
CA0062; SEBI Research Analyst Reg. No.: INH000002475; SEBI Investment Adviser Reg. No.: INA000011538; CIN - U67120MH2000PLC152193
Rating Criteria
BUY: >+15% return potential
ADD: +5% to +15% return potential
REDUCE: -10% to +5% return potential
SELL: > 10% Downside return potential