1-00 bahasa fr cover, map, photos, contents, appendix sepa...
TRANSCRIPT
Apendiks

A - 1
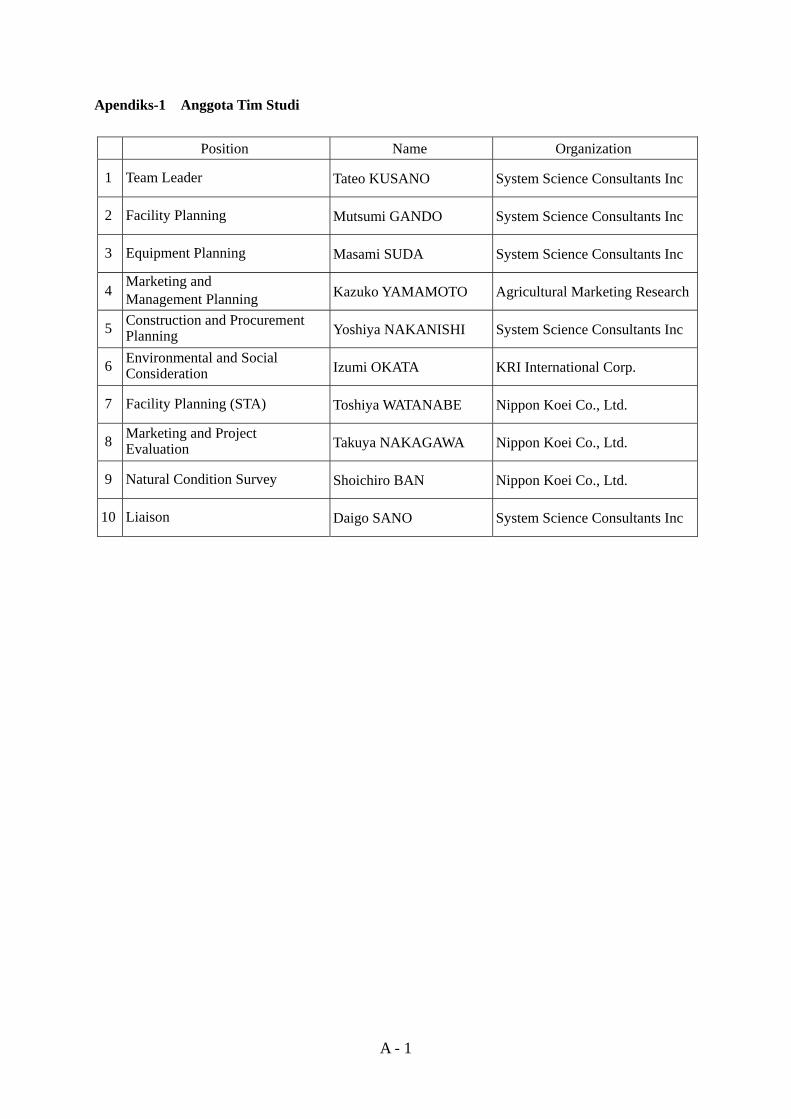
Apendiks-1 Anggota Tim Studi
Position Name Organization
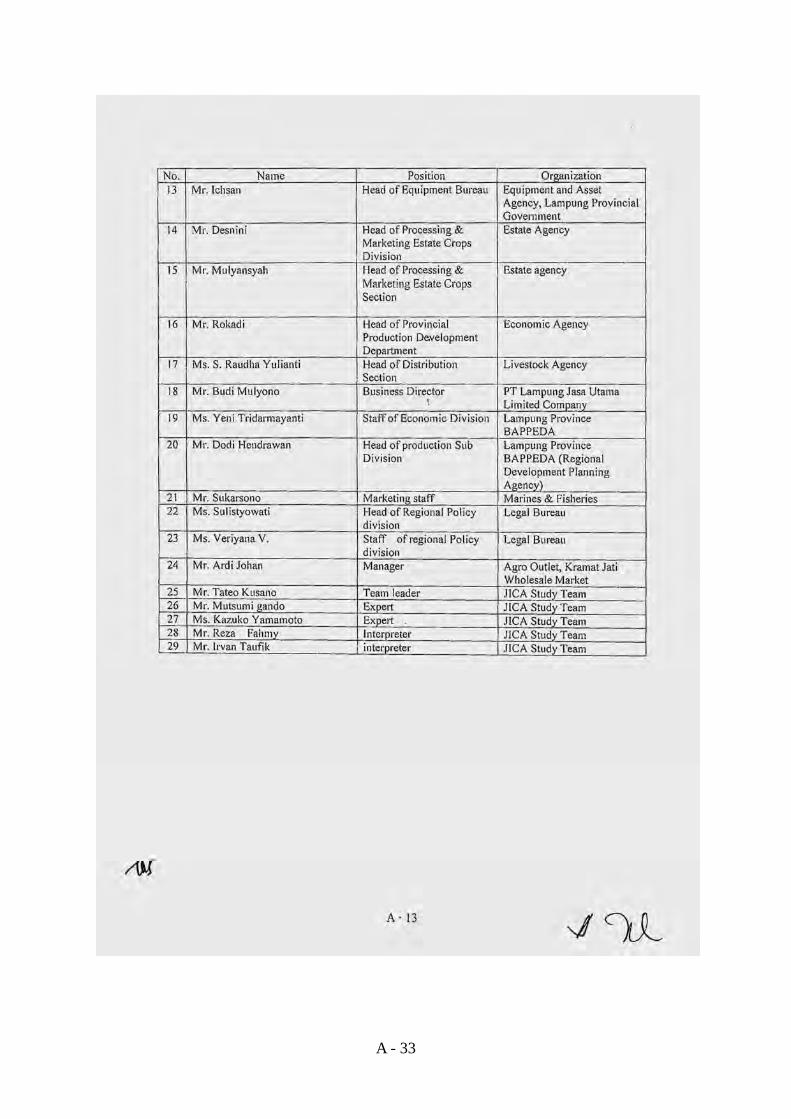
1 Team Leader Tateo KUSANO System Science Consultants Inc
2 Facility Planning Mutsumi GANDO System Science Consultants Inc
3 Equipment Planning Masami SUDA System Science Consultants Inc
4 Marketing and Management Planning Kazuko YAMAMOTO Agricultural Marketing Research
5 Construction and Procurement Planning Yoshiya NAKANISHI System Science Consultants Inc
6 Environmental and Social Consideration Izumi OKATA KRI International Corp.
7 Facility Planning (STA) Toshiya WATANABE Nippon Koei Co., Ltd.
8 Marketing and Project Evaluation Takuya NAKAGAWA Nippon Koei Co., Ltd.
9 Natural Condition Survey Shoichiro BAN Nippon Koei Co., Ltd.
10 Liaison Daigo SANO System Science Consultants Inc
A - 2
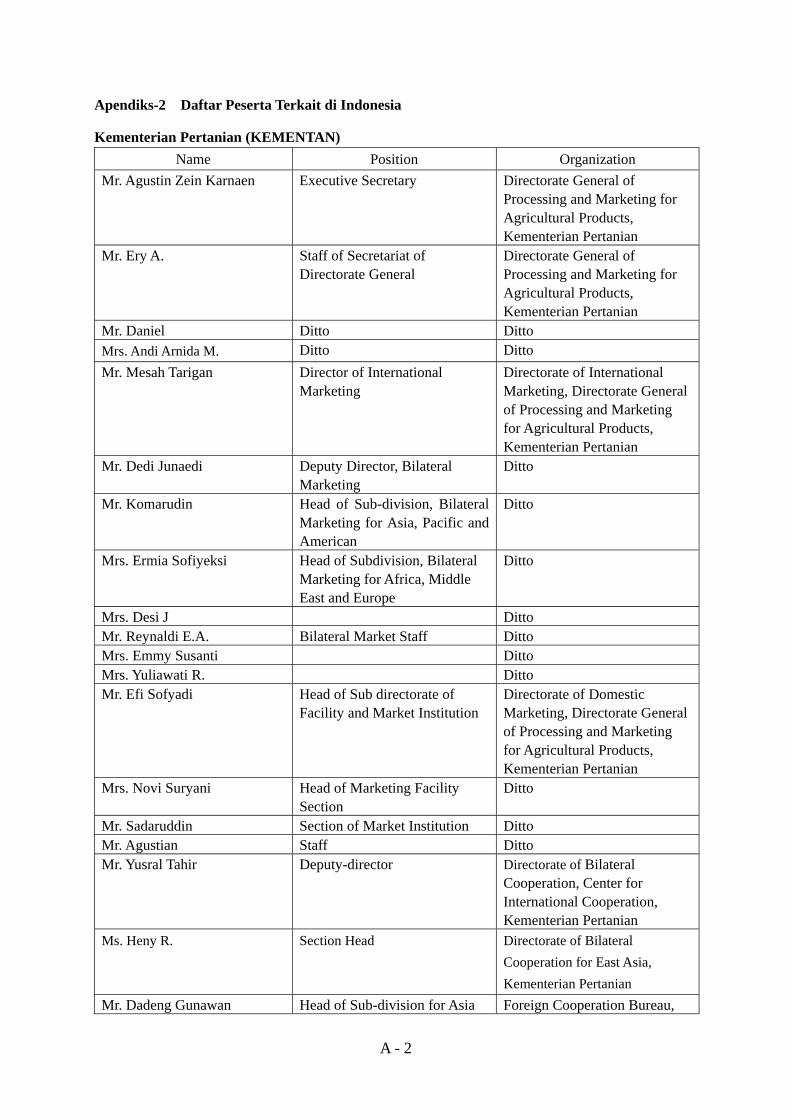
Apendiks-2 Daftar Peserta Terkait di Indonesia Kementerian Pertanian (KEMENTAN)
Name Position Organization Mr. Agustin Zein Karnaen Executive Secretary Directorate General of
Processing and Marketing for Agricultural Products, Kementerian Pertanian
Mr. Ery A. Staff of Secretariat of Directorate General
Directorate General of Processing and Marketing for Agricultural Products, Kementerian Pertanian
Mr. Daniel Ditto Ditto Mrs. Andi Arnida M. Ditto Ditto Mr. Mesah Tarigan Director of International
Marketing Directorate of International Marketing, Directorate General of Processing and Marketing for Agricultural Products, Kementerian Pertanian
Mr. Dedi Junaedi Deputy Director, Bilateral Marketing
Ditto
Mr. Komarudin Head of Sub-division, Bilateral Marketing for Asia, Pacific and American
Ditto
Mrs. Ermia Sofiyeksi Head of Subdivision, Bilateral Marketing for Africa, Middle East and Europe
Ditto
Mrs. Desi J Ditto Mr. Reynaldi E.A. Bilateral Market Staff Ditto Mrs. Emmy Susanti Ditto Mrs. Yuliawati R. Ditto Mr. Efi Sofyadi Head of Sub directorate of
Facility and Market Institution Directorate of Domestic Marketing, Directorate General of Processing and Marketing for Agricultural Products, Kementerian Pertanian
Mrs. Novi Suryani Head of Marketing Facility Section
Ditto
Mr. Sadaruddin Section of Market Institution Ditto Mr. Agustian Staff Ditto Mr. Yusral Tahir Deputy-director Directorate of Bilateral
Cooperation, Center for International Cooperation, Kementerian Pertanian
Ms. Heny R. Section Head Directorate of Bilateral Cooperation for East Asia, Kementerian Pertanian
Mr. Dadeng Gunawan Head of Sub-division for Asia Foreign Cooperation Bureau,
A - 3
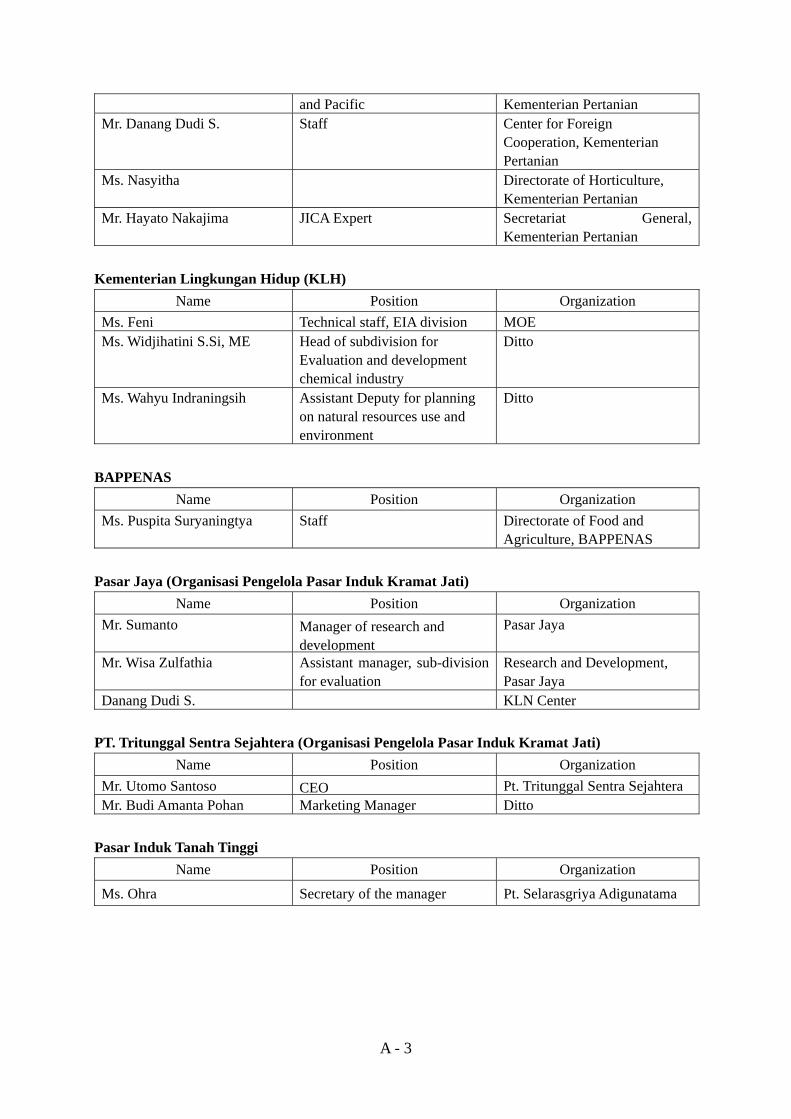
and Pacific Kementerian Pertanian Mr. Danang Dudi S. Staff Center for Foreign
Cooperation, Kementerian Pertanian
Ms. Nasyitha Directorate of Horticulture, Kementerian Pertanian
Mr. Hayato Nakajima JICA Expert Secretariat General, Kementerian Pertanian
Kementerian Lingkungan Hidup (KLH)
Name Position Organization Ms. Feni Technical staff, EIA division MOE Ms. Widjihatini S.Si, ME Head of subdivision for
Evaluation and development chemical industry
Ditto
Ms. Wahyu Indraningsih Assistant Deputy for planning on natural resources use and environment
Ditto
BAPPENAS
Name Position Organization Ms. Puspita Suryaningtya Staff Directorate of Food and
Agriculture, BAPPENAS Pasar Jaya (Organisasi Pengelola Pasar Induk Kramat Jati)
Name Position Organization Mr. Sumanto Manager of research and
developmentPasar Jaya
Mr. Wisa Zulfathia Assistant manager, sub-division for evaluation
Research and Development, Pasar Jaya
Danang Dudi S. KLN Center PT. Tritunggal Sentra Sejahtera (Organisasi Pengelola Pasar Induk Kramat Jati)
Name Position Organization Mr. Utomo Santoso CEO Pt. Tritunggal Sentra Sejahtera Mr. Budi Amanta Pohan Marketing Manager Ditto
Pasar Induk Tanah Tinggi
Name Position Organization
Ms. Ohra Secretary of the manager Pt. Selarasgriya Adigunatama
A - 4
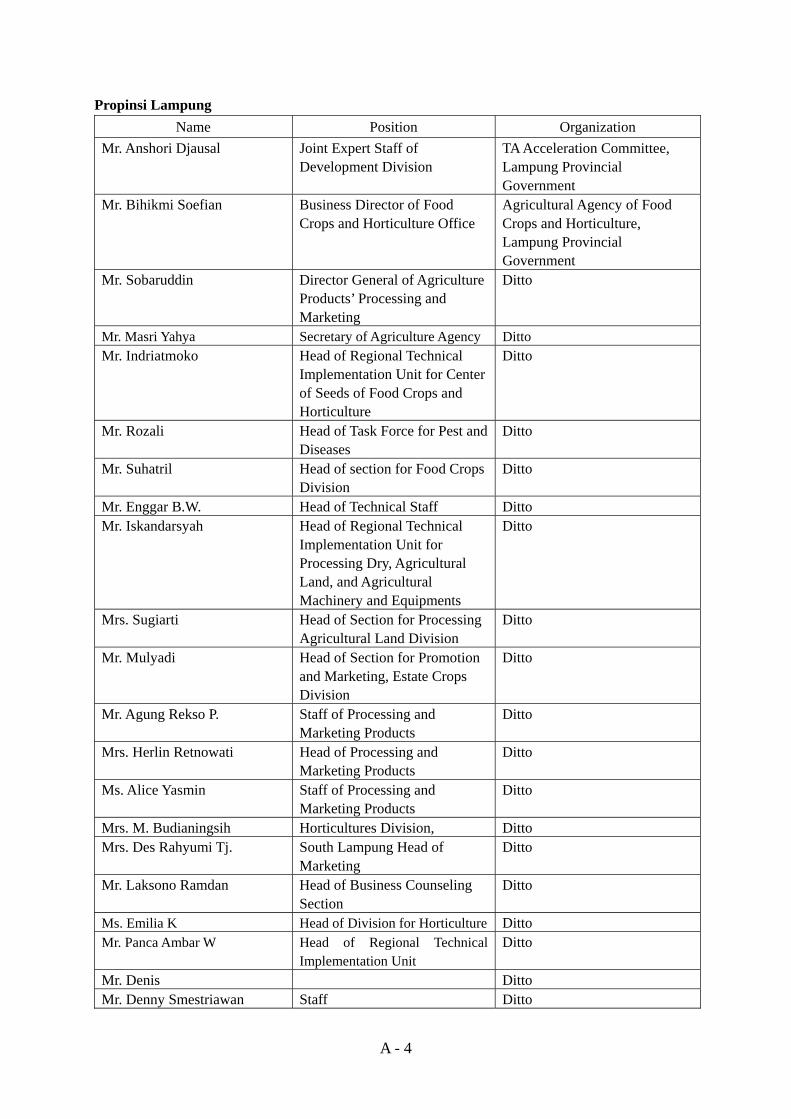
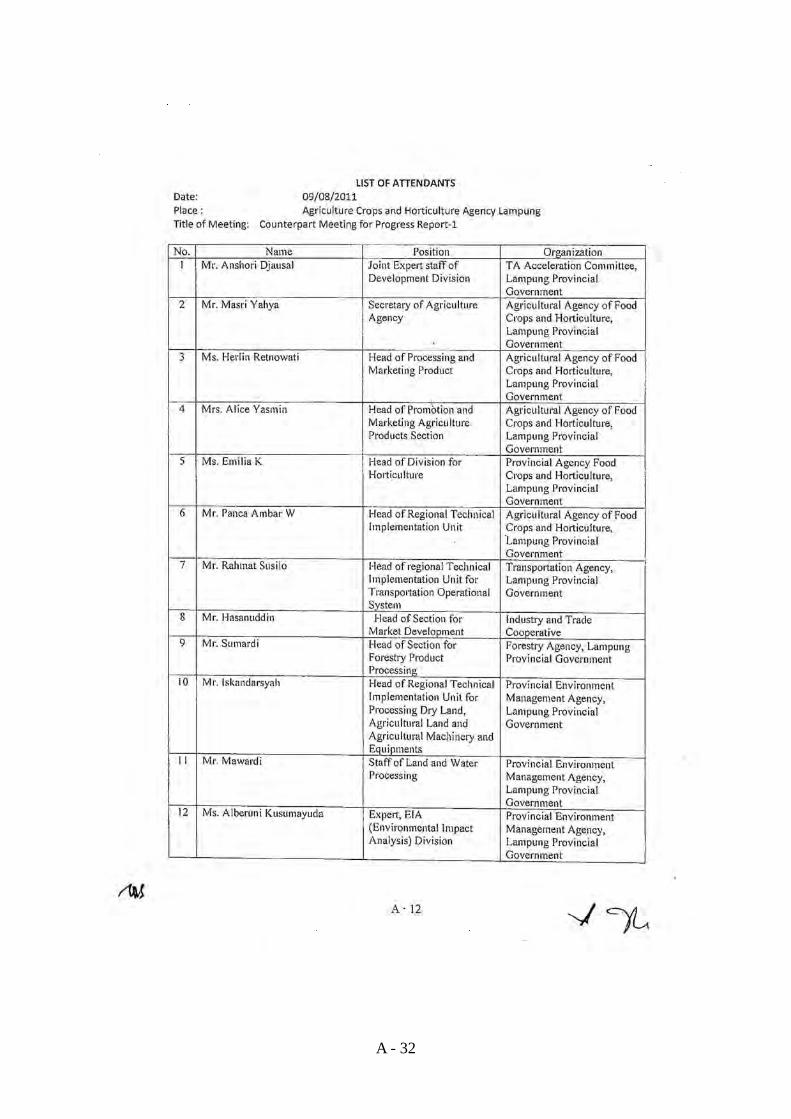
Propinsi Lampung Name Position Organization
Mr. Anshori Djausal Joint Expert Staff of Development Division
TA Acceleration Committee, Lampung Provincial Government
Mr. Bihikmi Soefian Business Director of Food Crops and Horticulture Office
Agricultural Agency of Food Crops and Horticulture, Lampung Provincial Government
Mr. Sobaruddin Director General of Agriculture Products’ Processing and Marketing
Ditto
Mr. Masri Yahya Secretary of Agriculture Agency Ditto Mr. Indriatmoko Head of Regional Technical
Implementation Unit for Center of Seeds of Food Crops and Horticulture
Ditto
Mr. Rozali Head of Task Force for Pest and Diseases
Ditto
Mr. Suhatril Head of section for Food Crops Division
Ditto
Mr. Enggar B.W. Head of Technical Staff Ditto Mr. Iskandarsyah Head of Regional Technical
Implementation Unit for Processing Dry, Agricultural Land, and Agricultural Machinery and Equipments
Ditto
Mrs. Sugiarti Head of Section for Processing Agricultural Land Division
Ditto
Mr. Mulyadi Head of Section for Promotion and Marketing, Estate Crops Division
Ditto
Mr. Agung Rekso P. Staff of Processing and Marketing Products
Ditto
Mrs. Herlin Retnowati Head of Processing and Marketing Products
Ditto
Ms. Alice Yasmin Staff of Processing and Marketing Products
Ditto
Mrs. M. Budianingsih Horticultures Division, Ditto Mrs. Des Rahyumi Tj. South Lampung Head of
Marketing Ditto
Mr. Laksono Ramdan Head of Business Counseling Section
Ditto
Ms. Emilia K Head of Division for Horticulture Ditto Mr. Panca Ambar W Head of Regional Technical
Implementation Unit Ditto
Mr. Denis Ditto Mr. Denny Smestriawan Staff Ditto
A - 5
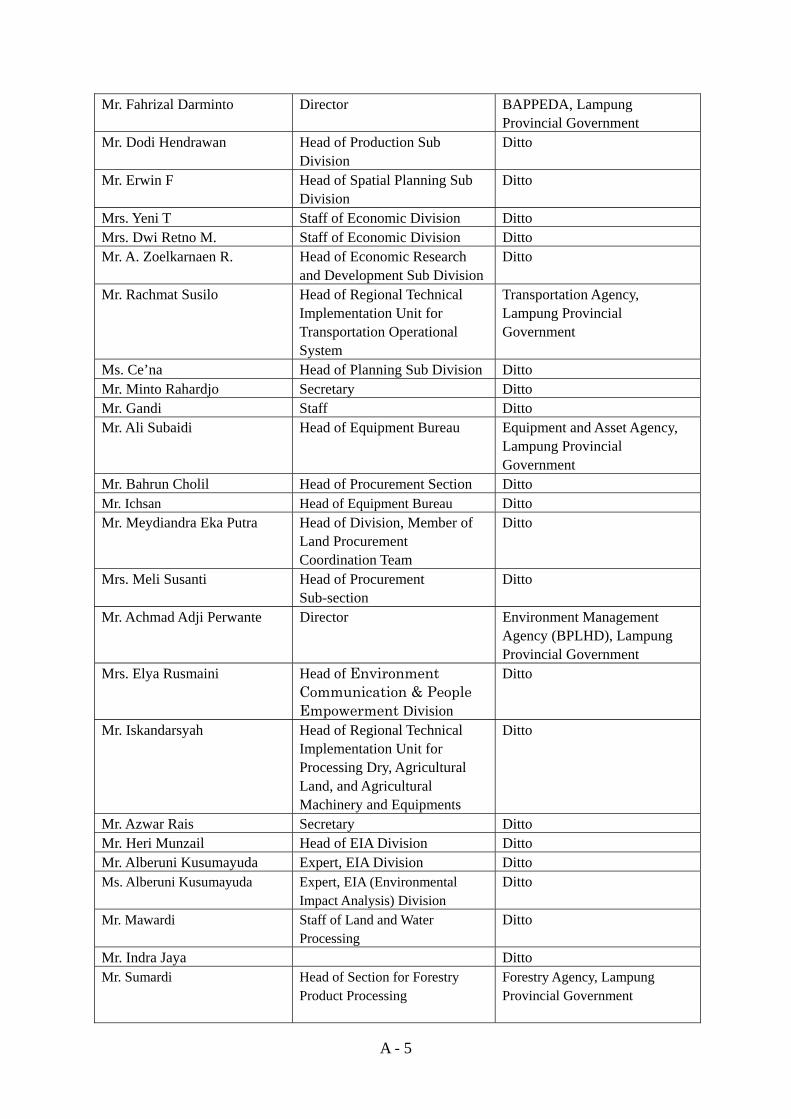
Mr. Fahrizal Darminto Director BAPPEDA, Lampung Provincial Government
Mr. Dodi Hendrawan Head of Production Sub Division
Ditto
Mr. Erwin F Head of Spatial Planning Sub Division
Ditto
Mrs. Yeni T Staff of Economic Division Ditto Mrs. Dwi Retno M. Staff of Economic Division Ditto Mr. A. Zoelkarnaen R. Head of Economic Research
and Development Sub DivisionDitto
Mr. Rachmat Susilo Head of Regional Technical Implementation Unit for Transportation Operational System
Transportation Agency, Lampung Provincial Government
Ms. Ce’na Head of Planning Sub Division Ditto Mr. Minto Rahardjo Secretary Ditto Mr. Gandi Staff Ditto Mr. Ali Subaidi Head of Equipment Bureau Equipment and Asset Agency,
Lampung Provincial Government
Mr. Bahrun Cholil Head of Procurement Section Ditto Mr. Ichsan Head of Equipment Bureau Ditto Mr. Meydiandra Eka Putra Head of Division, Member of
Land Procurement Coordination Team
Ditto
Mrs. Meli Susanti Head of Procurement Sub-section
Ditto
Mr. Achmad Adji Perwante Director Environment Management Agency (BPLHD), Lampung Provincial Government
Mrs. Elya Rusmaini Head of Environment Communication & People Empowerment Division
Ditto
Mr. Iskandarsyah Head of Regional Technical Implementation Unit for Processing Dry, Agricultural Land, and Agricultural Machinery and Equipments
Ditto
Mr. Azwar Rais Secretary Ditto Mr. Heri Munzail Head of EIA Division Ditto Mr. Alberuni Kusumayuda Expert, EIA Division Ditto Ms. Alberuni Kusumayuda Expert, EIA (Environmental
Impact Analysis) Division Ditto
Mr. Mawardi Staff of Land and Water Processing
Ditto
Mr. Indra Jaya Ditto Mr. Sumardi Head of Section for Forestry
Product Processing
Forestry Agency, Lampung Provincial Government
A - 6
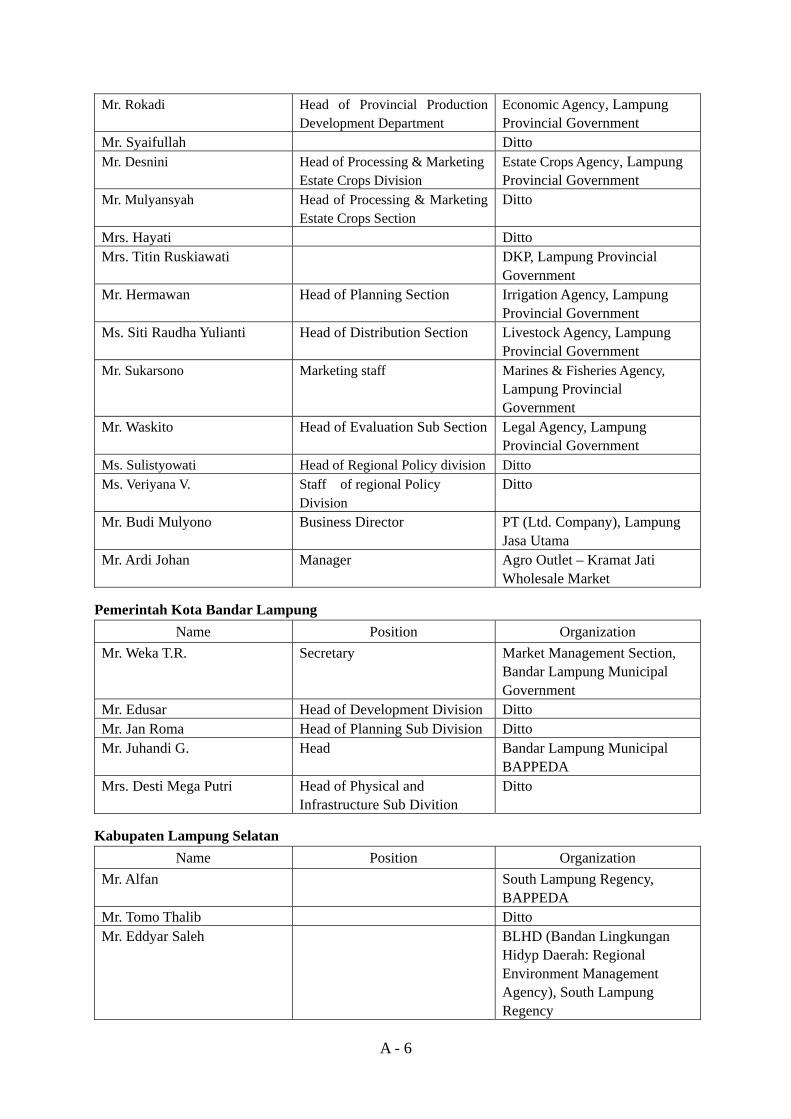
Mr. Rokadi Head of Provincial Production Development Department
Economic Agency, Lampung Provincial Government
Mr. Syaifullah Ditto Mr. Desnini Head of Processing & Marketing
Estate Crops Division Estate Crops Agency, Lampung Provincial Government
Mr. Mulyansyah Head of Processing & Marketing Estate Crops Section
Ditto
Mrs. Hayati Ditto Mrs. Titin Ruskiawati DKP, Lampung Provincial
Government Mr. Hermawan Head of Planning Section Irrigation Agency, Lampung
Provincial Government Ms. Siti Raudha Yulianti Head of Distribution Section Livestock Agency, Lampung
Provincial Government Mr. Sukarsono Marketing staff Marines & Fisheries Agency,
Lampung Provincial Government
Mr. Waskito Head of Evaluation Sub Section Legal Agency, Lampung Provincial Government
Ms. Sulistyowati Head of Regional Policy division Ditto Ms. Veriyana V. Staff of regional Policy
Division Ditto
Mr. Budi Mulyono Business Director PT (Ltd. Company), Lampung Jasa Utama
Mr. Ardi Johan Manager Agro Outlet – Kramat Jati Wholesale Market
Pemerintah Kota Bandar Lampung
Name Position Organization Mr. Weka T.R. Secretary Market Management Section,
Bandar Lampung Municipal Government
Mr. Edusar Head of Development Division Ditto Mr. Jan Roma Head of Planning Sub Division Ditto Mr. Juhandi G. Head Bandar Lampung Municipal
BAPPEDA Mrs. Desti Mega Putri Head of Physical and
Infrastructure Sub Divition Ditto
Kabupaten Lampung Selatan
Name Position Organization Mr. Alfan South Lampung Regency,
BAPPEDA Mr. Tomo Thalib Ditto Mr. Eddyar Saleh BLHD (Bandan Lingkungan
Hidyp Daerah: Regional Environment Management Agency), South Lampung Regency
A - 7
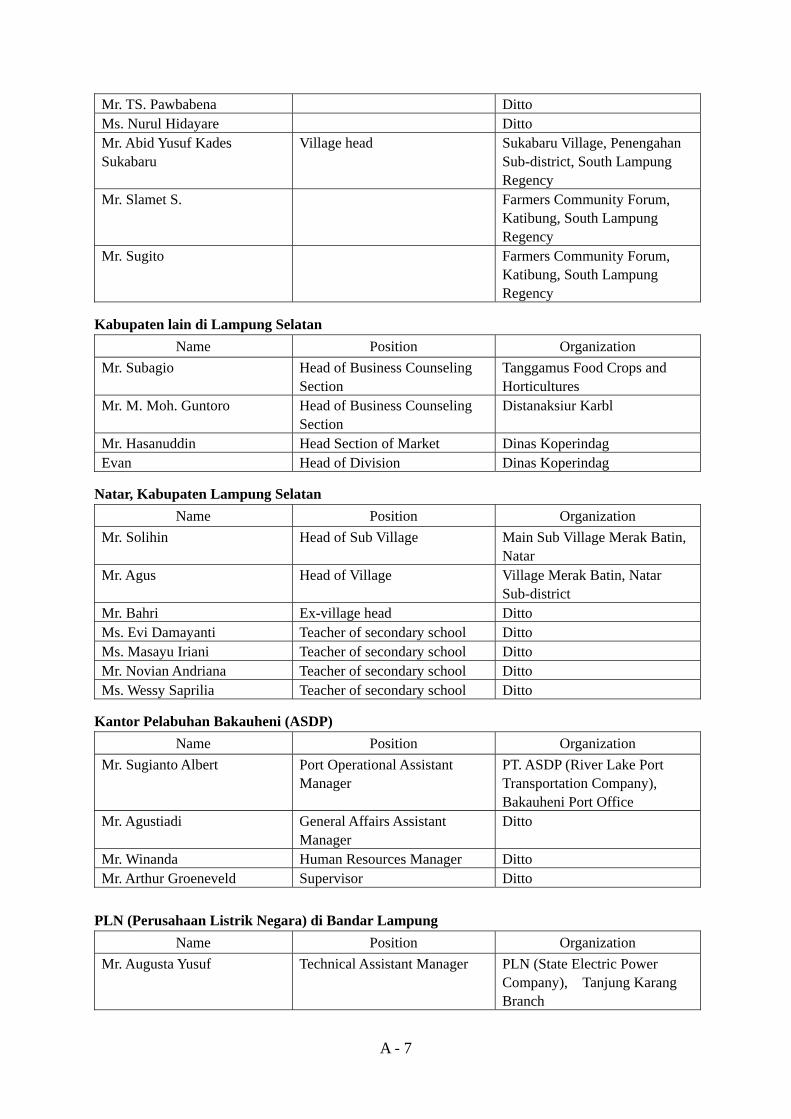
Mr. TS. Pawbabena Ditto Ms. Nurul Hidayare Ditto Mr. Abid Yusuf Kades Sukabaru
Village head Sukabaru Village, Penengahan Sub-district, South Lampung Regency
Mr. Slamet S. Farmers Community Forum, Katibung, South Lampung Regency
Mr. Sugito Farmers Community Forum, Katibung, South Lampung Regency
Kabupaten lain di Lampung Selatan
Name Position Organization Mr. Subagio Head of Business Counseling
Section Tanggamus Food Crops and Horticultures
Mr. M. Moh. Guntoro Head of Business Counseling Section
Distanaksiur Karbl
Mr. Hasanuddin Head Section of Market Dinas Koperindag Evan Head of Division Dinas Koperindag
Natar, Kabupaten Lampung Selatan
Name Position Organization Mr. Solihin Head of Sub Village Main Sub Village Merak Batin,
Natar Mr. Agus Head of Village Village Merak Batin, Natar
Sub-district Mr. Bahri Ex-village head Ditto Ms. Evi Damayanti Teacher of secondary school Ditto Ms. Masayu Iriani Teacher of secondary school Ditto Mr. Novian Andriana Teacher of secondary school Ditto Ms. Wessy Saprilia Teacher of secondary school Ditto
Kantor Pelabuhan Bakauheni (ASDP)
Name Position Organization Mr. Sugianto Albert Port Operational Assistant
Manager PT. ASDP (River Lake Port Transportation Company), Bakauheni Port Office
Mr. Agustiadi General Affairs Assistant Manager
Ditto
Mr. Winanda Human Resources Manager Ditto Mr. Arthur Groeneveld Supervisor Ditto
PLN (Perusahaan Listrik Negara) di Bandar Lampung
Name Position Organization Mr. Augusta Yusuf Technical Assistant Manager PLN (State Electric Power
Company), Tanjung Karang Branch
A - 8
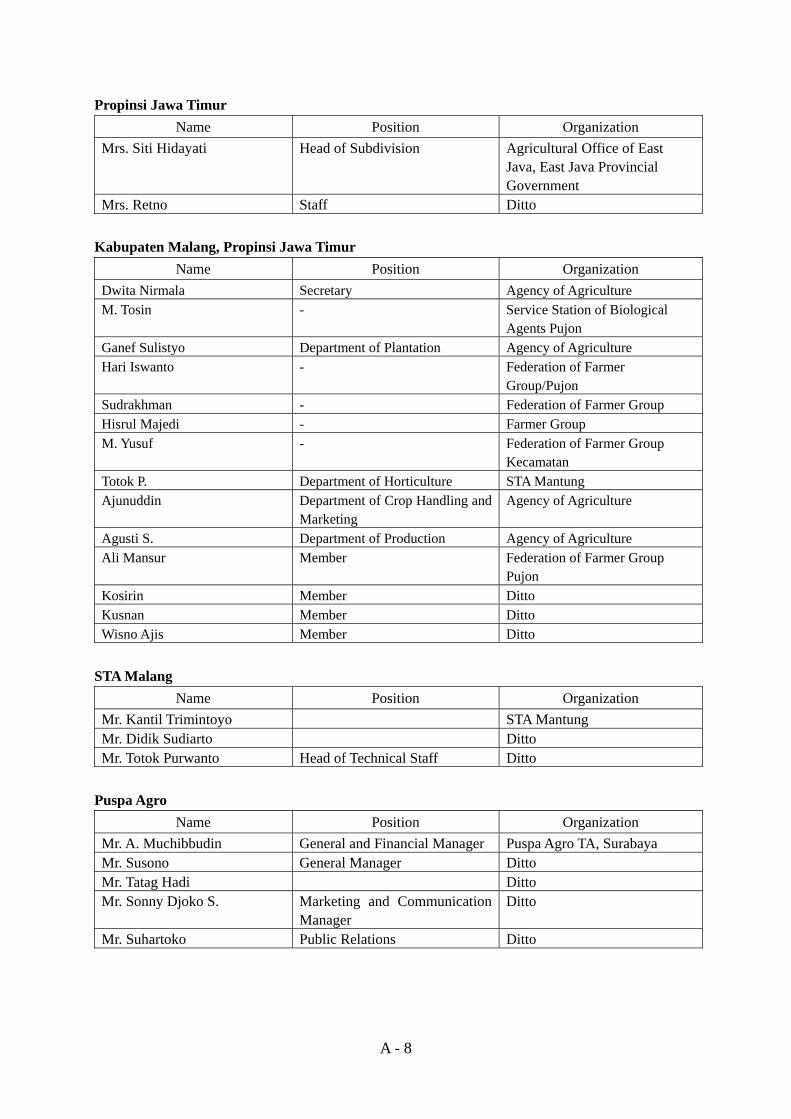
Propinsi Jawa Timur Name Position Organization
Mrs. Siti Hidayati Head of Subdivision Agricultural Office of East Java, East Java Provincial Government
Mrs. Retno Staff Ditto Kabupaten Malang, Propinsi Jawa Timur
Name Position Organization Dwita Nirmala Secretary Agency of Agriculture M. Tosin - Service Station of Biological
Agents Pujon Ganef Sulistyo Department of Plantation Agency of Agriculture Hari Iswanto - Federation of Farmer
Group/Pujon Sudrakhman - Federation of Farmer Group Hisrul Majedi - Farmer Group M. Yusuf - Federation of Farmer Group
Kecamatan Totok P. Department of Horticulture STA Mantung Ajunuddin Department of Crop Handling and
Marketing Agency of Agriculture
Agusti S. Department of Production Agency of Agriculture Ali Mansur Member Federation of Farmer Group
Pujon Kosirin Member Ditto Kusnan Member Ditto Wisno Ajis Member Ditto
STA Malang
Name Position Organization Mr. Kantil Trimintoyo STA Mantung Mr. Didik Sudiarto Ditto Mr. Totok Purwanto Head of Technical Staff Ditto
Puspa Agro
Name Position Organization Mr. A. Muchibbudin General and Financial Manager Puspa Agro TA, Surabaya Mr. Susono General Manager Ditto Mr. Tatag Hadi Ditto Mr. Sonny Djoko S. Marketing and Communication
Manager Ditto
Mr. Suhartoko Public Relations Ditto
A - 9
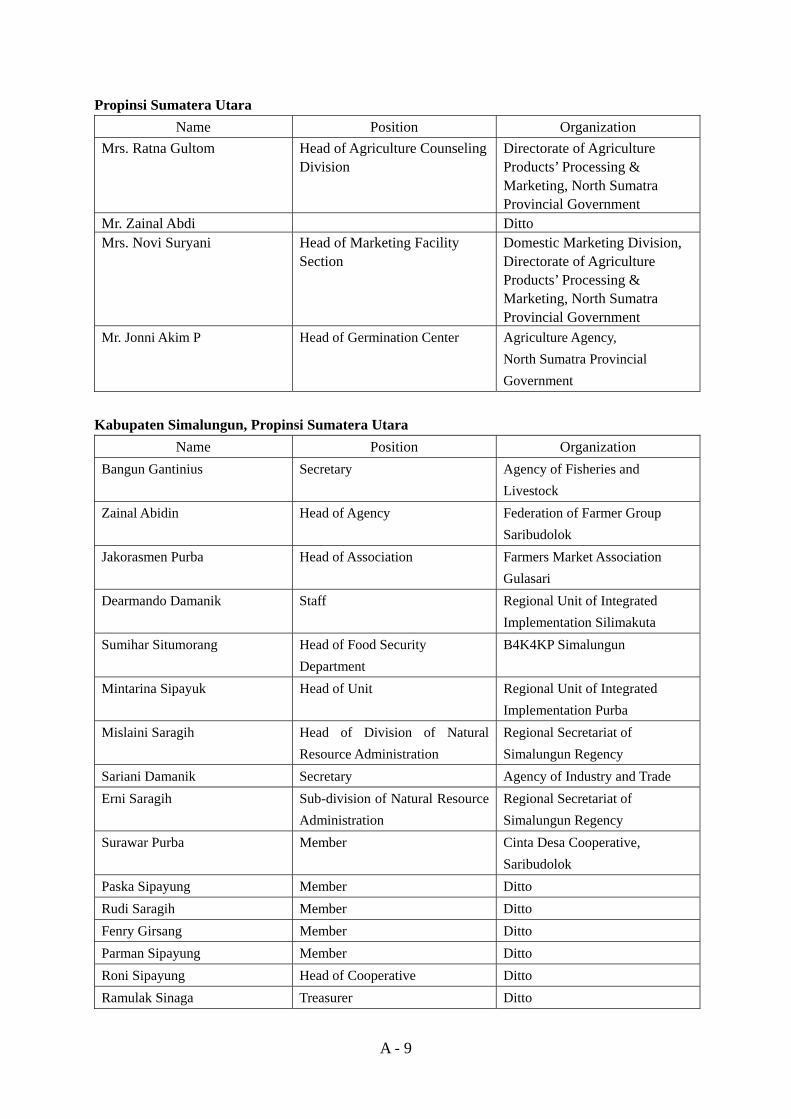
Propinsi Sumatera Utara Name Position Organization
Mrs. Ratna Gultom Head of Agriculture Counseling Division
Directorate of Agriculture Products’ Processing & Marketing, North Sumatra Provincial Government
Mr. Zainal Abdi Ditto Mrs. Novi Suryani Head of Marketing Facility
Section Domestic Marketing Division, Directorate of Agriculture Products’ Processing & Marketing, North Sumatra Provincial Government
Mr. Jonni Akim P Head of Germination Center Agriculture Agency, North Sumatra Provincial Government
Kabupaten Simalungun, Propinsi Sumatera Utara
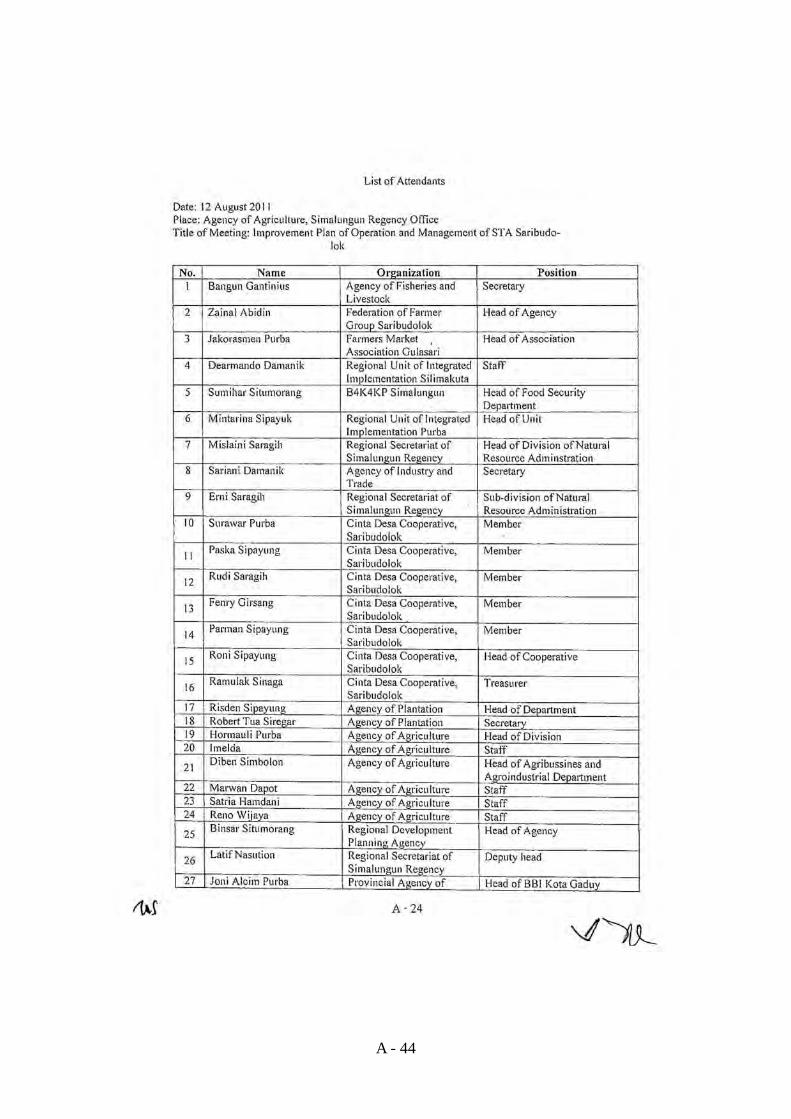
Name Position Organization Bangun Gantinius Secretary Agency of Fisheries and
Livestock Zainal Abidin Head of Agency Federation of Farmer Group
Saribudolok Jakorasmen Purba Head of Association Farmers Market Association
Gulasari Dearmando Damanik Staff Regional Unit of Integrated
Implementation Silimakuta Sumihar Situmorang Head of Food Security
Department B4K4KP Simalungun
Mintarina Sipayuk Head of Unit Regional Unit of Integrated Implementation Purba
Mislaini Saragih Head of Division of Natural Resource Administration
Regional Secretariat of Simalungun Regency
Sariani Damanik Secretary Agency of Industry and Trade Erni Saragih Sub-division of Natural Resource
Administration Regional Secretariat of Simalungun Regency
Surawar Purba Member Cinta Desa Cooperative, Saribudolok
Paska Sipayung Member Ditto Rudi Saragih Member Ditto Fenry Girsang Member Ditto Parman Sipayung Member Ditto Roni Sipayung Head of Cooperative Ditto Ramulak Sinaga Treasurer Ditto
A - 10
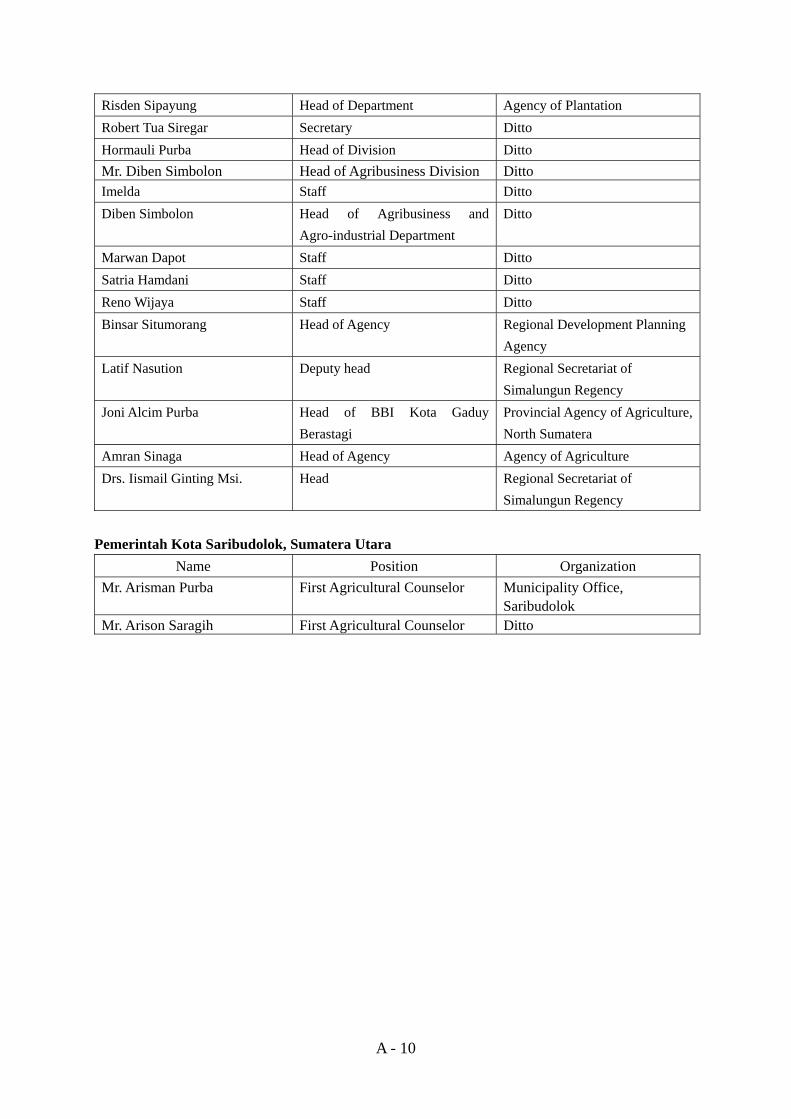
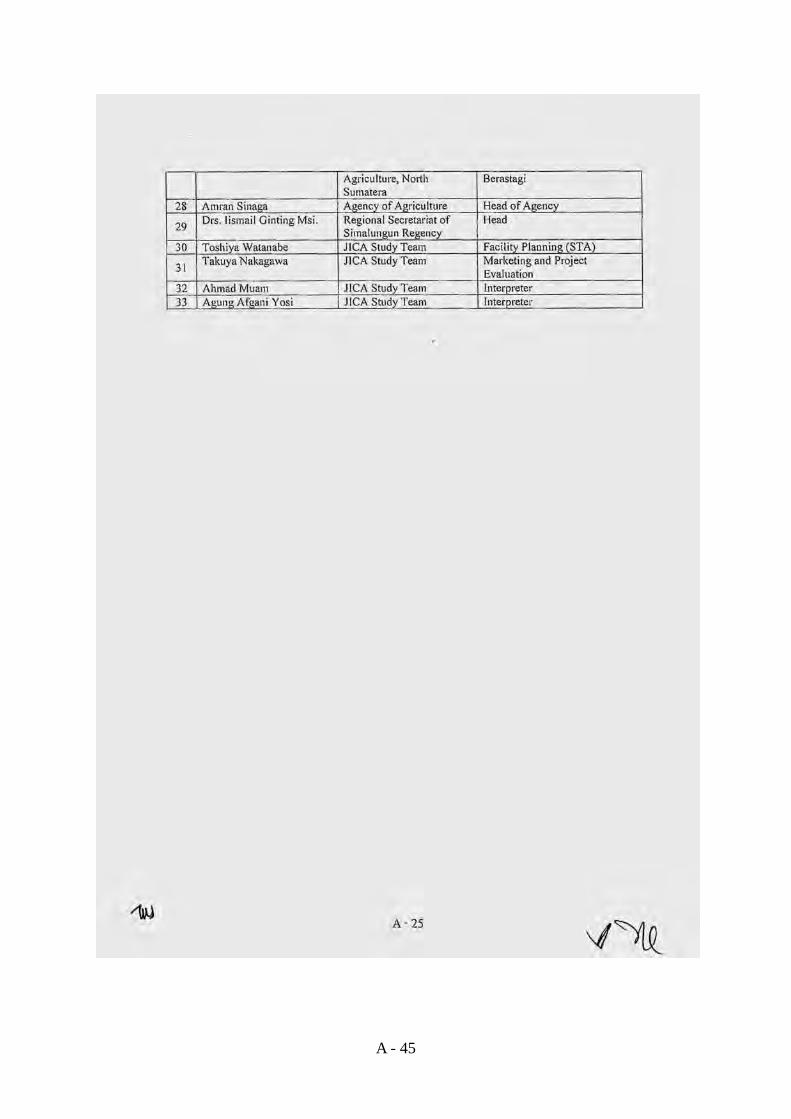
Risden Sipayung Head of Department Agency of Plantation Robert Tua Siregar Secretary Ditto Hormauli Purba Head of Division Ditto Mr. Diben Simbolon Head of Agribusiness Division Ditto Imelda Staff Ditto Diben Simbolon Head of Agribusiness and
Agro-industrial Department Ditto
Marwan Dapot Staff Ditto Satria Hamdani Staff Ditto Reno Wijaya Staff Ditto Binsar Situmorang Head of Agency Regional Development Planning
Agency Latif Nasution Deputy head Regional Secretariat of
Simalungun Regency Joni Alcim Purba Head of BBI Kota Gaduy
Berastagi Provincial Agency of Agriculture, North Sumatera
Amran Sinaga Head of Agency Agency of Agriculture Drs. Iismail Ginting Msi. Head Regional Secretariat of
Simalungun Regency Pemerintah Kota Saribudolok, Sumatera Utara
Name Position Organization Mr. Arisman Purba First Agricultural Counselor Municipality Office,
Saribudolok Mr. Arison Saragih First Agricultural Counselor Ditto
A - 11
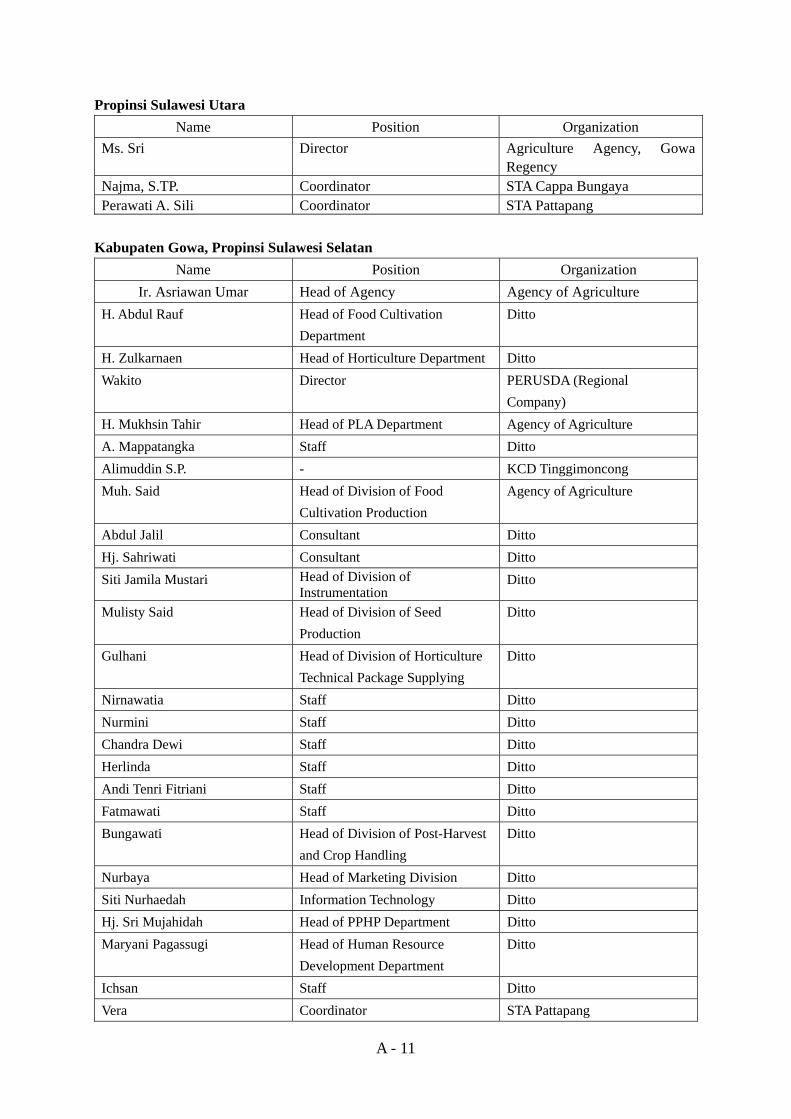
Propinsi Sulawesi Utara Name Position Organization
Ms. Sri Director Agriculture Agency, Gowa Regency
Najma, S.TP. Coordinator STA Cappa Bungaya Perawati A. Sili Coordinator STA Pattapang
Kabupaten Gowa, Propinsi Sulawesi Selatan
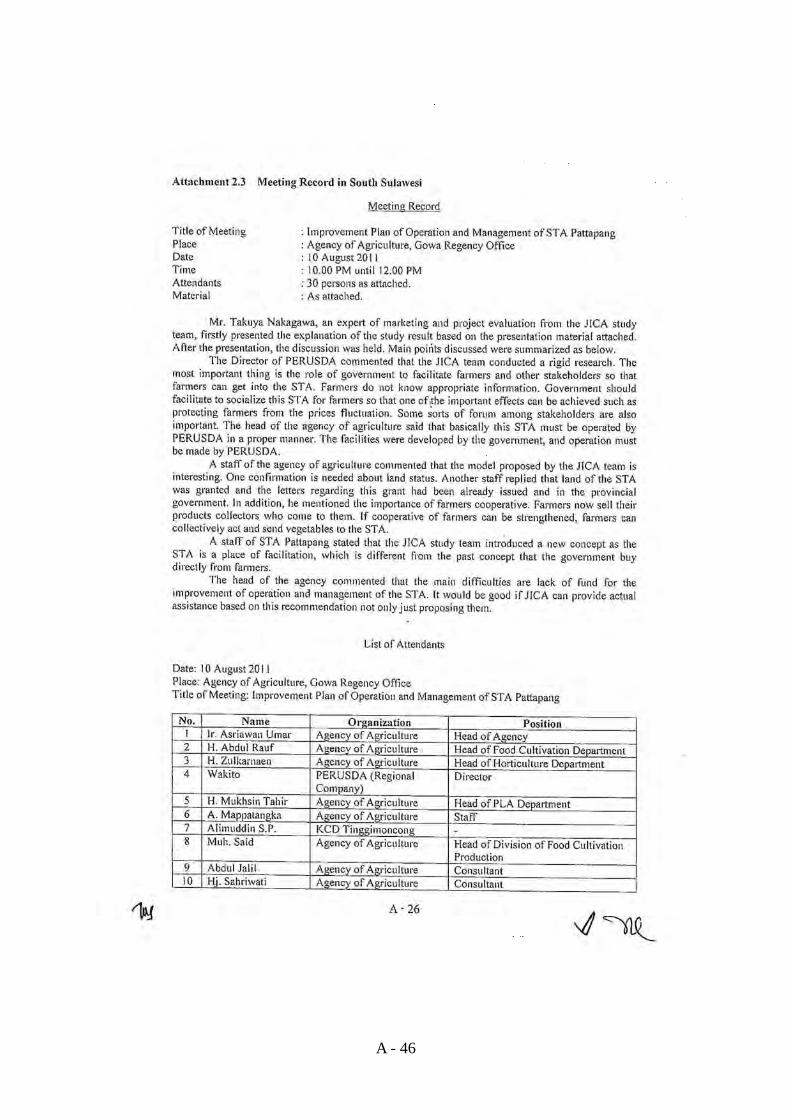
Name Position Organization Ir. Asriawan Umar Head of Agency Agency of Agriculture
H. Abdul Rauf Head of Food Cultivation Department
Ditto
H. Zulkarnaen Head of Horticulture Department Ditto Wakito Director PERUSDA (Regional
Company) H. Mukhsin Tahir Head of PLA Department Agency of Agriculture A. Mappatangka Staff Ditto Alimuddin S.P. - KCD Tinggimoncong Muh. Said Head of Division of Food
Cultivation Production Agency of Agriculture
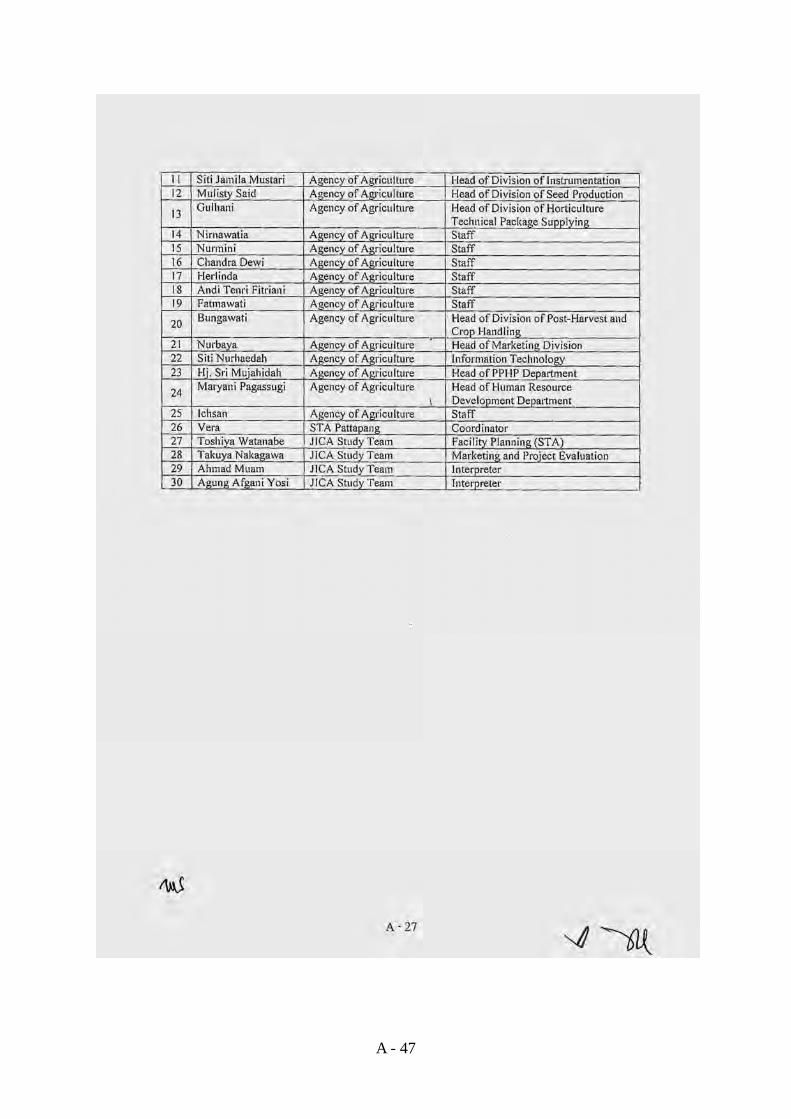
Abdul Jalil Consultant Ditto Hj. Sahriwati Consultant Ditto Siti Jamila Mustari Head of Division of
Instrumentation Ditto
Mulisty Said Head of Division of Seed Production
Ditto
Gulhani Head of Division of Horticulture Technical Package Supplying
Ditto
Nirnawatia Staff Ditto Nurmini Staff Ditto Chandra Dewi Staff Ditto Herlinda Staff Ditto Andi Tenri Fitriani Staff Ditto Fatmawati Staff Ditto Bungawati Head of Division of Post-Harvest
and Crop Handling Ditto
Nurbaya Head of Marketing Division Ditto Siti Nurhaedah Information Technology Ditto Hj. Sri Mujahidah Head of PPHP Department Ditto Maryani Pagassugi Head of Human Resource
Development Department Ditto
Ichsan Staff Ditto Vera Coordinator STA Pattapang
A - 12
Kedutaan Jepang
Name Position Organization Mr. Toru Senba First Secretary Embassy of Japan in Indonesia
Kantor JICA Indonesia
Name Position Organization Mr. Jitsuya Ishiguro Senior Representative JICA Indonesia Office Ms. Mari Miura Representative Ditto
A - 13
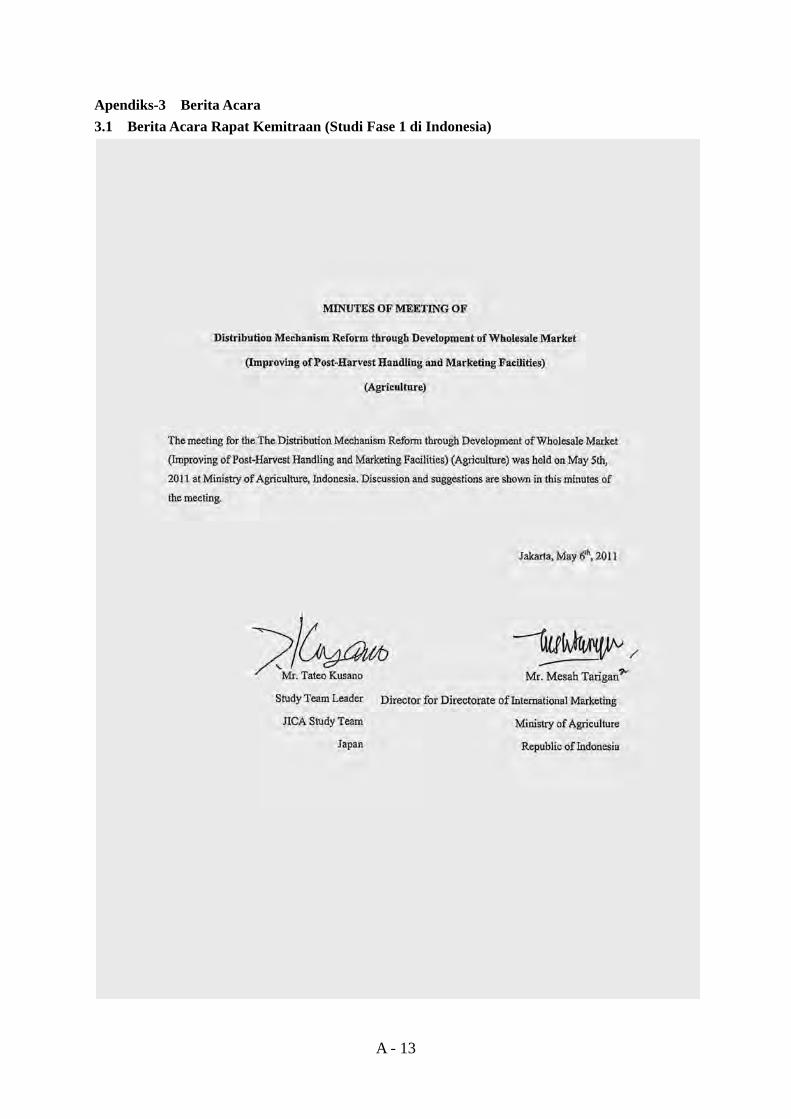
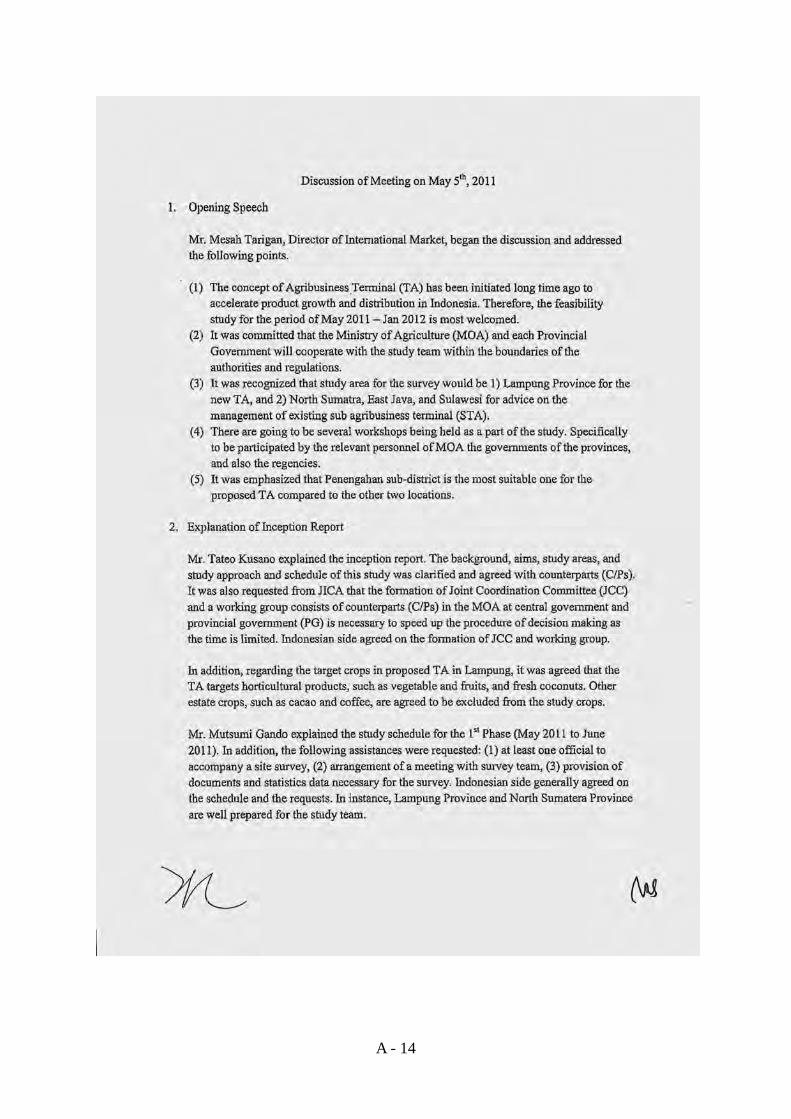
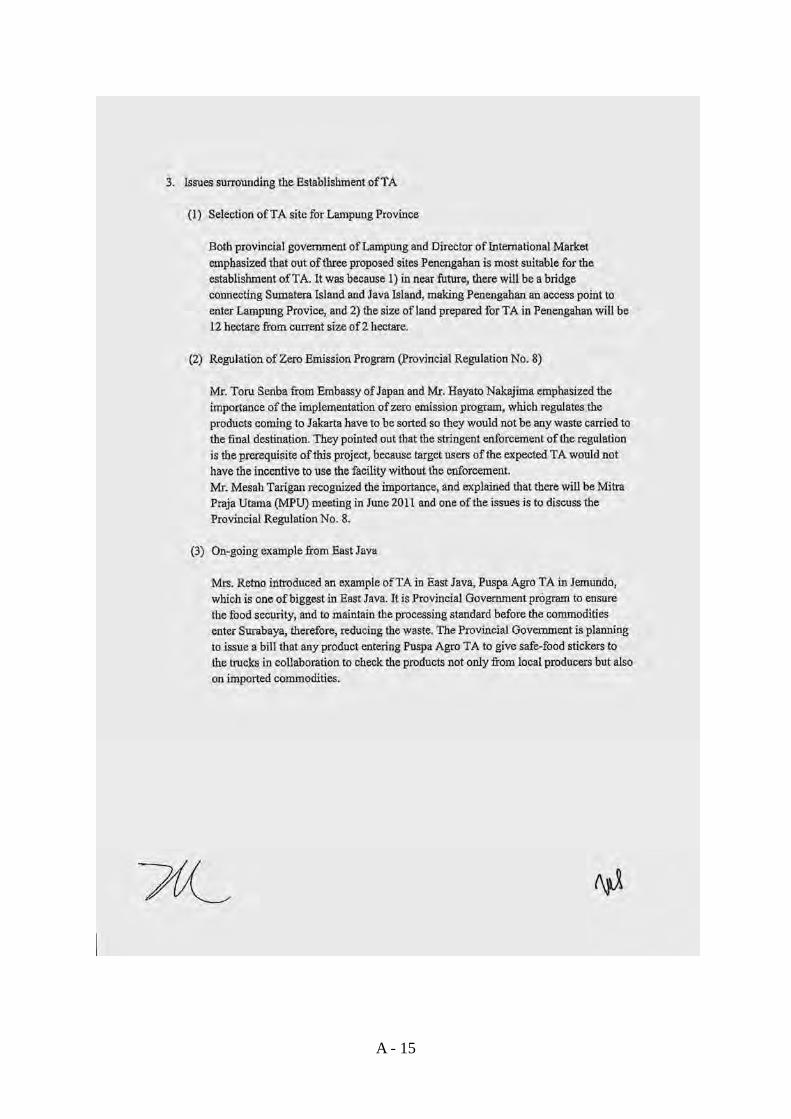
Apendiks-3 Berita Acara 3.1 Berita Acara Rapat Kemitraan (Studi Fase 1 di Indonesia)
A - 14
A - 15
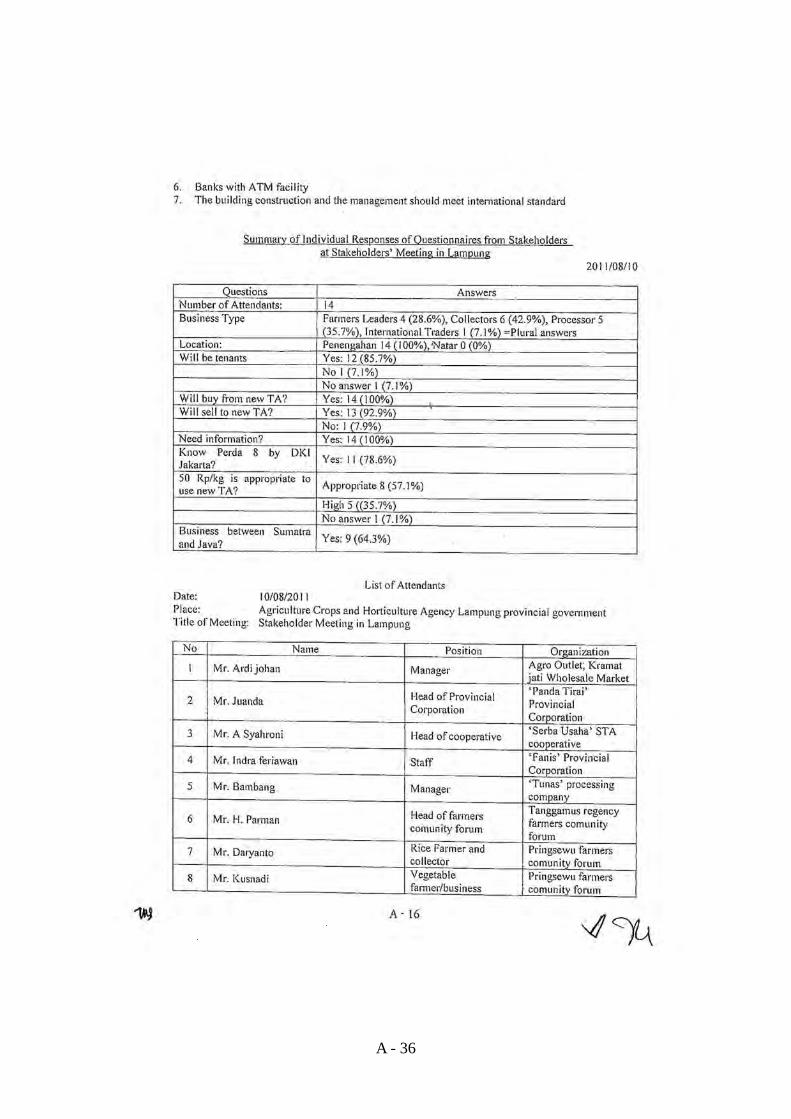
A - 16
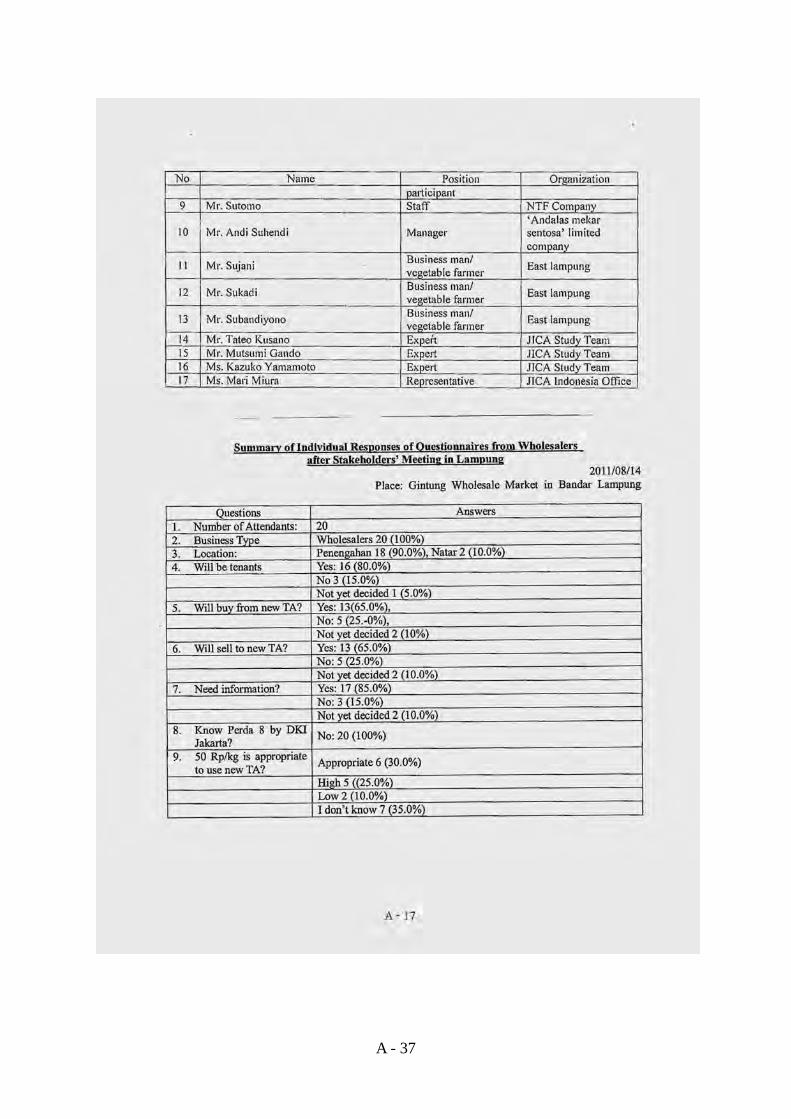
A - 17
3.2 Berita Acara Rapat Kemitraan Gabungan (Studi Fase 2 di Indonesia)
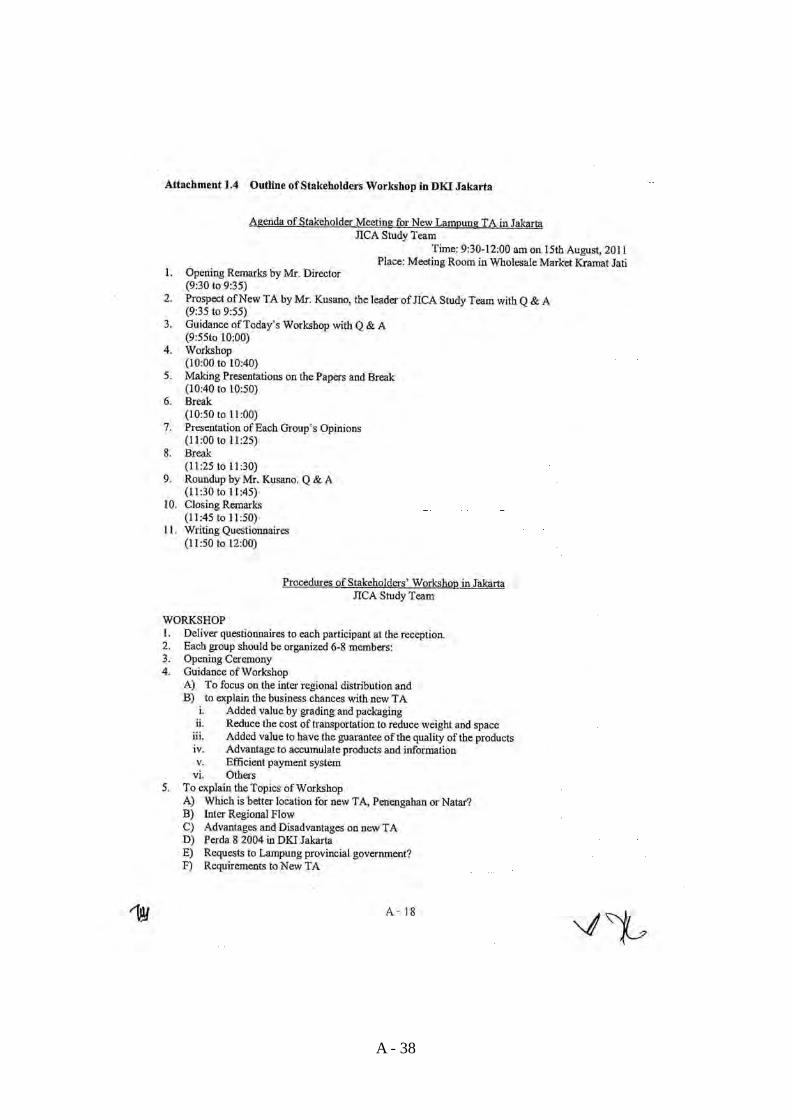
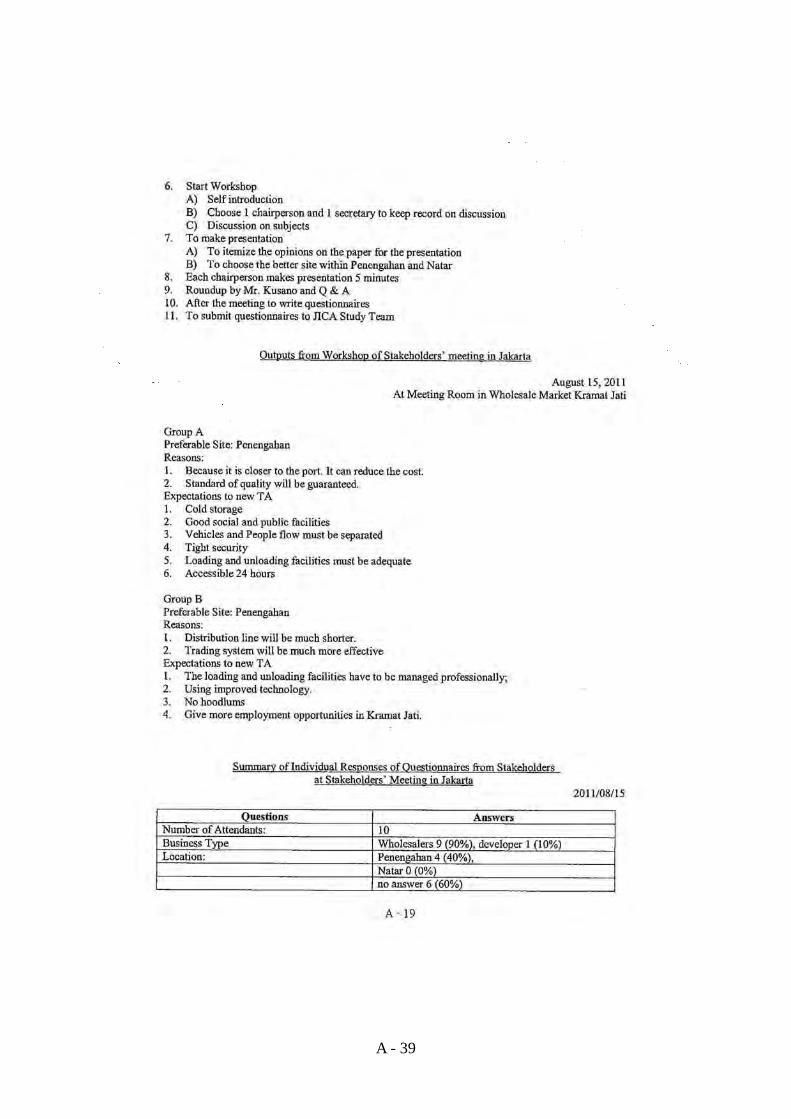
A - 18
A - 19
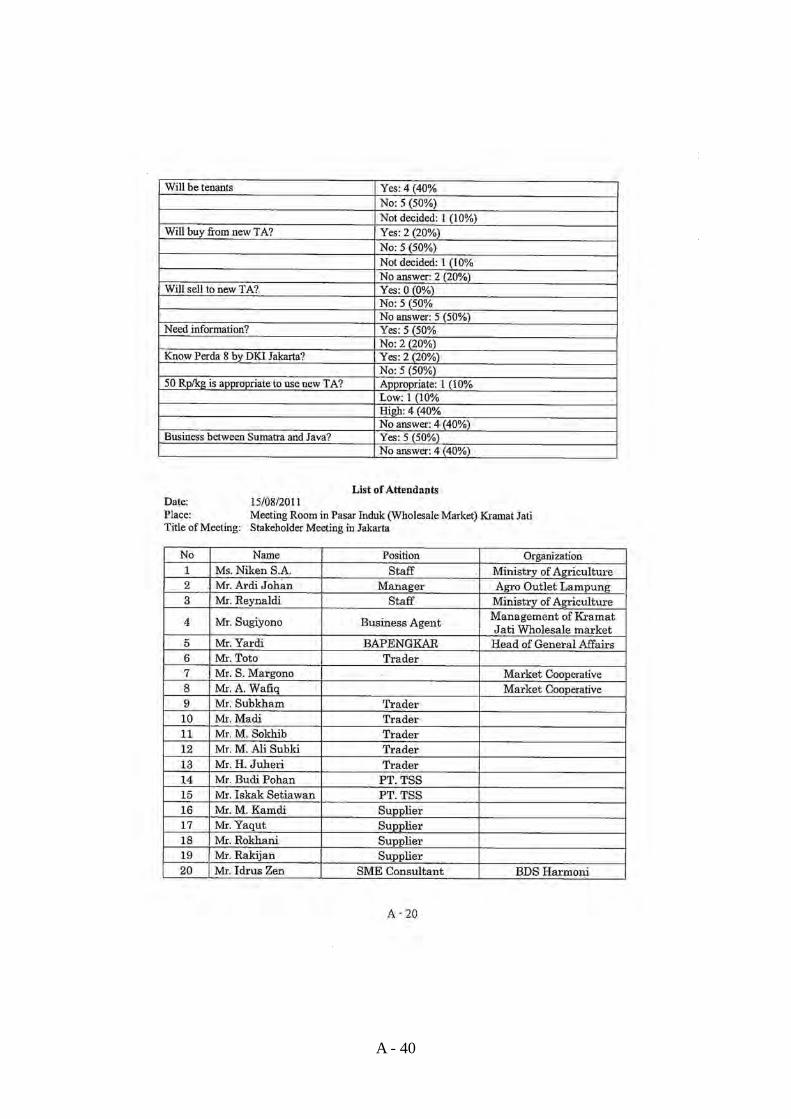
A - 20
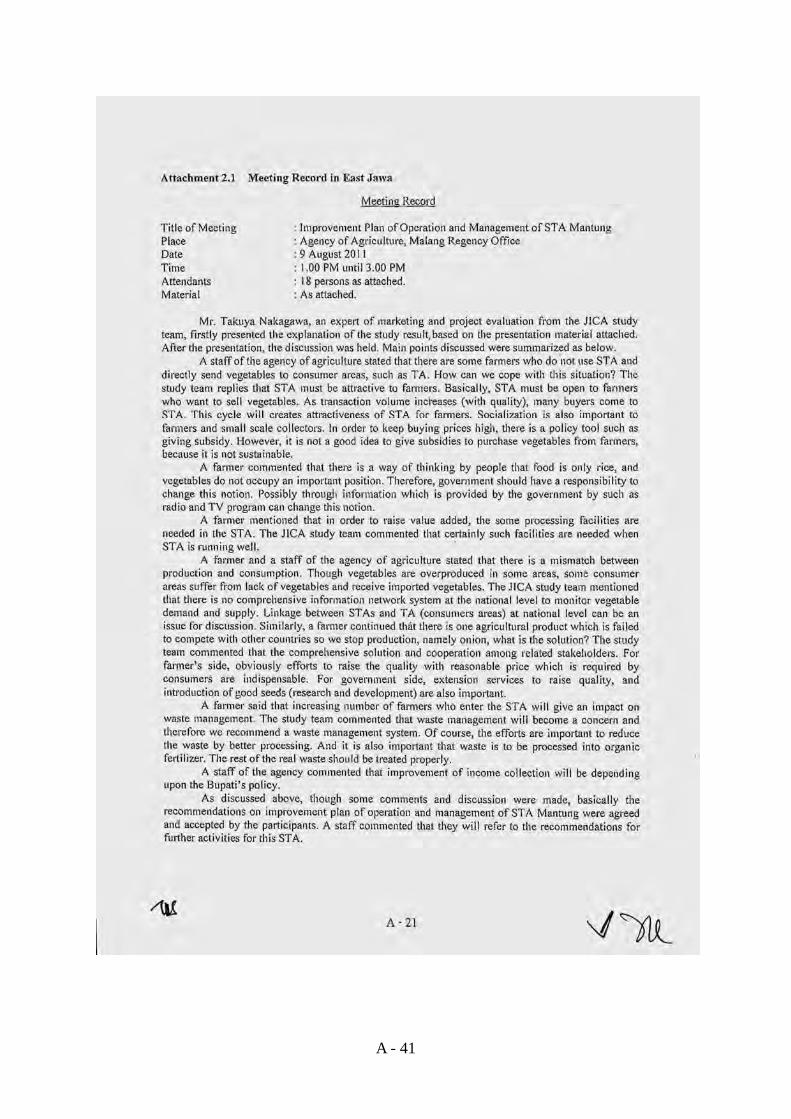
A - 21
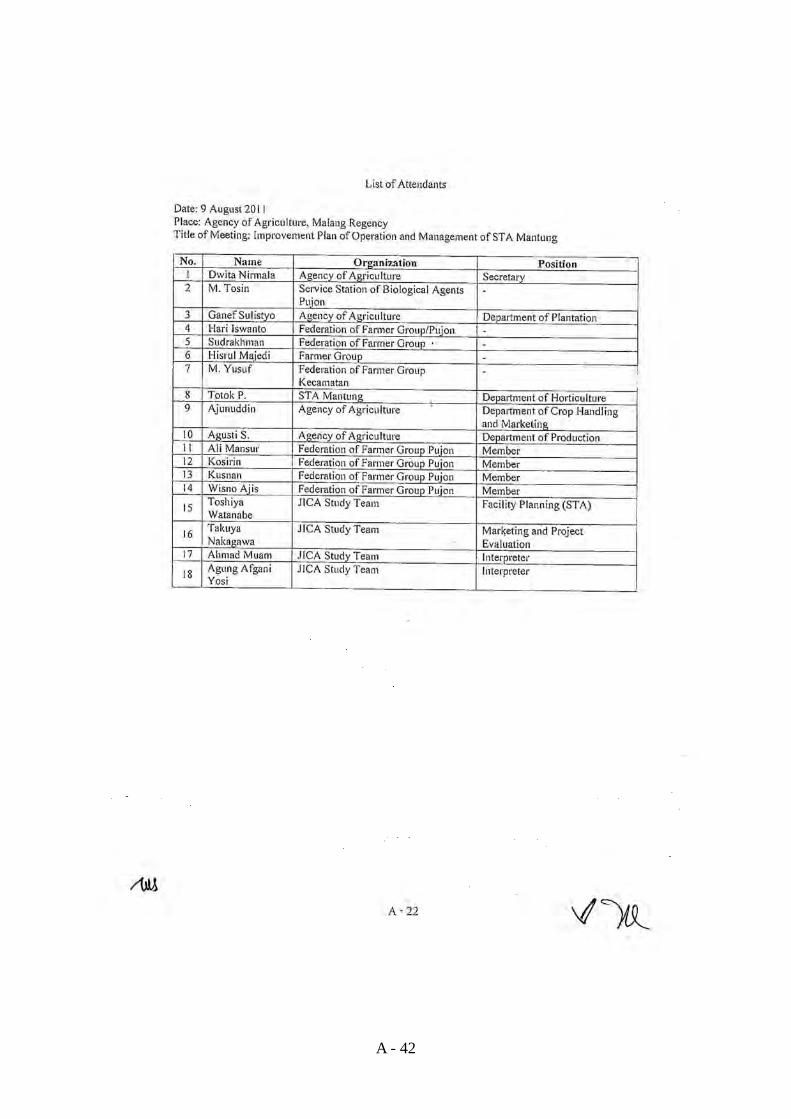
A - 22
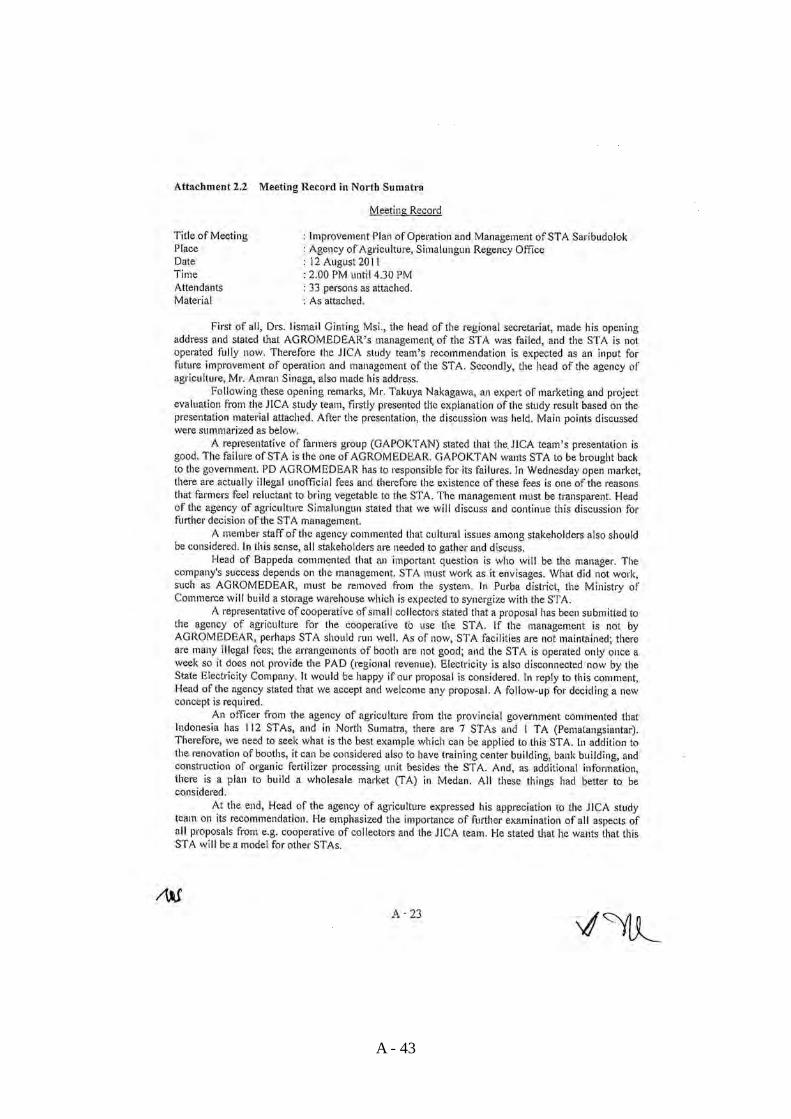
A - 23
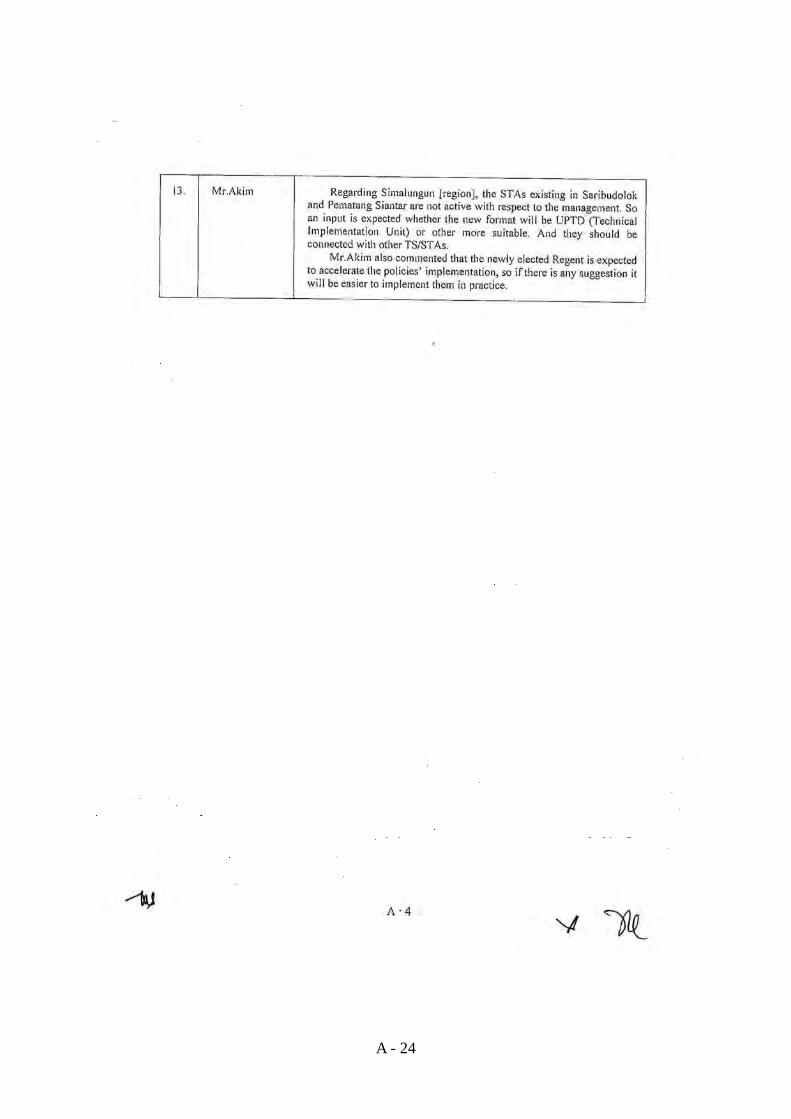
A - 24
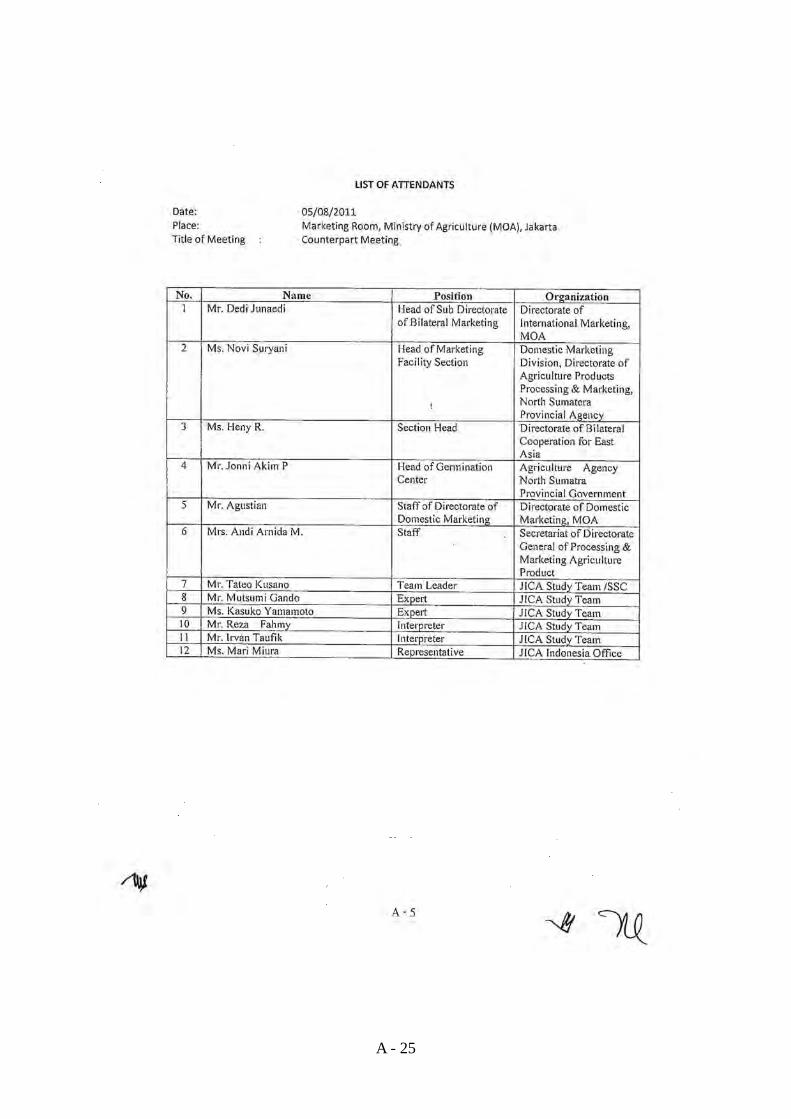
A - 25
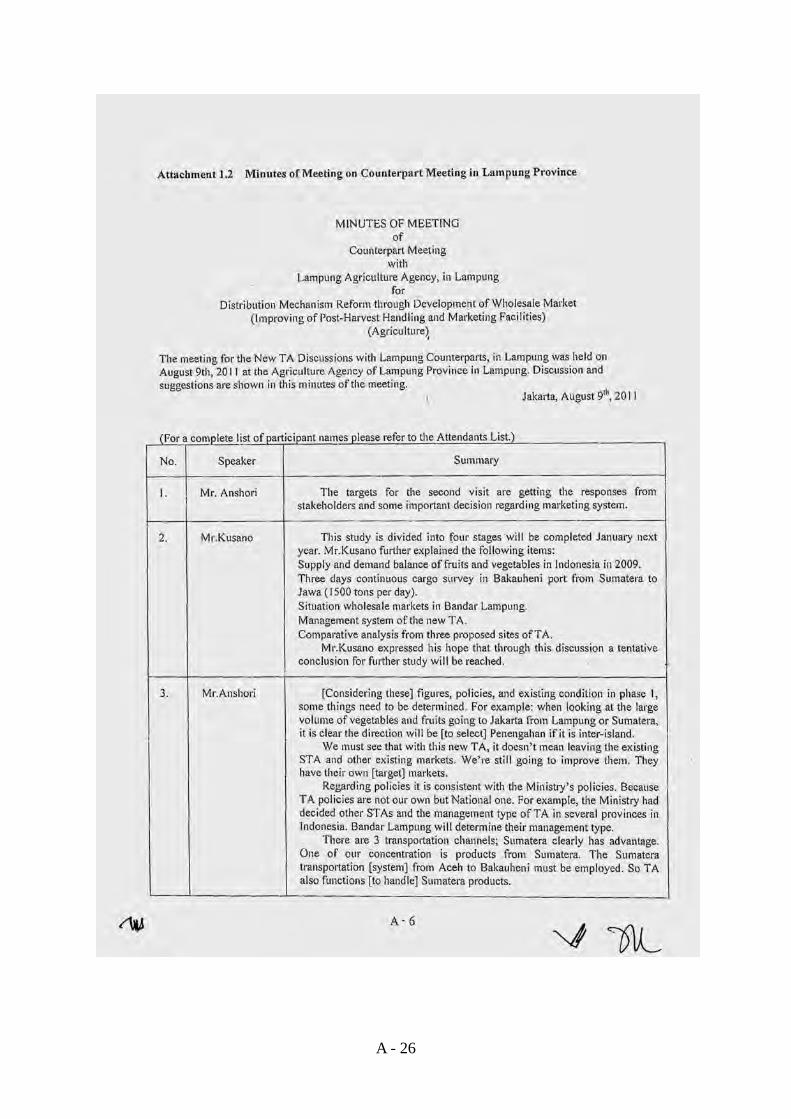
A - 26
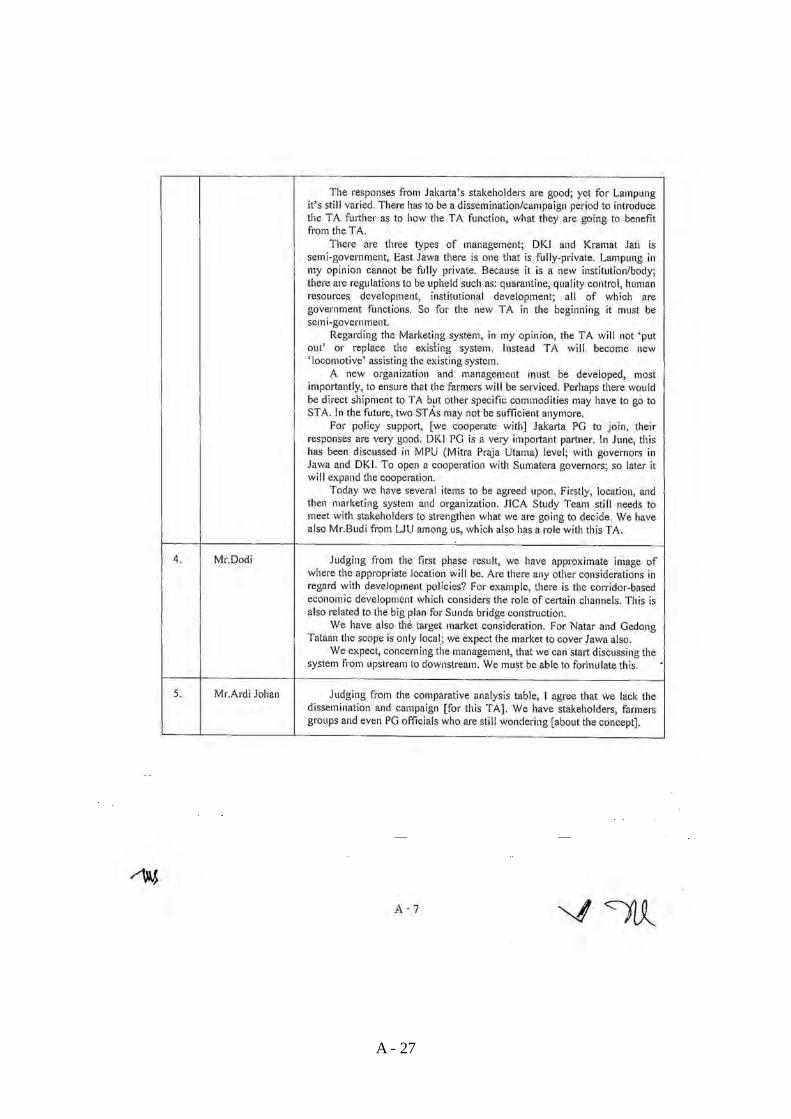
A - 27
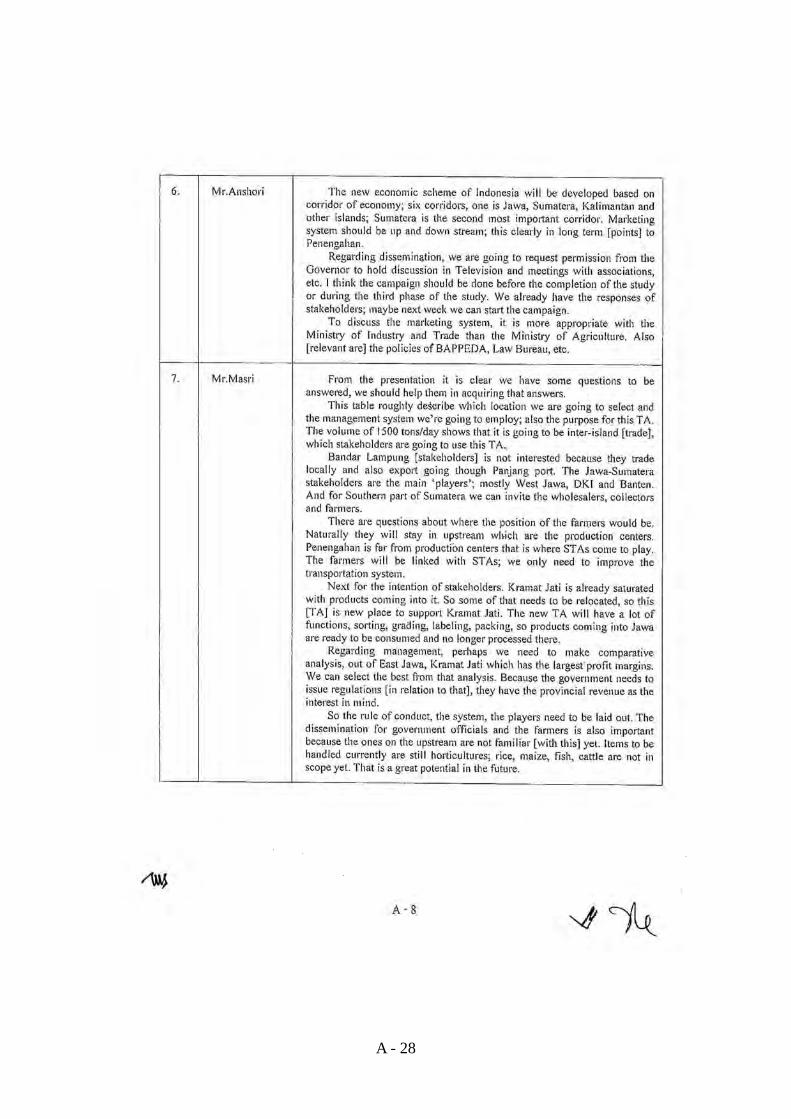
A - 28
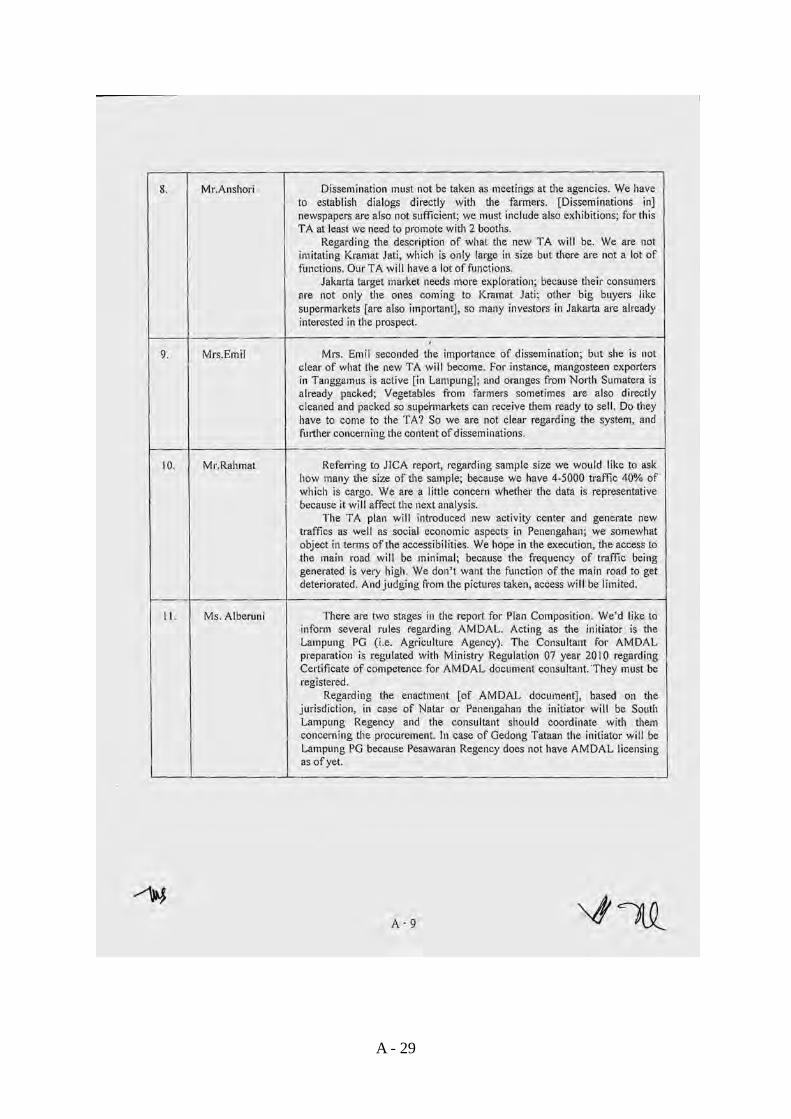
A - 29
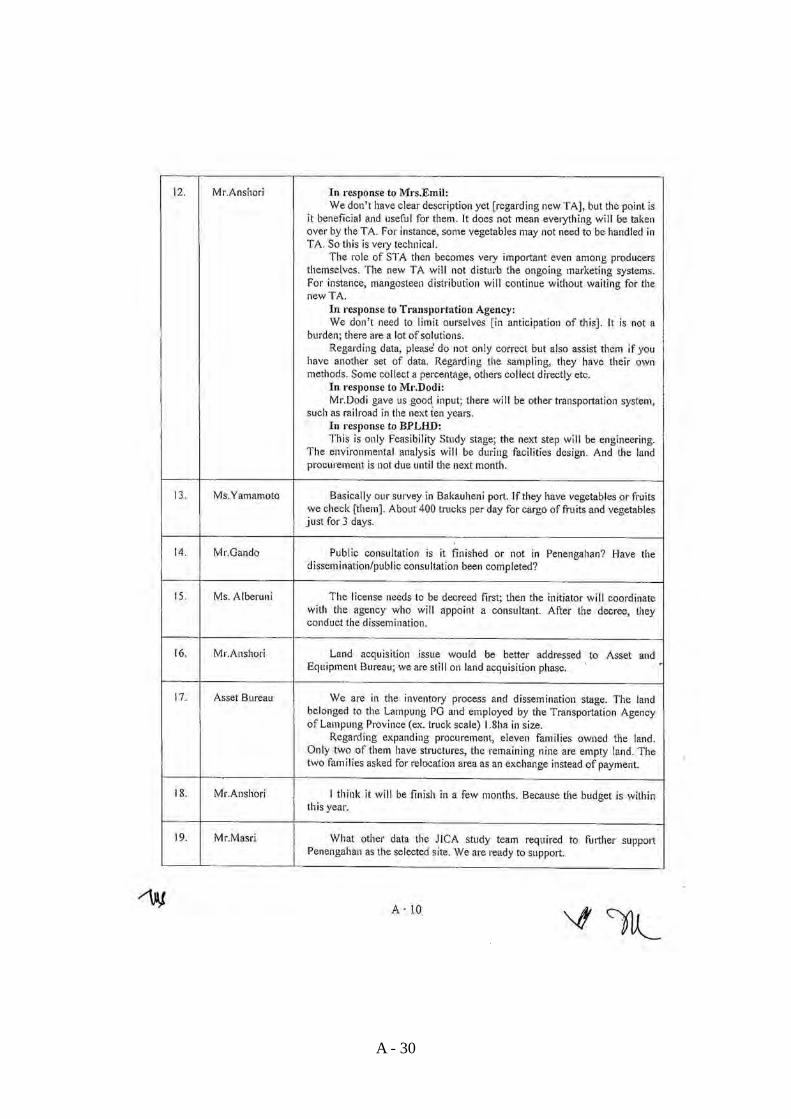
A - 30
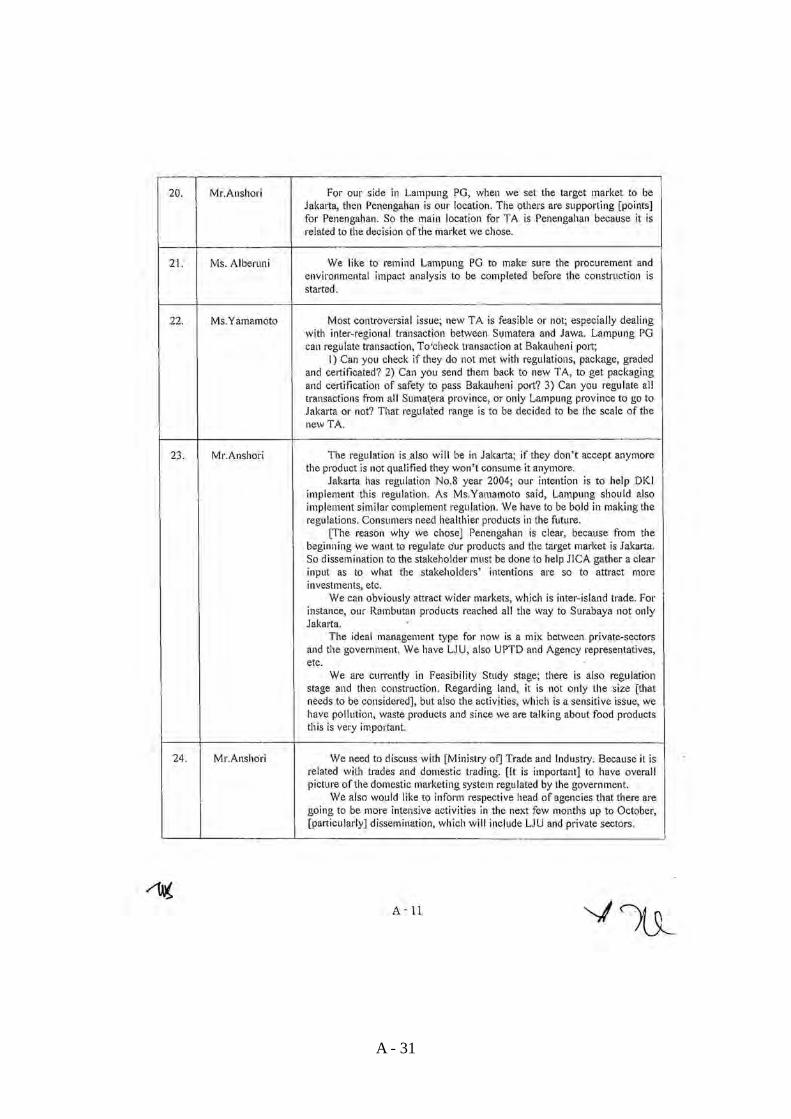
A - 31
A - 32
A - 33
A - 34
A - 35
A - 36
A - 37
A - 38
A - 39
A - 40
A - 41
A - 42
A - 43
A - 44
A - 45
A - 46
A - 47
A - 48
3.3 Berita Acara Rapat Kemitraan Gabungan (Studi Fase 3 di Indonesia)
A - 49
A - 50
A - 51
A - 52
A - 53
A - 54
A - 55
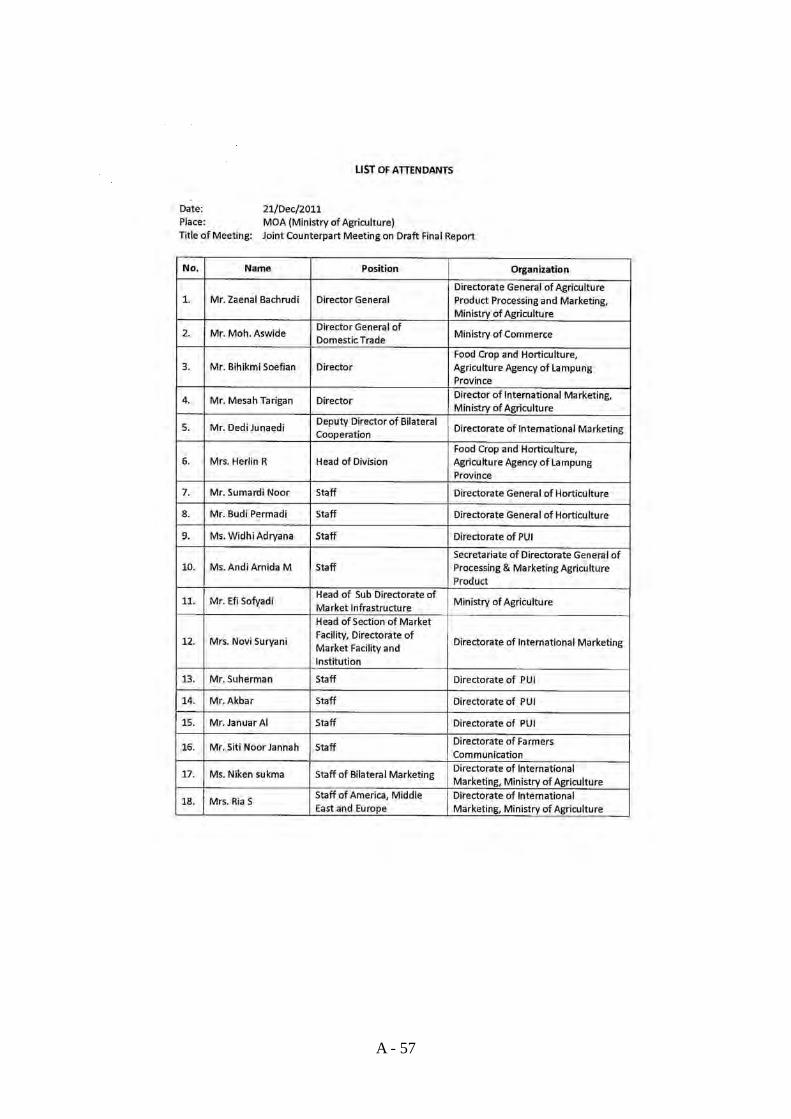
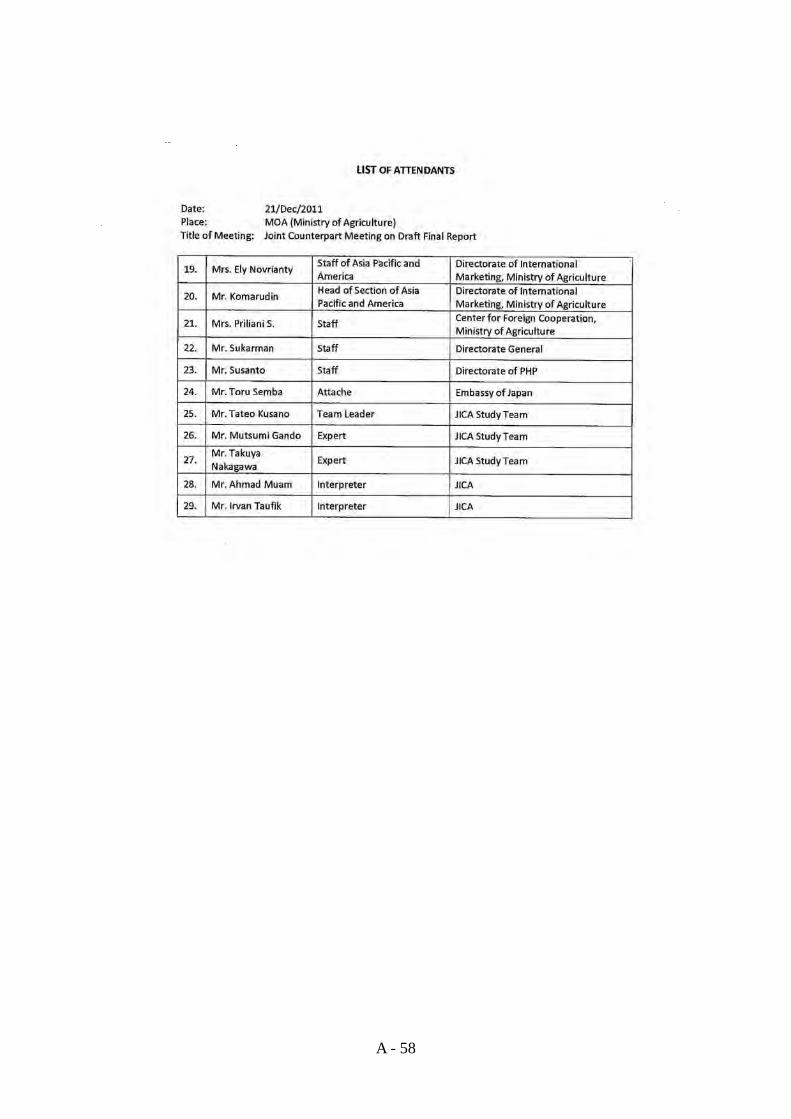
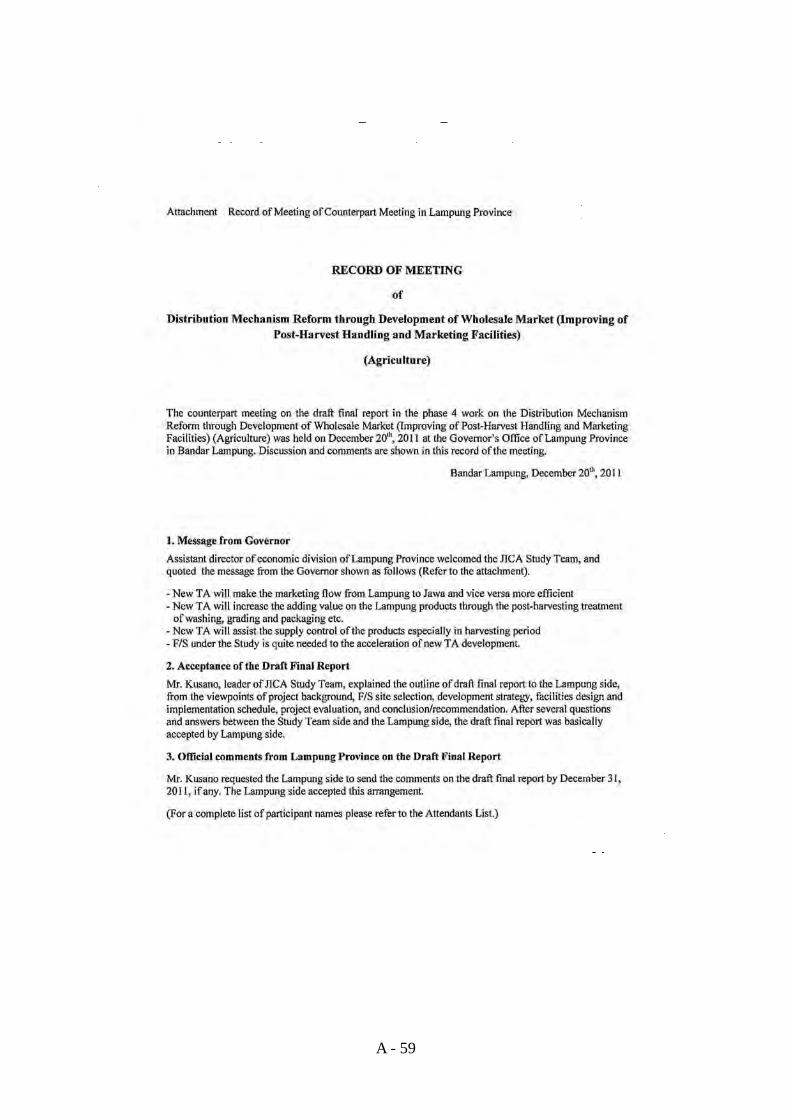
3.4 Berita Acara Rapat Kemitraan Gabungan (Studi Fase 4 di Indonesia)
A - 56
A - 57
A - 58
A - 59
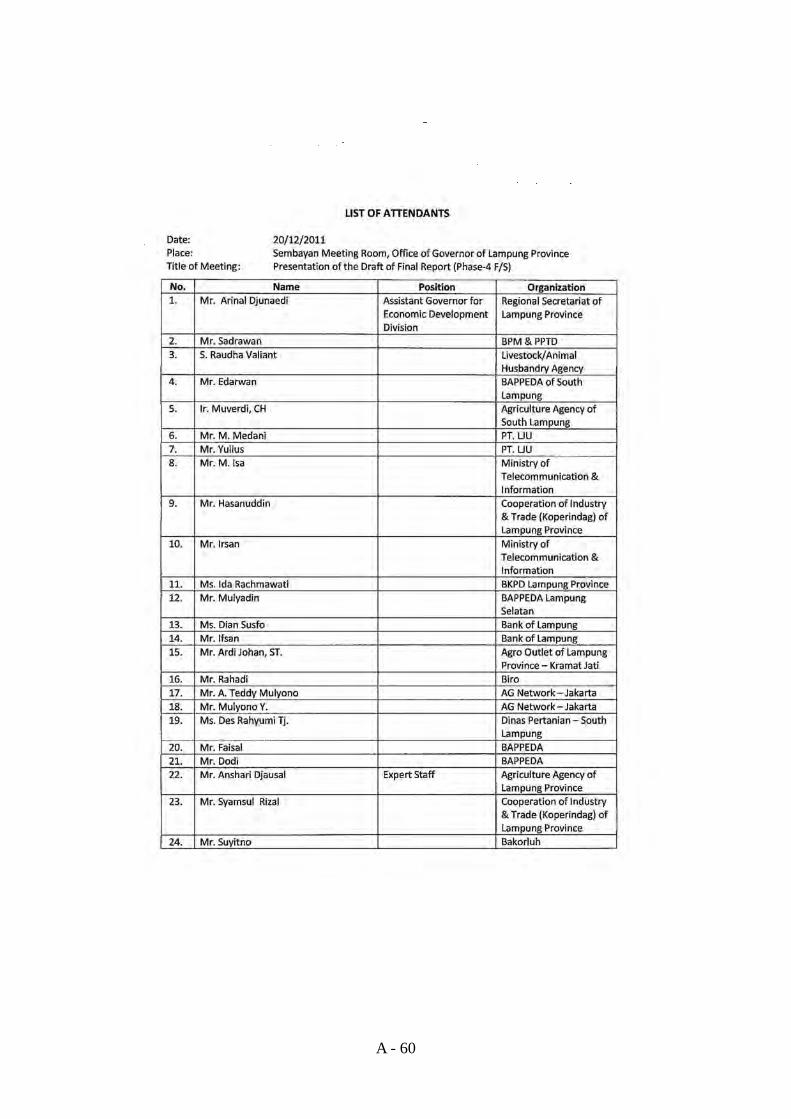
A - 60
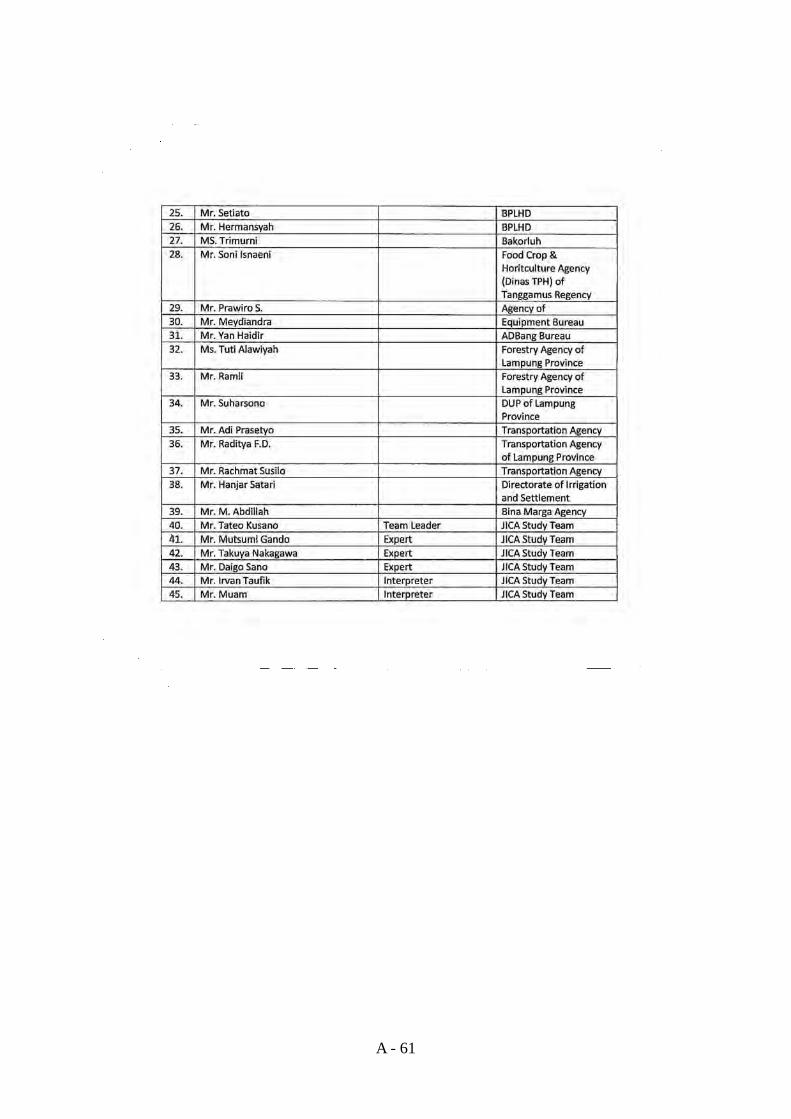
A - 61
A - 62
A - 63
A - 64
A - 65
A - 66
A - 67
A - 68
A - 69
A - 70
(Terjemahan Inggris Sementara)
GOVERNOR OF LAMPUNG
SPEECH OF LAMPUNG’S GOVERNOR ON
COORDINATION MEETING IN THE PRESENTATION OF FINAL REPORT DRAFT OF LAMPUNG TA FEASIBILITY STUDY
BY JICA CONSULTATN TEAM
BANDAR LAMPUNG, DECEMBER 20TH, 2011.
A - 71
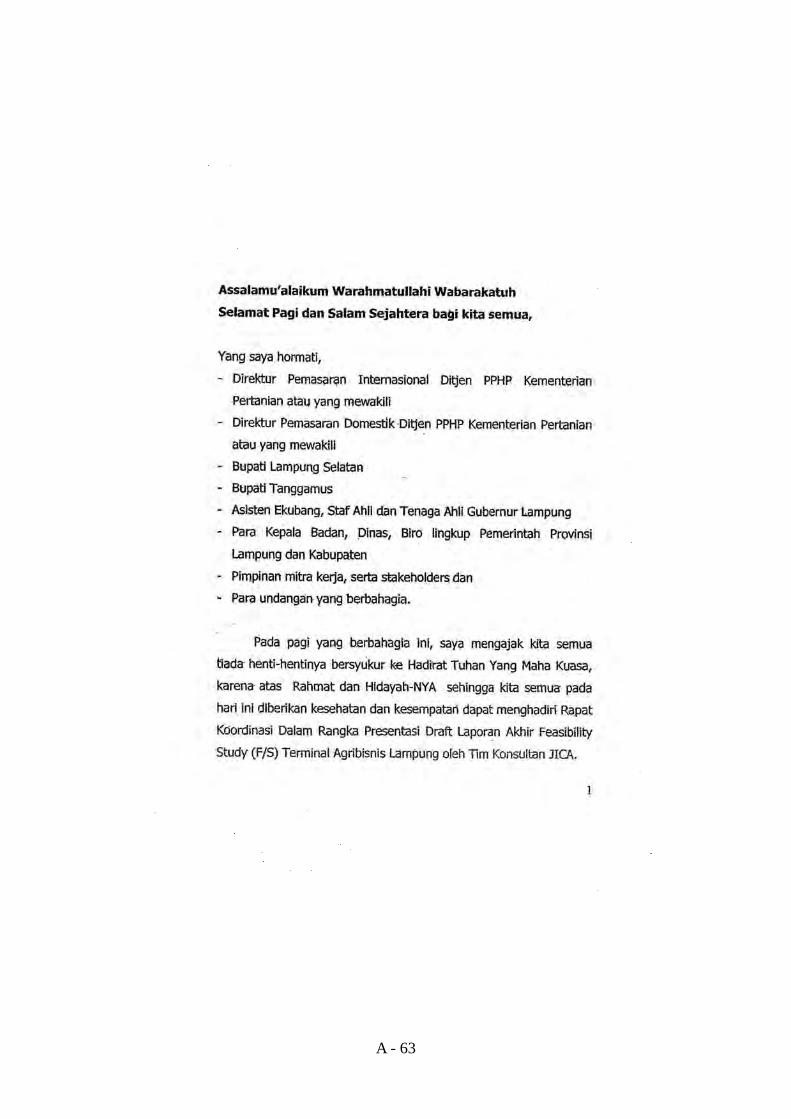
Assalamualakum warrahmatullahiwabarakatuh Good morning The honorable
‐ Director of international marketing , directorate general of PPHP Kementerian Pertanian or his representative
‐ Director of domestic marketing, directorate general of PPHP Kementerian Pertanian or his representative
‐ Regent of lampung selatan ‐ Regent of tangamus ‐ Governor’s assistant on economical development affairs, expert staffs adn the expert staff of
Lampung’s governor ‐ Head of agencies, bodies, beaurau of Provincial and Regencial government level ‐ All participant in this forum
In this joyful morning, i would like to ask you all to thank to God for His gregoriousness and assistance so that we all are still in good condition and still have a chance to join this morning meeting; coodination meeting to listen presentation of final report draft of TA FS in Lampung by JICA consultant team. The honorable all participant of this meeting` In this occasion, i would like to say welcome to Lampung province “SAI BUMI RUWA RAI” especially to the representative of Kementerian Pertanian and JICA consultant team. On behalf Lampung Provincial Government, I also would like to thank for the trust, assistance and cooperation within this FS, by jica team in 2011, because this FS is really needed to support the acceleration of TA Lampung development. By a consideration that Lampung Province is situated strategically in the main stream of distribution flow and agriculture product marketing in general meaning; in other side, role and contribution of Lampung Province towards indonesia widely in term of its various potentialities and agriculture, plantation, livestock, fishing, and forestery performance, the development of the TA is considered as one of prominent programs of Lampung Government. In line with the economical development of sumatera whose economy is based on holticultura and agribisnis, distribution and marketing of agriculture product from Sumatera to Java will increase more and more, at this time,agriculture products marketed are 1000 ton/ day at average to which Lampung have contributed more than 60 %. Therefore, the existence of TA in Lampung is considered as a right solving problem to be the main support of agriculture product marketing from Sumatera- Java. At the same time, it is also a manisfestation or real effort in supporting implemetation of “jakarta bersih” program. Agricuture products sent from lampung ta to jakarta will be in clean and highh quaity condition in line with dki regional regulation no 8 /2004 The honorable all participants of the meeting The development of Lampung TA is expected to be a support to increase the value of agriculture product and to increase product competition ability either in fresh or processed form , in a condition it is supported by qualified facilitation and infrastructure and also participation of all related stakeholders in operational work network. This TA will give great impact towards the welfare of farmers as the TA can:
A - 72
1. Increase marketing eficiency, it can cut chain marketing and product marketing from Lampung or Sumateran farmers to Java island; and vice versa. Through a professional and credible instiution, step by step, the farmers are expected to be able to do transaction directly in TA or to act as a product collector to TA
2. Increase adding value of product, by increasing the quality of product produced by the farmers and by good post-harvest handling such as; sorting, grading, washing, packaging etc.
3. Control the supply of product, especially in harvest time, by providing cool room and storage and qualified distribution facilties as well.
4. Initiate fair and transparant transaction and create stabil price relatively as well,then, the farmers will increase thieir production quality, diversity, and volume based on domestic or international market demand.
Instead of mentioned considerations, another possible real impact by the existence of TA are: the increase of labor force absorption , the increasing chance for people to create a new busines and the increase of investment by developing agriculture product; developing supporting industries (organic feltilizer, seeding, and cultivation machine industries, etc) and also capital investement service; the TA also supports the dissemination of market information and the increase of human resources quality and also supports Agrotourism. The honorable all participant of this meeting Regarding the acceleration of Lampung ‘s TA development, the goverment of Lampung has made preparation by land procurement and provision of area gradually by target 50 ha in penengahan district of Lampung selatan regency. Kementerian Pertanian Repubilc of Indonesia has given a grant which facilitation from Japan government through JICA to conduct FS towards Lampung TA in 2011. The result of FS compiled by JICA team is expected to be a guideline for Lampung government in developing and managing lampung’s TA. The honorable all participants of this meeting The result of TA’s FS becomes the important official document for the Government of Lampung Province as a reference or a starting point to trigger acceleration effort of TA development by the Lampung government and related stakeholders. The sequence of the project actually area:
1. In the first step, the development of Lampung TA focuses only on the development of facility and infrastructure of TA for holticultura comodities. Then, the supporting facility and infrastrucuture for livestock, plantation, fishing dan forestry will be developed after in area 50 ha.
2. The preparation of TA management by PT LJU 3. Making comodities diversity as agriculture product supply in general meaning, which come
from: prominent agriculture product of lampung, product from sumatera to Java island and vice versa
4. In the early step, a study to see the possibility to create a cooperation with DKI Jakarta government will be conducted. It also acts as a support towards “jakarta bersih” program of DKI Jakarta government
A - 73
5. submitting proposal / suggestion of financial support from central government and private sector (candidate of private investor).
With the end of FS of this TA, we, on behalf of the Lampung Province Government would like to say thank to JICA team and Kementerian Pertanian Republic of Indonesia, and also to all stakeholders which has supported the FS in 2011. In this occasion, I will put a great expectation towards regent of Lampung selatan and all head of work units, agnecies, bearous to make a great effort to create coordination network more intensively to succeed one of lampung government’s prominent program that is the development of lampung TA. Last word, hopefully the development of TA can be conducted soon smoothly based on target decided before, and in the following, the TA will give big contribution and play important role in agriculture development performance and especially for farmer welfare and the development of Lampung Province in general. May God bless and also support all of ourt efforts. Amin Wassalamualaikaum wr wb Bandar lampung, december, 20th, 2011 Governor of lampung Sjachroedin z.p
A - 74
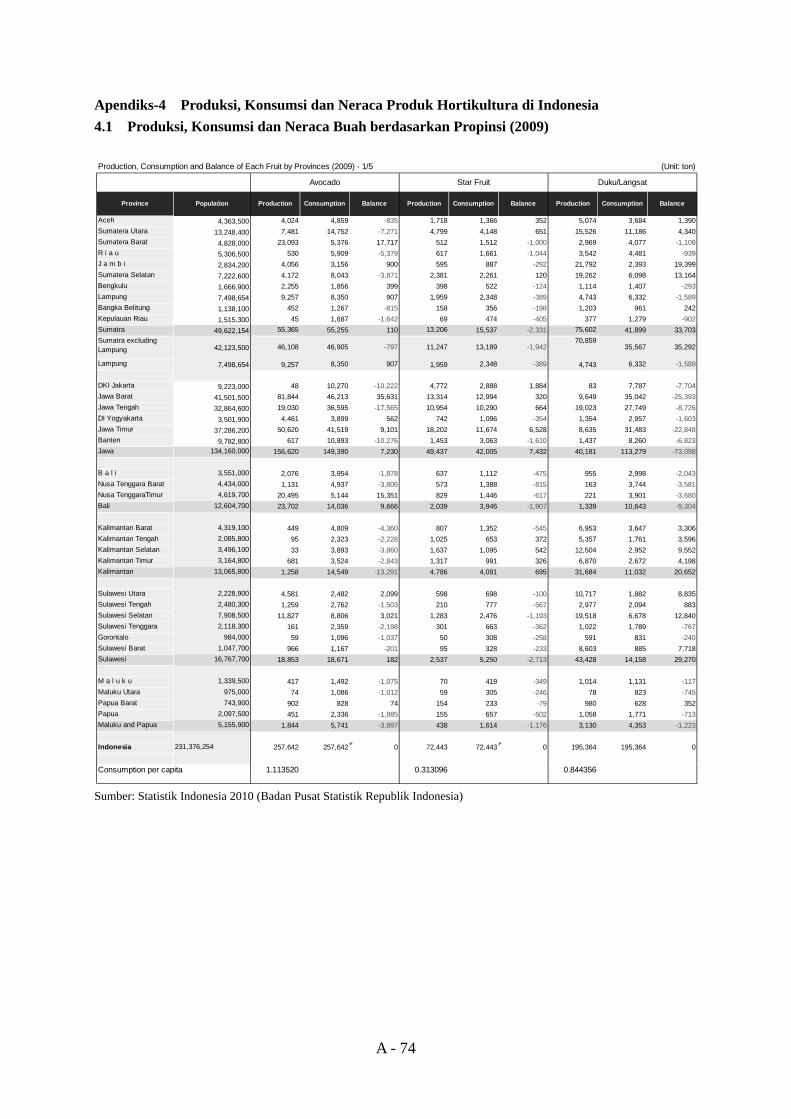
Apendiks-4 Produksi, Konsumsi dan Neraca Produk Hortikultura di Indonesia 4.1 Produksi, Konsumsi dan Neraca Buah berdasarkan Propinsi (2009)
Sumber: Statistik Indonesia 2010 (Badan Pusat Statistik Republik Indonesia)
(Unit: ton)
Province Population Production Consumption Balance Production Consumption Balance Production Consumption Balance
Aceh 4,363,500 4,024 4,859 -835 1,718 1,366 352 5,074 3,684 1,390Sumatera Utara 13,248,400 7,481 14,752 -7,271 4,799 4,148 651 15,526 11,186 4,340Sumatera Barat 4,828,000 23,093 5,376 17,717 512 1,512 -1,000 2,969 4,077 -1,108R i a u 5,306,500 530 5,909 -5,379 617 1,661 -1,044 3,542 4,481 -939J a m b i 2,834,200 4,056 3,156 900 595 887 -292 21,792 2,393 19,399Sumatera Selatan 7,222,600 4,172 8,043 -3,871 2,381 2,261 120 19,262 6,098 13,164Bengkulu 1,666,900 2,255 1,856 399 398 522 -124 1,114 1,407 -293Lampung 7,498,654 9,257 8,350 907 1,959 2,348 -389 4,743 6,332 -1,589Bangka Belitung 1,138,100 452 1,267 -815 158 356 -198 1,203 961 242Kepulauan Riau 1,515,300 45 1,687 -1,642 69 474 -405 377 1,279 -902Sumatra 49,622,154 55,365 55,255 110 13,206 15,537 -2,331 75,602 41,899 33,703Sumatra excludingLampung 42,123,500 46,108 46,905 -797 11,247 13,189 -1,942
70,85935,567 35,292
Lampung 7,498,654 9,257 8,350 907 1,959 2,348 -389 4,743 6,332 -1,589
DKI Jakarta 9,223,000 48 10,270 -10,222 4,772 2,888 1,884 83 7,787 -7,704Jawa Barat 41,501,500 81,844 46,213 35,631 13,314 12,994 320 9,649 35,042 -25,393Jawa Tengah 32,864,600 19,030 36,595 -17,565 10,954 10,290 664 19,023 27,749 -8,726DI Yogyakarta 3,501,900 4,461 3,899 562 742 1,096 -354 1,354 2,957 -1,603Jawa Timur 37,286,200 50,620 41,519 9,101 18,202 11,674 6,528 8,635 31,483 -22,848Banten 9,782,800 617 10,893 -10,276 1,453 3,063 -1,610 1,437 8,260 -6,823Jawa 134,160,000 156,620 149,390 7,230 49,437 42,005 7,432 40,181 113,279 -73,098
B a l i 3,551,000 2,076 3,954 -1,878 637 1,112 -475 955 2,998 -2,043Nusa Tenggara Barat 4,434,000 1,131 4,937 -3,806 573 1,388 -815 163 3,744 -3,581Nusa TenggaraTimur 4,619,700 20,495 5,144 15,351 829 1,446 -617 221 3,901 -3,680Bali 12,604,700 23,702 14,036 9,666 2,039 3,946 -1,907 1,339 10,643 -9,304
Kalimantan Barat 4,319,100 449 4,809 -4,360 807 1,352 -545 6,953 3,647 3,306Kalimantan Tengah 2,085,800 95 2,323 -2,228 1,025 653 372 5,357 1,761 3,596Kalimantan Selatan 3,496,100 33 3,893 -3,860 1,637 1,095 542 12,504 2,952 9,552Kalimantan Timur 3,164,800 681 3,524 -2,843 1,317 991 326 6,870 2,672 4,198Kalimantan 13,065,800 1,258 14,549 -13,291 4,786 4,091 695 31,684 11,032 20,652
Sulawesi Utara 2,228,900 4,581 2,482 2,099 598 698 -100 10,717 1,882 8,835Sulawesi Tengah 2,480,300 1,259 2,762 -1,503 210 777 -567 2,977 2,094 883Sulawesi Selatan 7,908,500 11,827 8,806 3,021 1,283 2,476 -1,193 19,518 6,678 12,840Sulawesi Tenggara 2,118,300 161 2,359 -2,198 301 663 -362 1,022 1,789 -767Gorontalo 984,000 59 1,096 -1,037 50 308 -258 591 831 -240Sulawesi Barat 1,047,700 966 1,167 -201 95 328 -233 8,603 885 7,718Sulawesi 16,767,700 18,853 18,671 182 2,537 5,250 -2,713 43,428 14,158 29,270
M a l u k u 1,339,500 417 1,492 -1,075 70 419 -349 1,014 1,131 -117Maluku Utara 975,000 74 1,086 -1,012 59 305 -246 78 823 -745Papua Barat 743,900 902 828 74 154 233 -79 980 628 352Papua 2,097,500 451 2,336 -1,885 155 657 -502 1,058 1,771 -713Maluku and Papua 5,155,900 1,844 5,741 -3,897 438 1,614 -1,176 3,130 4,353 -1,223
Indonesia 231,376,254 257,642 257,642 0 72,443 72,443 0 195,364 195,364 0
1.113520 0.313096 0.844356
Production, Consumption and Balance of Each Fruit by Provinces (2009) - 1/5
Avocado Star Fruit Duku/Langsat
Consumption per capita
A - 75
Sumber: Statistik Indonesia 2010 (Badan Pusat Statistik Republik Indonesia)
(Unit: ton)
Province Population Production Consumption Balance Production Consumption Balance Production Consumption Balance
Aceh 4,363,500 2,219 4,153 -1,934 19,242 40,203 -20,961 14,893 15,046 -153Sumatera Utara 13,248,400 24,682 12,609 12,073 728,796 122,063 606,733 102,580 45,681 56,899Sumatera Barat 4,828,000 1,095 4,595 -3,500 24,891 44,482 -19,591 37,388 16,647 20,741R i a u 5,306,500 2,921 5,050 -2,129 19,221 48,891 -29,670 11,510 18,297 -6,787J a m b i 2,834,200 1,832 2,697 -865 39,073 26,113 12,960 24,287 9,772 14,515Sumatera Selatan 7,222,600 3,718 6,874 -3,156 77,316 66,545 10,771 36,112 24,904 11,208Bengkulu 1,666,900 956 1,586 -630 15,622 15,358 264 24,343 5,748 18,595Lampung 7,498,654 3,090 7,137 -4,047 11,006 69,088 -58,082 30,463 25,856 4,607Bangka Belitung 1,138,100 464 1,083 -619 7,466 10,486 -3,020 8,566 3,924 4,642Kepulauan Riau 1,515,300 113 1,442 -1,329 556 13,961 -13,405 6,333 5,225 1,108Sumatra 49,622,154 41,090 47,226 -6,136 943,189 457,190 485,999 296,475 171,100 125,375Sumatra excludingLampung 42,123,500 38,000 40,089 -2,089 932,183 388,102 544,081 266,012 145,244 120,768
Lampung 7,498,654 3,090 7,137 -4,047 11,006 69,088 -58,082 30,463 25,856 4,607
DKI Jakarta 9,223,000 794 8,778 -7,984 12 84,975 -84,963 288 31,801 -31,513Jawa Barat 41,501,500 70,997 39,497 31,500 28,246 382,371 -354,125 70,362 143,099 -72,737Jawa Tengah 32,864,600 25,616 31,277 -5,661 30,341 302,796 -272,455 74,368 113,319 -38,951DI Yogyakarta 3,501,900 4,113 3,333 780 2,062 32,264 -30,202 9,217 12,075 -2,858Jawa Timur 37,286,200 19,057 35,485 -16,428 378,923 343,534 35,389 141,522 128,565 12,957Banten 9,782,800 3,076 9,310 -6,234 1,563 90,133 -88,570 28,152 33,732 -5,580Jawa 134,160,000 123,653 127,681 -4,028 441,147 1,236,073 -794,926 323,909 462,591 -138,682
B a l i 3,551,000 1,828 3,380 -1,552 162,916 32,717 130,199 15,650 12,244 3,406Nusa Tenggara Barat 4,434,000 20,476 4,220 16,256 6,931 40,852 -33,921 6,085 15,289 -9,204Nusa TenggaraTimur 4,619,700 9,270 4,397 4,873 36,918 42,563 -5,645 910 15,929 -15,019Bali 12,604,700 31,574 11,996 19,578 206,765 116,132 90,633 22,645 43,462 -20,817
Kalimantan Barat 4,319,100 2,411 4,111 -1,700 170,201 39,794 130,407 32,387 14,892 17,495Kalimantan Tengah 2,085,800 1,904 1,985 -81 8,674 19,217 -10,543 16,915 7,192 9,723Kalimantan Selatan 3,496,100 2,222 3,327 -1,105 88,061 32,211 55,850 17,969 12,055 5,914Kalimantan Timur 3,164,800 2,061 3,012 -951 11,754 29,159 -17,405 16,359 10,912 5,447Kalimantan 13,065,800 8,598 12,435 -3,837 278,690 120,381 158,309 83,630 45,052 38,578
Sulawesi Utara 2,228,900 826 2,121 -1,295 1,903 20,536 -18,633 11,974 7,685 4,289Sulawesi Tengah 2,480,300 796 2,361 -1,565 14,158 22,852 -8,694 10,027 8,552 1,475Sulawesi Selatan 7,908,500 11,187 7,527 3,660 36,266 72,864 -36,598 25,877 27,269 -1,392Sulawesi Tenggara 2,118,300 858 2,016 -1,158 26,274 19,517 6,757 1,981 7,304 -5,323Gorontalo 984,000 139 936 -797 1,594 9,066 -7,472 666 3,393 -2,727Sulawesi Barat 1,047,700 459 997 -538 157,484 9,653 147,831 9,050 3,613 5,437Sulawesi 16,767,700 14,265 15,958 -1,693 237,679 154,488 83,191 59,575 57,816 1,759
M a l u k u 1,339,500 223 1,275 -1,052 3,882 12,341 -8,459 5,538 4,619 919Maluku Utara 975,000 54 928 -874 1,636 8,983 -7,347 334 3,362 -3,028Papua Barat 743,900 398 708 -310 420 6,854 -6,434 2,036 2,565 -529Papua 2,097,500 347 1,996 -1,649 18,360 19,325 -965 3,656 7,232 -3,576Maluku and Papua 5,155,900 1,022 4,907 -3,885 24,298 47,504 -23,206 11,564 17,778 -6,214
Indonesia 231,376,254 220,202 220,202 0 2,131,768 2,131,768 0 797,798 797,798 0
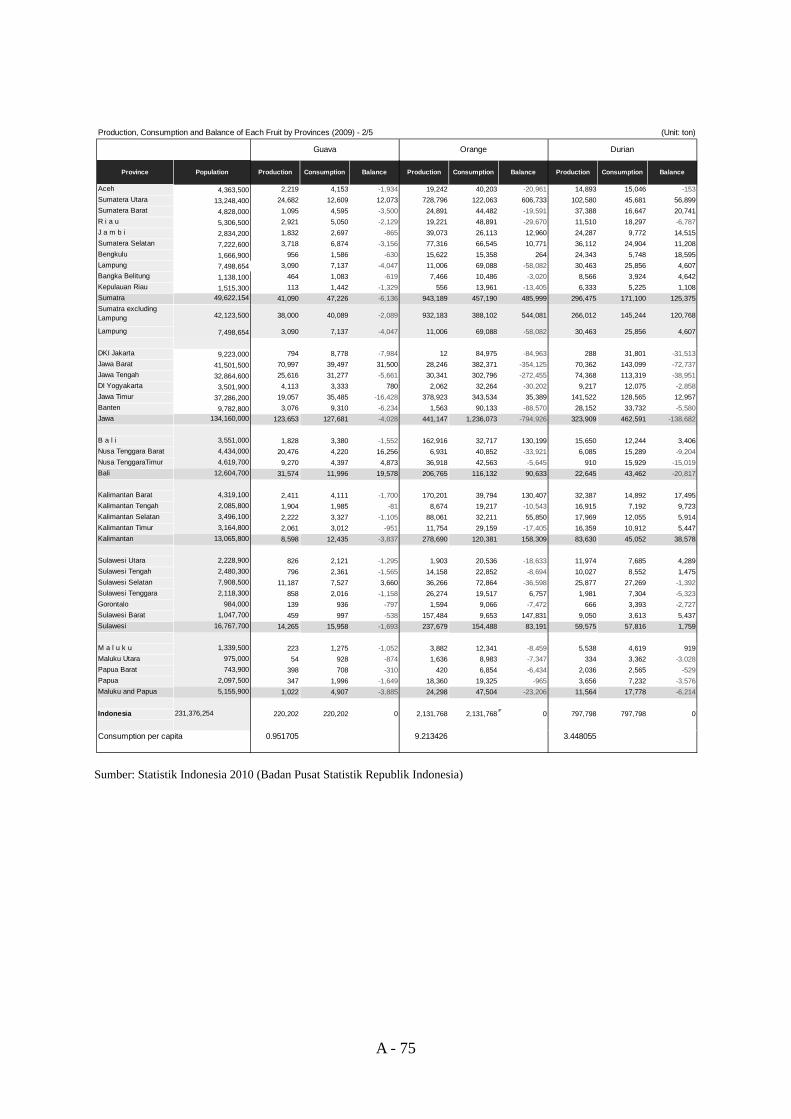
0.951705 9.213426 3.448055
Guava Orange Durian
Production, Consumption and Balance of Each Fruit by Provinces (2009) - 2/5
Consumption per capita
A - 76
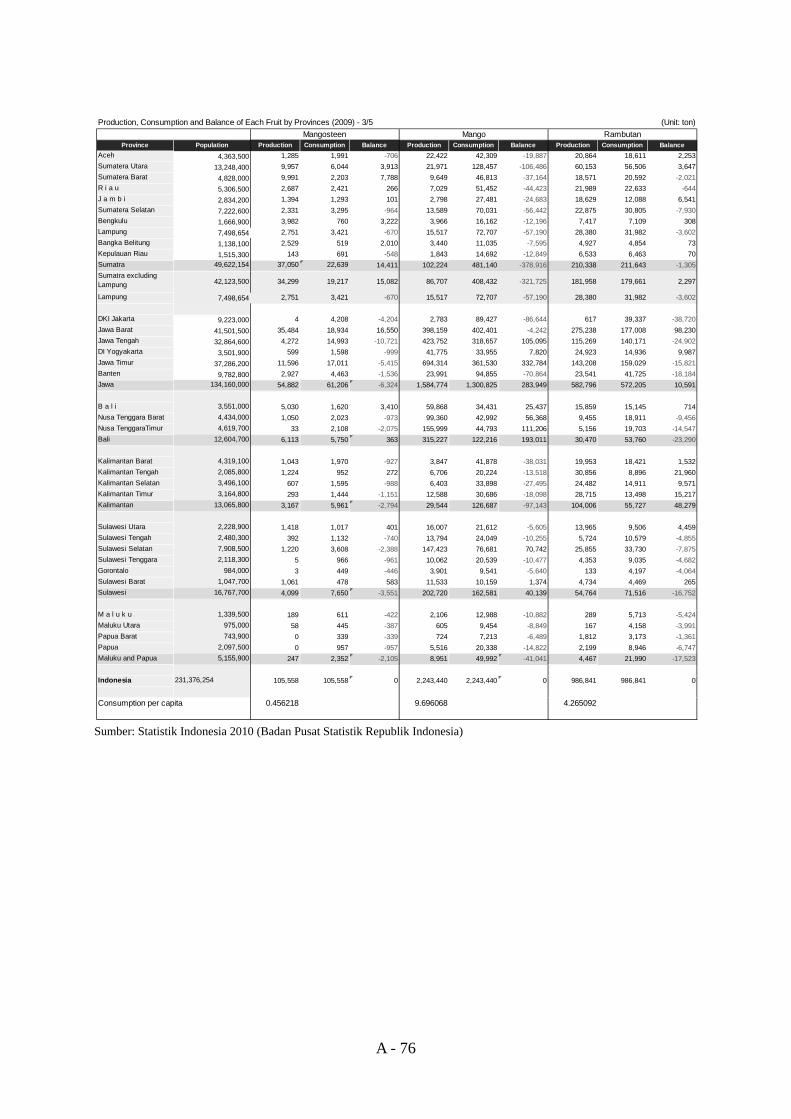
Sumber: Statistik Indonesia 2010 (Badan Pusat Statistik Republik Indonesia)
(Unit: ton)
Province Population Production Consumption Balance Production Consumption Balance Production Consumption BalanceAceh 4,363,500 1,285 1,991 -706 22,422 42,309 -19,887 20,864 18,611 2,253Sumatera Utara 13,248,400 9,957 6,044 3,913 21,971 128,457 -106,486 60,153 56,506 3,647Sumatera Barat 4,828,000 9,991 2,203 7,788 9,649 46,813 -37,164 18,571 20,592 -2,021R i a u 5,306,500 2,687 2,421 266 7,029 51,452 -44,423 21,989 22,633 -644J a m b i 2,834,200 1,394 1,293 101 2,798 27,481 -24,683 18,629 12,088 6,541Sumatera Selatan 7,222,600 2,331 3,295 -964 13,589 70,031 -56,442 22,875 30,805 -7,930Bengkulu 1,666,900 3,982 760 3,222 3,966 16,162 -12,196 7,417 7,109 308Lampung 7,498,654 2,751 3,421 -670 15,517 72,707 -57,190 28,380 31,982 -3,602Bangka Belitung 1,138,100 2,529 519 2,010 3,440 11,035 -7,595 4,927 4,854 73Kepulauan Riau 1,515,300 143 691 -548 1,843 14,692 -12,849 6,533 6,463 70Sumatra 49,622,154 37,050 22,639 14,411 102,224 481,140 -378,916 210,338 211,643 -1,305Sumatra excludingLampung 42,123,500 34,299 19,217 15,082 86,707 408,432 -321,725 181,958 179,661 2,297
Lampung 7,498,654 2,751 3,421 -670 15,517 72,707 -57,190 28,380 31,982 -3,602
DKI Jakarta 9,223,000 4 4,208 -4,204 2,783 89,427 -86,644 617 39,337 -38,720Jawa Barat 41,501,500 35,484 18,934 16,550 398,159 402,401 -4,242 275,238 177,008 98,230Jawa Tengah 32,864,600 4,272 14,993 -10,721 423,752 318,657 105,095 115,269 140,171 -24,902DI Yogyakarta 3,501,900 599 1,598 -999 41,775 33,955 7,820 24,923 14,936 9,987Jawa Timur 37,286,200 11,596 17,011 -5,415 694,314 361,530 332,784 143,208 159,029 -15,821Banten 9,782,800 2,927 4,463 -1,536 23,991 94,855 -70,864 23,541 41,725 -18,184Jawa 134,160,000 54,882 61,206 -6,324 1,584,774 1,300,825 283,949 582,796 572,205 10,591
B a l i 3,551,000 5,030 1,620 3,410 59,868 34,431 25,437 15,859 15,145 714Nusa Tenggara Barat 4,434,000 1,050 2,023 -973 99,360 42,992 56,368 9,455 18,911 -9,456Nusa TenggaraTimur 4,619,700 33 2,108 -2,075 155,999 44,793 111,206 5,156 19,703 -14,547Bali 12,604,700 6,113 5,750 363 315,227 122,216 193,011 30,470 53,760 -23,290
Kalimantan Barat 4,319,100 1,043 1,970 -927 3,847 41,878 -38,031 19,953 18,421 1,532Kalimantan Tengah 2,085,800 1,224 952 272 6,706 20,224 -13,518 30,856 8,896 21,960Kalimantan Selatan 3,496,100 607 1,595 -988 6,403 33,898 -27,495 24,482 14,911 9,571Kalimantan Timur 3,164,800 293 1,444 -1,151 12,588 30,686 -18,098 28,715 13,498 15,217Kalimantan 13,065,800 3,167 5,961 -2,794 29,544 126,687 -97,143 104,006 55,727 48,279
Sulawesi Utara 2,228,900 1,418 1,017 401 16,007 21,612 -5,605 13,965 9,506 4,459Sulawesi Tengah 2,480,300 392 1,132 -740 13,794 24,049 -10,255 5,724 10,579 -4,855Sulawesi Selatan 7,908,500 1,220 3,608 -2,388 147,423 76,681 70,742 25,855 33,730 -7,875Sulawesi Tenggara 2,118,300 5 966 -961 10,062 20,539 -10,477 4,353 9,035 -4,682Gorontalo 984,000 3 449 -446 3,901 9,541 -5,640 133 4,197 -4,064Sulawesi Barat 1,047,700 1,061 478 583 11,533 10,159 1,374 4,734 4,469 265Sulawesi 16,767,700 4,099 7,650 -3,551 202,720 162,581 40,139 54,764 71,516 -16,752
M a l u k u 1,339,500 189 611 -422 2,106 12,988 -10,882 289 5,713 -5,424Maluku Utara 975,000 58 445 -387 605 9,454 -8,849 167 4,158 -3,991Papua Barat 743,900 0 339 -339 724 7,213 -6,489 1,812 3,173 -1,361Papua 2,097,500 0 957 -957 5,516 20,338 -14,822 2,199 8,946 -6,747Maluku and Papua 5,155,900 247 2,352 -2,105 8,951 49,992 -41,041 4,467 21,990 -17,523
Indonesia 231,376,254 105,558 105,558 0 2,243,440 2,243,440 0 986,841 986,841 0
0.456218 9.696068 4.265092
Rambutan
Consumption per capita
Mangosteen MangoProduction, Consumption and Balance of Each Fruit by Provinces (2009) - 3/5
A - 77
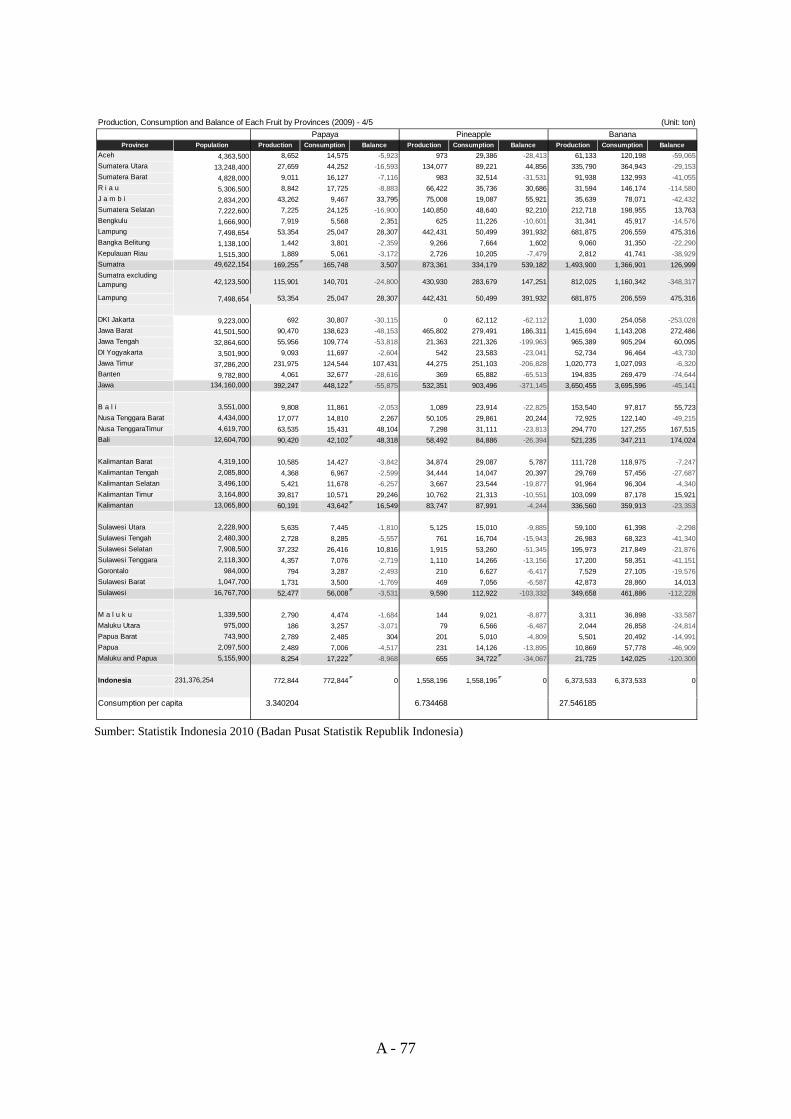
Sumber: Statistik Indonesia 2010 (Badan Pusat Statistik Republik Indonesia)
(Unit: ton)
Province Population Production Consumption Balance Production Consumption Balance Production Consumption BalanceAceh 4,363,500 8,652 14,575 -5,923 973 29,386 -28,413 61,133 120,198 -59,065Sumatera Utara 13,248,400 27,659 44,252 -16,593 134,077 89,221 44,856 335,790 364,943 -29,153Sumatera Barat 4,828,000 9,011 16,127 -7,116 983 32,514 -31,531 91,938 132,993 -41,055R i a u 5,306,500 8,842 17,725 -8,883 66,422 35,736 30,686 31,594 146,174 -114,580J a m b i 2,834,200 43,262 9,467 33,795 75,008 19,087 55,921 35,639 78,071 -42,432Sumatera Selatan 7,222,600 7,225 24,125 -16,900 140,850 48,640 92,210 212,718 198,955 13,763Bengkulu 1,666,900 7,919 5,568 2,351 625 11,226 -10,601 31,341 45,917 -14,576Lampung 7,498,654 53,354 25,047 28,307 442,431 50,499 391,932 681,875 206,559 475,316Bangka Belitung 1,138,100 1,442 3,801 -2,359 9,266 7,664 1,602 9,060 31,350 -22,290Kepulauan Riau 1,515,300 1,889 5,061 -3,172 2,726 10,205 -7,479 2,812 41,741 -38,929Sumatra 49,622,154 169,255 165,748 3,507 873,361 334,179 539,182 1,493,900 1,366,901 126,999Sumatra excludingLampung 42,123,500 115,901 140,701 -24,800 430,930 283,679 147,251 812,025 1,160,342 -348,317
Lampung 7,498,654 53,354 25,047 28,307 442,431 50,499 391,932 681,875 206,559 475,316
DKI Jakarta 9,223,000 692 30,807 -30,115 0 62,112 -62,112 1,030 254,058 -253,028Jawa Barat 41,501,500 90,470 138,623 -48,153 465,802 279,491 186,311 1,415,694 1,143,208 272,486Jawa Tengah 32,864,600 55,956 109,774 -53,818 21,363 221,326 -199,963 965,389 905,294 60,095DI Yogyakarta 3,501,900 9,093 11,697 -2,604 542 23,583 -23,041 52,734 96,464 -43,730Jawa Timur 37,286,200 231,975 124,544 107,431 44,275 251,103 -206,828 1,020,773 1,027,093 -6,320Banten 9,782,800 4,061 32,677 -28,616 369 65,882 -65,513 194,835 269,479 -74,644Jawa 134,160,000 392,247 448,122 -55,875 532,351 903,496 -371,145 3,650,455 3,695,596 -45,141
B a l i 3,551,000 9,808 11,861 -2,053 1,089 23,914 -22,825 153,540 97,817 55,723Nusa Tenggara Barat 4,434,000 17,077 14,810 2,267 50,105 29,861 20,244 72,925 122,140 -49,215Nusa TenggaraTimur 4,619,700 63,535 15,431 48,104 7,298 31,111 -23,813 294,770 127,255 167,515Bali 12,604,700 90,420 42,102 48,318 58,492 84,886 -26,394 521,235 347,211 174,024
Kalimantan Barat 4,319,100 10,585 14,427 -3,842 34,874 29,087 5,787 111,728 118,975 -7,247Kalimantan Tengah 2,085,800 4,368 6,967 -2,599 34,444 14,047 20,397 29,769 57,456 -27,687Kalimantan Selatan 3,496,100 5,421 11,678 -6,257 3,667 23,544 -19,877 91,964 96,304 -4,340Kalimantan Timur 3,164,800 39,817 10,571 29,246 10,762 21,313 -10,551 103,099 87,178 15,921Kalimantan 13,065,800 60,191 43,642 16,549 83,747 87,991 -4,244 336,560 359,913 -23,353
Sulawesi Utara 2,228,900 5,635 7,445 -1,810 5,125 15,010 -9,885 59,100 61,398 -2,298Sulawesi Tengah 2,480,300 2,728 8,285 -5,557 761 16,704 -15,943 26,983 68,323 -41,340Sulawesi Selatan 7,908,500 37,232 26,416 10,816 1,915 53,260 -51,345 195,973 217,849 -21,876Sulawesi Tenggara 2,118,300 4,357 7,076 -2,719 1,110 14,266 -13,156 17,200 58,351 -41,151Gorontalo 984,000 794 3,287 -2,493 210 6,627 -6,417 7,529 27,105 -19,576Sulawesi Barat 1,047,700 1,731 3,500 -1,769 469 7,056 -6,587 42,873 28,860 14,013Sulawesi 16,767,700 52,477 56,008 -3,531 9,590 112,922 -103,332 349,658 461,886 -112,228
M a l u k u 1,339,500 2,790 4,474 -1,684 144 9,021 -8,877 3,311 36,898 -33,587Maluku Utara 975,000 186 3,257 -3,071 79 6,566 -6,487 2,044 26,858 -24,814Papua Barat 743,900 2,789 2,485 304 201 5,010 -4,809 5,501 20,492 -14,991Papua 2,097,500 2,489 7,006 -4,517 231 14,126 -13,895 10,869 57,778 -46,909Maluku and Papua 5,155,900 8,254 17,222 -8,968 655 34,722 -34,067 21,725 142,025 -120,300
Indonesia 231,376,254 772,844 772,844 0 1,558,196 1,558,196 0 6,373,533 6,373,533 0
3.340204 6.734468 27.546185
Papaya Pineapple Banana
Consumption per capita
Production, Consumption and Balance of Each Fruit by Provinces (2009) - 4/5
A - 78
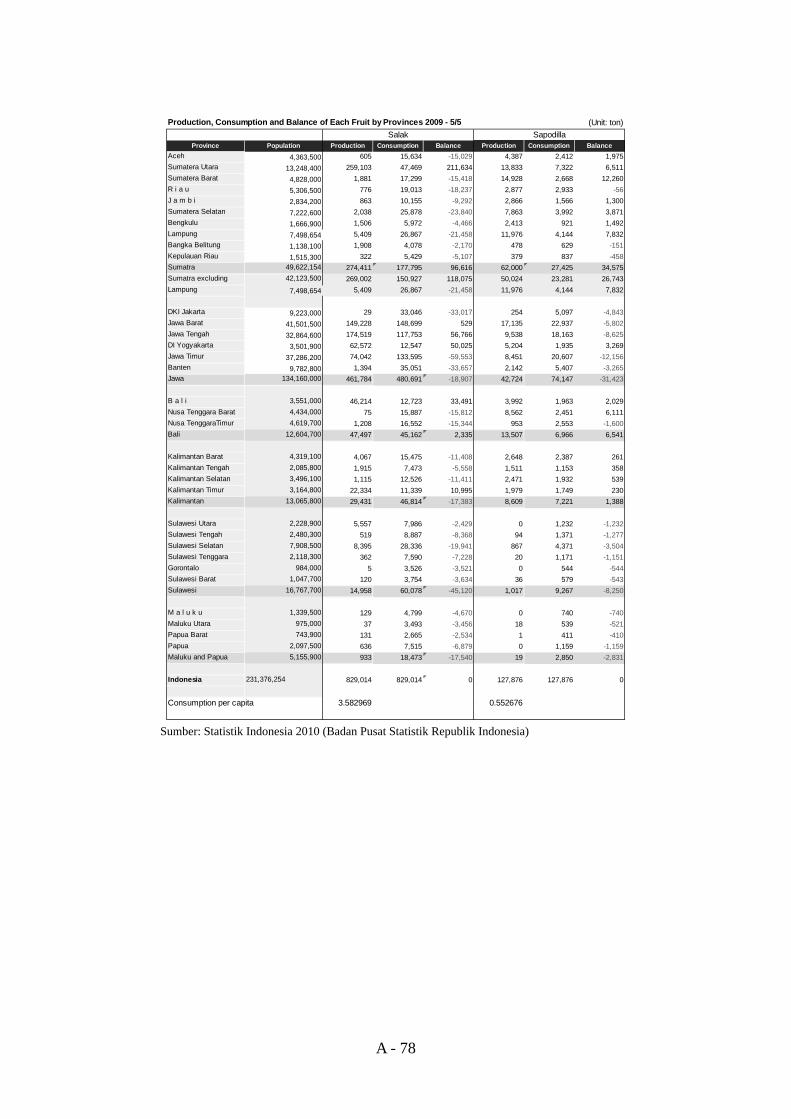
Sumber: Statistik Indonesia 2010 (Badan Pusat Statistik Republik Indonesia)
(Unit: ton)
Province Population Production Consumption Balance Production Consumption BalanceAceh 4,363,500 605 15,634 -15,029 4,387 2,412 1,975Sumatera Utara 13,248,400 259,103 47,469 211,634 13,833 7,322 6,511Sumatera Barat 4,828,000 1,881 17,299 -15,418 14,928 2,668 12,260R i a u 5,306,500 776 19,013 -18,237 2,877 2,933 -56J a m b i 2,834,200 863 10,155 -9,292 2,866 1,566 1,300Sumatera Selatan 7,222,600 2,038 25,878 -23,840 7,863 3,992 3,871Bengkulu 1,666,900 1,506 5,972 -4,466 2,413 921 1,492Lampung 7,498,654 5,409 26,867 -21,458 11,976 4,144 7,832Bangka Belitung 1,138,100 1,908 4,078 -2,170 478 629 -151Kepulauan Riau 1,515,300 322 5,429 -5,107 379 837 -458Sumatra 49,622,154 274,411 177,795 96,616 62,000 27,425 34,575Sumatra excluding 42,123,500 269,002 150,927 118,075 50,024 23,281 26,743Lampung 7,498,654 5,409 26,867 -21,458 11,976 4,144 7,832
DKI Jakarta 9,223,000 29 33,046 -33,017 254 5,097 -4,843Jawa Barat 41,501,500 149,228 148,699 529 17,135 22,937 -5,802Jawa Tengah 32,864,600 174,519 117,753 56,766 9,538 18,163 -8,625DI Yogyakarta 3,501,900 62,572 12,547 50,025 5,204 1,935 3,269Jawa Timur 37,286,200 74,042 133,595 -59,553 8,451 20,607 -12,156Banten 9,782,800 1,394 35,051 -33,657 2,142 5,407 -3,265Jawa 134,160,000 461,784 480,691 -18,907 42,724 74,147 -31,423
B a l i 3,551,000 46,214 12,723 33,491 3,992 1,963 2,029Nusa Tenggara Barat 4,434,000 75 15,887 -15,812 8,562 2,451 6,111Nusa TenggaraTimur 4,619,700 1,208 16,552 -15,344 953 2,553 -1,600Bali 12,604,700 47,497 45,162 2,335 13,507 6,966 6,541
Kalimantan Barat 4,319,100 4,067 15,475 -11,408 2,648 2,387 261Kalimantan Tengah 2,085,800 1,915 7,473 -5,558 1,511 1,153 358Kalimantan Selatan 3,496,100 1,115 12,526 -11,411 2,471 1,932 539Kalimantan Timur 3,164,800 22,334 11,339 10,995 1,979 1,749 230Kalimantan 13,065,800 29,431 46,814 -17,383 8,609 7,221 1,388
Sulawesi Utara 2,228,900 5,557 7,986 -2,429 0 1,232 -1,232Sulawesi Tengah 2,480,300 519 8,887 -8,368 94 1,371 -1,277Sulawesi Selatan 7,908,500 8,395 28,336 -19,941 867 4,371 -3,504Sulawesi Tenggara 2,118,300 362 7,590 -7,228 20 1,171 -1,151Gorontalo 984,000 5 3,526 -3,521 0 544 -544Sulawesi Barat 1,047,700 120 3,754 -3,634 36 579 -543Sulawesi 16,767,700 14,958 60,078 -45,120 1,017 9,267 -8,250
M a l u k u 1,339,500 129 4,799 -4,670 0 740 -740Maluku Utara 975,000 37 3,493 -3,456 18 539 -521Papua Barat 743,900 131 2,665 -2,534 1 411 -410Papua 2,097,500 636 7,515 -6,879 0 1,159 -1,159Maluku and Papua 5,155,900 933 18,473 -17,540 19 2,850 -2,831
Indonesia 231,376,254 829,014 829,014 0 127,876 127,876 0
3.582969 0.552676
Salak Sapodilla
Consumption per capita
Production, Consumption and Balance of Each Fruit by Provinces 2009 - 5/5
A - 79
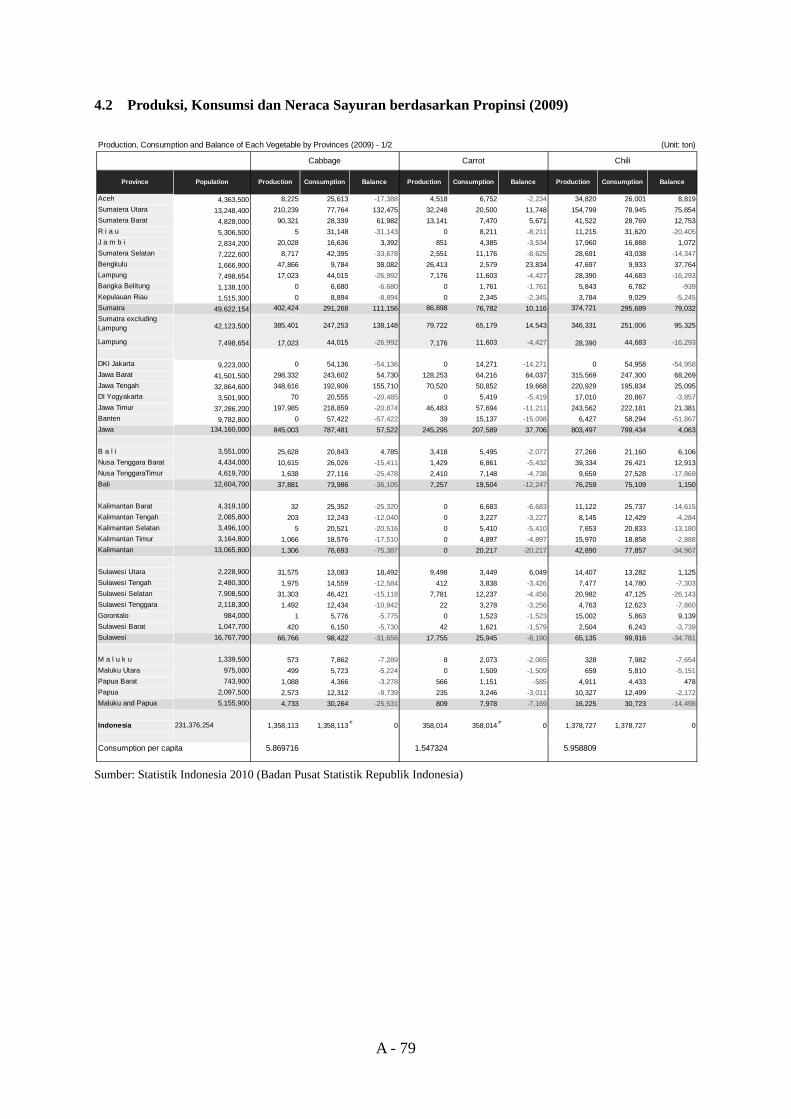
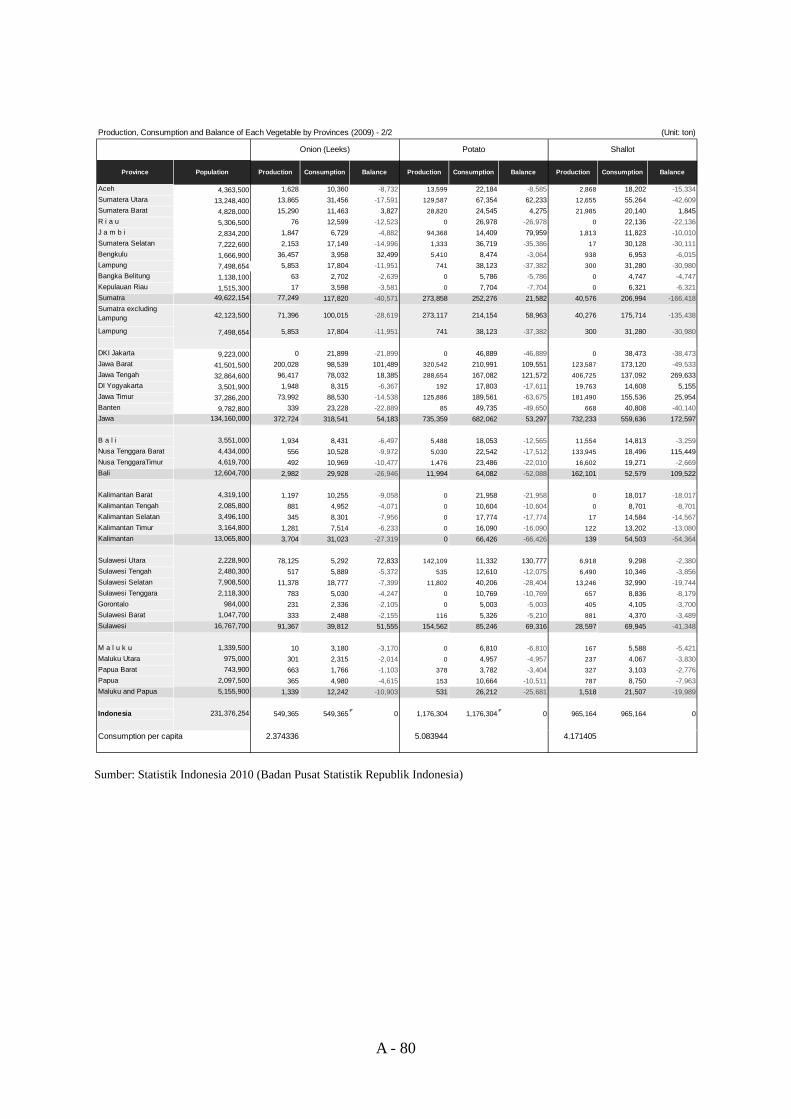
4.2 Produksi, Konsumsi dan Neraca Sayuran berdasarkan Propinsi (2009)
Sumber: Statistik Indonesia 2010 (Badan Pusat Statistik Republik Indonesia)
(Unit: ton)
Province Population Production Consumption Balance Production Consumption Balance Production Consumption Balance
Aceh 4,363,500 8,225 25,613 -17,388 4,518 6,752 -2,234 34,820 26,001 8,819Sumatera Utara 13,248,400 210,239 77,764 132,475 32,248 20,500 11,748 154,799 78,945 75,854Sumatera Barat 4,828,000 90,321 28,339 61,982 13,141 7,470 5,671 41,522 28,769 12,753R i a u 5,306,500 5 31,148 -31,143 0 8,211 -8,211 11,215 31,620 -20,405J a m b i 2,834,200 20,028 16,636 3,392 851 4,385 -3,534 17,960 16,888 1,072Sumatera Selatan 7,222,600 8,717 42,395 -33,678 2,551 11,176 -8,625 28,691 43,038 -14,347Bengkulu 1,666,900 47,866 9,784 38,082 26,413 2,579 23,834 47,697 9,933 37,764Lampung 7,498,654 17,023 44,015 -26,992 7,176 11,603 -4,427 28,390 44,683 -16,293Bangka Belitung 1,138,100 0 6,680 -6,680 0 1,761 -1,761 5,843 6,782 -939Kepulauan Riau 1,515,300 0 8,894 -8,894 0 2,345 -2,345 3,784 9,029 -5,245Sumatra 49,622,154 402,424 291,268 111,156 86,898 76,782 10,116 374,721 295,689 79,032Sumatra excludingLampung 42,123,500 385,401 247,253 138,148 79,722 65,179 14,543 346,331 251,006 95,325
Lampung 7,498,654 17,023 44,015 -26,992 7,176 11,603 -4,427 28,390 44,683 -16,293
DKI Jakarta 9,223,000 0 54,136 -54,136 0 14,271 -14,271 0 54,958 -54,958Jawa Barat 41,501,500 298,332 243,602 54,730 128,253 64,216 64,037 315,569 247,300 68,269Jawa Tengah 32,864,600 348,616 192,906 155,710 70,520 50,852 19,668 220,929 195,834 25,095DI Yogyakarta 3,501,900 70 20,555 -20,485 0 5,419 -5,419 17,010 20,867 -3,857Jawa Timur 37,286,200 197,985 218,859 -20,874 46,483 57,694 -11,211 243,562 222,181 21,381Banten 9,782,800 0 57,422 -57,422 39 15,137 -15,098 6,427 58,294 -51,867Jawa 134,160,000 845,003 787,481 57,522 245,295 207,589 37,706 803,497 799,434 4,063
B a l i 3,551,000 25,628 20,843 4,785 3,418 5,495 -2,077 27,266 21,160 6,106Nusa Tenggara Barat 4,434,000 10,615 26,026 -15,411 1,429 6,861 -5,432 39,334 26,421 12,913Nusa TenggaraTimur 4,619,700 1,638 27,116 -25,478 2,410 7,148 -4,738 9,659 27,528 -17,869Bali 12,604,700 37,881 73,986 -36,105 7,257 19,504 -12,247 76,259 75,109 1,150
Kalimantan Barat 4,319,100 32 25,352 -25,320 0 6,683 -6,683 11,122 25,737 -14,615Kalimantan Tengah 2,085,800 203 12,243 -12,040 0 3,227 -3,227 8,145 12,429 -4,284Kalimantan Selatan 3,496,100 5 20,521 -20,516 0 5,410 -5,410 7,653 20,833 -13,180Kalimantan Timur 3,164,800 1,066 18,576 -17,510 0 4,897 -4,897 15,970 18,858 -2,888Kalimantan 13,065,800 1,306 76,693 -75,387 0 20,217 -20,217 42,890 77,857 -34,967
Sulawesi Utara 2,228,900 31,575 13,083 18,492 9,498 3,449 6,049 14,407 13,282 1,125Sulawesi Tengah 2,480,300 1,975 14,559 -12,584 412 3,838 -3,426 7,477 14,780 -7,303Sulawesi Selatan 7,908,500 31,303 46,421 -15,118 7,781 12,237 -4,456 20,982 47,125 -26,143Sulawesi Tenggara 2,118,300 1,492 12,434 -10,942 22 3,278 -3,256 4,763 12,623 -7,860Gorontalo 984,000 1 5,776 -5,775 0 1,523 -1,523 15,002 5,863 9,139Sulawesi Barat 1,047,700 420 6,150 -5,730 42 1,621 -1,579 2,504 6,243 -3,739Sulawesi 16,767,700 66,766 98,422 -31,656 17,755 25,945 -8,190 65,135 99,916 -34,781
M a l u k u 1,339,500 573 7,862 -7,289 8 2,073 -2,065 328 7,982 -7,654Maluku Utara 975,000 499 5,723 -5,224 0 1,509 -1,509 659 5,810 -5,151Papua Barat 743,900 1,088 4,366 -3,278 566 1,151 -585 4,911 4,433 478Papua 2,097,500 2,573 12,312 -9,739 235 3,246 -3,011 10,327 12,499 -2,172Maluku and Papua 5,155,900 4,733 30,264 -25,531 809 7,978 -7,169 16,225 30,723 -14,498
Indonesia 231,376,254 1,358,113 1,358,113 0 358,014 358,014 0 1,378,727 1,378,727 0
5.869716 1.547324 5.958809
Cabbage Carrot Chili
Consumption per capita
Production, Consumption and Balance of Each Vegetable by Provinces (2009) - 1/2
A - 80
Sumber: Statistik Indonesia 2010 (Badan Pusat Statistik Republik Indonesia)
(Unit: ton)
Province Population Production Consumption Balance Production Consumption Balance Production Consumption Balance
Aceh 4,363,500 1,628 10,360 -8,732 13,599 22,184 -8,585 2,868 18,202 -15,334Sumatera Utara 13,248,400 13,865 31,456 -17,591 129,587 67,354 62,233 12,655 55,264 -42,609Sumatera Barat 4,828,000 15,290 11,463 3,827 28,820 24,545 4,275 21,985 20,140 1,845R i a u 5,306,500 76 12,599 -12,523 0 26,978 -26,978 0 22,136 -22,136J a m b i 2,834,200 1,847 6,729 -4,882 94,368 14,409 79,959 1,813 11,823 -10,010Sumatera Selatan 7,222,600 2,153 17,149 -14,996 1,333 36,719 -35,386 17 30,128 -30,111Bengkulu 1,666,900 36,457 3,958 32,499 5,410 8,474 -3,064 938 6,953 -6,015Lampung 7,498,654 5,853 17,804 -11,951 741 38,123 -37,382 300 31,280 -30,980Bangka Belitung 1,138,100 63 2,702 -2,639 0 5,786 -5,786 0 4,747 -4,747Kepulauan Riau 1,515,300 17 3,598 -3,581 0 7,704 -7,704 0 6,321 -6,321Sumatra 49,622,154 77,249 117,820 -40,571 273,858 252,276 21,582 40,576 206,994 -166,418Sumatra excludingLampung 42,123,500 71,396 100,015 -28,619 273,117 214,154 58,963 40,276 175,714 -135,438
Lampung 7,498,654 5,853 17,804 -11,951 741 38,123 -37,382 300 31,280 -30,980
DKI Jakarta 9,223,000 0 21,899 -21,899 0 46,889 -46,889 0 38,473 -38,473Jawa Barat 41,501,500 200,028 98,539 101,489 320,542 210,991 109,551 123,587 173,120 -49,533Jawa Tengah 32,864,600 96,417 78,032 18,385 288,654 167,082 121,572 406,725 137,092 269,633DI Yogyakarta 3,501,900 1,948 8,315 -6,367 192 17,803 -17,611 19,763 14,608 5,155Jawa Timur 37,286,200 73,992 88,530 -14,538 125,886 189,561 -63,675 181,490 155,536 25,954Banten 9,782,800 339 23,228 -22,889 85 49,735 -49,650 668 40,808 -40,140Jawa 134,160,000 372,724 318,541 54,183 735,359 682,062 53,297 732,233 559,636 172,597
B a l i 3,551,000 1,934 8,431 -6,497 5,488 18,053 -12,565 11,554 14,813 -3,259Nusa Tenggara Barat 4,434,000 556 10,528 -9,972 5,030 22,542 -17,512 133,945 18,496 115,449Nusa TenggaraTimur 4,619,700 492 10,969 -10,477 1,476 23,486 -22,010 16,602 19,271 -2,669Bali 12,604,700 2,982 29,928 -26,946 11,994 64,082 -52,088 162,101 52,579 109,522
Kalimantan Barat 4,319,100 1,197 10,255 -9,058 0 21,958 -21,958 0 18,017 -18,017Kalimantan Tengah 2,085,800 881 4,952 -4,071 0 10,604 -10,604 0 8,701 -8,701Kalimantan Selatan 3,496,100 345 8,301 -7,956 0 17,774 -17,774 17 14,584 -14,567Kalimantan Timur 3,164,800 1,281 7,514 -6,233 0 16,090 -16,090 122 13,202 -13,080Kalimantan 13,065,800 3,704 31,023 -27,319 0 66,426 -66,426 139 54,503 -54,364
Sulawesi Utara 2,228,900 78,125 5,292 72,833 142,109 11,332 130,777 6,918 9,298 -2,380Sulawesi Tengah 2,480,300 517 5,889 -5,372 535 12,610 -12,075 6,490 10,346 -3,856Sulawesi Selatan 7,908,500 11,378 18,777 -7,399 11,802 40,206 -28,404 13,246 32,990 -19,744Sulawesi Tenggara 2,118,300 783 5,030 -4,247 0 10,769 -10,769 657 8,836 -8,179Gorontalo 984,000 231 2,336 -2,105 0 5,003 -5,003 405 4,105 -3,700Sulawesi Barat 1,047,700 333 2,488 -2,155 116 5,326 -5,210 881 4,370 -3,489Sulawesi 16,767,700 91,367 39,812 51,555 154,562 85,246 69,316 28,597 69,945 -41,348
M a l u k u 1,339,500 10 3,180 -3,170 0 6,810 -6,810 167 5,588 -5,421Maluku Utara 975,000 301 2,315 -2,014 0 4,957 -4,957 237 4,067 -3,830Papua Barat 743,900 663 1,766 -1,103 378 3,782 -3,404 327 3,103 -2,776Papua 2,097,500 365 4,980 -4,615 153 10,664 -10,511 787 8,750 -7,963Maluku and Papua 5,155,900 1,339 12,242 -10,903 531 26,212 -25,681 1,518 21,507 -19,989
Indonesia 231,376,254 549,365 549,365 0 1,176,304 1,176,304 0 965,164 965,164 0
2.374336 5.083944 4.171405Consumption per capita
Onion (Leeks) Potato Shallot
Production, Consumption and Balance of Each Vegetable by Provinces (2009) - 2/2
A - 81
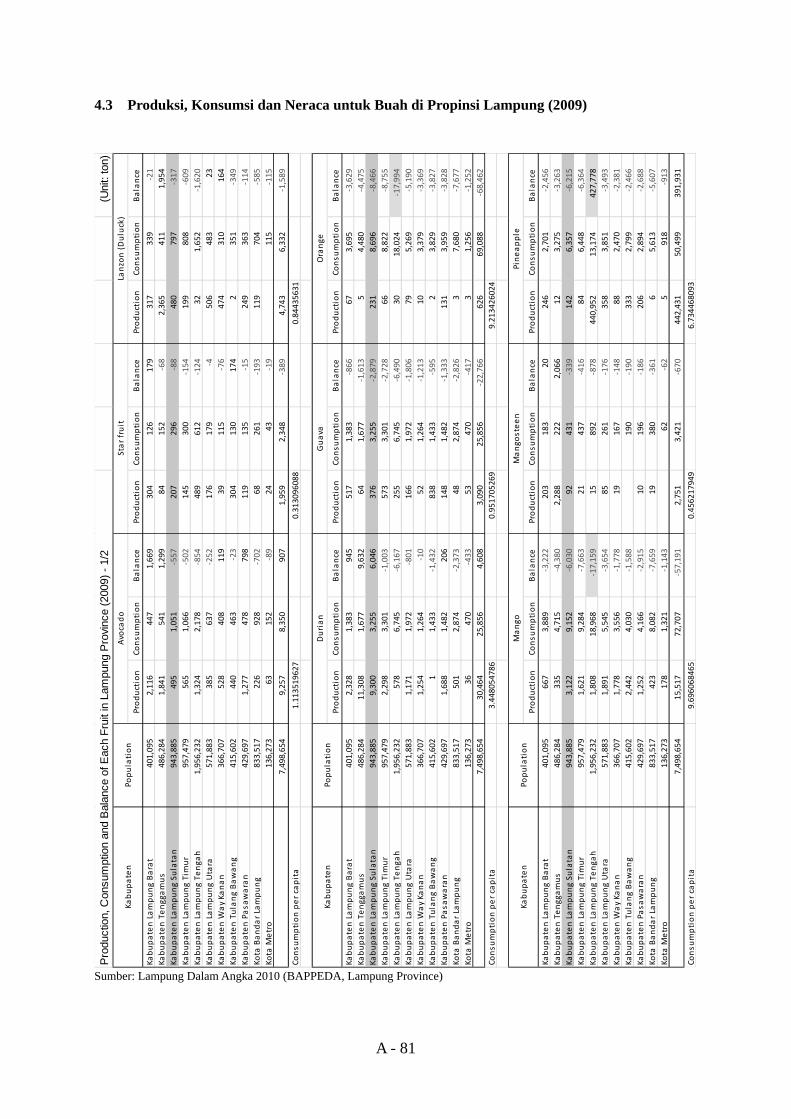
4.3 Produksi, Konsumsi dan Neraca untuk Buah di Propinsi Lampung (2009)
Sumber: Lampung Dalam Angka 2010 (BAPPEDA, Lampung Province)
(Uni
t: to
n)
Production
Consu
mption
Balance
Production
Consu
mption
Balance
Production
Consu
mption
Balance
Kabupaten Lampung Barat
401,095
2,116
447
1,669
304
126
179
317
339
‐21
Kabupaten Tenggamus
486,284
1,841
541
1,299
84152
‐68
2,365
411
1,954
Kabupaten Lampung Su
latan
943,885
495
1,051
‐557
207
296
‐88
480
797
‐317
Kabupaten Lampung Timur
957,479
565
1,066
‐502
145
300
‐154
199
808
‐609
Kabupaten Lampung Te
nga
h1,956,232
1,324
2,178
‐854
489
612
‐124
321,652
‐1,620
Kabupaten Lampung Utara
571,883
385
637
‐252
176
179
‐4506
483
23Ka
bupaten W
ay Ka
nan
366,707
528
408
119
39115
‐76
474
310
164
Kabupaten Tulang Bawang
415,602
440
463
‐23
304
130
174
2351
‐349
Kabupaten Pasa
waran
429,697
1,277
478
798
119
135
‐15
249
363
‐114
Kota Bandar Lampung
833,517
226
928
‐702
68261
‐193
119
704
‐585
Kota M
etro
136,273
63152
‐89
2443
‐19
115
‐115
7,498,654
9,257
8,350
907
1,959
2,348
‐389
4,743
6,332
‐1,589
Consu
mption per capita
1.113519627
0.313096088
0.84435631
Production
Consu
mption
Balance
Production
Consu
mption
Balance
Production
Consu
mption
Balance
Kabupaten Lampung Barat
401,095
2,328
1,383
945
517
1,383
‐866
673,695
‐3,629
Kabupaten Tenggamus
486,284
11,308
1,677
9,632
641,677
‐1,613
54,480
‐4,475
Kabupaten Lampung Su
latan
943,885
9,300
3,255
6,046
376
3,255
‐2,879
231
8,696
‐8,466
Kabupaten Lampung Timur
957,479
2,298
3,301
‐1,003
573
3,301
‐2,728
668,822
‐8,755
Kabupaten Lampung Te
nga
h1,956,232
578
6,745
‐6,167
255
6,745
‐6,490
3018,024
‐17,994
Kabupaten Lampung Utara
571,883
1,171
1,972
‐801
166
1,972
‐1,806
795,269
‐5,190
Kabupaten W
ay Ka
nan
366,707
1,254
1,264
‐10
521,264
‐1,213
103,379
‐3,369
Kabupaten Tulang Bawang
415,602
11,433
‐1,432
838
1,433
‐595
23,829
‐3,827
Kabupaten Pasa
waran
429,697
1,688
1,482
206
148
1,482
‐1,333
131
3,959
‐3,828
Kota Bandar Lampung
833,517
501
2,874
‐2,373
482,874
‐2,826
37,680
‐7,677
Kota M
etro
136,273
36470
‐433
53470
‐417
31,256
‐1,252
7,498,654
30,464
25,856
4,608
3,090
25,856
‐22,766
626
69,088
‐68,462
Consu
mption per capita
3.448054786
0.951705269
9.213426024
Production
Consu
mption
Balance
Production
Consu
mption
Balance
Production
Consu
mption
Balance
Kabupaten Lampung Barat
401,095
667
3,889
‐3,222
203
183
20246
2,701
‐2,456
Kabupaten Tenggamus
486,284
335
4,715
‐4,380
2,288
222
2,066
123,275
‐3,263
Kabupaten Lampung Su
latan
943,885
3,122
9,152
‐6,030
92431
‐339
142
6,357
‐6,215
Kabupaten Lampung Timur
957,479
1,621
9,284
‐7,663
21437
‐416
846,448
‐6,364
Kabupaten Lampung Te
nga
h1,956,232
1,808
18,968
‐17,159
15892
‐878
440,952
13,174
427,778
Kabupaten Lampung Utara
571,883
1,891
5,545
‐3,654
85261
‐176
358
3,851
‐3,493
Kabupaten W
ay Ka
nan
366,707
1,778
3,556
‐1,778
19167
‐148
882,470
‐2,381
Kabupaten Tulang Bawang
415,602
2,442
4,030
‐1,588
190
‐190
333
2,799
‐2,466
Kabupaten Pasa
waran
429,697
1,252
4,166
‐2,915
10196
‐186
206
2,894
‐2,688
Kota Bandar Lampung
833,517
423
8,082
‐7,659
19380
‐361
65,613
‐5,607
Kota M
etro
136,273
178
1,321
‐1,143
62‐62
5918
‐913
7,498,654
15,517
72,707
‐57,191
2,751
3,421
‐670
442,431
50,499
391,931
Consu
mption per capita
9.696068465
0.456217949
6.734468093
Prod
uctio
n, C
onsu
mpt
ion
and
Bal
ance
of E
ach
Frui
t in
Lam
pung
Pro
vinc
e (2
009)
- 1/
2
Mango
Mango
steen
Pineapple
Kabupaten
Population
Orange
Population
Avocado
Star fruit
Lanzon (Duluck)
Kabupaten
Kabupaten
Population
Durian
Guava
A - 82
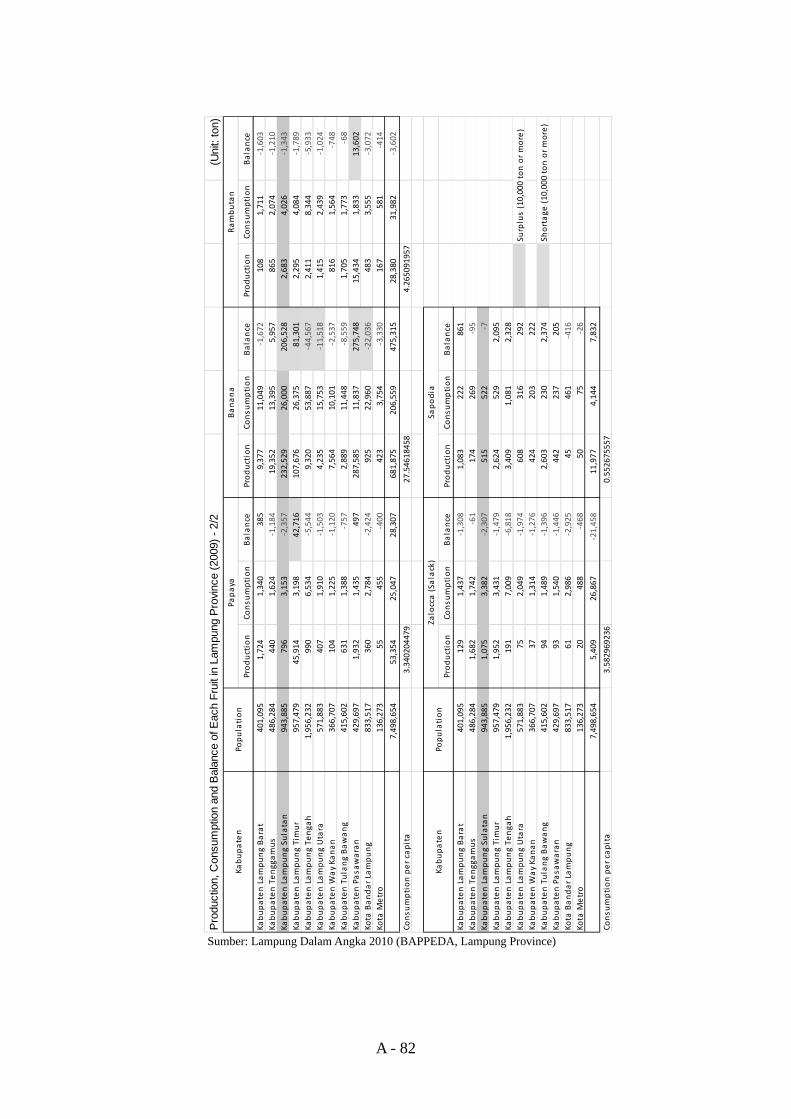
Sumber: Lampung Dalam Angka 2010 (BAPPEDA, Lampung Province)
(Uni
t: to
n)
Production
Consu
mption
Balance
Production
Consu
mption
Balance
Production
Consu
mption
Balance
Kabupaten Lampung Barat
401,095
1,724
1,340
385
9,377
11,049
‐1,672
108
1,711
‐1,603
Kabupaten Tenggamus
486,284
440
1,624
‐1,184
19,352
13,395
5,957
865
2,074
‐1,210
Kabupaten Lampung Su
latan
943,885
796
3,153
‐2,357
232,529
26,000
206,528
2,683
4,026
‐1,343
Kabupaten Lampung Timur
957,479
45,914
3,198
42,716
107,676
26,375
81,301
2,295
4,084
‐1,789
Kabupaten Lampung Te
nga
h1,956,232
990
6,534
‐5,544
9,320
53,887
‐44,567
2,411
8,344
‐5,933
Kabupaten Lampung Utara
571,883
407
1,910
‐1,503
4,235
15,753
‐11,518
1,415
2,439
‐1,024
Kabupaten W
ay Ka
nan
366,707
104
1,225
‐1,120
7,564
10,101
‐2,537
816
1,564
‐748
Kabupaten Tulang Bawang
415,602
631
1,388
‐757
2,889
11,448
‐8,559
1,705
1,773
‐68
Kabupaten Pasa
waran
429,697
1,932
1,435
497
287,585
11,837
275,748
15,434
1,833
13,602
Kota Bandar Lampung
833,517
360
2,784
‐2,424
925
22,960
‐22,036
483
3,555
‐3,072
Kota M
etro
136,273
55455
‐400
423
3,754
‐3,330
167
581
‐414
7,498,654
53,354
25,047
28,307
681,875
206,559
475,315
28,380
31,982
‐3,602
Consu
mption per capita
3.340204479
27.54618458
4.265091957
Production
Consu
mption
Balance
Production
Consu
mption
Balance
Kabupaten Lampung Barat
401,095
129
1,437
‐1,308
1,083
222
861
Kabupaten Tenggamus
486,284
1,682
1,742
‐61
174
269
‐95
Kabupaten Lampung Su
latan
943,885
1,075
3,382
‐2,307
515
522
‐7Ka
bupaten Lampung Timur
957,479
1,952
3,431
‐1,479
2,624
529
2,095
Kabupaten Lampung Te
nga
h1,956,232
191
7,009
‐6,818
3,409
1,081
2,328
Kabupaten Lampung Utara
571,883
752,049
‐1,974
608
316
292
Surplus (10,000 ton or more)
Kabupaten W
ay Ka
nan
366,707
371,314
‐1,276
424
203
222
Kabupaten Tulang Bawang
415,602
941,489
‐1,396
2,603
230
2,374
Shortage
(10,000
ton or more)
Kabupaten Pasa
waran
429,697
931,540
‐1,446
442
237
205
Kota Bandar Lampung
833,517
612,986
‐2,925
45461
‐416
Kota M
etro
136,273
20488
‐468
5075
‐26
7,498,654
5,409
26,867
‐21,458
11,977
4,144
7,832
Consu
mption per capita
3.582969236
0.552675557
Prod
uctio
n, C
onsu
mpt
ion
and
Bala
nce
of E
ach
Frui
t in
Lam
pung
Pro
vinc
e (2
009)
- 2/
2
Zalocca (Sa
lack)
Sapodia
Kabupaten
Population
Papaya
Banana
Rambutan
Kabupaten
Population
A - 83
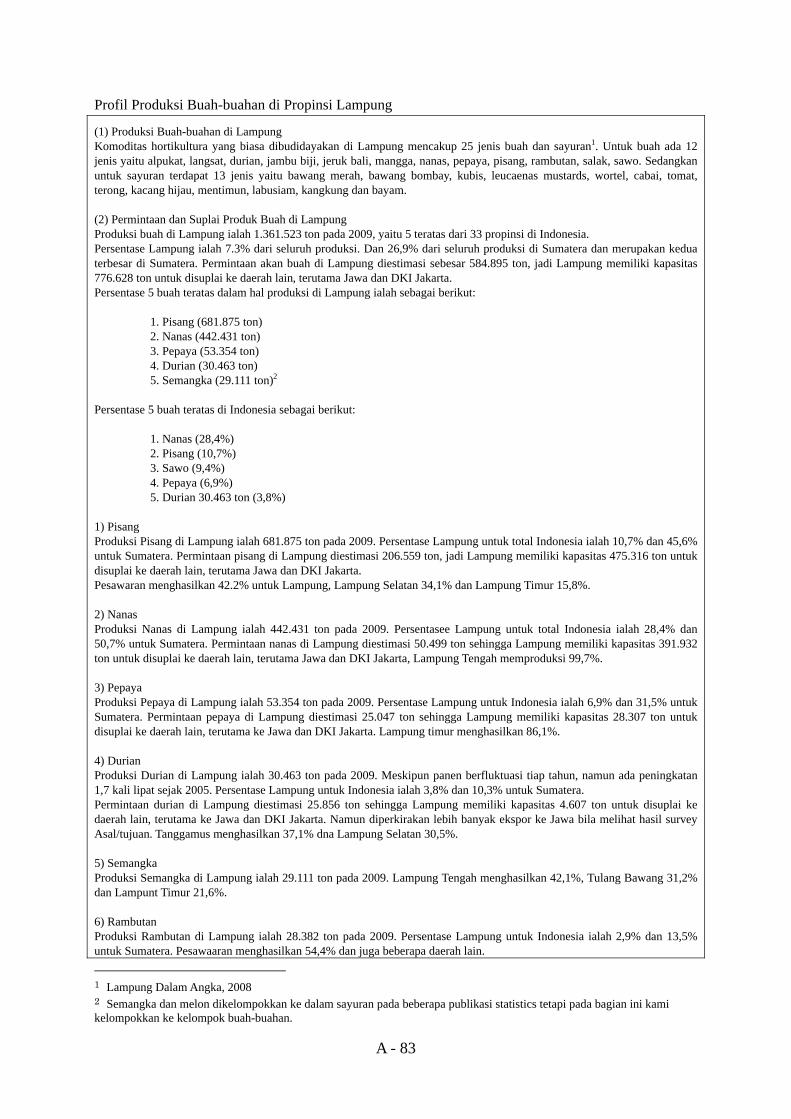
Profil Produksi Buah-buahan di Propinsi Lampung (1) Produksi Buah-buahan di Lampung Komoditas hortikultura yang biasa dibudidayakan di Lampung mencakup 25 jenis buah dan sayuran1. Untuk buah ada 12 jenis yaitu alpukat, langsat, durian, jambu biji, jeruk bali, mangga, nanas, pepaya, pisang, rambutan, salak, sawo. Sedangkan untuk sayuran terdapat 13 jenis yaitu bawang merah, bawang bombay, kubis, leucaenas mustards, wortel, cabai, tomat, terong, kacang hijau, mentimun, labusiam, kangkung dan bayam. (2) Permintaan dan Suplai Produk Buah di Lampung Produksi buah di Lampung ialah 1.361.523 ton pada 2009, yaitu 5 teratas dari 33 propinsi di Indonesia. Persentase Lampung ialah 7.3% dari seluruh produksi. Dan 26,9% dari seluruh produksi di Sumatera dan merupakan kedua terbesar di Sumatera. Permintaan akan buah di Lampung diestimasi sebesar 584.895 ton, jadi Lampung memiliki kapasitas 776.628 ton untuk disuplai ke daerah lain, terutama Jawa dan DKI Jakarta. Persentase 5 buah teratas dalam hal produksi di Lampung ialah sebagai berikut: 1. Pisang (681.875 ton) 2. Nanas (442.431 ton) 3. Pepaya (53.354 ton) 4. Durian (30.463 ton) 5. Semangka (29.111 ton)2 Persentase 5 buah teratas di Indonesia sebagai berikut: 1. Nanas (28,4%) 2. Pisang (10,7%) 3. Sawo (9,4%) 4. Pepaya (6,9%) 5. Durian 30.463 ton (3,8%) 1) Pisang Produksi Pisang di Lampung ialah 681.875 ton pada 2009. Persentase Lampung untuk total Indonesia ialah 10,7% dan 45,6% untuk Sumatera. Permintaan pisang di Lampung diestimasi 206.559 ton, jadi Lampung memiliki kapasitas 475.316 ton untuk disuplai ke daerah lain, terutama Jawa dan DKI Jakarta. Pesawaran menghasilkan 42.2% untuk Lampung, Lampung Selatan 34,1% dan Lampung Timur 15,8%. 2) Nanas Produksi Nanas di Lampung ialah 442.431 ton pada 2009. Persentasee Lampung untuk total Indonesia ialah 28,4% dan 50,7% untuk Sumatera. Permintaan nanas di Lampung diestimasi 50.499 ton sehingga Lampung memiliki kapasitas 391.932 ton untuk disuplai ke daerah lain, terutama Jawa dan DKI Jakarta, Lampung Tengah memproduksi 99,7%. 3) Pepaya Produksi Pepaya di Lampung ialah 53.354 ton pada 2009. Persentase Lampung untuk Indonesia ialah 6,9% dan 31,5% untuk Sumatera. Permintaan pepaya di Lampung diestimasi 25.047 ton sehingga Lampung memiliki kapasitas 28.307 ton untuk disuplai ke daerah lain, terutama ke Jawa dan DKI Jakarta. Lampung timur menghasilkan 86,1%. 4) Durian Produksi Durian di Lampung ialah 30.463 ton pada 2009. Meskipun panen berfluktuasi tiap tahun, namun ada peningkatan 1,7 kali lipat sejak 2005. Persentase Lampung untuk Indonesia ialah 3,8% dan 10,3% untuk Sumatera. Permintaan durian di Lampung diestimasi 25.856 ton sehingga Lampung memiliki kapasitas 4.607 ton untuk disuplai ke daerah lain, terutama ke Jawa dan DKI Jakarta. Namun diperkirakan lebih banyak ekspor ke Jawa bila melihat hasil survey Asal/tujuan. Tanggamus menghasilkan 37,1% dna Lampung Selatan 30,5%. 5) Semangka Produksi Semangka di Lampung ialah 29.111 ton pada 2009. Lampung Tengah menghasilkan 42,1%, Tulang Bawang 31,2% dan Lampunt Timur 21,6%. 6) Rambutan Produksi Rambutan di Lampung ialah 28.382 ton pada 2009. Persentase Lampung untuk Indonesia ialah 2,9% dan 13,5% untuk Sumatera. Pesawaaran menghasilkan 54,4% dan juga beberapa daerah lain. 1 Lampung Dalam Angka, 2008 2 Semangka dan melon dikelompokkan ke dalam sayuran pada beberapa publikasi statistics tetapi pada bagian ini kami kelompokkan ke kelompok buah-buahan.
A - 84
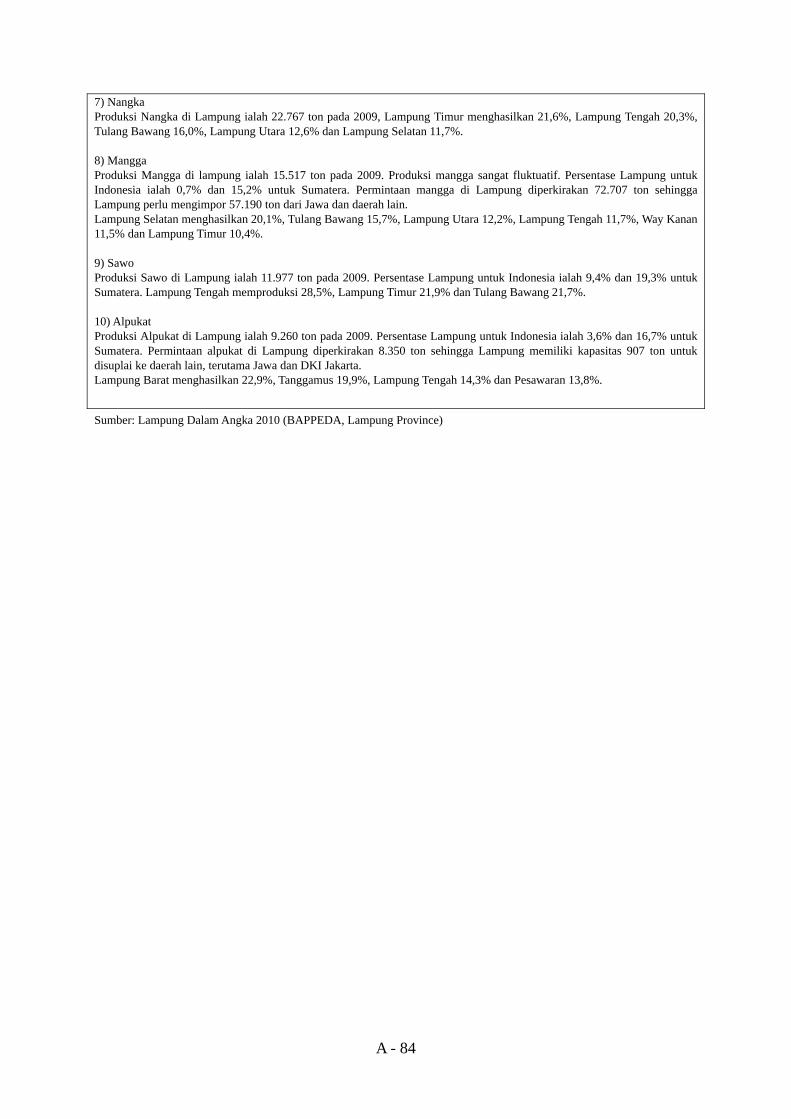
7) Nangka Produksi Nangka di Lampung ialah 22.767 ton pada 2009, Lampung Timur menghasilkan 21,6%, Lampung Tengah 20,3%, Tulang Bawang 16,0%, Lampung Utara 12,6% dan Lampung Selatan 11,7%. 8) Mangga Produksi Mangga di lampung ialah 15.517 ton pada 2009. Produksi mangga sangat fluktuatif. Persentase Lampung untuk Indonesia ialah 0,7% dan 15,2% untuk Sumatera. Permintaan mangga di Lampung diperkirakan 72.707 ton sehingga Lampung perlu mengimpor 57.190 ton dari Jawa dan daerah lain. Lampung Selatan menghasilkan 20,1%, Tulang Bawang 15,7%, Lampung Utara 12,2%, Lampung Tengah 11,7%, Way Kanan 11,5% dan Lampung Timur 10,4%. 9) Sawo Produksi Sawo di Lampung ialah 11.977 ton pada 2009. Persentase Lampung untuk Indonesia ialah 9,4% dan 19,3% untuk Sumatera. Lampung Tengah memproduksi 28,5%, Lampung Timur 21,9% dan Tulang Bawang 21,7%. 10) Alpukat Produksi Alpukat di Lampung ialah 9.260 ton pada 2009. Persentase Lampung untuk Indonesia ialah 3,6% dan 16,7% untuk Sumatera. Permintaan alpukat di Lampung diperkirakan 8.350 ton sehingga Lampung memiliki kapasitas 907 ton untuk disuplai ke daerah lain, terutama Jawa dan DKI Jakarta. Lampung Barat menghasilkan 22,9%, Tanggamus 19,9%, Lampung Tengah 14,3% dan Pesawaran 13,8%.
Sumber: Lampung Dalam Angka 2010 (BAPPEDA, Lampung Province)
A - 85
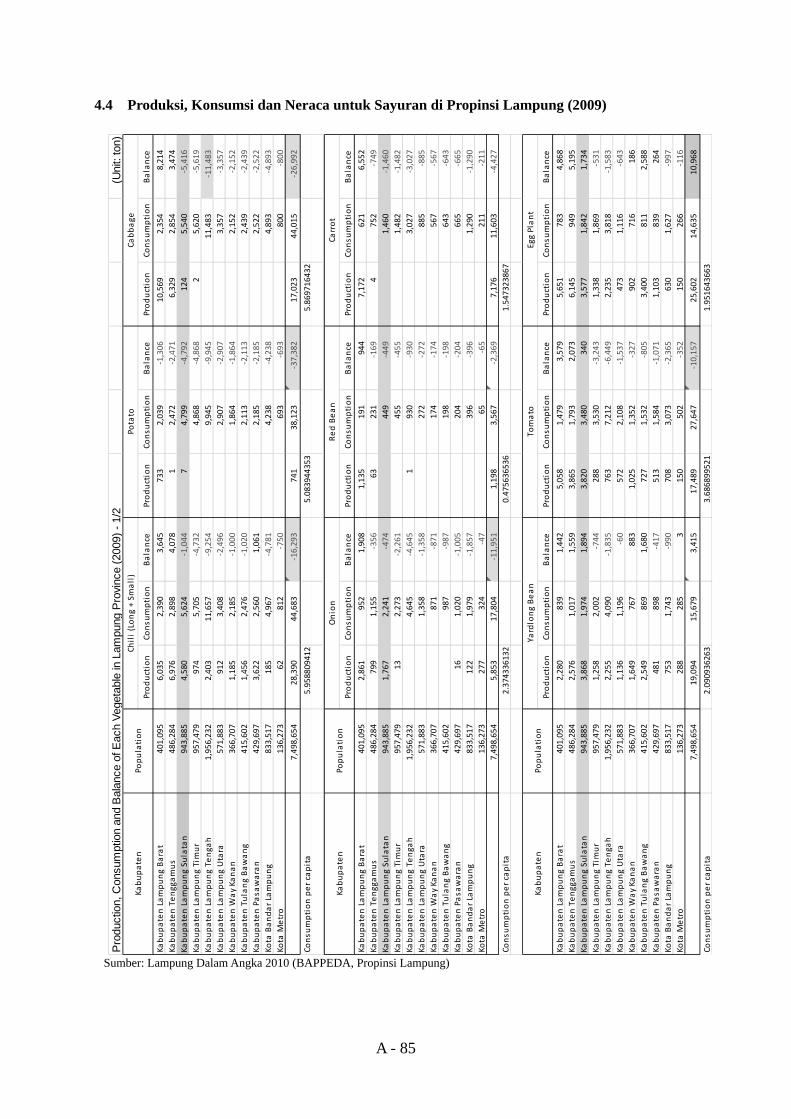
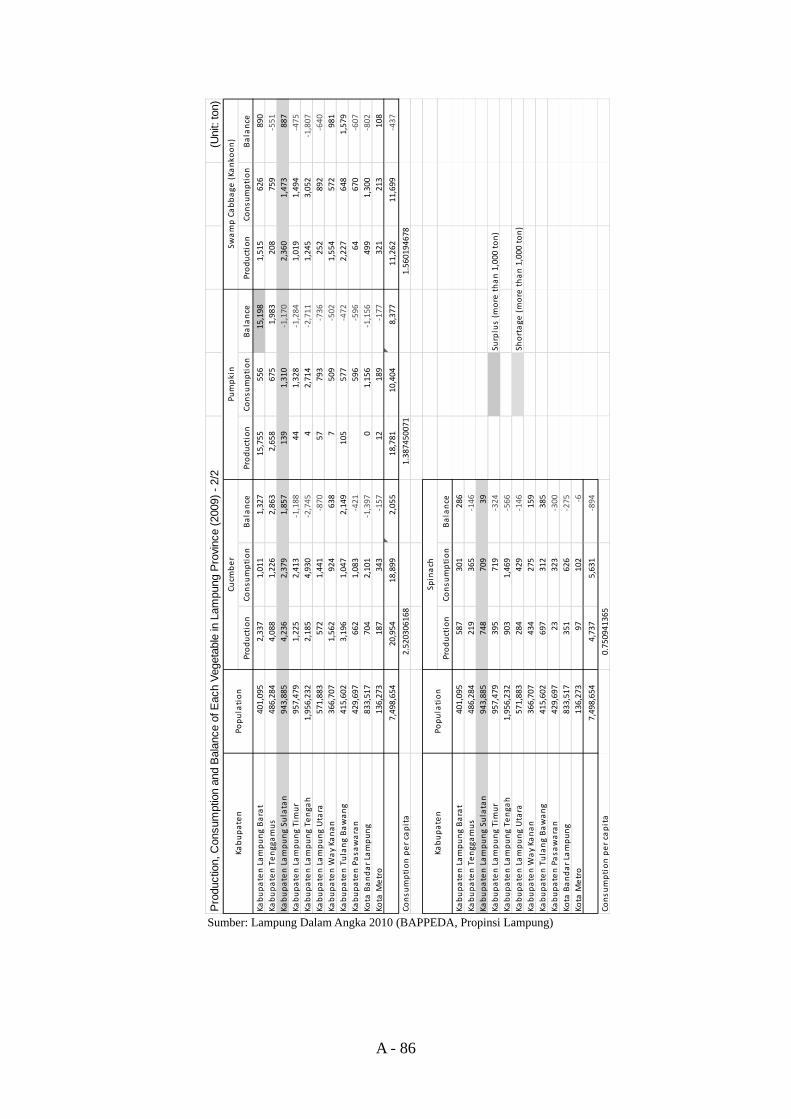
4.4 Produksi, Konsumsi dan Neraca untuk Sayuran di Propinsi Lampung (2009)
Sumber: Lampung Dalam Angka 2010 (BAPPEDA, Propinsi Lampung)
(Uni
t: to
n)
Production
Consu
mption
Balance
Production
Consu
mption
Balance
Production
Consu
mption
Balance
Kabupaten Lampung Barat
401,095
6,035
2,390
3,645
733
2,039
‐1,306
10,569
2,354
8,214
Kabupaten Tenggamus
486,284
6,976
2,898
4,078
12,472
‐2,471
6,329
2,854
3,474
Kabupaten Lampung Su
latan
943,885
4,580
5,624
‐1,044
74,799
‐4,792
124
5,540
‐5,416
Kabupaten Lampung Timur
957,479
974
5,705
‐4,732
4,868
‐4,868
25,620
‐5,619
Kabupaten Lampung Te
nga
h1,956,232
2,403
11,657
‐9,254
9,945
‐9,945
11,483
‐11,483
Kabupaten Lampung Utara
571,883
912
3,408
‐2,496
2,907
‐2,907
3,357
‐3,357
Kabupaten W
ay Ka
nan
366,707
1,185
2,185
‐1,000
1,864
‐1,864
2,152
‐2,152
Kabupaten Tulang Bawang
415,602
1,456
2,476
‐1,020
2,113
‐2,113
2,439
‐2,439
Kabupaten Pasa
waran
429,697
3,622
2,560
1,061
2,185
‐2,185
2,522
‐2,522
Kota Bandar Lampung
833,517
185
4,967
‐4,781
4,238
‐4,238
4,893
‐4,893
Kota M
etro
136,273
62812
‐750
693
‐693
800
‐800
7,498,654
28,390
44,683
‐16,293
741
38,123
‐37,382
17,023
44,015
‐26,992
Consu
mption per capita
5.958809412
5.083944353
5.869716432
Production
Consu
mption
Balance
Production
Consu
mption
Balance
Production
Consu
mption
Balance
Kabupaten Lampung Barat
401,095
2,861
952
1,908
1,135
191
944
7,172
621
6,552
Kabupaten Tenggamus
486,284
799
1,155
‐356
63231
‐169
4752
‐749
Kabupaten Lampung Su
latan
943,885
1,767
2,241
‐474
449
‐449
1,460
‐1,460
Kabupaten Lampung Timur
957,479
132,273
‐2,261
455
‐455
1,482
‐1,482
Kabupaten Lampung Te
nga
h1,956,232
4,645
‐4,645
1930
‐930
3,027
‐3,027
Kabupaten Lampung Utara
571,883
1,358
‐1,358
272
‐27 2
885
‐885
Kabupaten W
ay Ka
nan
366,707
871
‐871
174
‐174
567
‐567
Kabupaten Tulang Bawang
415,602
987
‐987
198
‐198
643
‐643
Kabupaten Pasa
waran
429,697
161,020
‐1,005
204
‐204
665
‐665
Kota Bandar Lampung
833,517
122
1,979
‐1,857
396
‐396
1,290
‐1,290
Kota M
etro
136,273
277
324
‐47
65‐65
211
‐211
7,498,654
5,853
17,804
‐11,951
1,198
3,567
‐2,369
7,176
11,603
‐4,427
Consu
mption per capita
2.374336132
0.475636536
1.547323867
Production
Consu
mption
Balance
Production
Consu
mption
Balance
Production
Consu
mption
Balance
Kabupaten Lampung Barat
401,095
2,280
839
1,442
5,058
1,479
3,579
5,651
783
4,868
Kabupaten Tenggamus
486,284
2,576
1,017
1,559
3,865
1,793
2,073
6,145
949
5,195
Kabupaten Lampung Su
latan
943,885
3,868
1,974
1,894
3,820
3,480
340
3,577
1,842
1,734
Kabupaten Lampung Timur
957,479
1,258
2,002
‐744
288
3,530
‐3,243
1,338
1,869
‐531
Kabupaten Lampung Te
nga
h1,956,232
2,255
4,090
‐1,835
763
7,212
‐6,449
2,235
3,818
‐1,583
Kabupaten Lampung Utara
571,883
1,136
1,196
‐60
572
2,108
‐1,537
473
1,116
‐643
Kabupaten W
ay Ka
nan
366,707
1,649
767
883
1,025
1,352
‐327
902
716
186
Kabupaten Tulang Bawang
415,602
2,549
869
1,680
727
1,532
‐805
3,400
811
2,588
Kabupaten Pasa
waran
429,697
481
898
‐417
513
1,584
‐1,071
1,103
839
264
Kota Bandar Lampung
833,517
753
1,743
‐990
708
3,073
‐2,365
630
1,627
‐997
Kota M
etro
136,273
288
285
3150
502
‐352
150
266
‐116
7,498,654
19,094
15,679
3,415
17,489
27,647
‐10,157
25,602
14,635
10,968
Consu
mption per capita
2.090936263
3.686899521
1.951643663
Pro
duct
ion,
Con
sum
ptio
n an
d B
alan
ce o
f Eac
h Ve
geta
ble
in L
ampu
ng P
rovi
nce
(200
9) -
1/2
Yardlong Bean
Tomato
Egg Plant
Kabupaten
Population
Carrot
Population
Chili (Long + Sm
all)
Potato
Cabbage
Kabupaten
Kabupaten
Population
Onion
Red Bean
A - 86
Sumber: Lampung Dalam Angka 2010 (BAPPEDA, Propinsi Lampung)
(Uni
t: to
n)
Production
Consu
mption
Balance
Production
Consu
mption
Balance
Production
Consu
mption
Balance
Kabupaten Lampung Barat
401,095
2,337
1,011
1,327
15,755
556
15,198
1,515
626
890
Kabupaten Tenggamus
486,284
4,088
1,226
2,863
2,658
675
1,983
208
759
‐551
Kabupaten Lampung Su
latan
943,885
4,236
2,379
1,857
139
1,310
‐1,170
2,360
1,473
887
Kabupaten Lampung Timur
957,479
1,225
2,413
‐1,188
441,328
‐1,284
1,019
1,494
‐475
Kabupaten Lampung Te
nga
h1,956,232
2,185
4,930
‐2,745
42,714
‐2,711
1,245
3,052
‐1,807
Kabupaten Lampung Utara
571,883
572
1,441
‐870
57793
‐736
252
892
‐640
Kabupaten W
ay Ka
nan
366,707
1,562
924
638
7509
‐502
1,554
572
981
Kabupaten Tulang Bawang
415,602
3,196
1,047
2,149
105
577
‐472
2,227
648
1,579
Kabupaten Pasa
waran
429,697
662
1,083
‐421
596
‐596
64670
‐607
Kota Bandar Lampung
833,517
704
2,101
‐1,397
01,156
‐1,156
499
1,300
‐802
Kota M
etro
136,273
187
343
‐157
12189
‐177
321
213
108
7,498,654
20,954
18,899
2,055
18,781
10,404
8,377
11,262
11,699
‐437
Consu
mption per capita
2.520306168
1.387450071
1.560194678
Production
Consu
mption
Balance
Kabupaten Lampung Barat
401,095
587
301
286
Kabupaten Tenggamus
486,284
219
365
‐146
Kabupaten Lampung Su
latan
943,885
748
709
39Ka
bupaten Lampung Timur
957,479
395
719
‐324
Surplus (m
ore than 1,000
ton)
Kabupaten Lampung Te
nga
h1,956,232
903
1,469
‐566
Kabupaten Lampung Utara
571,883
284
429
‐146
Shortage
(more than 1,000
ton)
Kabupaten W
ay Ka
nan
366,707
434
275
159
Kabupaten Tulang Bawang
415,602
697
312
385
Kabupaten Pasa
waran
429,697
23323
‐300
Kota Bandar Lampung
833,517
351
626
‐275
Kota M
etro
136,273
97102
‐6
7,498,654
4,737
5,631
‐894
Consu
mption per capita
0.750941365
Pro
duct
ion,
Con
sum
ptio
n an
d B
alan
ce o
f Eac
h Ve
geta
ble
in L
ampu
ng P
rovi
nce
(200
9) -
2/2
Spinach
Kabupaten
Population
Cucm
ber
Pumpkin
Swamp Cabbage
(Ka
nko
on)
Kabupaten
Population
A - 87
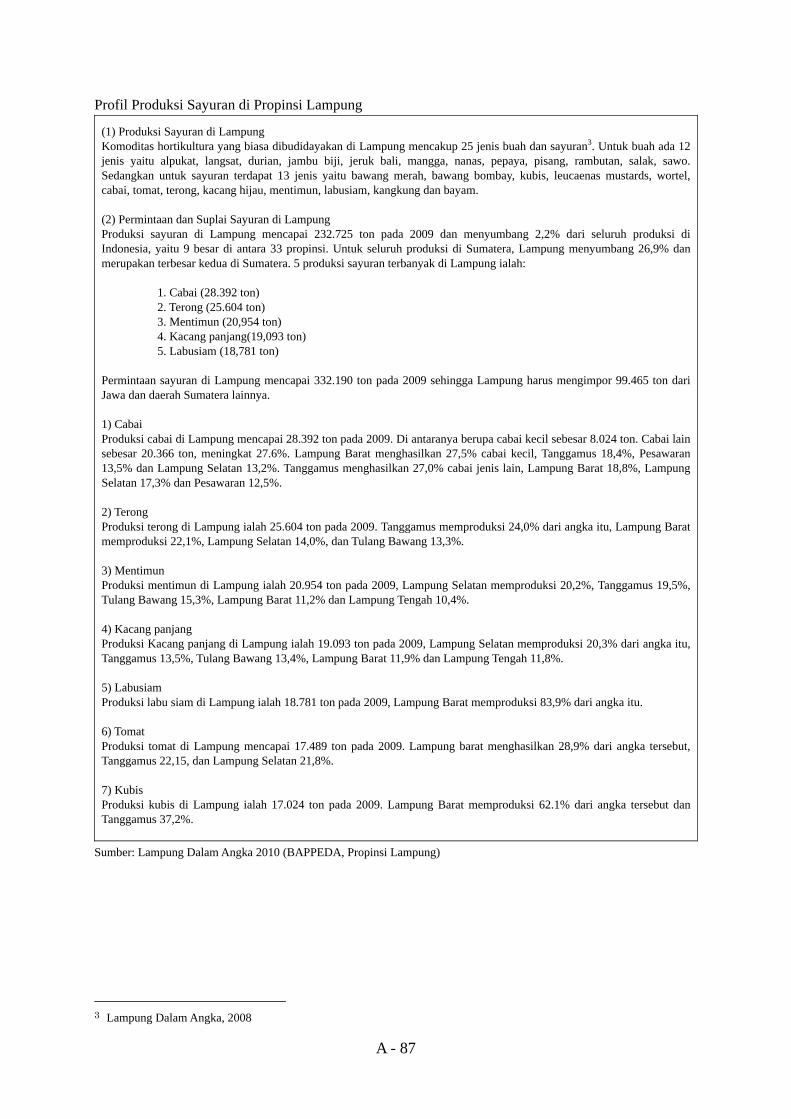
Profil Produksi Sayuran di Propinsi Lampung (1) Produksi Sayuran di Lampung Komoditas hortikultura yang biasa dibudidayakan di Lampung mencakup 25 jenis buah dan sayuran3. Untuk buah ada 12 jenis yaitu alpukat, langsat, durian, jambu biji, jeruk bali, mangga, nanas, pepaya, pisang, rambutan, salak, sawo. Sedangkan untuk sayuran terdapat 13 jenis yaitu bawang merah, bawang bombay, kubis, leucaenas mustards, wortel, cabai, tomat, terong, kacang hijau, mentimun, labusiam, kangkung dan bayam. (2) Permintaan dan Suplai Sayuran di Lampung Produksi sayuran di Lampung mencapai 232.725 ton pada 2009 dan menyumbang 2,2% dari seluruh produksi di Indonesia, yaitu 9 besar di antara 33 propinsi. Untuk seluruh produksi di Sumatera, Lampung menyumbang 26,9% dan merupakan terbesar kedua di Sumatera. 5 produksi sayuran terbanyak di Lampung ialah: 1. Cabai (28.392 ton) 2. Terong (25.604 ton) 3. Mentimun (20,954 ton) 4. Kacang panjang(19,093 ton) 5. Labusiam (18,781 ton) Permintaan sayuran di Lampung mencapai 332.190 ton pada 2009 sehingga Lampung harus mengimpor 99.465 ton dari Jawa dan daerah Sumatera lainnya. 1) Cabai Produksi cabai di Lampung mencapai 28.392 ton pada 2009. Di antaranya berupa cabai kecil sebesar 8.024 ton. Cabai lain sebesar 20.366 ton, meningkat 27.6%. Lampung Barat menghasilkan 27,5% cabai kecil, Tanggamus 18,4%, Pesawaran 13,5% dan Lampung Selatan 13,2%. Tanggamus menghasilkan 27,0% cabai jenis lain, Lampung Barat 18,8%, Lampung Selatan 17,3% dan Pesawaran 12,5%. 2) Terong Produksi terong di Lampung ialah 25.604 ton pada 2009. Tanggamus memproduksi 24,0% dari angka itu, Lampung Barat memproduksi 22,1%, Lampung Selatan 14,0%, dan Tulang Bawang 13,3%. 3) Mentimun Produksi mentimun di Lampung ialah 20.954 ton pada 2009, Lampung Selatan memproduksi 20,2%, Tanggamus 19,5%, Tulang Bawang 15,3%, Lampung Barat 11,2% dan Lampung Tengah 10,4%.
4) Kacang panjang Produksi Kacang panjang di Lampung ialah 19.093 ton pada 2009, Lampung Selatan memproduksi 20,3% dari angka itu, Tanggamus 13,5%, Tulang Bawang 13,4%, Lampung Barat 11,9% dan Lampung Tengah 11,8%. 5) Labusiam Produksi labu siam di Lampung ialah 18.781 ton pada 2009, Lampung Barat memproduksi 83,9% dari angka itu. 6) Tomat Produksi tomat di Lampung mencapai 17.489 ton pada 2009. Lampung barat menghasilkan 28,9% dari angka tersebut, Tanggamus 22,15, dan Lampung Selatan 21,8%. 7) Kubis Produksi kubis di Lampung ialah 17.024 ton pada 2009. Lampung Barat memproduksi 62.1% dari angka tersebut dan Tanggamus 37,2%.
Sumber: Lampung Dalam Angka 2010 (BAPPEDA, Propinsi Lampung)
3 Lampung Dalam Angka, 2008
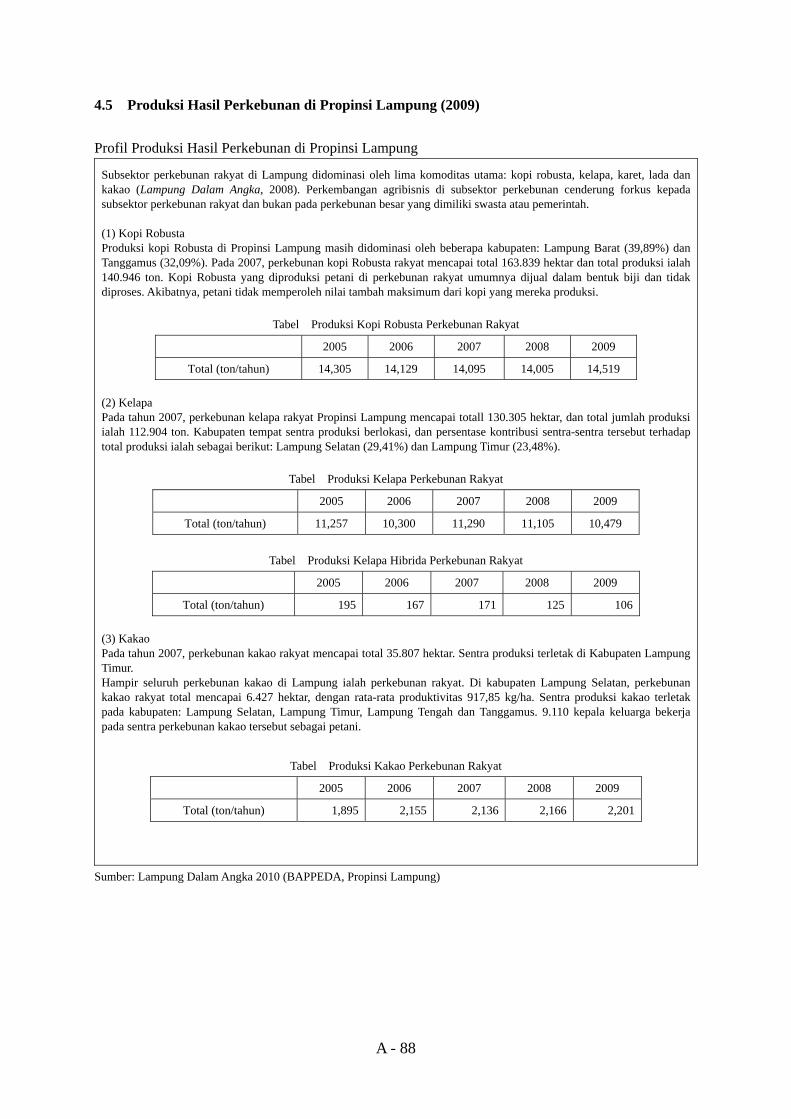
A - 88
4.5 Produksi Hasil Perkebunan di Propinsi Lampung (2009) Profil Produksi Hasil Perkebunan di Propinsi Lampung
Subsektor perkebunan rakyat di Lampung didominasi oleh lima komoditas utama: kopi robusta, kelapa, karet, lada dan kakao (Lampung Dalam Angka, 2008). Perkembangan agribisnis di subsektor perkebunan cenderung forkus kepada subsektor perkebunan rakyat dan bukan pada perkebunan besar yang dimiliki swasta atau pemerintah. (1) Kopi Robusta Produksi kopi Robusta di Propinsi Lampung masih didominasi oleh beberapa kabupaten: Lampung Barat (39,89%) dan Tanggamus (32,09%). Pada 2007, perkebunan kopi Robusta rakyat mencapai total 163.839 hektar dan total produksi ialah 140.946 ton. Kopi Robusta yang diproduksi petani di perkebunan rakyat umumnya dijual dalam bentuk biji dan tidak diproses. Akibatnya, petani tidak memperoleh nilai tambah maksimum dari kopi yang mereka produksi.
Tabel Produksi Kopi Robusta Perkebunan Rakyat
2005 2006 2007 2008 2009
Total (ton/tahun) 14,305 14,129 14,095 14,005 14,519 (2) Kelapa Pada tahun 2007, perkebunan kelapa rakyat Propinsi Lampung mencapai totall 130.305 hektar, dan total jumlah produksi ialah 112.904 ton. Kabupaten tempat sentra produksi berlokasi, dan persentase kontribusi sentra-sentra tersebut terhadap total produksi ialah sebagai berikut: Lampung Selatan (29,41%) dan Lampung Timur (23,48%).
Tabel Produksi Kelapa Perkebunan Rakyat
2005 2006 2007 2008 2009
Total (ton/tahun) 11,257 10,300 11,290 11,105 10,479
Tabel Produksi Kelapa Hibrida Perkebunan Rakyat
2005 2006 2007 2008 2009
Total (ton/tahun) 195 167 171 125 106 (3) Kakao Pada tahun 2007, perkebunan kakao rakyat mencapai total 35.807 hektar. Sentra produksi terletak di Kabupaten Lampung Timur. Hampir seluruh perkebunan kakao di Lampung ialah perkebunan rakyat. Di kabupaten Lampung Selatan, perkebunan kakao rakyat total mencapai 6.427 hektar, dengan rata-rata produktivitas 917,85 kg/ha. Sentra produksi kakao terletak pada kabupaten: Lampung Selatan, Lampung Timur, Lampung Tengah dan Tanggamus. 9.110 kepala keluarga bekerja pada sentra perkebunan kakao tersebut sebagai petani.
Tabel Produksi Kakao Perkebunan Rakyat
2005 2006 2007 2008 2009
Total (ton/tahun) 1,895 2,155 2,136 2,166 2,201
Sumber: Lampung Dalam Angka 2010 (BAPPEDA, Propinsi Lampung)
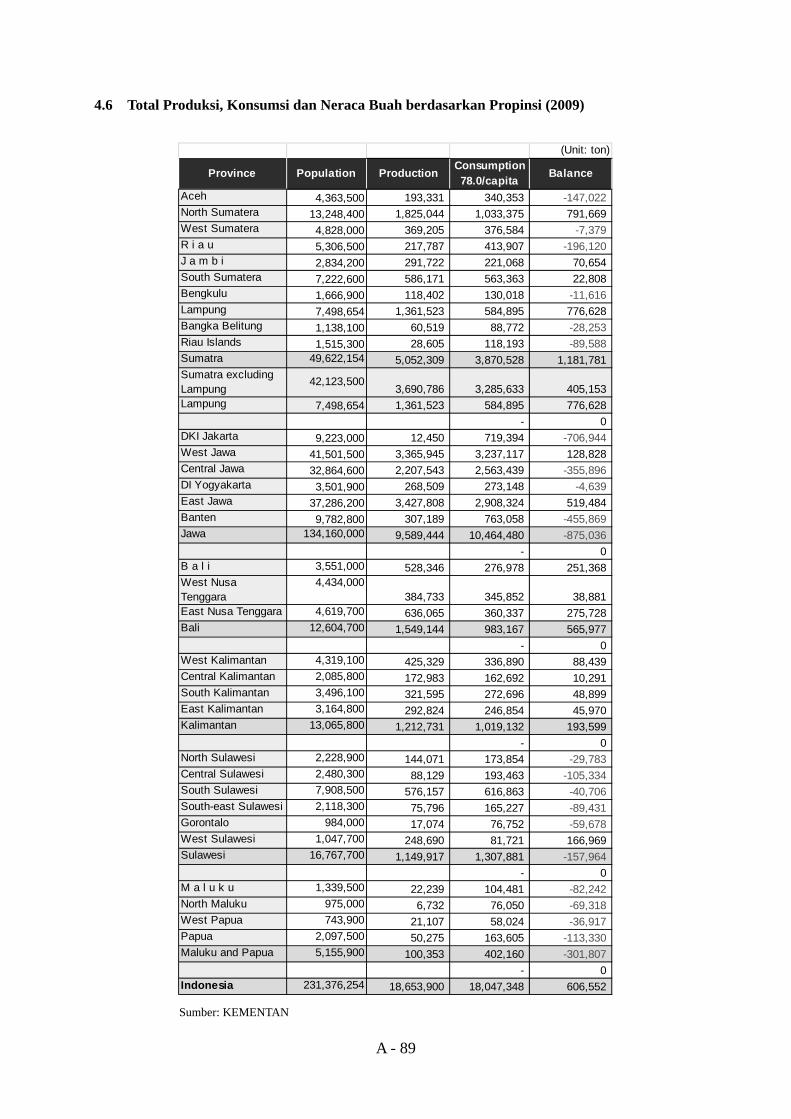
A - 89
4.6 Total Produksi, Konsumsi dan Neraca Buah berdasarkan Propinsi (2009)
Sumber: KEMENTAN
(Unit: ton)Consumption78.0/capita
Aceh 4,363,500 193,331 340,353 -147,022 North Sumatera 13,248,400 1,825,044 1,033,375 791,669West Sumatera 4,828,000 369,205 376,584 -7,379 R i a u 5,306,500 217,787 413,907 -196,120 J a m b i 2,834,200 291,722 221,068 70,654South Sumatera 7,222,600 586,171 563,363 22,808Bengkulu 1,666,900 118,402 130,018 -11,616 Lampung 7,498,654 1,361,523 584,895 776,628Bangka Belitung 1,138,100 60,519 88,772 -28,253 Riau Islands 1,515,300 28,605 118,193 -89,588 Sumatra 49,622,154 5,052,309 3,870,528 1,181,781Sumatra excludingLampung
42,123,5003,690,786 3,285,633 405,153
Lampung 7,498,654 1,361,523 584,895 776,628- 0
DKI Jakarta 9,223,000 12,450 719,394 -706,944 West Jawa 41,501,500 3,365,945 3,237,117 128,828Central Jawa 32,864,600 2,207,543 2,563,439 -355,896 DI Yogyakarta 3,501,900 268,509 273,148 -4,639 East Jawa 37,286,200 3,427,808 2,908,324 519,484Banten 9,782,800 307,189 763,058 -455,869 Jawa 134,160,000 9,589,444 10,464,480 -875,036
- 0B a l i 3,551,000 528,346 276,978 251,368West NusaTenggara
4,434,000384,733 345,852 38,881
East Nusa Tenggara 4,619,700 636,065 360,337 275,728Bali 12,604,700 1,549,144 983,167 565,977
- 0West Kalimantan 4,319,100 425,329 336,890 88,439Central Kalimantan 2,085,800 172,983 162,692 10,291South Kalimantan 3,496,100 321,595 272,696 48,899East Kalimantan 3,164,800 292,824 246,854 45,970Kalimantan 13,065,800 1,212,731 1,019,132 193,599
- 0North Sulawesi 2,228,900 144,071 173,854 -29,783 Central Sulawesi 2,480,300 88,129 193,463 -105,334 South Sulawesi 7,908,500 576,157 616,863 -40,706 South-east Sulawesi 2,118,300 75,796 165,227 -89,431 Gorontalo 984,000 17,074 76,752 -59,678 West Sulawesi 1,047,700 248,690 81,721 166,969Sulawesi 16,767,700 1,149,917 1,307,881 -157,964
- 0M a l u k u 1,339,500 22,239 104,481 -82,242 North Maluku 975,000 6,732 76,050 -69,318 West Papua 743,900 21,107 58,024 -36,917 Papua 2,097,500 50,275 163,605 -113,330 Maluku and Papua 5,155,900 100,353 402,160 -301,807
- 0Indonesia 231,376,254 18,653,900 18,047,348 606,552
BalanceProvince Population Production
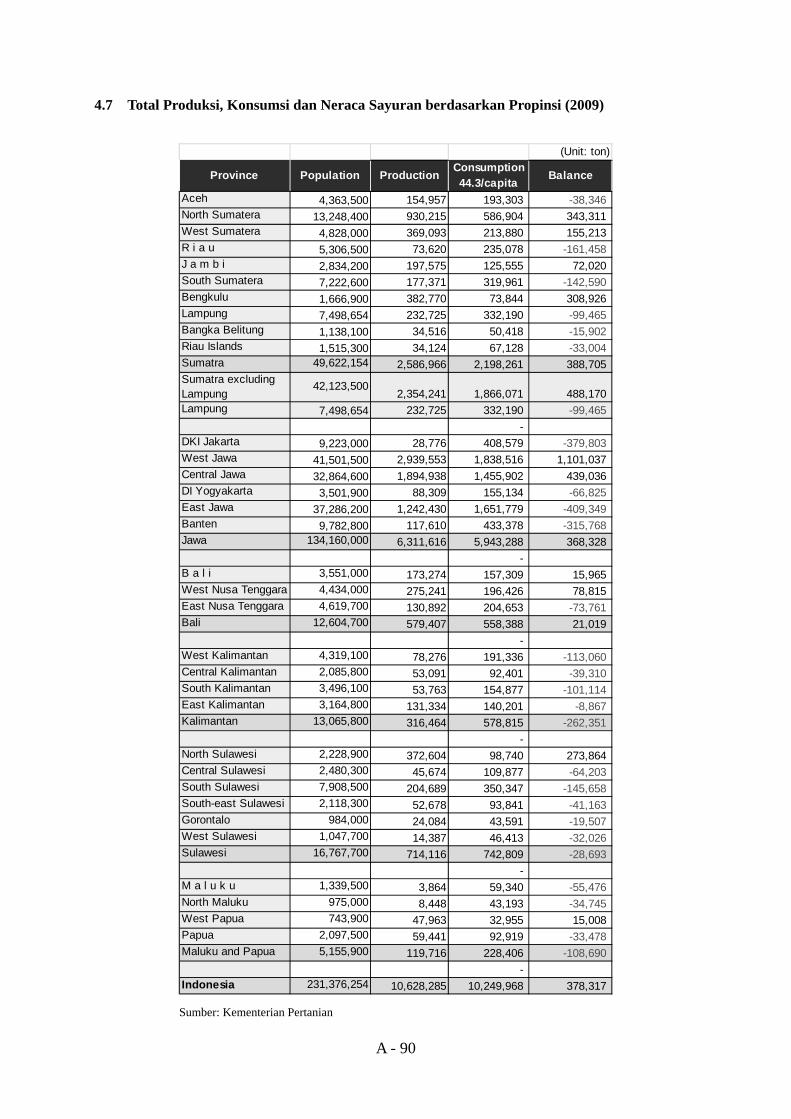
A - 90
4.7 Total Produksi, Konsumsi dan Neraca Sayuran berdasarkan Propinsi (2009)
Sumber: Kementerian Pertanian
(Unit: ton)Consumption44.3/capita
Aceh 4,363,500 154,957 193,303 -38,346 North Sumatera 13,248,400 930,215 586,904 343,311West Sumatera 4,828,000 369,093 213,880 155,213R i a u 5,306,500 73,620 235,078 -161,458 J a m b i 2,834,200 197,575 125,555 72,020South Sumatera 7,222,600 177,371 319,961 -142,590 Bengkulu 1,666,900 382,770 73,844 308,926Lampung 7,498,654 232,725 332,190 -99,465 Bangka Belitung 1,138,100 34,516 50,418 -15,902 Riau Islands 1,515,300 34,124 67,128 -33,004 Sumatra 49,622,154 2,586,966 2,198,261 388,705Sumatra excludingLampung
42,123,5002,354,241 1,866,071 488,170
Lampung 7,498,654 232,725 332,190 -99,465 -
DKI Jakarta 9,223,000 28,776 408,579 -379,803 West Jawa 41,501,500 2,939,553 1,838,516 1,101,037Central Jawa 32,864,600 1,894,938 1,455,902 439,036DI Yogyakarta 3,501,900 88,309 155,134 -66,825 East Jawa 37,286,200 1,242,430 1,651,779 -409,349 Banten 9,782,800 117,610 433,378 -315,768 Jawa 134,160,000 6,311,616 5,943,288 368,328
- B a l i 3,551,000 173,274 157,309 15,965West Nusa Tenggara 4,434,000 275,241 196,426 78,815East Nusa Tenggara 4,619,700 130,892 204,653 -73,761 Bali 12,604,700 579,407 558,388 21,019
- West Kalimantan 4,319,100 78,276 191,336 -113,060 Central Kalimantan 2,085,800 53,091 92,401 -39,310 South Kalimantan 3,496,100 53,763 154,877 -101,114 East Kalimantan 3,164,800 131,334 140,201 -8,867 Kalimantan 13,065,800 316,464 578,815 -262,351
- North Sulawesi 2,228,900 372,604 98,740 273,864Central Sulawesi 2,480,300 45,674 109,877 -64,203 South Sulawesi 7,908,500 204,689 350,347 -145,658 South-east Sulawesi 2,118,300 52,678 93,841 -41,163 Gorontalo 984,000 24,084 43,591 -19,507 West Sulawesi 1,047,700 14,387 46,413 -32,026 Sulawesi 16,767,700 714,116 742,809 -28,693
- M a l u k u 1,339,500 3,864 59,340 -55,476 North Maluku 975,000 8,448 43,193 -34,745 West Papua 743,900 47,963 32,955 15,008Papua 2,097,500 59,441 92,919 -33,478 Maluku and Papua 5,155,900 119,716 228,406 -108,690
- Indonesia 231,376,254 10,628,285 10,249,968 378,317
ProductionPopulationProvince Balance
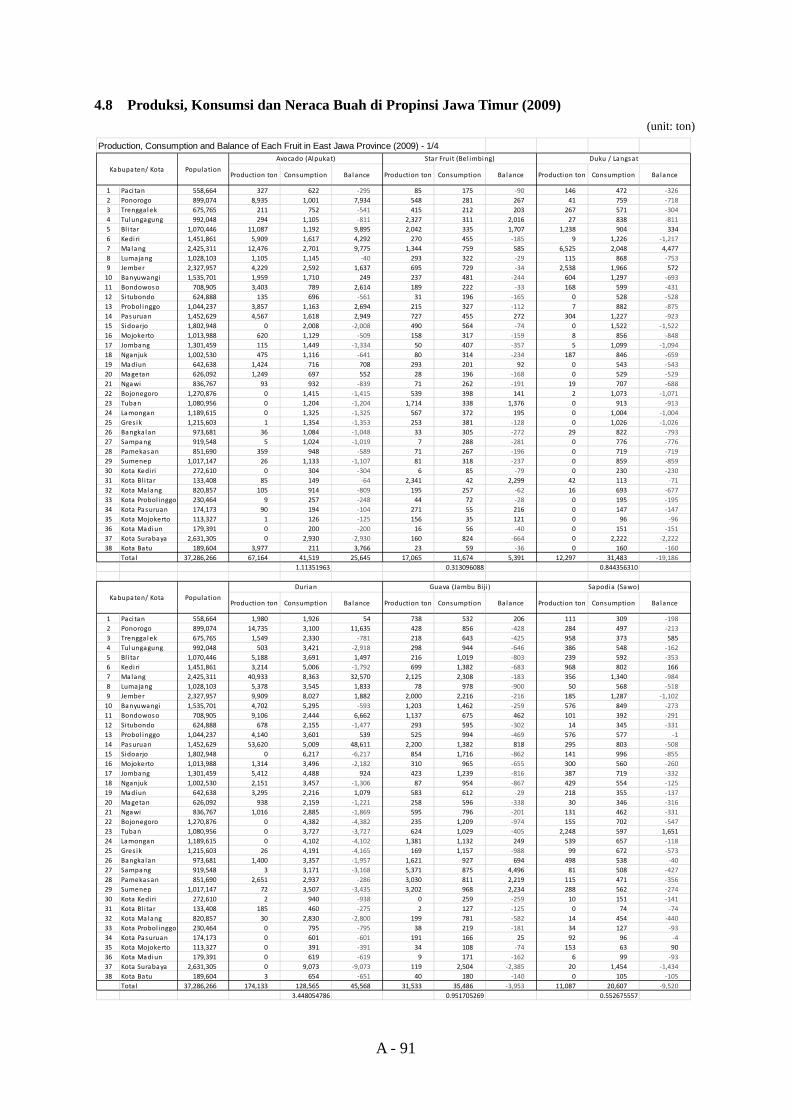
A - 91
4.8 Produksi, Konsumsi dan Neraca Buah di Propinsi Jawa Timur (2009) (unit: ton)
Production, Consumption and Balance of Each Fruit in East Jawa Province (2009) - 1/4
Production ton Consumption Balance Production ton Consumption Balance Production ton Consumption Balance
1 Paci tan 558,664 327 622 ‐295 85 175 ‐90 146 472 ‐3262 Ponorogo 899,074 8,935 1,001 7,934 548 281 267 41 759 ‐7183 Trenggalek 675,765 211 752 ‐541 415 212 203 267 571 ‐3044 Tulungagung 992,048 294 1,105 ‐811 2,327 311 2,016 27 838 ‐8115 Bl i tar 1,070,446 11,087 1,192 9,895 2,042 335 1,707 1,238 904 3346 Kedi ri 1,451,861 5,909 1,617 4,292 270 455 ‐185 9 1,226 ‐1,2177 Malang 2,425,311 12,476 2,701 9,775 1,344 759 585 6,525 2,048 4,4778 Lumajang 1,028,103 1,105 1,145 ‐40 293 322 ‐29 115 868 ‐7539 Jember 2,327,957 4,229 2,592 1,637 695 729 ‐34 2,538 1,966 57210 Banyuwangi 1,535,701 1,959 1,710 249 237 481 ‐244 604 1,297 ‐69311 Bondowoso 708,905 3,403 789 2,614 189 222 ‐33 168 599 ‐43112 Situbondo 624,888 135 696 ‐561 31 196 ‐165 0 528 ‐52813 Probol inggo 1,044,237 3,857 1,163 2,694 215 327 ‐112 7 882 ‐87514 Pasuruan 1,452,629 4,567 1,618 2,949 727 455 272 304 1,227 ‐92315 Sidoarjo 1,802,948 0 2,008 ‐2,008 490 564 ‐74 0 1,522 ‐1,52216 Mojokerto 1,013,988 620 1,129 ‐509 158 317 ‐159 8 856 ‐84817 Jombang 1,301,459 115 1,449 ‐1,334 50 407 ‐357 5 1,099 ‐1,09418 Nganjuk 1,002,530 475 1,116 ‐641 80 314 ‐234 187 846 ‐65919 Madiun 642,638 1,424 716 708 293 201 92 0 543 ‐54320 Magetan 626,092 1,249 697 552 28 196 ‐168 0 529 ‐52921 Ngawi 836,767 93 932 ‐839 71 262 ‐191 19 707 ‐68822 Bojonegoro 1,270,876 0 1,415 ‐1,415 539 398 141 2 1,073 ‐1,07123 Tuban 1,080,956 0 1,204 ‐1,204 1,714 338 1,376 0 913 ‐91324 Lamongan 1,189,615 0 1,325 ‐1,325 567 372 195 0 1,004 ‐1,00425 Gres ik 1,215,603 1 1,354 ‐1,353 253 381 ‐128 0 1,026 ‐1,02626 Bangka lan 973,681 36 1,084 ‐1,048 33 305 ‐272 29 822 ‐79327 Sampang 919,548 5 1,024 ‐1,019 7 288 ‐281 0 776 ‐77628 Pamekasan 851,690 359 948 ‐589 71 267 ‐196 0 719 ‐71929 Sumenep 1,017,147 26 1,133 ‐1,107 81 318 ‐237 0 859 ‐85930 Kota Kediri 272,610 0 304 ‐304 6 85 ‐79 0 230 ‐23031 Kota Bl i tar 133,408 85 149 ‐64 2,341 42 2,299 42 113 ‐7132 Kota Malang 820,857 105 914 ‐809 195 257 ‐62 16 693 ‐67733 Kota Probol inggo 230,464 9 257 ‐248 44 72 ‐28 0 195 ‐19534 Kota Pasuruan 174,173 90 194 ‐104 271 55 216 0 147 ‐14735 Kota Mojokerto 113,327 1 126 ‐125 156 35 121 0 96 ‐9636 Kota Madiun 179,391 0 200 ‐200 16 56 ‐40 0 151 ‐15137 Kota Surabaya 2,631,305 0 2,930 ‐2,930 160 824 ‐664 0 2,222 ‐2,22238 Kota Batu 189,604 3,977 211 3,766 23 59 ‐36 0 160 ‐160
Tota l 37,286,266 67,164 41,519 25,645 17,065 11,674 5,391 12,297 31,483 ‐19,1861.11351963 0.313096088 0.844356310
Production ton Consumption Balance Production ton Consumption Balance Production ton Consumption Balance
1 Paci tan 558,664 1,980 1,926 54 738 532 206 111 309 ‐1982 Ponorogo 899,074 14,735 3,100 11,635 428 856 ‐428 284 497 ‐2133 Trenggalek 675,765 1,549 2,330 ‐781 218 643 ‐425 958 373 5854 Tulungagung 992,048 503 3,421 ‐2,918 298 944 ‐646 386 548 ‐1625 Bl i tar 1,070,446 5,188 3,691 1,497 216 1,019 ‐803 239 592 ‐3536 Kedi ri 1,451,861 3,214 5,006 ‐1,792 699 1,382 ‐683 968 802 1667 Malang 2,425,311 40,933 8,363 32,570 2,125 2,308 ‐183 356 1,340 ‐9848 Lumajang 1,028,103 5,378 3,545 1,833 78 978 ‐900 50 568 ‐5189 Jember 2,327,957 9,909 8,027 1,882 2,000 2,216 ‐216 185 1,287 ‐1,10210 Banyuwangi 1,535,701 4,702 5,295 ‐593 1,203 1,462 ‐259 576 849 ‐27311 Bondowoso 708,905 9,106 2,444 6,662 1,137 675 462 101 392 ‐29112 Situbondo 624,888 678 2,155 ‐1,477 293 595 ‐302 14 345 ‐33113 Probol inggo 1,044,237 4,140 3,601 539 525 994 ‐469 576 577 ‐114 Pasuruan 1,452,629 53,620 5,009 48,611 2,200 1,382 818 295 803 ‐50815 Sidoarjo 1,802,948 0 6,217 ‐6,217 854 1,716 ‐862 141 996 ‐85516 Mojokerto 1,013,988 1,314 3,496 ‐2,182 310 965 ‐655 300 560 ‐26017 Jombang 1,301,459 5,412 4,488 924 423 1,239 ‐816 387 719 ‐33218 Nganjuk 1,002,530 2,151 3,457 ‐1,306 87 954 ‐867 429 554 ‐12519 Madiun 642,638 3,295 2,216 1,079 583 612 ‐29 218 355 ‐13720 Magetan 626,092 938 2,159 ‐1,221 258 596 ‐338 30 346 ‐31621 Ngawi 836,767 1,016 2,885 ‐1,869 595 796 ‐201 131 462 ‐33122 Bojonegoro 1,270,876 0 4,382 ‐4,382 235 1,209 ‐974 155 702 ‐54723 Tuban 1,080,956 0 3,727 ‐3,727 624 1,029 ‐405 2,248 597 1,65124 Lamongan 1,189,615 0 4,102 ‐4,102 1,381 1,132 249 539 657 ‐11825 Gres ik 1,215,603 26 4,191 ‐4,165 169 1,157 ‐988 99 672 ‐57326 Bangkalan 973,681 1,400 3,357 ‐1,957 1,621 927 694 498 538 ‐4027 Sampang 919,548 3 3,171 ‐3,168 5,371 875 4,496 81 508 ‐42728 Pamekasan 851,690 2,651 2,937 ‐286 3,030 811 2,219 115 471 ‐35629 Sumenep 1,017,147 72 3,507 ‐3,435 3,202 968 2,234 288 562 ‐27430 Kota Kediri 272,610 2 940 ‐938 0 259 ‐259 10 151 ‐14131 Kota Bl i tar 133,408 185 460 ‐275 2 127 ‐125 0 74 ‐7432 Kota Malang 820,857 30 2,830 ‐2,800 199 781 ‐582 14 454 ‐44033 Kota Probol inggo 230,464 0 795 ‐795 38 219 ‐181 34 127 ‐9334 Kota Pasuruan 174,173 0 601 ‐601 191 166 25 92 96 ‐435 Kota Mojokerto 113,327 0 391 ‐391 34 108 ‐74 153 63 9036 Kota Madiun 179,391 0 619 ‐619 9 171 ‐162 6 99 ‐9337 Kota Surabaya 2,631,305 0 9,073 ‐9,073 119 2,504 ‐2,385 20 1,454 ‐1,43438 Kota Batu 189,604 3 654 ‐651 40 180 ‐140 0 105 ‐105
Tota l 37,286,266 174,133 128,565 45,568 31,533 35,486 ‐3,953 11,087 20,607 ‐9,5203.448054786 0.951705269 0.552675557
Kabupaten/ Kota
Kabupaten/ Kota
Population
Avocado (Alpukat) Star Fruit (Bel imbing) Duku / Langsat
Population
Durian Guava (Jambu Bi ji ) Sapodia (Sawo)
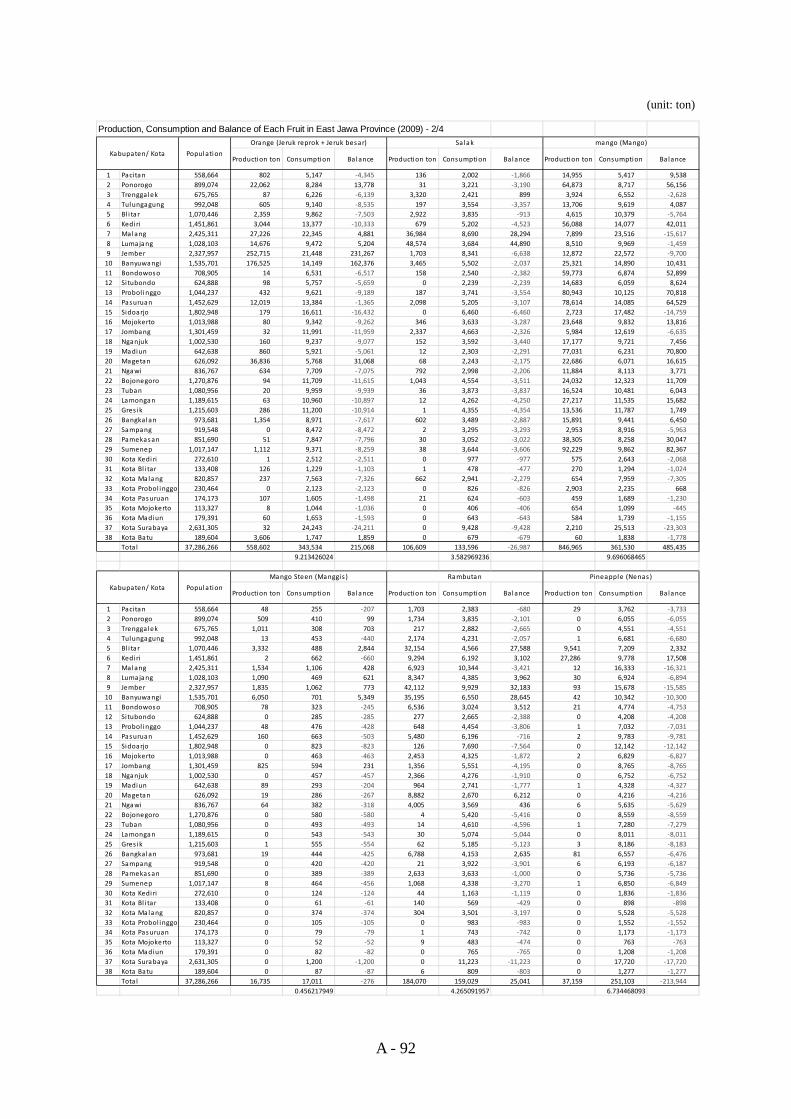
A - 92
(unit: ton)
Production, Consumption and Balance of Each Fruit in East Jawa Province (2009) - 2/4
Production ton Consumption Balance Production ton Consumption Balance Production ton Consumption Balance
1 Pacitan 558,664 802 5,147 ‐4,345 136 2,002 ‐1,866 14,955 5,417 9,5382 Ponorogo 899,074 22,062 8,284 13,778 31 3,221 ‐3,190 64,873 8,717 56,1563 Trenggalek 675,765 87 6,226 ‐6,139 3,320 2,421 899 3,924 6,552 ‐2,6284 Tulungagung 992,048 605 9,140 ‐8,535 197 3,554 ‐3,357 13,706 9,619 4,0875 Bl i tar 1,070,446 2,359 9,862 ‐7,503 2,922 3,835 ‐913 4,615 10,379 ‐5,7646 Kediri 1,451,861 3,044 13,377 ‐10,333 679 5,202 ‐4,523 56,088 14,077 42,0117 Malang 2,425,311 27,226 22,345 4,881 36,984 8,690 28,294 7,899 23,516 ‐15,6178 Lumajang 1,028,103 14,676 9,472 5,204 48,574 3,684 44,890 8,510 9,969 ‐1,4599 Jember 2,327,957 252,715 21,448 231,267 1,703 8,341 ‐6,638 12,872 22,572 ‐9,70010 Banyuwangi 1,535,701 176,525 14,149 162,376 3,465 5,502 ‐2,037 25,321 14,890 10,43111 Bondowoso 708,905 14 6,531 ‐6,517 158 2,540 ‐2,382 59,773 6,874 52,89912 Situbondo 624,888 98 5,757 ‐5,659 0 2,239 ‐2,239 14,683 6,059 8,62413 Probol inggo 1,044,237 432 9,621 ‐9,189 187 3,741 ‐3,554 80,943 10,125 70,81814 Pasuruan 1,452,629 12,019 13,384 ‐1,365 2,098 5,205 ‐3,107 78,614 14,085 64,52915 Sidoarjo 1,802,948 179 16,611 ‐16,432 0 6,460 ‐6,460 2,723 17,482 ‐14,75916 Mojokerto 1,013,988 80 9,342 ‐9,262 346 3,633 ‐3,287 23,648 9,832 13,81617 Jombang 1,301,459 32 11,991 ‐11,959 2,337 4,663 ‐2,326 5,984 12,619 ‐6,63518 Nganjuk 1,002,530 160 9,237 ‐9,077 152 3,592 ‐3,440 17,177 9,721 7,45619 Madiun 642,638 860 5,921 ‐5,061 12 2,303 ‐2,291 77,031 6,231 70,80020 Magetan 626,092 36,836 5,768 31,068 68 2,243 ‐2,175 22,686 6,071 16,61521 Ngawi 836,767 634 7,709 ‐7,075 792 2,998 ‐2,206 11,884 8,113 3,77122 Bojonegoro 1,270,876 94 11,709 ‐11,615 1,043 4,554 ‐3,511 24,032 12,323 11,70923 Tuban 1,080,956 20 9,959 ‐9,939 36 3,873 ‐3,837 16,524 10,481 6,04324 Lamongan 1,189,615 63 10,960 ‐10,897 12 4,262 ‐4,250 27,217 11,535 15,68225 Gres ik 1,215,603 286 11,200 ‐10,914 1 4,355 ‐4,354 13,536 11,787 1,74926 Bangkalan 973,681 1,354 8,971 ‐7,617 602 3,489 ‐2,887 15,891 9,441 6,45027 Sampang 919,548 0 8,472 ‐8,472 2 3,295 ‐3,293 2,953 8,916 ‐5,96328 Pamekasan 851,690 51 7,847 ‐7,796 30 3,052 ‐3,022 38,305 8,258 30,04729 Sumenep 1,017,147 1,112 9,371 ‐8,259 38 3,644 ‐3,606 92,229 9,862 82,36730 Kota Kediri 272,610 1 2,512 ‐2,511 0 977 ‐977 575 2,643 ‐2,06831 Kota Bl i tar 133,408 126 1,229 ‐1,103 1 478 ‐477 270 1,294 ‐1,02432 Kota Malang 820,857 237 7,563 ‐7,326 662 2,941 ‐2,279 654 7,959 ‐7,30533 Kota Probol inggo 230,464 0 2,123 ‐2,123 0 826 ‐826 2,903 2,235 66834 Kota Pasuruan 174,173 107 1,605 ‐1,498 21 624 ‐603 459 1,689 ‐1,23035 Kota Mojokerto 113,327 8 1,044 ‐1,036 0 406 ‐406 654 1,099 ‐44536 Kota Madiun 179,391 60 1,653 ‐1,593 0 643 ‐643 584 1,739 ‐1,15537 Kota Surabaya 2,631,305 32 24,243 ‐24,211 0 9,428 ‐9,428 2,210 25,513 ‐23,30338 Kota Batu 189,604 3,606 1,747 1,859 0 679 ‐679 60 1,838 ‐1,778
Tota l 37,286,266 558,602 343,534 215,068 106,609 133,596 ‐26,987 846,965 361,530 485,4359.213426024 3.582969236 9.696068465
Production ton Consumption Balance Production ton Consumption Balance Production ton Consumption Balance
1 Pacitan 558,664 48 255 ‐207 1,703 2,383 ‐680 29 3,762 ‐3,7332 Ponorogo 899,074 509 410 99 1,734 3,835 ‐2,101 0 6,055 ‐6,0553 Trenggalek 675,765 1,011 308 703 217 2,882 ‐2,665 0 4,551 ‐4,5514 Tulungagung 992,048 13 453 ‐440 2,174 4,231 ‐2,057 1 6,681 ‐6,6805 Bl i tar 1,070,446 3,332 488 2,844 32,154 4,566 27,588 9,541 7,209 2,3326 Kediri 1,451,861 2 662 ‐660 9,294 6,192 3,102 27,286 9,778 17,5087 Malang 2,425,311 1,534 1,106 428 6,923 10,344 ‐3,421 12 16,333 ‐16,3218 Lumajang 1,028,103 1,090 469 621 8,347 4,385 3,962 30 6,924 ‐6,8949 Jember 2,327,957 1,835 1,062 773 42,112 9,929 32,183 93 15,678 ‐15,58510 Banyuwangi 1,535,701 6,050 701 5,349 35,195 6,550 28,645 42 10,342 ‐10,30011 Bondowoso 708,905 78 323 ‐245 6,536 3,024 3,512 21 4,774 ‐4,75312 Situbondo 624,888 0 285 ‐285 277 2,665 ‐2,388 0 4,208 ‐4,20813 Probol inggo 1,044,237 48 476 ‐428 648 4,454 ‐3,806 1 7,032 ‐7,03114 Pasuruan 1,452,629 160 663 ‐503 5,480 6,196 ‐716 2 9,783 ‐9,78115 Sidoarjo 1,802,948 0 823 ‐823 126 7,690 ‐7,564 0 12,142 ‐12,14216 Mojokerto 1,013,988 0 463 ‐463 2,453 4,325 ‐1,872 2 6,829 ‐6,82717 Jombang 1,301,459 825 594 231 1,356 5,551 ‐4,195 0 8,765 ‐8,76518 Nganjuk 1,002,530 0 457 ‐457 2,366 4,276 ‐1,910 0 6,752 ‐6,75219 Madiun 642,638 89 293 ‐204 964 2,741 ‐1,777 1 4,328 ‐4,32720 Magetan 626,092 19 286 ‐267 8,882 2,670 6,212 0 4,216 ‐4,21621 Ngawi 836,767 64 382 ‐318 4,005 3,569 436 6 5,635 ‐5,62922 Bojonegoro 1,270,876 0 580 ‐580 4 5,420 ‐5,416 0 8,559 ‐8,55923 Tuban 1,080,956 0 493 ‐493 14 4,610 ‐4,596 1 7,280 ‐7,27924 Lamongan 1,189,615 0 543 ‐543 30 5,074 ‐5,044 0 8,011 ‐8,01125 Gres ik 1,215,603 1 555 ‐554 62 5,185 ‐5,123 3 8,186 ‐8,18326 Bangkalan 973,681 19 444 ‐425 6,788 4,153 2,635 81 6,557 ‐6,47627 Sampang 919,548 0 420 ‐420 21 3,922 ‐3,901 6 6,193 ‐6,18728 Pamekasan 851,690 0 389 ‐389 2,633 3,633 ‐1,000 0 5,736 ‐5,73629 Sumenep 1,017,147 8 464 ‐456 1,068 4,338 ‐3,270 1 6,850 ‐6,84930 Kota Kediri 272,610 0 124 ‐124 44 1,163 ‐1,119 0 1,836 ‐1,83631 Kota Bl i tar 133,408 0 61 ‐61 140 569 ‐429 0 898 ‐89832 Kota Malang 820,857 0 374 ‐374 304 3,501 ‐3,197 0 5,528 ‐5,52833 Kota Probol inggo 230,464 0 105 ‐105 0 983 ‐983 0 1,552 ‐1,55234 Kota Pasuruan 174,173 0 79 ‐79 1 743 ‐742 0 1,173 ‐1,17335 Kota Mojokerto 113,327 0 52 ‐52 9 483 ‐474 0 763 ‐76336 Kota Madiun 179,391 0 82 ‐82 0 765 ‐765 0 1,208 ‐1,20837 Kota Surabaya 2,631,305 0 1,200 ‐1,200 0 11,223 ‐11,223 0 17,720 ‐17,72038 Kota Batu 189,604 0 87 ‐87 6 809 ‐803 0 1,277 ‐1,277
Tota l 37,286,266 16,735 17,011 ‐276 184,070 159,029 25,041 37,159 251,103 ‐213,9440.456217949 4.265091957 6.734468093
Kabupaten/ Kota
Kabupaten/ Kota
Salak mango (Mango)
Population
Mango Steen (Manggis ) Rambutan Pineapple (Nenas)
Population
Orange (Jeruk reprok + Jeruk besar)
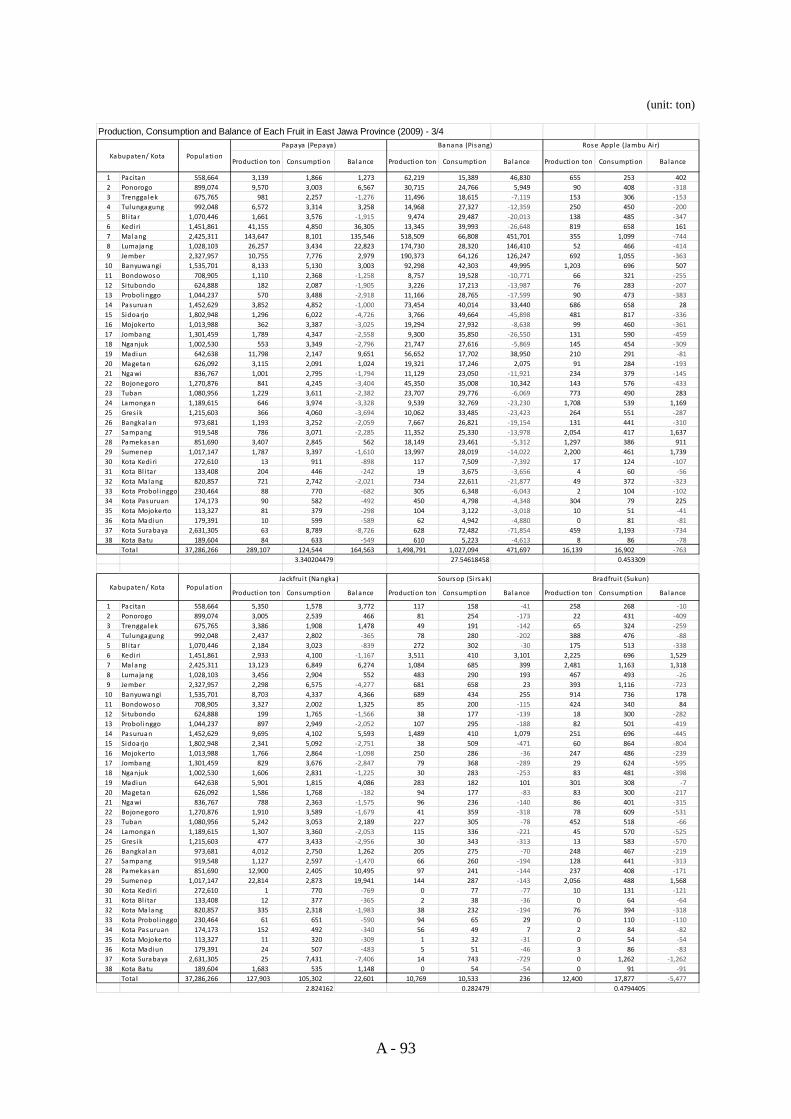
A - 93
(unit: ton)
Production, Consumption and Balance of Each Fruit in East Jawa Province (2009) - 3/4
Production ton Consumption Balance Production ton Consumption Balance Production ton Consumption Balance
1 Pacitan 558,664 3,139 1,866 1,273 62,219 15,389 46,830 655 253 4022 Ponorogo 899,074 9,570 3,003 6,567 30,715 24,766 5,949 90 408 ‐3183 Trenggalek 675,765 981 2,257 ‐1,276 11,496 18,615 ‐7,119 153 306 ‐1534 Tulungagung 992,048 6,572 3,314 3,258 14,968 27,327 ‐12,359 250 450 ‐2005 Bl i tar 1,070,446 1,661 3,576 ‐1,915 9,474 29,487 ‐20,013 138 485 ‐3476 Kediri 1,451,861 41,155 4,850 36,305 13,345 39,993 ‐26,648 819 658 1617 Malang 2,425,311 143,647 8,101 135,546 518,509 66,808 451,701 355 1,099 ‐7448 Lumajang 1,028,103 26,257 3,434 22,823 174,730 28,320 146,410 52 466 ‐4149 Jember 2,327,957 10,755 7,776 2,979 190,373 64,126 126,247 692 1,055 ‐36310 Banyuwangi 1,535,701 8,133 5,130 3,003 92,298 42,303 49,995 1,203 696 50711 Bondowoso 708,905 1,110 2,368 ‐1,258 8,757 19,528 ‐10,771 66 321 ‐25512 Situbondo 624,888 182 2,087 ‐1,905 3,226 17,213 ‐13,987 76 283 ‐20713 Probol inggo 1,044,237 570 3,488 ‐2,918 11,166 28,765 ‐17,599 90 473 ‐38314 Pasuruan 1,452,629 3,852 4,852 ‐1,000 73,454 40,014 33,440 686 658 2815 Sidoarjo 1,802,948 1,296 6,022 ‐4,726 3,766 49,664 ‐45,898 481 817 ‐33616 Mojokerto 1,013,988 362 3,387 ‐3,025 19,294 27,932 ‐8,638 99 460 ‐36117 Jombang 1,301,459 1,789 4,347 ‐2,558 9,300 35,850 ‐26,550 131 590 ‐45918 Nganjuk 1,002,530 553 3,349 ‐2,796 21,747 27,616 ‐5,869 145 454 ‐30919 Madiun 642,638 11,798 2,147 9,651 56,652 17,702 38,950 210 291 ‐8120 Magetan 626,092 3,115 2,091 1,024 19,321 17,246 2,075 91 284 ‐19321 Ngawi 836,767 1,001 2,795 ‐1,794 11,129 23,050 ‐11,921 234 379 ‐14522 Bojonegoro 1,270,876 841 4,245 ‐3,404 45,350 35,008 10,342 143 576 ‐43323 Tuban 1,080,956 1,229 3,611 ‐2,382 23,707 29,776 ‐6,069 773 490 28324 Lamongan 1,189,615 646 3,974 ‐3,328 9,539 32,769 ‐23,230 1,708 539 1,16925 Gres ik 1,215,603 366 4,060 ‐3,694 10,062 33,485 ‐23,423 264 551 ‐28726 Bangkalan 973,681 1,193 3,252 ‐2,059 7,667 26,821 ‐19,154 131 441 ‐31027 Sampang 919,548 786 3,071 ‐2,285 11,352 25,330 ‐13,978 2,054 417 1,63728 Pamekasan 851,690 3,407 2,845 562 18,149 23,461 ‐5,312 1,297 386 91129 Sumenep 1,017,147 1,787 3,397 ‐1,610 13,997 28,019 ‐14,022 2,200 461 1,73930 Kota Kediri 272,610 13 911 ‐898 117 7,509 ‐7,392 17 124 ‐10731 Kota Bl i tar 133,408 204 446 ‐242 19 3,675 ‐3,656 4 60 ‐5632 Kota Malang 820,857 721 2,742 ‐2,021 734 22,611 ‐21,877 49 372 ‐32333 Kota Probol inggo 230,464 88 770 ‐682 305 6,348 ‐6,043 2 104 ‐10234 Kota Pasuruan 174,173 90 582 ‐492 450 4,798 ‐4,348 304 79 22535 Kota Mojokerto 113,327 81 379 ‐298 104 3,122 ‐3,018 10 51 ‐4136 Kota Madiun 179,391 10 599 ‐589 62 4,942 ‐4,880 0 81 ‐8137 Kota Surabaya 2,631,305 63 8,789 ‐8,726 628 72,482 ‐71,854 459 1,193 ‐73438 Kota Batu 189,604 84 633 ‐549 610 5,223 ‐4,613 8 86 ‐78
Tota l 37,286,266 289,107 124,544 164,563 1,498,791 1,027,094 471,697 16,139 16,902 ‐7633.340204479 27.54618458 0.453309
Production ton Consumption Balance Production ton Consumption Balance Production ton Consumption Balance
1 Pacitan 558,664 5,350 1,578 3,772 117 158 ‐41 258 268 ‐102 Ponorogo 899,074 3,005 2,539 466 81 254 ‐173 22 431 ‐4093 Trenggalek 675,765 3,386 1,908 1,478 49 191 ‐142 65 324 ‐2594 Tulungagung 992,048 2,437 2,802 ‐365 78 280 ‐202 388 476 ‐885 Bl i tar 1,070,446 2,184 3,023 ‐839 272 302 ‐30 175 513 ‐3386 Kediri 1,451,861 2,933 4,100 ‐1,167 3,511 410 3,101 2,225 696 1,5297 Malang 2,425,311 13,123 6,849 6,274 1,084 685 399 2,481 1,163 1,3188 Lumajang 1,028,103 3,456 2,904 552 483 290 193 467 493 ‐269 Jember 2,327,957 2,298 6,575 ‐4,277 681 658 23 393 1,116 ‐72310 Banyuwangi 1,535,701 8,703 4,337 4,366 689 434 255 914 736 17811 Bondowoso 708,905 3,327 2,002 1,325 85 200 ‐115 424 340 8412 Situbondo 624,888 199 1,765 ‐1,566 38 177 ‐139 18 300 ‐28213 Probol inggo 1,044,237 897 2,949 ‐2,052 107 295 ‐188 82 501 ‐41914 Pasuruan 1,452,629 9,695 4,102 5,593 1,489 410 1,079 251 696 ‐44515 Sidoarjo 1,802,948 2,341 5,092 ‐2,751 38 509 ‐471 60 864 ‐80416 Mojokerto 1,013,988 1,766 2,864 ‐1,098 250 286 ‐36 247 486 ‐23917 Jombang 1,301,459 829 3,676 ‐2,847 79 368 ‐289 29 624 ‐59518 Nganjuk 1,002,530 1,606 2,831 ‐1,225 30 283 ‐253 83 481 ‐39819 Madiun 642,638 5,901 1,815 4,086 283 182 101 301 308 ‐720 Magetan 626,092 1,586 1,768 ‐182 94 177 ‐83 83 300 ‐21721 Ngawi 836,767 788 2,363 ‐1,575 96 236 ‐140 86 401 ‐31522 Bojonegoro 1,270,876 1,910 3,589 ‐1,679 41 359 ‐318 78 609 ‐53123 Tuban 1,080,956 5,242 3,053 2,189 227 305 ‐78 452 518 ‐6624 Lamongan 1,189,615 1,307 3,360 ‐2,053 115 336 ‐221 45 570 ‐52525 Gres ik 1,215,603 477 3,433 ‐2,956 30 343 ‐313 13 583 ‐57026 Bangkalan 973,681 4,012 2,750 1,262 205 275 ‐70 248 467 ‐21927 Sampang 919,548 1,127 2,597 ‐1,470 66 260 ‐194 128 441 ‐31328 Pamekasan 851,690 12,900 2,405 10,495 97 241 ‐144 237 408 ‐17129 Sumenep 1,017,147 22,814 2,873 19,941 144 287 ‐143 2,056 488 1,56830 Kota Kediri 272,610 1 770 ‐769 0 77 ‐77 10 131 ‐12131 Kota Bl i tar 133,408 12 377 ‐365 2 38 ‐36 0 64 ‐6432 Kota Malang 820,857 335 2,318 ‐1,983 38 232 ‐194 76 394 ‐31833 Kota Probol inggo 230,464 61 651 ‐590 94 65 29 0 110 ‐11034 Kota Pasuruan 174,173 152 492 ‐340 56 49 7 2 84 ‐8235 Kota Mojokerto 113,327 11 320 ‐309 1 32 ‐31 0 54 ‐5436 Kota Madiun 179,391 24 507 ‐483 5 51 ‐46 3 86 ‐8337 Kota Surabaya 2,631,305 25 7,431 ‐7,406 14 743 ‐729 0 1,262 ‐1,26238 Kota Batu 189,604 1,683 535 1,148 0 54 ‐54 0 91 ‐91
Tota l 37,286,266 127,903 105,302 22,601 10,769 10,533 236 12,400 17,877 ‐5,4772.824162 0.282479 0.4794405
Kabupaten/ Kota
Soursop (Si rsak) Bradfrui t (Sukun)
Population
Papaya (Pepaya) Banana (Pi sang) Rose Apple (Jambu Air)
Kabupaten/ Kota PopulationJackfrui t (Nangka)
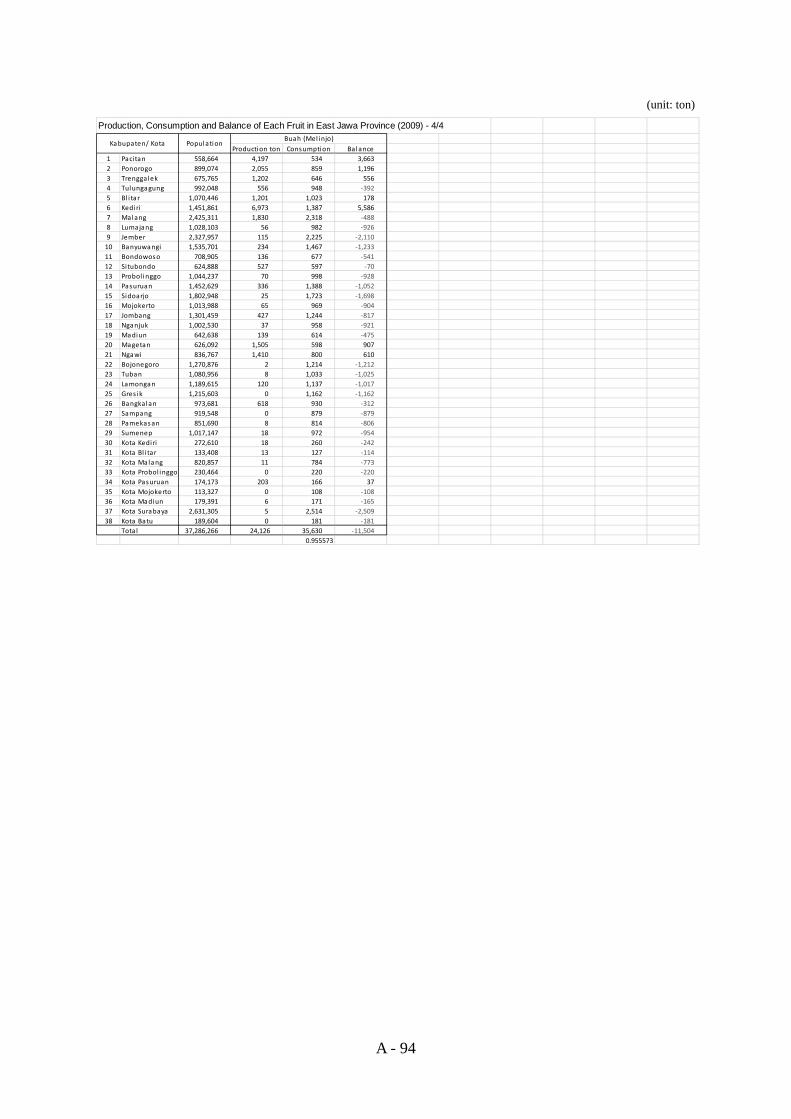
A - 94
(unit: ton)
Production, Consumption and Balance of Each Fruit in East Jawa Province (2009) - 4/4
Production ton Consumption Balance1 Pacitan 558,664 4,197 534 3,6632 Ponorogo 899,074 2,055 859 1,1963 Trenggalek 675,765 1,202 646 5564 Tulungagung 992,048 556 948 ‐3925 Bl i tar 1,070,446 1,201 1,023 1786 Kediri 1,451,861 6,973 1,387 5,5867 Malang 2,425,311 1,830 2,318 ‐4888 Lumajang 1,028,103 56 982 ‐9269 Jember 2,327,957 115 2,225 ‐2,11010 Banyuwangi 1,535,701 234 1,467 ‐1,23311 Bondowoso 708,905 136 677 ‐54112 Situbondo 624,888 527 597 ‐7013 Probol inggo 1,044,237 70 998 ‐92814 Pasuruan 1,452,629 336 1,388 ‐1,05215 Sidoarjo 1,802,948 25 1,723 ‐1,69816 Mojokerto 1,013,988 65 969 ‐90417 Jombang 1,301,459 427 1,244 ‐81718 Nganjuk 1,002,530 37 958 ‐92119 Madiun 642,638 139 614 ‐47520 Magetan 626,092 1,505 598 90721 Ngawi 836,767 1,410 800 61022 Bojonegoro 1,270,876 2 1,214 ‐1,21223 Tuban 1,080,956 8 1,033 ‐1,02524 Lamongan 1,189,615 120 1,137 ‐1,01725 Gres ik 1,215,603 0 1,162 ‐1,16226 Bangkalan 973,681 618 930 ‐31227 Sampang 919,548 0 879 ‐87928 Pamekasan 851,690 8 814 ‐80629 Sumenep 1,017,147 18 972 ‐95430 Kota Kediri 272,610 18 260 ‐24231 Kota Bl i tar 133,408 13 127 ‐11432 Kota Malang 820,857 11 784 ‐77333 Kota Probol inggo 230,464 0 220 ‐22034 Kota Pasuruan 174,173 203 166 3735 Kota Mojokerto 113,327 0 108 ‐10836 Kota Madiun 179,391 6 171 ‐16537 Kota Surabaya 2,631,305 5 2,514 ‐2,50938 Kota Batu 189,604 0 181 ‐181
Tota l 37,286,266 24,126 35,630 ‐11,5040.955573
Kabupaten/ Kota PopulationBuah (Mel injo)
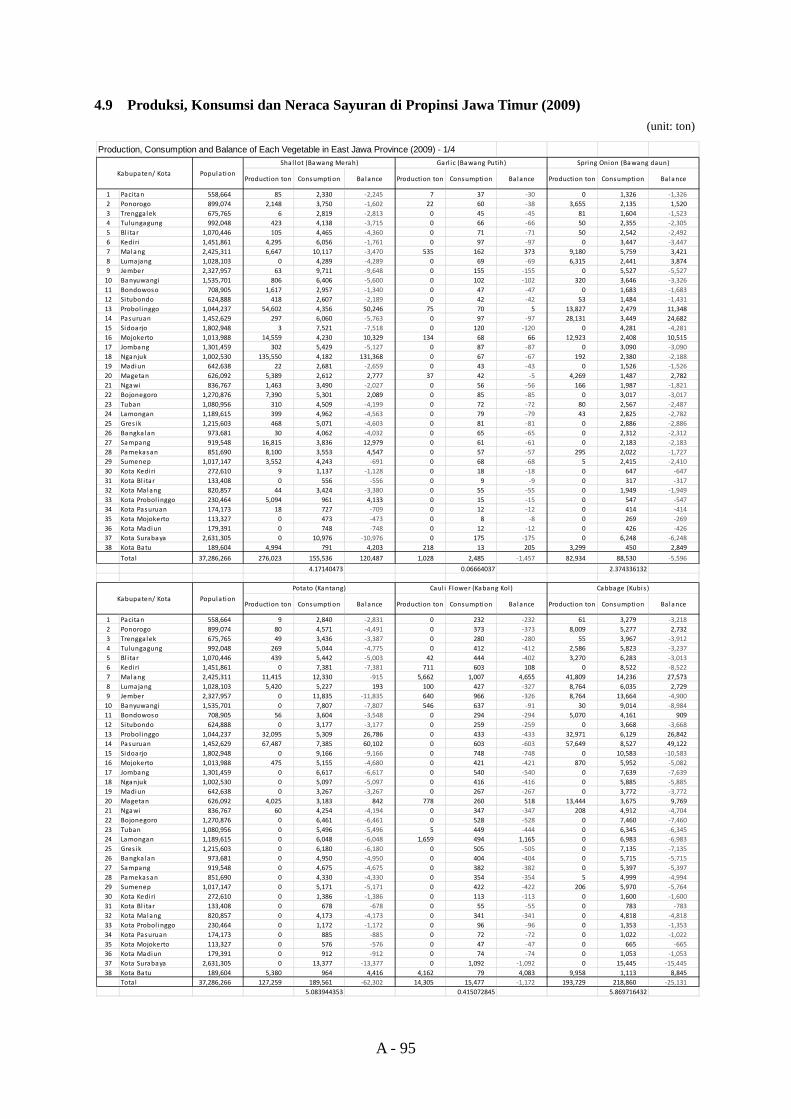
A - 95
4.9 Produksi, Konsumsi dan Neraca Sayuran di Propinsi Jawa Timur (2009) (unit: ton)
Production, Consumption and Balance of Each Vegetable in East Jawa Province (2009) - 1/4
Production ton Consumption Ba lance Production ton Consumption Balance Production ton Consumption Balance
1 Pacitan 558,664 85 2,330 ‐2,245 7 37 ‐30 0 1,326 ‐1,3262 Ponorogo 899,074 2,148 3,750 ‐1,602 22 60 ‐38 3,655 2,135 1,5203 Trenggalek 675,765 6 2,819 ‐2,813 0 45 ‐45 81 1,604 ‐1,5234 Tulungagung 992,048 423 4,138 ‐3,715 0 66 ‐66 50 2,355 ‐2,3055 Bl i tar 1,070,446 105 4,465 ‐4,360 0 71 ‐71 50 2,542 ‐2,4926 Kediri 1,451,861 4,295 6,056 ‐1,761 0 97 ‐97 0 3,447 ‐3,4477 Malang 2,425,311 6,647 10,117 ‐3,470 535 162 373 9,180 5,759 3,4218 Lumajang 1,028,103 0 4,289 ‐4,289 0 69 ‐69 6,315 2,441 3,8749 Jember 2,327,957 63 9,711 ‐9,648 0 155 ‐155 0 5,527 ‐5,52710 Banyuwangi 1,535,701 806 6,406 ‐5,600 0 102 ‐102 320 3,646 ‐3,32611 Bondowoso 708,905 1,617 2,957 ‐1,340 0 47 ‐47 0 1,683 ‐1,68312 Si tubondo 624,888 418 2,607 ‐2,189 0 42 ‐42 53 1,484 ‐1,43113 Probol inggo 1,044,237 54,602 4,356 50,246 75 70 5 13,827 2,479 11,34814 Pasuruan 1,452,629 297 6,060 ‐5,763 0 97 ‐97 28,131 3,449 24,68215 Sidoarjo 1,802,948 3 7,521 ‐7,518 0 120 ‐120 0 4,281 ‐4,28116 Mojokerto 1,013,988 14,559 4,230 10,329 134 68 66 12,923 2,408 10,51517 Jombang 1,301,459 302 5,429 ‐5,127 0 87 ‐87 0 3,090 ‐3,09018 Nganjuk 1,002,530 135,550 4,182 131,368 0 67 ‐67 192 2,380 ‐2,18819 Madiun 642,638 22 2,681 ‐2,659 0 43 ‐43 0 1,526 ‐1,52620 Magetan 626,092 5,389 2,612 2,777 37 42 ‐5 4,269 1,487 2,78221 Ngawi 836,767 1,463 3,490 ‐2,027 0 56 ‐56 166 1,987 ‐1,82122 Bojonegoro 1,270,876 7,390 5,301 2,089 0 85 ‐85 0 3,017 ‐3,01723 Tuban 1,080,956 310 4,509 ‐4,199 0 72 ‐72 80 2,567 ‐2,48724 Lamongan 1,189,615 399 4,962 ‐4,563 0 79 ‐79 43 2,825 ‐2,78225 Gres ik 1,215,603 468 5,071 ‐4,603 0 81 ‐81 0 2,886 ‐2,88626 Bangkalan 973,681 30 4,062 ‐4,032 0 65 ‐65 0 2,312 ‐2,31227 Sampang 919,548 16,815 3,836 12,979 0 61 ‐61 0 2,183 ‐2,18328 Pamekasan 851,690 8,100 3,553 4,547 0 57 ‐57 295 2,022 ‐1,72729 Sumenep 1,017,147 3,552 4,243 ‐691 0 68 ‐68 5 2,415 ‐2,41030 Kota Kediri 272,610 9 1,137 ‐1,128 0 18 ‐18 0 647 ‐64731 Kota Bl i tar 133,408 0 556 ‐556 0 9 ‐9 0 317 ‐31732 Kota Malang 820,857 44 3,424 ‐3,380 0 55 ‐55 0 1,949 ‐1,94933 Kota Probol inggo 230,464 5,094 961 4,133 0 15 ‐15 0 547 ‐54734 Kota Pasuruan 174,173 18 727 ‐709 0 12 ‐12 0 414 ‐41435 Kota Mojokerto 113,327 0 473 ‐473 0 8 ‐8 0 269 ‐26936 Kota Madiun 179,391 0 748 ‐748 0 12 ‐12 0 426 ‐42637 Kota Surabaya 2,631,305 0 10,976 ‐10,976 0 175 ‐175 0 6,248 ‐6,24838 Kota Batu 189,604 4,994 791 4,203 218 13 205 3,299 450 2,849
Tota l 37,286,266 276,023 155,536 120,487 1,028 2,485 ‐1,457 82,934 88,530 ‐5,596
4.17140473 0.06664037 2.374336132
Production ton Consumption Ba lance Production ton Consumption Balance Production ton Consumption Balance
1 Pacitan 558,664 9 2,840 ‐2,831 0 232 ‐232 61 3,279 ‐3,2182 Ponorogo 899,074 80 4,571 ‐4,491 0 373 ‐373 8,009 5,277 2,7323 Trenggalek 675,765 49 3,436 ‐3,387 0 280 ‐280 55 3,967 ‐3,9124 Tulungagung 992,048 269 5,044 ‐4,775 0 412 ‐412 2,586 5,823 ‐3,2375 Bl i tar 1,070,446 439 5,442 ‐5,003 42 444 ‐402 3,270 6,283 ‐3,0136 Kediri 1,451,861 0 7,381 ‐7,381 711 603 108 0 8,522 ‐8,5227 Malang 2,425,311 11,415 12,330 ‐915 5,662 1,007 4,655 41,809 14,236 27,5738 Lumajang 1,028,103 5,420 5,227 193 100 427 ‐327 8,764 6,035 2,7299 Jember 2,327,957 0 11,835 ‐11,835 640 966 ‐326 8,764 13,664 ‐4,90010 Banyuwangi 1,535,701 0 7,807 ‐7,807 546 637 ‐91 30 9,014 ‐8,98411 Bondowoso 708,905 56 3,604 ‐3,548 0 294 ‐294 5,070 4,161 90912 Si tubondo 624,888 0 3,177 ‐3,177 0 259 ‐259 0 3,668 ‐3,66813 Probol inggo 1,044,237 32,095 5,309 26,786 0 433 ‐433 32,971 6,129 26,84214 Pasuruan 1,452,629 67,487 7,385 60,102 0 603 ‐603 57,649 8,527 49,12215 Sidoarjo 1,802,948 0 9,166 ‐9,166 0 748 ‐748 0 10,583 ‐10,58316 Mojokerto 1,013,988 475 5,155 ‐4,680 0 421 ‐421 870 5,952 ‐5,08217 Jombang 1,301,459 0 6,617 ‐6,617 0 540 ‐540 0 7,639 ‐7,63918 Nganjuk 1,002,530 0 5,097 ‐5,097 0 416 ‐416 0 5,885 ‐5,88519 Madiun 642,638 0 3,267 ‐3,267 0 267 ‐267 0 3,772 ‐3,77220 Magetan 626,092 4,025 3,183 842 778 260 518 13,444 3,675 9,76921 Ngawi 836,767 60 4,254 ‐4,194 0 347 ‐347 208 4,912 ‐4,70422 Bojonegoro 1,270,876 0 6,461 ‐6,461 0 528 ‐528 0 7,460 ‐7,46023 Tuban 1,080,956 0 5,496 ‐5,496 5 449 ‐444 0 6,345 ‐6,34524 Lamongan 1,189,615 0 6,048 ‐6,048 1,659 494 1,165 0 6,983 ‐6,98325 Gres ik 1,215,603 0 6,180 ‐6,180 0 505 ‐505 0 7,135 ‐7,13526 Bangkalan 973,681 0 4,950 ‐4,950 0 404 ‐404 0 5,715 ‐5,71527 Sampang 919,548 0 4,675 ‐4,675 0 382 ‐382 0 5,397 ‐5,39728 Pamekasan 851,690 0 4,330 ‐4,330 0 354 ‐354 5 4,999 ‐4,99429 Sumenep 1,017,147 0 5,171 ‐5,171 0 422 ‐422 206 5,970 ‐5,76430 Kota Kediri 272,610 0 1,386 ‐1,386 0 113 ‐113 0 1,600 ‐1,60031 Kota Bl i tar 133,408 0 678 ‐678 0 55 ‐55 0 783 ‐78332 Kota Malang 820,857 0 4,173 ‐4,173 0 341 ‐341 0 4,818 ‐4,81833 Kota Probol inggo 230,464 0 1,172 ‐1,172 0 96 ‐96 0 1,353 ‐1,35334 Kota Pasuruan 174,173 0 885 ‐885 0 72 ‐72 0 1,022 ‐1,02235 Kota Mojokerto 113,327 0 576 ‐576 0 47 ‐47 0 665 ‐66536 Kota Madiun 179,391 0 912 ‐912 0 74 ‐74 0 1,053 ‐1,05337 Kota Surabaya 2,631,305 0 13,377 ‐13,377 0 1,092 ‐1,092 0 15,445 ‐15,44538 Kota Batu 189,604 5,380 964 4,416 4,162 79 4,083 9,958 1,113 8,845
Tota l 37,286,266 127,259 189,561 ‐62,302 14,305 15,477 ‐1,172 193,729 218,860 ‐25,1315.083944353 0.415072845 5.869716432
Population
Potato (Kantang) Caul i Flower (Kabang Kol ) Cabbage (Kubis )
Kabupaten/ Kota
Population
Sha l lot (Bawang Merah) Garl ic (Bawang Putih) Spring Onion (Bawang daun)
Kabupaten/ Kota
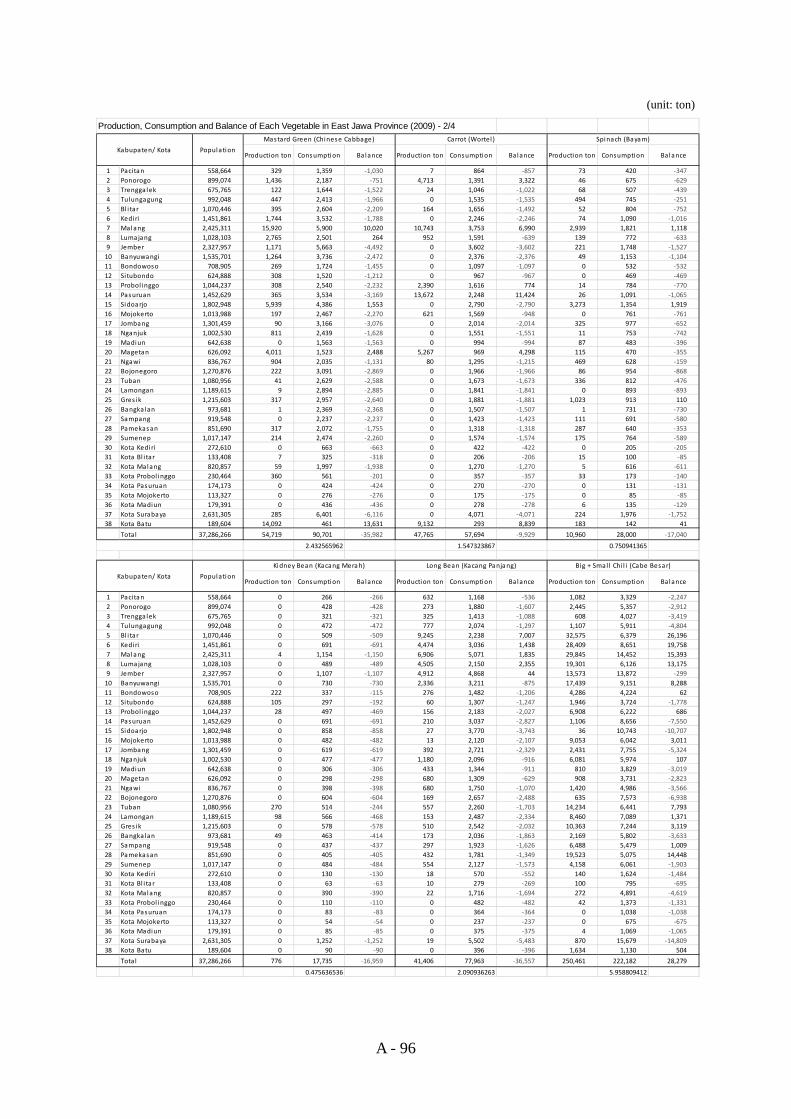
A - 96
(unit: ton)
Production, Consumption and Balance of Each Vegetable in East Jawa Province (2009) - 2/4
Production ton Consumption Ba lance Production ton Consumption Balance Production ton Consumption Balance
1 Pacitan 558,664 329 1,359 ‐1,030 7 864 ‐857 73 420 ‐3472 Ponorogo 899,074 1,436 2,187 ‐751 4,713 1,391 3,322 46 675 ‐6293 Trenggalek 675,765 122 1,644 ‐1,522 24 1,046 ‐1,022 68 507 ‐4394 Tulungagung 992,048 447 2,413 ‐1,966 0 1,535 ‐1,535 494 745 ‐2515 Bl i tar 1,070,446 395 2,604 ‐2,209 164 1,656 ‐1,492 52 804 ‐7526 Kediri 1,451,861 1,744 3,532 ‐1,788 0 2,246 ‐2,246 74 1,090 ‐1,0167 Malang 2,425,311 15,920 5,900 10,020 10,743 3,753 6,990 2,939 1,821 1,1188 Lumajang 1,028,103 2,765 2,501 264 952 1,591 ‐639 139 772 ‐6339 Jember 2,327,957 1,171 5,663 ‐4,492 0 3,602 ‐3,602 221 1,748 ‐1,52710 Banyuwangi 1,535,701 1,264 3,736 ‐2,472 0 2,376 ‐2,376 49 1,153 ‐1,10411 Bondowoso 708,905 269 1,724 ‐1,455 0 1,097 ‐1,097 0 532 ‐53212 Si tubondo 624,888 308 1,520 ‐1,212 0 967 ‐967 0 469 ‐46913 Probol inggo 1,044,237 308 2,540 ‐2,232 2,390 1,616 774 14 784 ‐77014 Pasuruan 1,452,629 365 3,534 ‐3,169 13,672 2,248 11,424 26 1,091 ‐1,06515 Sidoarjo 1,802,948 5,939 4,386 1,553 0 2,790 ‐2,790 3,273 1,354 1,91916 Mojokerto 1,013,988 197 2,467 ‐2,270 621 1,569 ‐948 0 761 ‐76117 Jombang 1,301,459 90 3,166 ‐3,076 0 2,014 ‐2,014 325 977 ‐65218 Nganjuk 1,002,530 811 2,439 ‐1,628 0 1,551 ‐1,551 11 753 ‐74219 Madiun 642,638 0 1,563 ‐1,563 0 994 ‐994 87 483 ‐39620 Magetan 626,092 4,011 1,523 2,488 5,267 969 4,298 115 470 ‐35521 Ngawi 836,767 904 2,035 ‐1,131 80 1,295 ‐1,215 469 628 ‐15922 Bojonegoro 1,270,876 222 3,091 ‐2,869 0 1,966 ‐1,966 86 954 ‐86823 Tuban 1,080,956 41 2,629 ‐2,588 0 1,673 ‐1,673 336 812 ‐47624 Lamongan 1,189,615 9 2,894 ‐2,885 0 1,841 ‐1,841 0 893 ‐89325 Gres ik 1,215,603 317 2,957 ‐2,640 0 1,881 ‐1,881 1,023 913 11026 Bangkalan 973,681 1 2,369 ‐2,368 0 1,507 ‐1,507 1 731 ‐73027 Sampang 919,548 0 2,237 ‐2,237 0 1,423 ‐1,423 111 691 ‐58028 Pamekasan 851,690 317 2,072 ‐1,755 0 1,318 ‐1,318 287 640 ‐35329 Sumenep 1,017,147 214 2,474 ‐2,260 0 1,574 ‐1,574 175 764 ‐58930 Kota Kediri 272,610 0 663 ‐663 0 422 ‐422 0 205 ‐20531 Kota Bl i tar 133,408 7 325 ‐318 0 206 ‐206 15 100 ‐8532 Kota Malang 820,857 59 1,997 ‐1,938 0 1,270 ‐1,270 5 616 ‐61133 Kota Probol inggo 230,464 360 561 ‐201 0 357 ‐357 33 173 ‐14034 Kota Pasuruan 174,173 0 424 ‐424 0 270 ‐270 0 131 ‐13135 Kota Mojokerto 113,327 0 276 ‐276 0 175 ‐175 0 85 ‐8536 Kota Madiun 179,391 0 436 ‐436 0 278 ‐278 6 135 ‐12937 Kota Surabaya 2,631,305 285 6,401 ‐6,116 0 4,071 ‐4,071 224 1,976 ‐1,75238 Kota Batu 189,604 14,092 461 13,631 9,132 293 8,839 183 142 41
Total 37,286,266 54,719 90,701 ‐35,982 47,765 57,694 ‐9,929 10,960 28,000 ‐17,040
2.432565962 1.547323867 0.750941365
Production ton Consumption Ba lance Production ton Consumption Balance Production ton Consumption Balance
1 Pacitan 558,664 0 266 ‐266 632 1,168 ‐536 1,082 3,329 ‐2,2472 Ponorogo 899,074 0 428 ‐428 273 1,880 ‐1,607 2,445 5,357 ‐2,9123 Trenggalek 675,765 0 321 ‐321 325 1,413 ‐1,088 608 4,027 ‐3,4194 Tulungagung 992,048 0 472 ‐472 777 2,074 ‐1,297 1,107 5,911 ‐4,8045 Bl i tar 1,070,446 0 509 ‐509 9,245 2,238 7,007 32,575 6,379 26,1966 Kediri 1,451,861 0 691 ‐691 4,474 3,036 1,438 28,409 8,651 19,7587 Malang 2,425,311 4 1,154 ‐1,150 6,906 5,071 1,835 29,845 14,452 15,3938 Lumajang 1,028,103 0 489 ‐489 4,505 2,150 2,355 19,301 6,126 13,1759 Jember 2,327,957 0 1,107 ‐1,107 4,912 4,868 44 13,573 13,872 ‐29910 Banyuwangi 1,535,701 0 730 ‐730 2,336 3,211 ‐875 17,439 9,151 8,28811 Bondowoso 708,905 222 337 ‐115 276 1,482 ‐1,206 4,286 4,224 6212 Si tubondo 624,888 105 297 ‐192 60 1,307 ‐1,247 1,946 3,724 ‐1,77813 Probol inggo 1,044,237 28 497 ‐469 156 2,183 ‐2,027 6,908 6,222 68614 Pasuruan 1,452,629 0 691 ‐691 210 3,037 ‐2,827 1,106 8,656 ‐7,55015 Sidoarjo 1,802,948 0 858 ‐858 27 3,770 ‐3,743 36 10,743 ‐10,70716 Mojokerto 1,013,988 0 482 ‐482 13 2,120 ‐2,107 9,053 6,042 3,01117 Jombang 1,301,459 0 619 ‐619 392 2,721 ‐2,329 2,431 7,755 ‐5,32418 Nganjuk 1,002,530 0 477 ‐477 1,180 2,096 ‐916 6,081 5,974 10719 Madiun 642,638 0 306 ‐306 433 1,344 ‐911 810 3,829 ‐3,01920 Magetan 626,092 0 298 ‐298 680 1,309 ‐629 908 3,731 ‐2,82321 Ngawi 836,767 0 398 ‐398 680 1,750 ‐1,070 1,420 4,986 ‐3,56622 Bojonegoro 1,270,876 0 604 ‐604 169 2,657 ‐2,488 635 7,573 ‐6,93823 Tuban 1,080,956 270 514 ‐244 557 2,260 ‐1,703 14,234 6,441 7,79324 Lamongan 1,189,615 98 566 ‐468 153 2,487 ‐2,334 8,460 7,089 1,37125 Gres ik 1,215,603 0 578 ‐578 510 2,542 ‐2,032 10,363 7,244 3,11926 Bangkalan 973,681 49 463 ‐414 173 2,036 ‐1,863 2,169 5,802 ‐3,63327 Sampang 919,548 0 437 ‐437 297 1,923 ‐1,626 6,488 5,479 1,00928 Pamekasan 851,690 0 405 ‐405 432 1,781 ‐1,349 19,523 5,075 14,44829 Sumenep 1,017,147 0 484 ‐484 554 2,127 ‐1,573 4,158 6,061 ‐1,90330 Kota Kediri 272,610 0 130 ‐130 18 570 ‐552 140 1,624 ‐1,48431 Kota Bl i tar 133,408 0 63 ‐63 10 279 ‐269 100 795 ‐69532 Kota Malang 820,857 0 390 ‐390 22 1,716 ‐1,694 272 4,891 ‐4,61933 Kota Probol inggo 230,464 0 110 ‐110 0 482 ‐482 42 1,373 ‐1,33134 Kota Pasuruan 174,173 0 83 ‐83 0 364 ‐364 0 1,038 ‐1,03835 Kota Mojokerto 113,327 0 54 ‐54 0 237 ‐237 0 675 ‐67536 Kota Madiun 179,391 0 85 ‐85 0 375 ‐375 4 1,069 ‐1,06537 Kota Surabaya 2,631,305 0 1,252 ‐1,252 19 5,502 ‐5,483 870 15,679 ‐14,80938 Kota Batu 189,604 0 90 ‐90 0 396 ‐396 1,634 1,130 504
Total 37,286,266 776 17,735 ‐16,959 41,406 77,963 ‐36,557 250,461 222,182 28,279
0.475636536 2.090936263 5.958809412
Kabupaten/ Kota Population
Kidney Bean (Kacang Merah) Long Bean (Kacang Panjang)
Kabupaten/ Kota
Big + Smal l Chi l i (Cabe Besar)
Population
Mastard Green (Chinese Cabbage) Carrot (Wortel ) Spinach (Bayam)
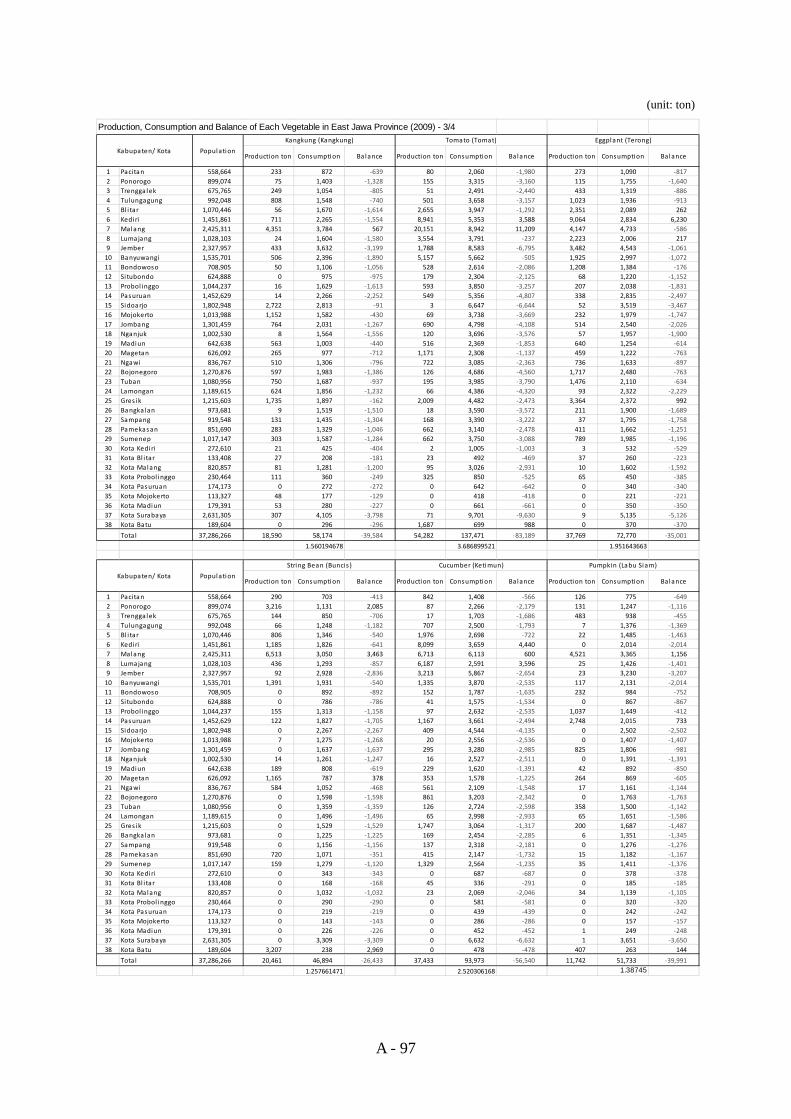
A - 97
(unit: ton)
Production, Consumption and Balance of Each Vegetable in East Jawa Province (2009) - 3/4
Production ton Consumption Ba lance Production ton Consumption Balance Production ton Consumption Balance
1 Pacitan 558,664 233 872 ‐639 80 2,060 ‐1,980 273 1,090 ‐8172 Ponorogo 899,074 75 1,403 ‐1,328 155 3,315 ‐3,160 115 1,755 ‐1,6403 Trenggalek 675,765 249 1,054 ‐805 51 2,491 ‐2,440 433 1,319 ‐8864 Tulungagung 992,048 808 1,548 ‐740 501 3,658 ‐3,157 1,023 1,936 ‐9135 Bl i tar 1,070,446 56 1,670 ‐1,614 2,655 3,947 ‐1,292 2,351 2,089 2626 Kediri 1,451,861 711 2,265 ‐1,554 8,941 5,353 3,588 9,064 2,834 6,2307 Malang 2,425,311 4,351 3,784 567 20,151 8,942 11,209 4,147 4,733 ‐5868 Lumajang 1,028,103 24 1,604 ‐1,580 3,554 3,791 ‐237 2,223 2,006 2179 Jember 2,327,957 433 3,632 ‐3,199 1,788 8,583 ‐6,795 3,482 4,543 ‐1,06110 Banyuwangi 1,535,701 506 2,396 ‐1,890 5,157 5,662 ‐505 1,925 2,997 ‐1,07211 Bondowoso 708,905 50 1,106 ‐1,056 528 2,614 ‐2,086 1,208 1,384 ‐17612 Si tubondo 624,888 0 975 ‐975 179 2,304 ‐2,125 68 1,220 ‐1,15213 Probol inggo 1,044,237 16 1,629 ‐1,613 593 3,850 ‐3,257 207 2,038 ‐1,83114 Pasuruan 1,452,629 14 2,266 ‐2,252 549 5,356 ‐4,807 338 2,835 ‐2,49715 Sidoarjo 1,802,948 2,722 2,813 ‐91 3 6,647 ‐6,644 52 3,519 ‐3,46716 Mojokerto 1,013,988 1,152 1,582 ‐430 69 3,738 ‐3,669 232 1,979 ‐1,74717 Jombang 1,301,459 764 2,031 ‐1,267 690 4,798 ‐4,108 514 2,540 ‐2,02618 Nganjuk 1,002,530 8 1,564 ‐1,556 120 3,696 ‐3,576 57 1,957 ‐1,90019 Madiun 642,638 563 1,003 ‐440 516 2,369 ‐1,853 640 1,254 ‐61420 Magetan 626,092 265 977 ‐712 1,171 2,308 ‐1,137 459 1,222 ‐76321 Ngawi 836,767 510 1,306 ‐796 722 3,085 ‐2,363 736 1,633 ‐89722 Bojonegoro 1,270,876 597 1,983 ‐1,386 126 4,686 ‐4,560 1,717 2,480 ‐76323 Tuban 1,080,956 750 1,687 ‐937 195 3,985 ‐3,790 1,476 2,110 ‐63424 Lamongan 1,189,615 624 1,856 ‐1,232 66 4,386 ‐4,320 93 2,322 ‐2,22925 Gres ik 1,215,603 1,735 1,897 ‐162 2,009 4,482 ‐2,473 3,364 2,372 99226 Bangkalan 973,681 9 1,519 ‐1,510 18 3,590 ‐3,572 211 1,900 ‐1,68927 Sampang 919,548 131 1,435 ‐1,304 168 3,390 ‐3,222 37 1,795 ‐1,75828 Pamekasan 851,690 283 1,329 ‐1,046 662 3,140 ‐2,478 411 1,662 ‐1,25129 Sumenep 1,017,147 303 1,587 ‐1,284 662 3,750 ‐3,088 789 1,985 ‐1,19630 Kota Kediri 272,610 21 425 ‐404 2 1,005 ‐1,003 3 532 ‐52931 Kota Bl i tar 133,408 27 208 ‐181 23 492 ‐469 37 260 ‐22332 Kota Malang 820,857 81 1,281 ‐1,200 95 3,026 ‐2,931 10 1,602 ‐1,59233 Kota Probol inggo 230,464 111 360 ‐249 325 850 ‐525 65 450 ‐38534 Kota Pasuruan 174,173 0 272 ‐272 0 642 ‐642 0 340 ‐34035 Kota Mojokerto 113,327 48 177 ‐129 0 418 ‐418 0 221 ‐22136 Kota Madiun 179,391 53 280 ‐227 0 661 ‐661 0 350 ‐35037 Kota Surabaya 2,631,305 307 4,105 ‐3,798 71 9,701 ‐9,630 9 5,135 ‐5,12638 Kota Batu 189,604 0 296 ‐296 1,687 699 988 0 370 ‐370
Total 37,286,266 18,590 58,174 ‐39,584 54,282 137,471 ‐83,189 37,769 72,770 ‐35,001
1.560194678 3.686899521 1.951643663
Production ton Consumption Ba lance Production ton Consumption Balance Production ton Consumption Balance
1 Pacitan 558,664 290 703 ‐413 842 1,408 ‐566 126 775 ‐6492 Ponorogo 899,074 3,216 1,131 2,085 87 2,266 ‐2,179 131 1,247 ‐1,1163 Trenggalek 675,765 144 850 ‐706 17 1,703 ‐1,686 483 938 ‐4554 Tulungagung 992,048 66 1,248 ‐1,182 707 2,500 ‐1,793 7 1,376 ‐1,3695 Bl i tar 1,070,446 806 1,346 ‐540 1,976 2,698 ‐722 22 1,485 ‐1,4636 Kediri 1,451,861 1,185 1,826 ‐641 8,099 3,659 4,440 0 2,014 ‐2,0147 Malang 2,425,311 6,513 3,050 3,463 6,713 6,113 600 4,521 3,365 1,1568 Lumajang 1,028,103 436 1,293 ‐857 6,187 2,591 3,596 25 1,426 ‐1,4019 Jember 2,327,957 92 2,928 ‐2,836 3,213 5,867 ‐2,654 23 3,230 ‐3,20710 Banyuwangi 1,535,701 1,391 1,931 ‐540 1,335 3,870 ‐2,535 117 2,131 ‐2,01411 Bondowoso 708,905 0 892 ‐892 152 1,787 ‐1,635 232 984 ‐75212 Si tubondo 624,888 0 786 ‐786 41 1,575 ‐1,534 0 867 ‐86713 Probol inggo 1,044,237 155 1,313 ‐1,158 97 2,632 ‐2,535 1,037 1,449 ‐41214 Pasuruan 1,452,629 122 1,827 ‐1,705 1,167 3,661 ‐2,494 2,748 2,015 73315 Sidoarjo 1,802,948 0 2,267 ‐2,267 409 4,544 ‐4,135 0 2,502 ‐2,50216 Mojokerto 1,013,988 7 1,275 ‐1,268 20 2,556 ‐2,536 0 1,407 ‐1,40717 Jombang 1,301,459 0 1,637 ‐1,637 295 3,280 ‐2,985 825 1,806 ‐98118 Nganjuk 1,002,530 14 1,261 ‐1,247 16 2,527 ‐2,511 0 1,391 ‐1,39119 Madiun 642,638 189 808 ‐619 229 1,620 ‐1,391 42 892 ‐85020 Magetan 626,092 1,165 787 378 353 1,578 ‐1,225 264 869 ‐60521 Ngawi 836,767 584 1,052 ‐468 561 2,109 ‐1,548 17 1,161 ‐1,14422 Bojonegoro 1,270,876 0 1,598 ‐1,598 861 3,203 ‐2,342 0 1,763 ‐1,76323 Tuban 1,080,956 0 1,359 ‐1,359 126 2,724 ‐2,598 358 1,500 ‐1,14224 Lamongan 1,189,615 0 1,496 ‐1,496 65 2,998 ‐2,933 65 1,651 ‐1,58625 Gres ik 1,215,603 0 1,529 ‐1,529 1,747 3,064 ‐1,317 200 1,687 ‐1,48726 Bangkalan 973,681 0 1,225 ‐1,225 169 2,454 ‐2,285 6 1,351 ‐1,34527 Sampang 919,548 0 1,156 ‐1,156 137 2,318 ‐2,181 0 1,276 ‐1,27628 Pamekasan 851,690 720 1,071 ‐351 415 2,147 ‐1,732 15 1,182 ‐1,16729 Sumenep 1,017,147 159 1,279 ‐1,120 1,329 2,564 ‐1,235 35 1,411 ‐1,37630 Kota Kediri 272,610 0 343 ‐343 0 687 ‐687 0 378 ‐37831 Kota Bl i tar 133,408 0 168 ‐168 45 336 ‐291 0 185 ‐18532 Kota Malang 820,857 0 1,032 ‐1,032 23 2,069 ‐2,046 34 1,139 ‐1,10533 Kota Probol inggo 230,464 0 290 ‐290 0 581 ‐581 0 320 ‐32034 Kota Pasuruan 174,173 0 219 ‐219 0 439 ‐439 0 242 ‐24235 Kota Mojokerto 113,327 0 143 ‐143 0 286 ‐286 0 157 ‐15736 Kota Madiun 179,391 0 226 ‐226 0 452 ‐452 1 249 ‐24837 Kota Surabaya 2,631,305 0 3,309 ‐3,309 0 6,632 ‐6,632 1 3,651 ‐3,65038 Kota Batu 189,604 3,207 238 2,969 0 478 ‐478 407 263 144
Total 37,286,266 20,461 46,894 ‐26,433 37,433 93,973 ‐56,540 11,742 51,733 ‐39,991
1.257661471 2.520306168 1.38745
Tomato (Tomat) Eggplant (Terong)
Kabupaten/ Kota
Population
String Bean (Buncis ) Cucumber (Ketimun) Pumpkin (Labu Siam)
Kabupaten/ Kota
Population
Kangkung (Kangkung)
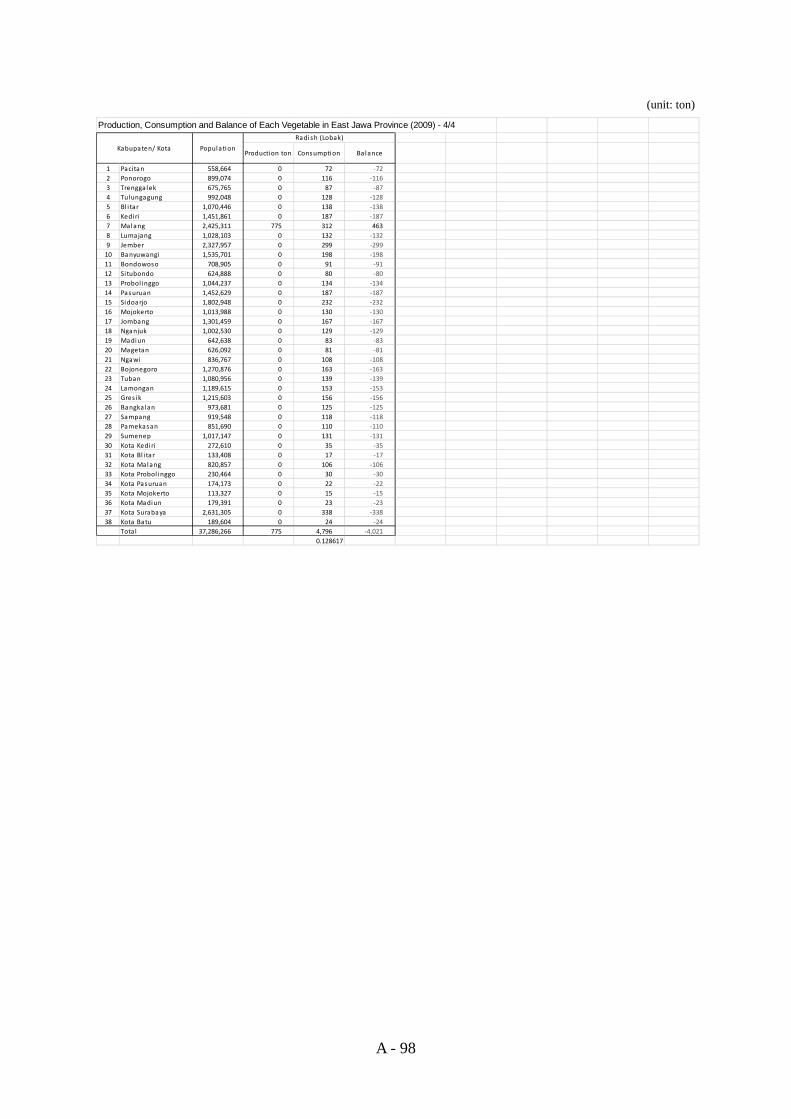
A - 98
(unit: ton)
Production, Consumption and Balance of Each Vegetable in East Jawa Province (2009) - 4/4
Production ton Consumption Ba lance
1 Pacitan 558,664 0 72 ‐722 Ponorogo 899,074 0 116 ‐1163 Trenggalek 675,765 0 87 ‐874 Tulungagung 992,048 0 128 ‐1285 Bl i tar 1,070,446 0 138 ‐1386 Kediri 1,451,861 0 187 ‐1877 Malang 2,425,311 775 312 4638 Lumajang 1,028,103 0 132 ‐1329 Jember 2,327,957 0 299 ‐29910 Banyuwangi 1,535,701 0 198 ‐19811 Bondowoso 708,905 0 91 ‐9112 Si tubondo 624,888 0 80 ‐8013 Probol inggo 1,044,237 0 134 ‐13414 Pasuruan 1,452,629 0 187 ‐18715 Sidoarjo 1,802,948 0 232 ‐23216 Mojokerto 1,013,988 0 130 ‐13017 Jombang 1,301,459 0 167 ‐16718 Nganjuk 1,002,530 0 129 ‐12919 Madiun 642,638 0 83 ‐8320 Magetan 626,092 0 81 ‐8121 Ngawi 836,767 0 108 ‐10822 Bojonegoro 1,270,876 0 163 ‐16323 Tuban 1,080,956 0 139 ‐13924 Lamongan 1,189,615 0 153 ‐15325 Gres ik 1,215,603 0 156 ‐15626 Bangkalan 973,681 0 125 ‐12527 Sampang 919,548 0 118 ‐11828 Pamekasan 851,690 0 110 ‐11029 Sumenep 1,017,147 0 131 ‐13130 Kota Kediri 272,610 0 35 ‐3531 Kota Bl i tar 133,408 0 17 ‐1732 Kota Malang 820,857 0 106 ‐10633 Kota Probol inggo 230,464 0 30 ‐3034 Kota Pasuruan 174,173 0 22 ‐2235 Kota Mojokerto 113,327 0 15 ‐1536 Kota Madiun 179,391 0 23 ‐2337 Kota Surabaya 2,631,305 0 338 ‐33838 Kota Batu 189,604 0 24 ‐24
Total 37,286,266 775 4,796 ‐4,0210.128617
Kabupaten/ Kota Population
Radish (Lobak)
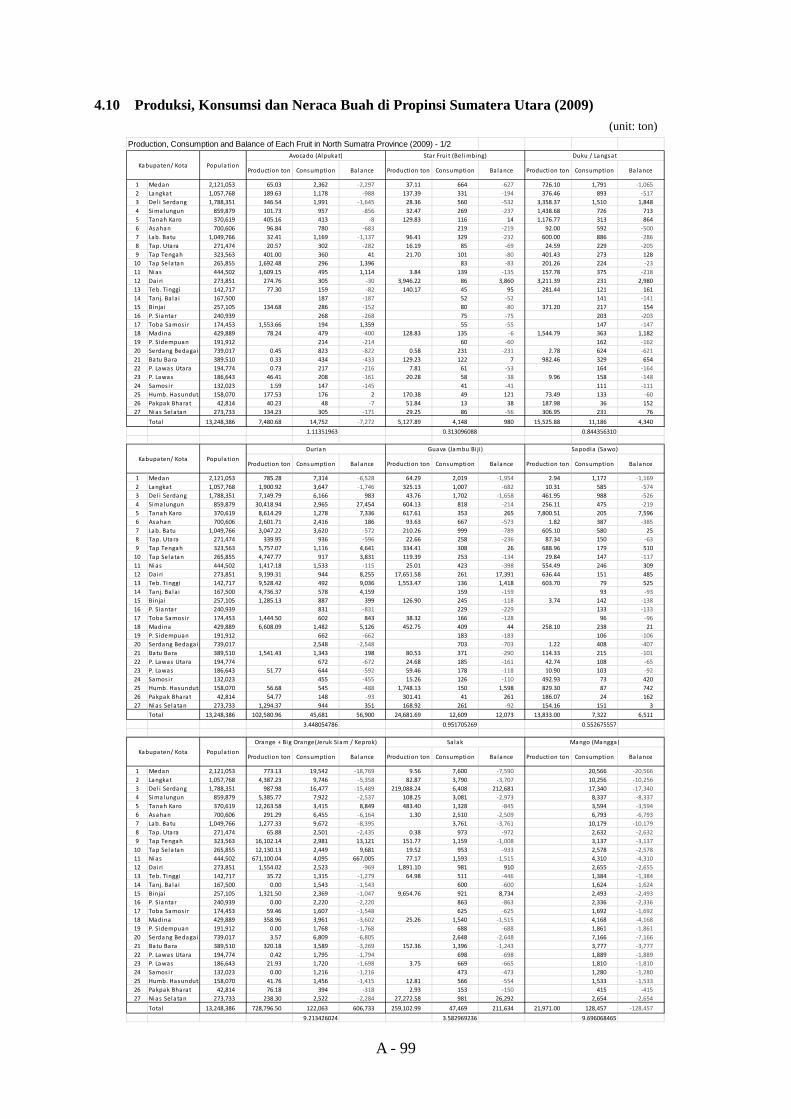
A - 99
4.10 Produksi, Konsumsi dan Neraca Buah di Propinsi Sumatera Utara (2009) (unit: ton)
Production, Consumption and Balance of Each Fruit in North Sumatra Province (2009) - 1/2
Production ton Consumption Balance Production ton Consumption Balance Production ton Consumption Balance
1 Medan 2,121,053 65.03 2,362 ‐2,297 37.11 664 ‐627 726.10 1,791 ‐1,0652 Langkat 1,057,768 189.63 1,178 ‐988 137.39 331 ‐194 376.46 893 ‐5173 Del i Serdang 1,788,351 346.54 1,991 ‐1,645 28.36 560 ‐532 3,358.37 1,510 1,8484 Simalungun 859,879 101.73 957 ‐856 32.47 269 ‐237 1,438.68 726 7135 Tanah Karo 370,619 405.16 413 ‐8 129.83 116 14 1,176.77 313 8646 Asahan 700,606 96.84 780 ‐683 219 ‐219 92.00 592 ‐5007 Lab. Batu 1,049,766 32.41 1,169 ‐1,137 96.41 329 ‐232 600.00 886 ‐2868 Tap. Utara 271,474 20.57 302 ‐282 16.19 85 ‐69 24.59 229 ‐2059 Tap Tengah 323,563 401.00 360 41 21.70 101 ‐80 401.43 273 12810 Tap Selatan 265,855 1,692.48 296 1,396 83 ‐83 201.26 224 ‐2311 Nias 444,502 1,609.15 495 1,114 3.84 139 ‐135 157.78 375 ‐21812 Dai ri 273,851 274.76 305 ‐30 3,946.22 86 3,860 3,211.39 231 2,98013 Teb. Tinggi 142,717 77.30 159 ‐82 140.17 45 95 281.44 121 16114 Tanj. Balai 167,500 187 ‐187 52 ‐52 141 ‐14115 Binja i 257,105 134.68 286 ‐152 80 ‐80 371.20 217 15416 P. Siantar 240,939 268 ‐268 75 ‐75 203 ‐20317 Toba Samos ir 174,453 1,553.66 194 1,359 55 ‐55 147 ‐14718 Madina 429,889 78.24 479 ‐400 128.83 135 ‐6 1,544.79 363 1,18219 P. Sidempuan 191,912 214 ‐214 60 ‐60 162 ‐16220 Serdang Bedagai 739,017 0.45 823 ‐822 0.58 231 ‐231 2.78 624 ‐62121 Batu Bara 389,510 0.33 434 ‐433 129.23 122 7 982.46 329 65422 P. Lawas Utara 194,774 0.73 217 ‐216 7.81 61 ‐53 164 ‐16423 P. Lawas 186,643 46.41 208 ‐161 20.28 58 ‐38 9.96 158 ‐14824 Samos i r 132,023 1.59 147 ‐145 41 ‐41 111 ‐11125 Humb. Hasunduta 158,070 177.53 176 2 170.38 49 121 73.49 133 ‐6026 Pakpak Bharat 42,814 40.23 48 ‐7 51.84 13 38 187.98 36 15227 Nias Selatan 273,733 134.23 305 ‐171 29.25 86 ‐56 306.95 231 76
Tota l 13,248,386 7,480.68 14,752 ‐7,272 5,127.89 4,148 980 15,525.88 11,186 4,340
1.11351963 0.313096088 0.844356310
Production ton Consumption Balance Production ton Consumption Balance Production ton Consumption Balance
1 Medan 2,121,053 785.28 7,314 ‐6,528 64.29 2,019 ‐1,954 2.94 1,172 ‐1,1692 Langkat 1,057,768 1,900.92 3,647 ‐1,746 325.13 1,007 ‐682 10.31 585 ‐5743 Del i Serdang 1,788,351 7,149.79 6,166 983 43.76 1,702 ‐1,658 461.95 988 ‐5264 Simalungun 859,879 30,418.94 2,965 27,454 604.13 818 ‐214 256.11 475 ‐2195 Tanah Karo 370,619 8,614.29 1,278 7,336 617.61 353 265 7,800.51 205 7,5966 Asahan 700,606 2,601.71 2,416 186 93.63 667 ‐573 1.82 387 ‐3857 Lab. Batu 1,049,766 3,047.22 3,620 ‐572 210.26 999 ‐789 605.10 580 258 Tap. Utara 271,474 339.95 936 ‐596 22.66 258 ‐236 87.34 150 ‐639 Tap Tengah 323,563 5,757.07 1,116 4,641 334.41 308 26 688.96 179 51010 Tap Selatan 265,855 4,747.77 917 3,831 119.39 253 ‐134 29.84 147 ‐11711 Nias 444,502 1,417.18 1,533 ‐115 25.01 423 ‐398 554.49 246 30912 Dai ri 273,851 9,199.31 944 8,255 17,651.58 261 17,391 636.44 151 48513 Teb. Tinggi 142,717 9,528.42 492 9,036 1,553.47 136 1,418 603.70 79 52514 Tanj. Balai 167,500 4,736.37 578 4,159 159 ‐159 93 ‐9315 Binja i 257,105 1,285.13 887 399 126.90 245 ‐118 3.74 142 ‐13816 P. Siantar 240,939 831 ‐831 229 ‐229 133 ‐13317 Toba Samos ir 174,453 1,444.50 602 843 38.32 166 ‐128 96 ‐9618 Madina 429,889 6,608.09 1,482 5,126 452.75 409 44 258.10 238 2119 P. Sidempuan 191,912 662 ‐662 183 ‐183 106 ‐10620 Serdang Bedagai 739,017 2,548 ‐2,548 703 ‐703 1.22 408 ‐40721 Batu Bara 389,510 1,541.43 1,343 198 80.53 371 ‐290 114.33 215 ‐10122 P. Lawas Utara 194,774 672 ‐672 24.68 185 ‐161 42.74 108 ‐6523 P. Lawas 186,643 51.77 644 ‐592 59.46 178 ‐118 10.90 103 ‐9224 Samos i r 132,023 455 ‐455 15.26 126 ‐110 492.93 73 42025 Humb. Hasunduta 158,070 56.68 545 ‐488 1,748.13 150 1,598 829.30 87 74226 Pakpak Bharat 42,814 54.77 148 ‐93 301.41 41 261 186.07 24 16227 Nias Selatan 273,733 1,294.37 944 351 168.92 261 ‐92 154.16 151 3
Tota l 13,248,386 102,580.96 45,681 56,900 24,681.69 12,609 12,073 13,833.00 7,322 6,511
3.448054786 0.951705269 0.552675557
Production ton Consumption Balance Production ton Consumption Balance Production ton Consumption Balance
1 Medan 2,121,053 773.13 19,542 ‐18,769 9.56 7,600 ‐7,590 20,566 ‐20,5662 Langkat 1,057,768 4,387.23 9,746 ‐5,358 82.87 3,790 ‐3,707 10,256 ‐10,2563 Del i Serdang 1,788,351 987.98 16,477 ‐15,489 219,088.24 6,408 212,681 17,340 ‐17,3404 Simalungun 859,879 5,385.77 7,922 ‐2,537 108.25 3,081 ‐2,973 8,337 ‐8,3375 Tanah Karo 370,619 12,263.58 3,415 8,849 483.40 1,328 ‐845 3,594 ‐3,5946 Asahan 700,606 291.29 6,455 ‐6,164 1.30 2,510 ‐2,509 6,793 ‐6,7937 Lab. Batu 1,049,766 1,277.33 9,672 ‐8,395 3,761 ‐3,761 10,179 ‐10,1798 Tap. Utara 271,474 65.88 2,501 ‐2,435 0.38 973 ‐972 2,632 ‐2,6329 Tap Tengah 323,563 16,102.14 2,981 13,121 151.77 1,159 ‐1,008 3,137 ‐3,13710 Tap Selatan 265,855 12,130.13 2,449 9,681 19.52 953 ‐933 2,578 ‐2,57811 Nias 444,502 671,100.04 4,095 667,005 77.17 1,593 ‐1,515 4,310 ‐4,31012 Dai ri 273,851 1,554.02 2,523 ‐969 1,891.10 981 910 2,655 ‐2,65513 Teb. Tinggi 142,717 35.72 1,315 ‐1,279 64.98 511 ‐446 1,384 ‐1,38414 Tanj. Balai 167,500 0.00 1,543 ‐1,543 600 ‐600 1,624 ‐1,62415 Binja i 257,105 1,321.50 2,369 ‐1,047 9,654.76 921 8,734 2,493 ‐2,49316 P. Siantar 240,939 0.00 2,220 ‐2,220 863 ‐863 2,336 ‐2,33617 Toba Samos ir 174,453 59.46 1,607 ‐1,548 625 ‐625 1,692 ‐1,69218 Madina 429,889 358.96 3,961 ‐3,602 25.26 1,540 ‐1,515 4,168 ‐4,16819 P. Sidempuan 191,912 0.00 1,768 ‐1,768 688 ‐688 1,861 ‐1,86120 Serdang Bedagai 739,017 3.57 6,809 ‐6,805 2,648 ‐2,648 7,166 ‐7,16621 Batu Bara 389,510 320.18 3,589 ‐3,269 152.36 1,396 ‐1,243 3,777 ‐3,77722 P. Lawas Utara 194,774 0.42 1,795 ‐1,794 698 ‐698 1,889 ‐1,88923 P. Lawas 186,643 21.93 1,720 ‐1,698 3.75 669 ‐665 1,810 ‐1,81024 Samos i r 132,023 0.00 1,216 ‐1,216 473 ‐473 1,280 ‐1,28025 Humb. Hasunduta 158,070 41.76 1,456 ‐1,415 12.81 566 ‐554 1,533 ‐1,53326 Pakpak Bharat 42,814 76.18 394 ‐318 2.93 153 ‐150 415 ‐41527 Nias Selatan 273,733 238.30 2,522 ‐2,284 27,272.58 981 26,292 2,654 ‐2,654
Tota l 13,248,386 728,796.50 122,063 606,733 259,102.99 47,469 211,634 21,971.00 128,457 ‐128,457
9.213426024 3.582969236 9.696068465
Population
Avocado (Alpukat) Star Frui t (Bel imbing) Duku / Langsat
Population
Durian Guava (Jambu Bi ji ) Sapodia (Sawo)
Population
Orange + Big Orange(Jeruk Siam / Keprok) Sa lak Mango (Mangga)
Kabupaten/ Kota
Kabupaten/ Kota
Kabupaten/ Kota
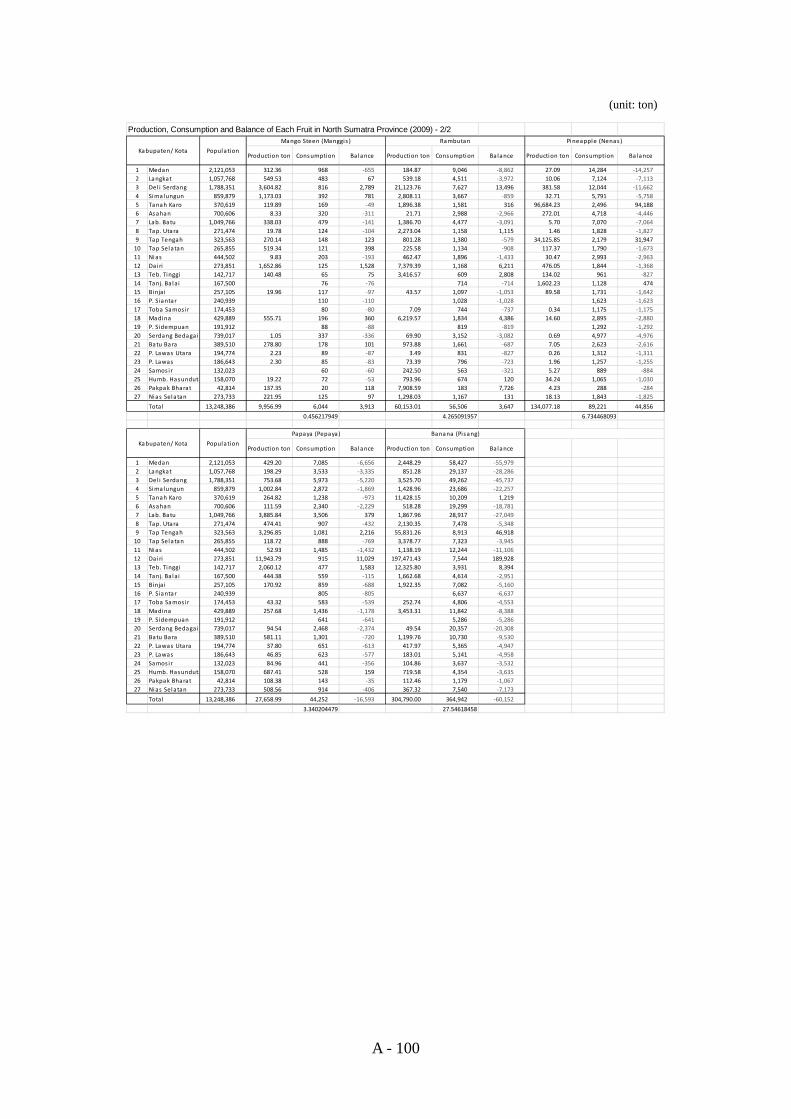
A - 100
(unit: ton)
Production, Consumption and Balance of Each Fruit in North Sumatra Province (2009) - 2/2
Production ton Consumption Balance Production ton Consumption Balance Production ton Consumption Balance
1 Medan 2,121,053 312.36 968 ‐655 184.87 9,046 ‐8,862 27.09 14,284 ‐14,2572 Langkat 1,057,768 549.53 483 67 539.18 4,511 ‐3,972 10.06 7,124 ‐7,1133 Del i Serdang 1,788,351 3,604.82 816 2,789 21,123.76 7,627 13,496 381.58 12,044 ‐11,6624 Simalungun 859,879 1,173.03 392 781 2,808.11 3,667 ‐859 32.71 5,791 ‐5,7585 Tanah Karo 370,619 119.89 169 ‐49 1,896.38 1,581 316 96,684.23 2,496 94,1886 Asahan 700,606 8.33 320 ‐311 21.71 2,988 ‐2,966 272.01 4,718 ‐4,4467 Lab. Batu 1,049,766 338.03 479 ‐141 1,386.70 4,477 ‐3,091 5.70 7,070 ‐7,0648 Tap. Utara 271,474 19.78 124 ‐104 2,273.04 1,158 1,115 1.46 1,828 ‐1,8279 Tap Tengah 323,563 270.14 148 123 801.28 1,380 ‐579 34,125.85 2,179 31,94710 Tap Selatan 265,855 519.34 121 398 225.58 1,134 ‐908 117.37 1,790 ‐1,67311 Nias 444,502 9.83 203 ‐193 462.47 1,896 ‐1,433 30.47 2,993 ‐2,96312 Dai ri 273,851 1,652.86 125 1,528 7,379.39 1,168 6,211 476.05 1,844 ‐1,36813 Teb. Tinggi 142,717 140.48 65 75 3,416.57 609 2,808 134.02 961 ‐82714 Tanj. Balai 167,500 76 ‐76 714 ‐714 1,602.23 1,128 47415 Binja i 257,105 19.96 117 ‐97 43.57 1,097 ‐1,053 89.58 1,731 ‐1,64216 P. Siantar 240,939 110 ‐110 1,028 ‐1,028 1,623 ‐1,62317 Toba Samos ir 174,453 80 ‐80 7.09 744 ‐737 0.34 1,175 ‐1,17518 Madina 429,889 555.71 196 360 6,219.57 1,834 4,386 14.60 2,895 ‐2,88019 P. Sidempuan 191,912 88 ‐88 819 ‐819 1,292 ‐1,29220 Serdang Bedagai 739,017 1.05 337 ‐336 69.90 3,152 ‐3,082 0.69 4,977 ‐4,97621 Batu Bara 389,510 278.80 178 101 973.88 1,661 ‐687 7.05 2,623 ‐2,61622 P. Lawas Utara 194,774 2.23 89 ‐87 3.49 831 ‐827 0.26 1,312 ‐1,31123 P. Lawas 186,643 2.30 85 ‐83 73.39 796 ‐723 1.96 1,257 ‐1,25524 Samos i r 132,023 60 ‐60 242.50 563 ‐321 5.27 889 ‐88425 Humb. Hasunduta 158,070 19.22 72 ‐53 793.96 674 120 34.24 1,065 ‐1,03026 Pakpak Bharat 42,814 137.35 20 118 7,908.59 183 7,726 4.23 288 ‐28427 Nias Selatan 273,733 221.95 125 97 1,298.03 1,167 131 18.13 1,843 ‐1,825
Tota l 13,248,386 9,956.99 6,044 3,913 60,153.01 56,506 3,647 134,077.18 89,221 44,856
0.456217949 4.265091957 6.734468093
Production ton Consumption Balance Production ton Consumption Balance
1 Medan 2,121,053 429.20 7,085 ‐6,656 2,448.29 58,427 ‐55,9792 Langkat 1,057,768 198.29 3,533 ‐3,335 851.28 29,137 ‐28,2863 Del i Serdang 1,788,351 753.68 5,973 ‐5,220 3,525.70 49,262 ‐45,7374 Simalungun 859,879 1,002.84 2,872 ‐1,869 1,428.96 23,686 ‐22,2575 Tanah Karo 370,619 264.82 1,238 ‐973 11,428.15 10,209 1,2196 Asahan 700,606 111.59 2,340 ‐2,229 518.28 19,299 ‐18,7817 Lab. Batu 1,049,766 3,885.84 3,506 379 1,867.96 28,917 ‐27,0498 Tap. Utara 271,474 474.41 907 ‐432 2,130.35 7,478 ‐5,3489 Tap Tengah 323,563 3,296.85 1,081 2,216 55,831.26 8,913 46,91810 Tap Selatan 265,855 118.72 888 ‐769 3,378.77 7,323 ‐3,94511 Nias 444,502 52.93 1,485 ‐1,432 1,138.19 12,244 ‐11,10612 Dai ri 273,851 11,943.79 915 11,029 197,471.43 7,544 189,92813 Teb. Tinggi 142,717 2,060.12 477 1,583 12,325.80 3,931 8,39414 Tanj. Balai 167,500 444.38 559 ‐115 1,662.68 4,614 ‐2,95115 Binja i 257,105 170.92 859 ‐688 1,922.35 7,082 ‐5,16016 P. Siantar 240,939 805 ‐805 6,637 ‐6,63717 Toba Samos ir 174,453 43.32 583 ‐539 252.74 4,806 ‐4,55318 Madina 429,889 257.68 1,436 ‐1,178 3,453.31 11,842 ‐8,38819 P. Sidempuan 191,912 641 ‐641 5,286 ‐5,28620 Serdang Bedagai 739,017 94.54 2,468 ‐2,374 49.54 20,357 ‐20,30821 Batu Bara 389,510 581.11 1,301 ‐720 1,199.76 10,730 ‐9,53022 P. Lawas Utara 194,774 37.80 651 ‐613 417.97 5,365 ‐4,94723 P. Lawas 186,643 46.85 623 ‐577 183.01 5,141 ‐4,95824 Samos i r 132,023 84.96 441 ‐356 104.86 3,637 ‐3,53225 Humb. Hasunduta 158,070 687.41 528 159 719.58 4,354 ‐3,63526 Pakpak Bharat 42,814 108.38 143 ‐35 112.46 1,179 ‐1,06727 Nias Selatan 273,733 508.56 914 ‐406 367.32 7,540 ‐7,173
Tota l 13,248,386 27,658.99 44,252 ‐16,593 304,790.00 364,942 ‐60,152
3.340204479 27.54618458
Population
Papaya (Pepaya) Banana (Pisang)
Population
Mango Steen (Manggis ) Rambutan Pineapple (Nenas)
Kabupaten/ Kota
Kabupaten/ Kota
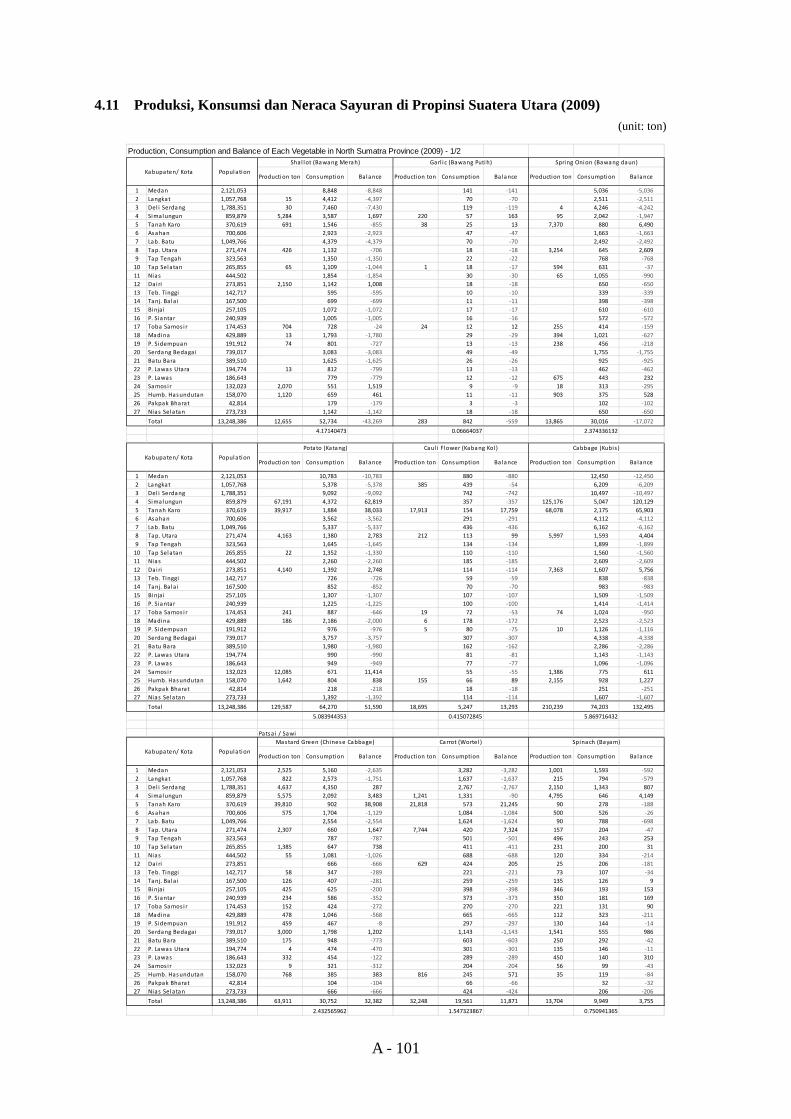
A - 101
4.11 Produksi, Konsumsi dan Neraca Sayuran di Propinsi Suatera Utara (2009) (unit: ton)
Production, Consumption and Balance of Each Vegetable in North Sumatra Province (2009) - 1/2
Production ton Consumption Balance Production ton Consumption Ba lance Production ton Consumption Ba lance
1 Medan 2,121,053 8,848 ‐8,848 141 ‐141 5,036 ‐5,0362 Langkat 1,057,768 15 4,412 ‐4,397 70 ‐70 2,511 ‐2,5113 Del i Serdang 1,788,351 30 7,460 ‐7,430 119 ‐119 4 4,246 ‐4,2424 Simalungun 859,879 5,284 3,587 1,697 220 57 163 95 2,042 ‐1,9475 Tanah Karo 370,619 691 1,546 ‐855 38 25 13 7,370 880 6,4906 Asahan 700,606 2,923 ‐2,923 47 ‐47 1,663 ‐1,6637 Lab. Batu 1,049,766 4,379 ‐4,379 70 ‐70 2,492 ‐2,4928 Tap. Utara 271,474 426 1,132 ‐706 18 ‐18 3,254 645 2,6099 Tap Tengah 323,563 1,350 ‐1,350 22 ‐22 768 ‐76810 Tap Selatan 265,855 65 1,109 ‐1,044 1 18 ‐17 594 631 ‐3711 Nias 444,502 1,854 ‐1,854 30 ‐30 65 1,055 ‐99012 Dai ri 273,851 2,150 1,142 1,008 18 ‐18 650 ‐65013 Teb. Tinggi 142,717 595 ‐595 10 ‐10 339 ‐33914 Tanj. Bala i 167,500 699 ‐699 11 ‐11 398 ‐39815 Binja i 257,105 1,072 ‐1,072 17 ‐17 610 ‐61016 P. Siantar 240,939 1,005 ‐1,005 16 ‐16 572 ‐57217 Toba Samos i r 174,453 704 728 ‐24 24 12 12 255 414 ‐15918 Madina 429,889 13 1,793 ‐1,780 29 ‐29 394 1,021 ‐62719 P. Sidempuan 191,912 74 801 ‐727 13 ‐13 238 456 ‐21820 Serdang Bedaga i 739,017 3,083 ‐3,083 49 ‐49 1,755 ‐1,75521 Batu Bara 389,510 1,625 ‐1,625 26 ‐26 925 ‐92522 P. Lawas Utara 194,774 13 812 ‐799 13 ‐13 462 ‐46223 P. Lawas 186,643 779 ‐779 12 ‐12 675 443 23224 Samos i r 132,023 2,070 551 1,519 9 ‐9 18 313 ‐29525 Humb. Hasundutan 158,070 1,120 659 461 11 ‐11 903 375 52826 Pakpak Bharat 42,814 179 ‐179 3 ‐3 102 ‐10227 Nias Selatan 273,733 1,142 ‐1,142 18 ‐18 650 ‐650
Total 13,248,386 12,655 52,734 ‐43,269 283 842 ‐559 13,865 30,016 ‐17,072
4.17140473 0.06664037 2.374336132
Production ton Consumption Balance Production ton Consumption Ba lance Production ton Consumption Ba lance
1 Medan 2,121,053 10,783 ‐10,783 880 ‐880 12,450 ‐12,4502 Langkat 1,057,768 5,378 ‐5,378 385 439 ‐54 6,209 ‐6,2093 Del i Serdang 1,788,351 9,092 ‐9,092 742 ‐742 10,497 ‐10,4974 Simalungun 859,879 67,191 4,372 62,819 357 ‐357 125,176 5,047 120,1295 Tanah Karo 370,619 39,917 1,884 38,033 17,913 154 17,759 68,078 2,175 65,9036 Asahan 700,606 3,562 ‐3,562 291 ‐291 4,112 ‐4,1127 Lab. Batu 1,049,766 5,337 ‐5,337 436 ‐436 6,162 ‐6,1628 Tap. Utara 271,474 4,163 1,380 2,783 212 113 99 5,997 1,593 4,4049 Tap Tengah 323,563 1,645 ‐1,645 134 ‐134 1,899 ‐1,89910 Tap Selatan 265,855 22 1,352 ‐1,330 110 ‐110 1,560 ‐1,56011 Nias 444,502 2,260 ‐2,260 185 ‐185 2,609 ‐2,60912 Dai ri 273,851 4,140 1,392 2,748 114 ‐114 7,363 1,607 5,75613 Teb. Tinggi 142,717 726 ‐726 59 ‐59 838 ‐83814 Tanj. Bala i 167,500 852 ‐852 70 ‐70 983 ‐98315 Binja i 257,105 1,307 ‐1,307 107 ‐107 1,509 ‐1,50916 P. Siantar 240,939 1,225 ‐1,225 100 ‐100 1,414 ‐1,41417 Toba Samos i r 174,453 241 887 ‐646 19 72 ‐53 74 1,024 ‐95018 Madina 429,889 186 2,186 ‐2,000 6 178 ‐172 2,523 ‐2,52319 P. Sidempuan 191,912 976 ‐976 5 80 ‐75 10 1,126 ‐1,11620 Serdang Bedaga i 739,017 3,757 ‐3,757 307 ‐307 4,338 ‐4,33821 Batu Bara 389,510 1,980 ‐1,980 162 ‐162 2,286 ‐2,28622 P. Lawas Utara 194,774 990 ‐990 81 ‐81 1,143 ‐1,14323 P. Lawas 186,643 949 ‐949 77 ‐77 1,096 ‐1,09624 Samos i r 132,023 12,085 671 11,414 55 ‐55 1,386 775 61125 Humb. Hasundutan 158,070 1,642 804 838 155 66 89 2,155 928 1,22726 Pakpak Bharat 42,814 218 ‐218 18 ‐18 251 ‐25127 Nias Selatan 273,733 1,392 ‐1,392 114 ‐114 1,607 ‐1,607
Total 13,248,386 129,587 64,270 51,590 18,695 5,247 13,293 210,239 74,203 132,495
5.083944353 0.415072845 5.869716432
Patsai / Sawi
Production ton Consumption Balance Production ton Consumption Ba lance Production ton Consumption Ba lance
1 Medan 2,121,053 2,525 5,160 ‐2,635 3,282 ‐3,282 1,001 1,593 ‐5922 Langkat 1,057,768 822 2,573 ‐1,751 1,637 ‐1,637 215 794 ‐5793 Del i Serdang 1,788,351 4,637 4,350 287 2,767 ‐2,767 2,150 1,343 8074 Simalungun 859,879 5,575 2,092 3,483 1,241 1,331 ‐90 4,795 646 4,1495 Tanah Karo 370,619 39,810 902 38,908 21,818 573 21,245 90 278 ‐1886 Asahan 700,606 575 1,704 ‐1,129 1,084 ‐1,084 500 526 ‐267 Lab. Batu 1,049,766 2,554 ‐2,554 1,624 ‐1,624 90 788 ‐6988 Tap. Utara 271,474 2,307 660 1,647 7,744 420 7,324 157 204 ‐479 Tap Tengah 323,563 787 ‐787 501 ‐501 496 243 25310 Tap Selatan 265,855 1,385 647 738 411 ‐411 231 200 3111 Nias 444,502 55 1,081 ‐1,026 688 ‐688 120 334 ‐21412 Dai ri 273,851 666 ‐666 629 424 205 25 206 ‐18113 Teb. Tinggi 142,717 58 347 ‐289 221 ‐221 73 107 ‐3414 Tanj. Bala i 167,500 126 407 ‐281 259 ‐259 135 126 915 Binja i 257,105 425 625 ‐200 398 ‐398 346 193 15316 P. Siantar 240,939 234 586 ‐352 373 ‐373 350 181 16917 Toba Samos i r 174,453 152 424 ‐272 270 ‐270 221 131 9018 Madina 429,889 478 1,046 ‐568 665 ‐665 112 323 ‐21119 P. Sidempuan 191,912 459 467 ‐8 297 ‐297 130 144 ‐1420 Serdang Bedaga i 739,017 3,000 1,798 1,202 1,143 ‐1,143 1,541 555 98621 Batu Bara 389,510 175 948 ‐773 603 ‐603 250 292 ‐4222 P. Lawas Utara 194,774 4 474 ‐470 301 ‐301 135 146 ‐1123 P. Lawas 186,643 332 454 ‐122 289 ‐289 450 140 31024 Samos i r 132,023 9 321 ‐312 204 ‐204 56 99 ‐4325 Humb. Hasundutan 158,070 768 385 383 816 245 571 35 119 ‐8426 Pakpak Bharat 42,814 104 ‐104 66 ‐66 32 ‐3227 Nias Selatan 273,733 666 ‐666 424 ‐424 206 ‐206
Total 13,248,386 63,911 30,752 32,382 32,248 19,561 11,871 13,704 9,949 3,755
2.432565962 1.547323867 0.750941365
Population
Mastard Green (Chinese Cabbage) Carrot (Wortel ) Spinach (Bayam)
Cabbage (Kubis)
Kabupaten/ Kota
Population
Shal lot (Bawang Merah) Garl i c (Bawang Putih) Spring Onion (Bawang daun)
Kabupaten/ Kota
Population
Potato (Katang) Caul i Flower (Kabang Kol)
Kabupaten/ Kota
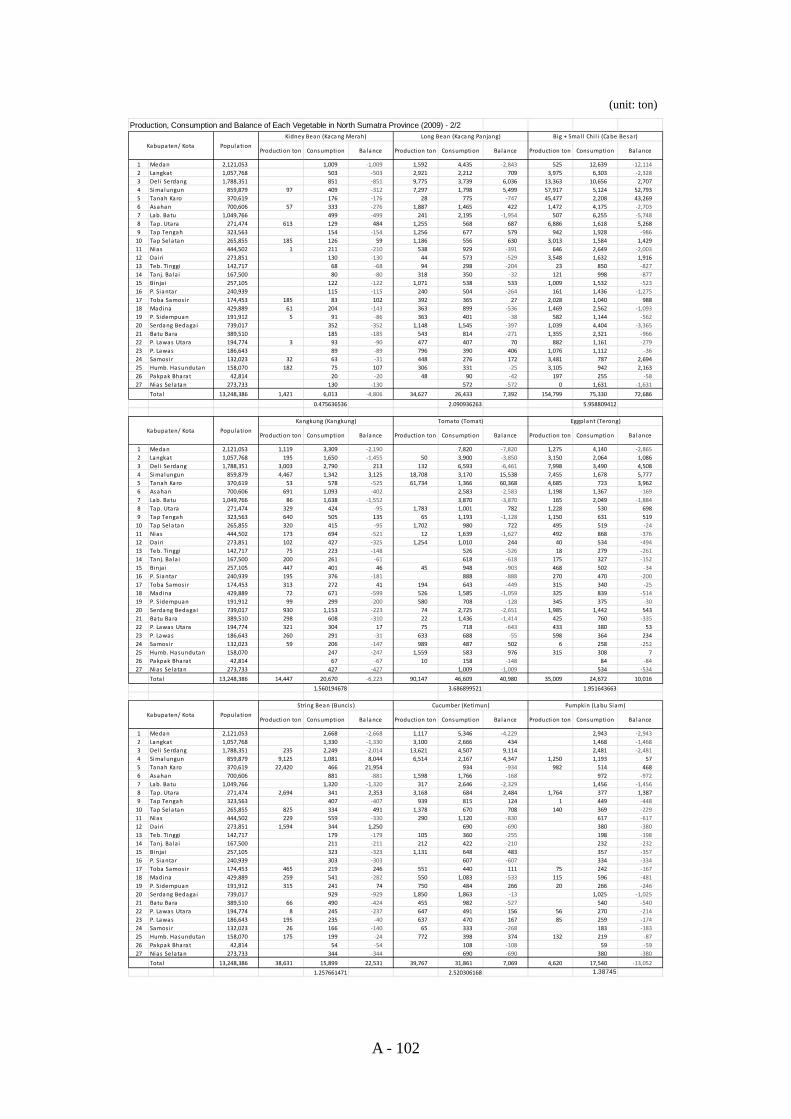
A - 102
(unit: ton)
Production, Consumption and Balance of Each Vegetable in North Sumatra Province (2009) - 2/2
Production ton Consumption Ba lance Production ton Consumption Balance Production ton Consumption Balance
1 Medan 2,121,053 1,009 ‐1,009 1,592 4,435 ‐2,843 525 12,639 ‐12,1142 Langkat 1,057,768 503 ‐503 2,921 2,212 709 3,975 6,303 ‐2,3283 Del i Serdang 1,788,351 851 ‐851 9,775 3,739 6,036 13,363 10,656 2,7074 Simalungun 859,879 97 409 ‐312 7,297 1,798 5,499 57,917 5,124 52,7935 Tanah Karo 370,619 176 ‐176 28 775 ‐747 45,477 2,208 43,2696 Asahan 700,606 57 333 ‐276 1,887 1,465 422 1,472 4,175 ‐2,7037 Lab. Batu 1,049,766 499 ‐499 241 2,195 ‐1,954 507 6,255 ‐5,7488 Tap. Utara 271,474 613 129 484 1,255 568 687 6,886 1,618 5,2689 Tap Tengah 323,563 154 ‐154 1,256 677 579 942 1,928 ‐98610 Tap Sela tan 265,855 185 126 59 1,186 556 630 3,013 1,584 1,42911 Nias 444,502 1 211 ‐210 538 929 ‐391 646 2,649 ‐2,00312 Dairi 273,851 130 ‐130 44 573 ‐529 3,548 1,632 1,91613 Teb. Tinggi 142,717 68 ‐68 94 298 ‐204 23 850 ‐82714 Tanj. Bala i 167,500 80 ‐80 318 350 ‐32 121 998 ‐87715 Binja i 257,105 122 ‐122 1,071 538 533 1,009 1,532 ‐52316 P. Siantar 240,939 115 ‐115 240 504 ‐264 161 1,436 ‐1,27517 Toba Samos ir 174,453 185 83 102 392 365 27 2,028 1,040 98818 Madina 429,889 61 204 ‐143 363 899 ‐536 1,469 2,562 ‐1,09319 P. Sidempuan 191,912 5 91 ‐86 363 401 ‐38 582 1,144 ‐56220 Serdang Bedagai 739,017 352 ‐352 1,148 1,545 ‐397 1,039 4,404 ‐3,36521 Batu Bara 389,510 185 ‐185 543 814 ‐271 1,355 2,321 ‐96622 P. Lawas Utara 194,774 3 93 ‐90 477 407 70 882 1,161 ‐27923 P. Lawas 186,643 89 ‐89 796 390 406 1,076 1,112 ‐3624 Samos ir 132,023 32 63 ‐31 448 276 172 3,481 787 2,69425 Humb. Hasundutan 158,070 182 75 107 306 331 ‐25 3,105 942 2,16326 Pakpak Bharat 42,814 20 ‐20 48 90 ‐42 197 255 ‐5827 Nias Selatan 273,733 130 ‐130 572 ‐572 0 1,631 ‐1,631
Total 13,248,386 1,421 6,013 ‐4,806 34,627 26,433 7,392 154,799 75,330 72,686
0.475636536 2.090936263 5.958809412
Production ton Consumption Ba lance Production ton Consumption Balance Production ton Consumption Balance
1 Medan 2,121,053 1,119 3,309 ‐2,190 7,820 ‐7,820 1,275 4,140 ‐2,8652 Langkat 1,057,768 195 1,650 ‐1,455 50 3,900 ‐3,850 3,150 2,064 1,0863 Del i Serdang 1,788,351 3,003 2,790 213 132 6,593 ‐6,461 7,998 3,490 4,5084 Simalungun 859,879 4,467 1,342 3,125 18,708 3,170 15,538 7,455 1,678 5,7775 Tanah Karo 370,619 53 578 ‐525 61,734 1,366 60,368 4,685 723 3,9626 Asahan 700,606 691 1,093 ‐402 2,583 ‐2,583 1,198 1,367 ‐1697 Lab. Batu 1,049,766 86 1,638 ‐1,552 3,870 ‐3,870 165 2,049 ‐1,8848 Tap. Utara 271,474 329 424 ‐95 1,783 1,001 782 1,228 530 6989 Tap Tengah 323,563 640 505 135 65 1,193 ‐1,128 1,150 631 51910 Tap Sela tan 265,855 320 415 ‐95 1,702 980 722 495 519 ‐2411 Nias 444,502 173 694 ‐521 12 1,639 ‐1,627 492 868 ‐37612 Dairi 273,851 102 427 ‐325 1,254 1,010 244 40 534 ‐49413 Teb. Tinggi 142,717 75 223 ‐148 526 ‐526 18 279 ‐26114 Tanj. Bala i 167,500 200 261 ‐61 618 ‐618 175 327 ‐15215 Binja i 257,105 447 401 46 45 948 ‐903 468 502 ‐3416 P. Siantar 240,939 195 376 ‐181 888 ‐888 270 470 ‐20017 Toba Samos ir 174,453 313 272 41 194 643 ‐449 315 340 ‐2518 Madina 429,889 72 671 ‐599 526 1,585 ‐1,059 325 839 ‐51419 P. Sidempuan 191,912 99 299 ‐200 580 708 ‐128 345 375 ‐3020 Serdang Bedagai 739,017 930 1,153 ‐223 74 2,725 ‐2,651 1,985 1,442 54321 Batu Bara 389,510 298 608 ‐310 22 1,436 ‐1,414 425 760 ‐33522 P. Lawas Utara 194,774 321 304 17 75 718 ‐643 433 380 5323 P. Lawas 186,643 260 291 ‐31 633 688 ‐55 598 364 23424 Samos ir 132,023 59 206 ‐147 989 487 502 6 258 ‐25225 Humb. Hasundutan 158,070 247 ‐247 1,559 583 976 315 308 726 Pakpak Bharat 42,814 67 ‐67 10 158 ‐148 84 ‐8427 Nias Selatan 273,733 427 ‐427 1,009 ‐1,009 534 ‐534
Total 13,248,386 14,447 20,670 ‐6,223 90,147 46,609 40,980 35,009 24,672 10,016
1.560194678 3.686899521 1.951643663
Production ton Consumption Ba lance Production ton Consumption Balance Production ton Consumption Balance
1 Medan 2,121,053 2,668 ‐2,668 1,117 5,346 ‐4,229 2,943 ‐2,9432 Langkat 1,057,768 1,330 ‐1,330 3,100 2,666 434 1,468 ‐1,4683 Del i Serdang 1,788,351 235 2,249 ‐2,014 13,621 4,507 9,114 2,481 ‐2,4814 Simalungun 859,879 9,125 1,081 8,044 6,514 2,167 4,347 1,250 1,193 575 Tanah Karo 370,619 22,420 466 21,954 934 ‐934 982 514 4686 Asahan 700,606 881 ‐881 1,598 1,766 ‐168 972 ‐9727 Lab. Batu 1,049,766 1,320 ‐1,320 317 2,646 ‐2,329 1,456 ‐1,4568 Tap. Utara 271,474 2,694 341 2,353 3,168 684 2,484 1,764 377 1,3879 Tap Tengah 323,563 407 ‐407 939 815 124 1 449 ‐44810 Tap Sela tan 265,855 825 334 491 1,378 670 708 140 369 ‐22911 Nias 444,502 229 559 ‐330 290 1,120 ‐830 617 ‐61712 Dairi 273,851 1,594 344 1,250 690 ‐690 380 ‐38013 Teb. Tinggi 142,717 179 ‐179 105 360 ‐255 198 ‐19814 Tanj. Bala i 167,500 211 ‐211 212 422 ‐210 232 ‐23215 Binja i 257,105 323 ‐323 1,131 648 483 357 ‐35716 P. Siantar 240,939 303 ‐303 607 ‐607 334 ‐33417 Toba Samos ir 174,453 465 219 246 551 440 111 75 242 ‐16718 Madina 429,889 259 541 ‐282 550 1,083 ‐533 115 596 ‐48119 P. Sidempuan 191,912 315 241 74 750 484 266 20 266 ‐24620 Serdang Bedagai 739,017 929 ‐929 1,850 1,863 ‐13 1,025 ‐1,02521 Batu Bara 389,510 66 490 ‐424 455 982 ‐527 540 ‐54022 P. Lawas Utara 194,774 8 245 ‐237 647 491 156 56 270 ‐21423 P. Lawas 186,643 195 235 ‐40 637 470 167 85 259 ‐17424 Samos ir 132,023 26 166 ‐140 65 333 ‐268 183 ‐18325 Humb. Hasundutan 158,070 175 199 ‐24 772 398 374 132 219 ‐8726 Pakpak Bharat 42,814 54 ‐54 108 ‐108 59 ‐5927 Nias Selatan 273,733 344 ‐344 690 ‐690 380 ‐380
Total 13,248,386 38,631 15,899 22,531 39,767 31,861 7,069 4,620 17,540 ‐13,052
1.257661471 2.520306168 1.38745
Population
Kangkung (Kangkung) Tomato (Tomat) Eggplant (Terong)
Kabupaten/ Kota
Population
String Bean (Buncis ) Cucumber (Ketimun) Pumpkin (Labu Siam)
Kabupaten/ Kota
Big + Smal l Chi l i (Cabe Besar)
Kabupaten/ Kota Population
Kidney Bean (Kacang Merah) Long Bean (Kacang Panjang)
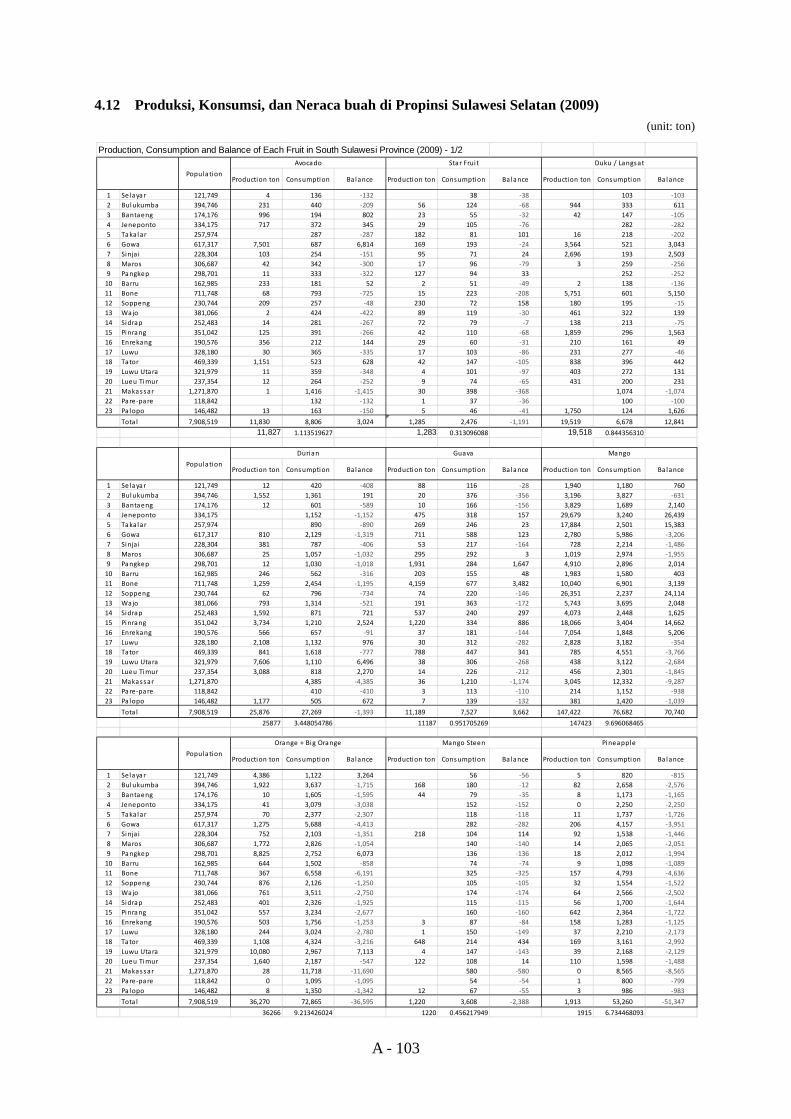
A - 103
4.12 Produksi, Konsumsi, dan Neraca buah di Propinsi Sulawesi Selatan (2009) (unit: ton)
Production, Consumption and Balance of Each Fruit in South Sulawesi Province (2009) - 1/2
Production ton Consumption Balance Production ton Consumption Ba lance Production ton Consumption Ba lance
1 Selayar 121,749 4 136 ‐132 38 ‐38 103 ‐1032 Bulukumba 394,746 231 440 ‐209 56 124 ‐68 944 333 6113 Bantaeng 174,176 996 194 802 23 55 ‐32 42 147 ‐1054 Jeneponto 334,175 717 372 345 29 105 ‐76 282 ‐2825 Takalar 257,974 287 ‐287 182 81 101 16 218 ‐2026 Gowa 617,317 7,501 687 6,814 169 193 ‐24 3,564 521 3,0437 Sinja i 228,304 103 254 ‐151 95 71 24 2,696 193 2,5038 Maros 306,687 42 342 ‐300 17 96 ‐79 3 259 ‐2569 Pangkep 298,701 11 333 ‐322 127 94 33 252 ‐25210 Barru 162,985 233 181 52 2 51 ‐49 2 138 ‐13611 Bone 711,748 68 793 ‐725 15 223 ‐208 5,751 601 5,15012 Soppeng 230,744 209 257 ‐48 230 72 158 180 195 ‐1513 Wajo 381,066 2 424 ‐422 89 119 ‐30 461 322 13914 Sidrap 252,483 14 281 ‐267 72 79 ‐7 138 213 ‐7515 Pinrang 351,042 125 391 ‐266 42 110 ‐68 1,859 296 1,56316 Enrekang 190,576 356 212 144 29 60 ‐31 210 161 4917 Luwu 328,180 30 365 ‐335 17 103 ‐86 231 277 ‐4618 Tator 469,339 1,151 523 628 42 147 ‐105 838 396 44219 Luwu Utara 321,979 11 359 ‐348 4 101 ‐97 403 272 13120 Lueu Timur 237,354 12 264 ‐252 9 74 ‐65 431 200 23121 Makassar 1,271,870 1 1,416 ‐1,415 30 398 ‐368 1,074 ‐1,07422 Pare‐pare 118,842 132 ‐132 1 37 ‐36 100 ‐10023 Pa lopo 146,482 13 163 ‐150 5 46 ‐41 1,750 124 1,626
Tota l 7,908,519 11,830 8,806 3,024 1,285 2,476 ‐1,191 19,519 6,678 12,841
11,827 1.113519627 1,283 0.313096088 19,518 0.844356310
Production ton Consumption Balance Production ton Consumption Ba lance Production ton Consumption Ba lance
1 Selayar 121,749 12 420 ‐408 88 116 ‐28 1,940 1,180 7602 Bulukumba 394,746 1,552 1,361 191 20 376 ‐356 3,196 3,827 ‐6313 Bantaeng 174,176 12 601 ‐589 10 166 ‐156 3,829 1,689 2,1404 Jeneponto 334,175 1,152 ‐1,152 475 318 157 29,679 3,240 26,4395 Takalar 257,974 890 ‐890 269 246 23 17,884 2,501 15,3836 Gowa 617,317 810 2,129 ‐1,319 711 588 123 2,780 5,986 ‐3,2067 Sinja i 228,304 381 787 ‐406 53 217 ‐164 728 2,214 ‐1,4868 Maros 306,687 25 1,057 ‐1,032 295 292 3 1,019 2,974 ‐1,9559 Pangkep 298,701 12 1,030 ‐1,018 1,931 284 1,647 4,910 2,896 2,01410 Barru 162,985 246 562 ‐316 203 155 48 1,983 1,580 40311 Bone 711,748 1,259 2,454 ‐1,195 4,159 677 3,482 10,040 6,901 3,13912 Soppeng 230,744 62 796 ‐734 74 220 ‐146 26,351 2,237 24,11413 Wajo 381,066 793 1,314 ‐521 191 363 ‐172 5,743 3,695 2,04814 Sidrap 252,483 1,592 871 721 537 240 297 4,073 2,448 1,62515 Pinrang 351,042 3,734 1,210 2,524 1,220 334 886 18,066 3,404 14,66216 Enrekang 190,576 566 657 ‐91 37 181 ‐144 7,054 1,848 5,20617 Luwu 328,180 2,108 1,132 976 30 312 ‐282 2,828 3,182 ‐35418 Tator 469,339 841 1,618 ‐777 788 447 341 785 4,551 ‐3,76619 Luwu Utara 321,979 7,606 1,110 6,496 38 306 ‐268 438 3,122 ‐2,68420 Lueu Timur 237,354 3,088 818 2,270 14 226 ‐212 456 2,301 ‐1,84521 Makassar 1,271,870 4,385 ‐4,385 36 1,210 ‐1,174 3,045 12,332 ‐9,28722 Pare‐pare 118,842 410 ‐410 3 113 ‐110 214 1,152 ‐93823 Pa lopo 146,482 1,177 505 672 7 139 ‐132 381 1,420 ‐1,039
Tota l 7,908,519 25,876 27,269 ‐1,393 11,189 7,527 3,662 147,422 76,682 70,740
25877 3.448054786 11187 0.951705269 147423 9.696068465
Production ton Consumption Balance Production ton Consumption Ba lance Production ton Consumption Ba lance
1 Selayar 121,749 4,386 1,122 3,264 56 ‐56 5 820 ‐8152 Bulukumba 394,746 1,922 3,637 ‐1,715 168 180 ‐12 82 2,658 ‐2,5763 Bantaeng 174,176 10 1,605 ‐1,595 44 79 ‐35 8 1,173 ‐1,1654 Jeneponto 334,175 41 3,079 ‐3,038 152 ‐152 0 2,250 ‐2,2505 Takalar 257,974 70 2,377 ‐2,307 118 ‐118 11 1,737 ‐1,7266 Gowa 617,317 1,275 5,688 ‐4,413 282 ‐282 206 4,157 ‐3,9517 Sinja i 228,304 752 2,103 ‐1,351 218 104 114 92 1,538 ‐1,4468 Maros 306,687 1,772 2,826 ‐1,054 140 ‐140 14 2,065 ‐2,0519 Pangkep 298,701 8,825 2,752 6,073 136 ‐136 18 2,012 ‐1,99410 Barru 162,985 644 1,502 ‐858 74 ‐74 9 1,098 ‐1,08911 Bone 711,748 367 6,558 ‐6,191 325 ‐325 157 4,793 ‐4,63612 Soppeng 230,744 876 2,126 ‐1,250 105 ‐105 32 1,554 ‐1,52213 Wajo 381,066 761 3,511 ‐2,750 174 ‐174 64 2,566 ‐2,50214 Sidrap 252,483 401 2,326 ‐1,925 115 ‐115 56 1,700 ‐1,64415 Pinrang 351,042 557 3,234 ‐2,677 160 ‐160 642 2,364 ‐1,72216 Enrekang 190,576 503 1,756 ‐1,253 3 87 ‐84 158 1,283 ‐1,12517 Luwu 328,180 244 3,024 ‐2,780 1 150 ‐149 37 2,210 ‐2,17318 Tator 469,339 1,108 4,324 ‐3,216 648 214 434 169 3,161 ‐2,99219 Luwu Utara 321,979 10,080 2,967 7,113 4 147 ‐143 39 2,168 ‐2,12920 Lueu Timur 237,354 1,640 2,187 ‐547 122 108 14 110 1,598 ‐1,48821 Makassar 1,271,870 28 11,718 ‐11,690 580 ‐580 0 8,565 ‐8,56522 Pare‐pare 118,842 0 1,095 ‐1,095 54 ‐54 1 800 ‐79923 Pa lopo 146,482 8 1,350 ‐1,342 12 67 ‐55 3 986 ‐983
Tota l 7,908,519 36,270 72,865 ‐36,595 1,220 3,608 ‐2,388 1,913 53,260 ‐51,347
36266 9.213426024 1220 0.456217949 1915 6.734468093
Population
Orange + Big Orange Mango Steen Pineapple
Population
Avocado Star Frui t Duku / Langsat
Population
Durian Guava Mango
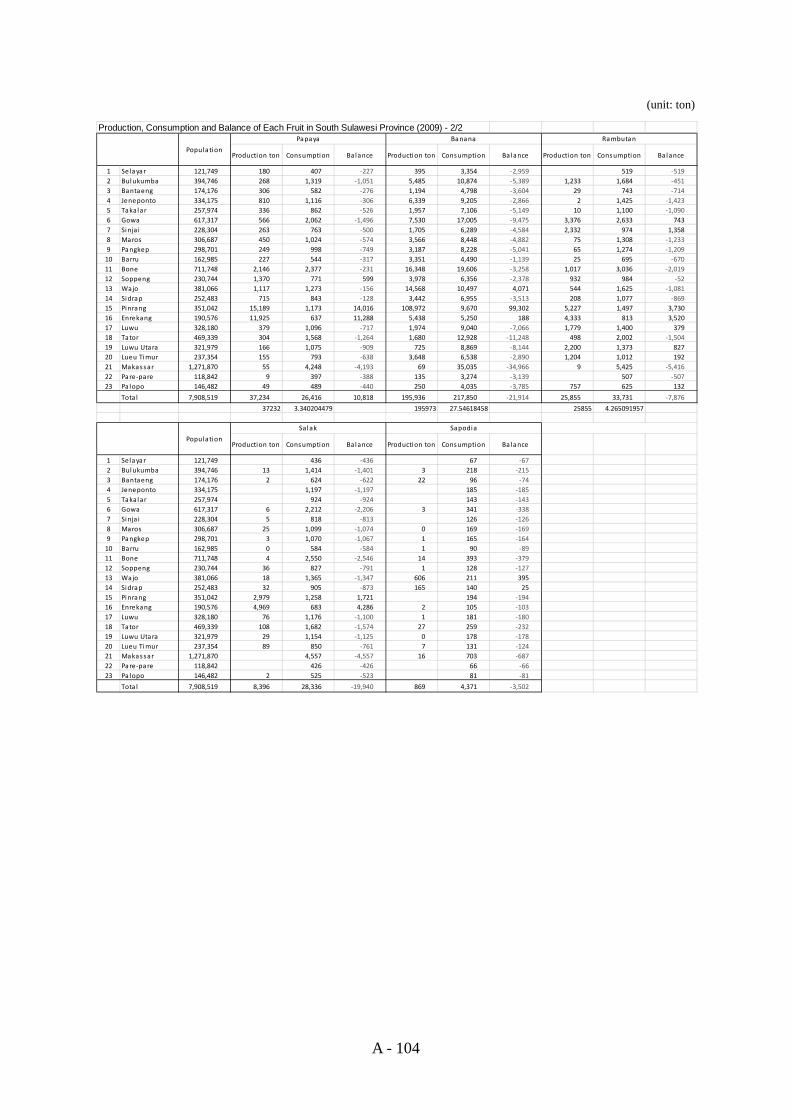
A - 104
(unit: ton) Production, Consumption and Balance of Each Fruit in South Sulawesi Province (2009) - 2/2
Production ton Consumption Balance Production ton Consumption Ba lance Production ton Consumption Ba lance
1 Selayar 121,749 180 407 ‐227 395 3,354 ‐2,959 519 ‐5192 Bulukumba 394,746 268 1,319 ‐1,051 5,485 10,874 ‐5,389 1,233 1,684 ‐4513 Bantaeng 174,176 306 582 ‐276 1,194 4,798 ‐3,604 29 743 ‐7144 Jeneponto 334,175 810 1,116 ‐306 6,339 9,205 ‐2,866 2 1,425 ‐1,4235 Takalar 257,974 336 862 ‐526 1,957 7,106 ‐5,149 10 1,100 ‐1,0906 Gowa 617,317 566 2,062 ‐1,496 7,530 17,005 ‐9,475 3,376 2,633 7437 Sinja i 228,304 263 763 ‐500 1,705 6,289 ‐4,584 2,332 974 1,3588 Maros 306,687 450 1,024 ‐574 3,566 8,448 ‐4,882 75 1,308 ‐1,2339 Pangkep 298,701 249 998 ‐749 3,187 8,228 ‐5,041 65 1,274 ‐1,20910 Barru 162,985 227 544 ‐317 3,351 4,490 ‐1,139 25 695 ‐67011 Bone 711,748 2,146 2,377 ‐231 16,348 19,606 ‐3,258 1,017 3,036 ‐2,01912 Soppeng 230,744 1,370 771 599 3,978 6,356 ‐2,378 932 984 ‐5213 Wajo 381,066 1,117 1,273 ‐156 14,568 10,497 4,071 544 1,625 ‐1,08114 Sidrap 252,483 715 843 ‐128 3,442 6,955 ‐3,513 208 1,077 ‐86915 Pinrang 351,042 15,189 1,173 14,016 108,972 9,670 99,302 5,227 1,497 3,73016 Enrekang 190,576 11,925 637 11,288 5,438 5,250 188 4,333 813 3,52017 Luwu 328,180 379 1,096 ‐717 1,974 9,040 ‐7,066 1,779 1,400 37918 Tator 469,339 304 1,568 ‐1,264 1,680 12,928 ‐11,248 498 2,002 ‐1,50419 Luwu Utara 321,979 166 1,075 ‐909 725 8,869 ‐8,144 2,200 1,373 82720 Lueu Timur 237,354 155 793 ‐638 3,648 6,538 ‐2,890 1,204 1,012 19221 Makassar 1,271,870 55 4,248 ‐4,193 69 35,035 ‐34,966 9 5,425 ‐5,41622 Pare‐pare 118,842 9 397 ‐388 135 3,274 ‐3,139 507 ‐50723 Pa lopo 146,482 49 489 ‐440 250 4,035 ‐3,785 757 625 132
Tota l 7,908,519 37,234 26,416 10,818 195,936 217,850 ‐21,914 25,855 33,731 ‐7,876
37232 3.340204479 195973 27.54618458 25855 4.265091957
Production ton Consumption Balance Production ton Consumption Ba lance
1 Selayar 121,749 436 ‐436 67 ‐672 Bulukumba 394,746 13 1,414 ‐1,401 3 218 ‐2153 Bantaeng 174,176 2 624 ‐622 22 96 ‐744 Jeneponto 334,175 1,197 ‐1,197 185 ‐1855 Takalar 257,974 924 ‐924 143 ‐1436 Gowa 617,317 6 2,212 ‐2,206 3 341 ‐3387 Sinja i 228,304 5 818 ‐813 126 ‐1268 Maros 306,687 25 1,099 ‐1,074 0 169 ‐1699 Pangkep 298,701 3 1,070 ‐1,067 1 165 ‐16410 Barru 162,985 0 584 ‐584 1 90 ‐8911 Bone 711,748 4 2,550 ‐2,546 14 393 ‐37912 Soppeng 230,744 36 827 ‐791 1 128 ‐12713 Wajo 381,066 18 1,365 ‐1,347 606 211 39514 Sidrap 252,483 32 905 ‐873 165 140 2515 Pinrang 351,042 2,979 1,258 1,721 194 ‐19416 Enrekang 190,576 4,969 683 4,286 2 105 ‐10317 Luwu 328,180 76 1,176 ‐1,100 1 181 ‐18018 Tator 469,339 108 1,682 ‐1,574 27 259 ‐23219 Luwu Utara 321,979 29 1,154 ‐1,125 0 178 ‐17820 Lueu Timur 237,354 89 850 ‐761 7 131 ‐12421 Makassar 1,271,870 4,557 ‐4,557 16 703 ‐68722 Pare‐pare 118,842 426 ‐426 66 ‐6623 Pa lopo 146,482 2 525 ‐523 81 ‐81
Tota l 7,908,519 8,396 28,336 ‐19,940 869 4,371 ‐3,502
Population
Salak Sapodia
Population
Papaya Banana Rambutan
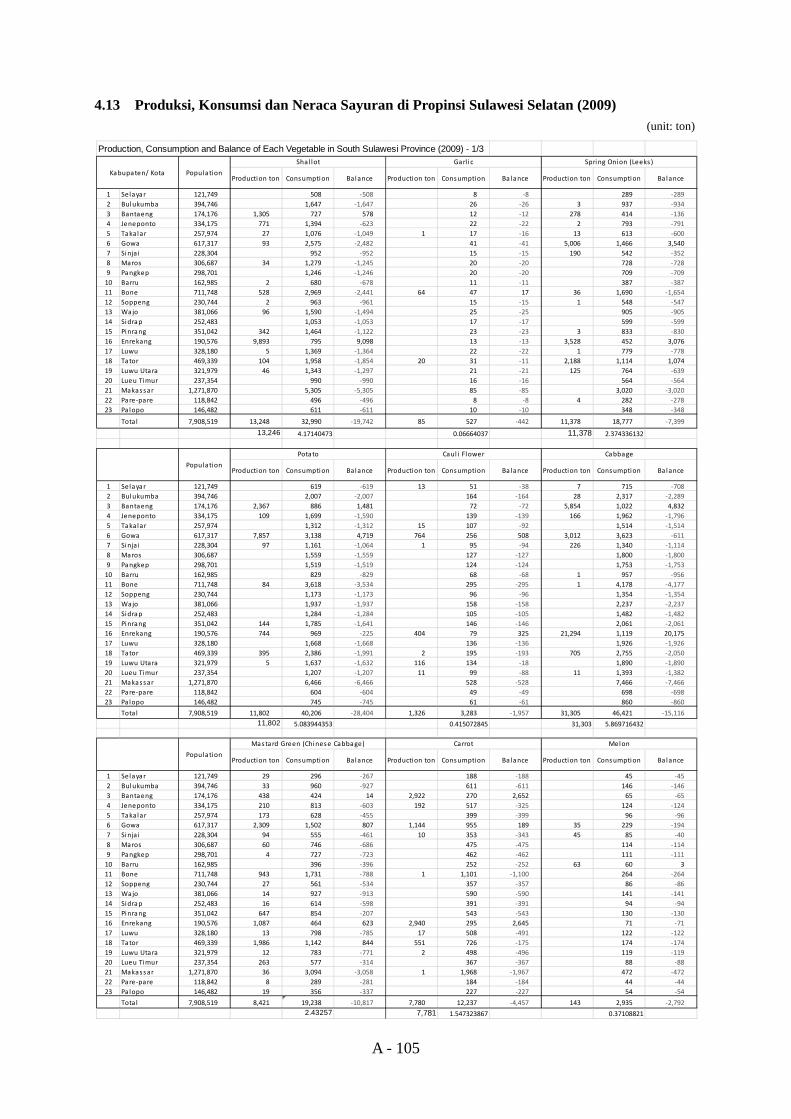
A - 105
4.13 Produksi, Konsumsi dan Neraca Sayuran di Propinsi Sulawesi Selatan (2009) (unit: ton)
Production, Consumption and Balance of Each Vegetable in South Sulawesi Province (2009) - 1/3
Production ton Consumption Balance Production ton Consumption Ba lance Production ton Consumption Ba lance
1 Selayar 121,749 508 ‐508 8 ‐8 289 ‐2892 Bulukumba 394,746 1,647 ‐1,647 26 ‐26 3 937 ‐9343 Bantaeng 174,176 1,305 727 578 12 ‐12 278 414 ‐1364 Jeneponto 334,175 771 1,394 ‐623 22 ‐22 2 793 ‐7915 Takalar 257,974 27 1,076 ‐1,049 1 17 ‐16 13 613 ‐6006 Gowa 617,317 93 2,575 ‐2,482 41 ‐41 5,006 1,466 3,5407 Sinja i 228,304 952 ‐952 15 ‐15 190 542 ‐3528 Maros 306,687 34 1,279 ‐1,245 20 ‐20 728 ‐7289 Pangkep 298,701 1,246 ‐1,246 20 ‐20 709 ‐70910 Barru 162,985 2 680 ‐678 11 ‐11 387 ‐38711 Bone 711,748 528 2,969 ‐2,441 64 47 17 36 1,690 ‐1,65412 Soppeng 230,744 2 963 ‐961 15 ‐15 1 548 ‐54713 Wajo 381,066 96 1,590 ‐1,494 25 ‐25 905 ‐90514 Sidrap 252,483 1,053 ‐1,053 17 ‐17 599 ‐59915 Pinrang 351,042 342 1,464 ‐1,122 23 ‐23 3 833 ‐83016 Enrekang 190,576 9,893 795 9,098 13 ‐13 3,528 452 3,07617 Luwu 328,180 5 1,369 ‐1,364 22 ‐22 1 779 ‐77818 Tator 469,339 104 1,958 ‐1,854 20 31 ‐11 2,188 1,114 1,07419 Luwu Utara 321,979 46 1,343 ‐1,297 21 ‐21 125 764 ‐63920 Lueu Timur 237,354 990 ‐990 16 ‐16 564 ‐56421 Makassar 1,271,870 5,305 ‐5,305 85 ‐85 3,020 ‐3,02022 Pare‐pare 118,842 496 ‐496 8 ‐8 4 282 ‐27823 Pa lopo 146,482 611 ‐611 10 ‐10 348 ‐348
Tota l 7,908,519 13,248 32,990 ‐19,742 85 527 ‐442 11,378 18,777 ‐7,399
13,246 4.17140473 0.06664037 11,378 2.374336132
Production ton Consumption Balance Production ton Consumption Ba lance Production ton Consumption Ba lance
1 Selayar 121,749 619 ‐619 13 51 ‐38 7 715 ‐7082 Bulukumba 394,746 2,007 ‐2,007 164 ‐164 28 2,317 ‐2,2893 Bantaeng 174,176 2,367 886 1,481 72 ‐72 5,854 1,022 4,8324 Jeneponto 334,175 109 1,699 ‐1,590 139 ‐139 166 1,962 ‐1,7965 Takalar 257,974 1,312 ‐1,312 15 107 ‐92 1,514 ‐1,5146 Gowa 617,317 7,857 3,138 4,719 764 256 508 3,012 3,623 ‐6117 Sinja i 228,304 97 1,161 ‐1,064 1 95 ‐94 226 1,340 ‐1,1148 Maros 306,687 1,559 ‐1,559 127 ‐127 1,800 ‐1,8009 Pangkep 298,701 1,519 ‐1,519 124 ‐124 1,753 ‐1,75310 Barru 162,985 829 ‐829 68 ‐68 1 957 ‐95611 Bone 711,748 84 3,618 ‐3,534 295 ‐295 1 4,178 ‐4,17712 Soppeng 230,744 1,173 ‐1,173 96 ‐96 1,354 ‐1,35413 Wajo 381,066 1,937 ‐1,937 158 ‐158 2,237 ‐2,23714 Sidrap 252,483 1,284 ‐1,284 105 ‐105 1,482 ‐1,48215 Pinrang 351,042 144 1,785 ‐1,641 146 ‐146 2,061 ‐2,06116 Enrekang 190,576 744 969 ‐225 404 79 325 21,294 1,119 20,17517 Luwu 328,180 1,668 ‐1,668 136 ‐136 1,926 ‐1,92618 Tator 469,339 395 2,386 ‐1,991 2 195 ‐193 705 2,755 ‐2,05019 Luwu Utara 321,979 5 1,637 ‐1,632 116 134 ‐18 1,890 ‐1,89020 Lueu Timur 237,354 1,207 ‐1,207 11 99 ‐88 11 1,393 ‐1,38221 Makassar 1,271,870 6,466 ‐6,466 528 ‐528 7,466 ‐7,46622 Pare‐pare 118,842 604 ‐604 49 ‐49 698 ‐69823 Pa lopo 146,482 745 ‐745 61 ‐61 860 ‐860
Tota l 7,908,519 11,802 40,206 ‐28,404 1,326 3,283 ‐1,957 31,305 46,421 ‐15,11611,802 5.083944353 0.415072845 31,303 5.869716432
Production ton Consumption Balance Production ton Consumption Ba lance Production ton Consumption Ba lance
1 Selayar 121,749 29 296 ‐267 188 ‐188 45 ‐452 Bulukumba 394,746 33 960 ‐927 611 ‐611 146 ‐1463 Bantaeng 174,176 438 424 14 2,922 270 2,652 65 ‐654 Jeneponto 334,175 210 813 ‐603 192 517 ‐325 124 ‐1245 Takalar 257,974 173 628 ‐455 399 ‐399 96 ‐966 Gowa 617,317 2,309 1,502 807 1,144 955 189 35 229 ‐1947 Sinja i 228,304 94 555 ‐461 10 353 ‐343 45 85 ‐408 Maros 306,687 60 746 ‐686 475 ‐475 114 ‐1149 Pangkep 298,701 4 727 ‐723 462 ‐462 111 ‐11110 Barru 162,985 396 ‐396 252 ‐252 63 60 311 Bone 711,748 943 1,731 ‐788 1 1,101 ‐1,100 264 ‐26412 Soppeng 230,744 27 561 ‐534 357 ‐357 86 ‐8613 Wajo 381,066 14 927 ‐913 590 ‐590 141 ‐14114 Sidrap 252,483 16 614 ‐598 391 ‐391 94 ‐9415 Pinrang 351,042 647 854 ‐207 543 ‐543 130 ‐13016 Enrekang 190,576 1,087 464 623 2,940 295 2,645 71 ‐7117 Luwu 328,180 13 798 ‐785 17 508 ‐491 122 ‐12218 Tator 469,339 1,986 1,142 844 551 726 ‐175 174 ‐17419 Luwu Utara 321,979 12 783 ‐771 2 498 ‐496 119 ‐11920 Lueu Timur 237,354 263 577 ‐314 367 ‐367 88 ‐8821 Makassar 1,271,870 36 3,094 ‐3,058 1 1,968 ‐1,967 472 ‐47222 Pare‐pare 118,842 8 289 ‐281 184 ‐184 44 ‐4423 Pa lopo 146,482 19 356 ‐337 227 ‐227 54 ‐54
Tota l 7,908,519 8,421 19,238 ‐10,817 7,780 12,237 ‐4,457 143 2,935 ‐2,7922.43257 7,781 1.547323867 0.37108821
Kabupaten/ Kota
Population
Mastard Green (Chinese Cabbage) Carrot Melon
Population
Shal lot Garl ic Spring Onion (Leeks )
Population
Potato Caul i Flower Cabbage
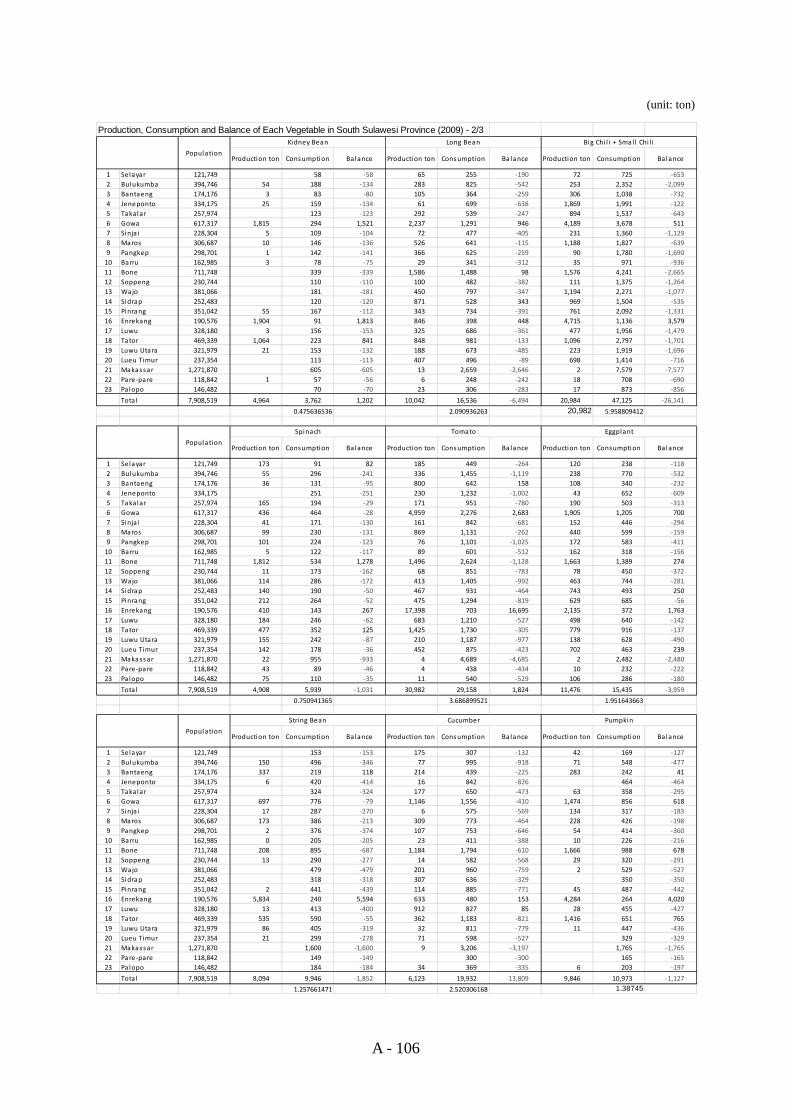
A - 106
(unit: ton)
Production, Consumption and Balance of Each Vegetable in South Sulawesi Province (2009) - 2/3
Production ton Consumption Balance Production ton Consumption Ba lance Production ton Consumption Ba lance
1 Selayar 121,749 58 ‐58 65 255 ‐190 72 725 ‐6532 Bulukumba 394,746 54 188 ‐134 283 825 ‐542 253 2,352 ‐2,0993 Bantaeng 174,176 3 83 ‐80 105 364 ‐259 306 1,038 ‐7324 Jeneponto 334,175 25 159 ‐134 61 699 ‐638 1,869 1,991 ‐1225 Takalar 257,974 123 ‐123 292 539 ‐247 894 1,537 ‐6436 Gowa 617,317 1,815 294 1,521 2,237 1,291 946 4,189 3,678 5117 Sinja i 228,304 5 109 ‐104 72 477 ‐405 231 1,360 ‐1,1298 Maros 306,687 10 146 ‐136 526 641 ‐115 1,188 1,827 ‐6399 Pangkep 298,701 1 142 ‐141 366 625 ‐259 90 1,780 ‐1,69010 Barru 162,985 3 78 ‐75 29 341 ‐312 35 971 ‐93611 Bone 711,748 339 ‐339 1,586 1,488 98 1,576 4,241 ‐2,66512 Soppeng 230,744 110 ‐110 100 482 ‐382 111 1,375 ‐1,26413 Wajo 381,066 181 ‐181 450 797 ‐347 1,194 2,271 ‐1,07714 Sidrap 252,483 120 ‐120 871 528 343 969 1,504 ‐53515 Pinrang 351,042 55 167 ‐112 343 734 ‐391 761 2,092 ‐1,33116 Enrekang 190,576 1,904 91 1,813 846 398 448 4,715 1,136 3,57917 Luwu 328,180 3 156 ‐153 325 686 ‐361 477 1,956 ‐1,47918 Tator 469,339 1,064 223 841 848 981 ‐133 1,096 2,797 ‐1,70119 Luwu Utara 321,979 21 153 ‐132 188 673 ‐485 223 1,919 ‐1,69620 Lueu Timur 237,354 113 ‐113 407 496 ‐89 698 1,414 ‐71621 Makassar 1,271,870 605 ‐605 13 2,659 ‐2,646 2 7,579 ‐7,57722 Pare‐pare 118,842 1 57 ‐56 6 248 ‐242 18 708 ‐69023 Pa lopo 146,482 70 ‐70 23 306 ‐283 17 873 ‐856
Tota l 7,908,519 4,964 3,762 1,202 10,042 16,536 ‐6,494 20,984 47,125 ‐26,141
0.475636536 2.090936263 20,982 5.958809412
Production ton Consumption Balance Production ton Consumption Ba lance Production ton Consumption Ba lance
1 Selayar 121,749 173 91 82 185 449 ‐264 120 238 ‐1182 Bulukumba 394,746 55 296 ‐241 336 1,455 ‐1,119 238 770 ‐5323 Bantaeng 174,176 36 131 ‐95 800 642 158 108 340 ‐2324 Jeneponto 334,175 251 ‐251 230 1,232 ‐1,002 43 652 ‐6095 Takalar 257,974 165 194 ‐29 171 951 ‐780 190 503 ‐3136 Gowa 617,317 436 464 ‐28 4,959 2,276 2,683 1,905 1,205 7007 Sinja i 228,304 41 171 ‐130 161 842 ‐681 152 446 ‐2948 Maros 306,687 99 230 ‐131 869 1,131 ‐262 440 599 ‐1599 Pangkep 298,701 101 224 ‐123 76 1,101 ‐1,025 172 583 ‐41110 Barru 162,985 5 122 ‐117 89 601 ‐512 162 318 ‐15611 Bone 711,748 1,812 534 1,278 1,496 2,624 ‐1,128 1,663 1,389 27412 Soppeng 230,744 11 173 ‐162 68 851 ‐783 78 450 ‐37213 Wajo 381,066 114 286 ‐172 413 1,405 ‐992 463 744 ‐28114 Sidrap 252,483 140 190 ‐50 467 931 ‐464 743 493 25015 Pinrang 351,042 212 264 ‐52 475 1,294 ‐819 629 685 ‐5616 Enrekang 190,576 410 143 267 17,398 703 16,695 2,135 372 1,76317 Luwu 328,180 184 246 ‐62 683 1,210 ‐527 498 640 ‐14218 Tator 469,339 477 352 125 1,425 1,730 ‐305 779 916 ‐13719 Luwu Utara 321,979 155 242 ‐87 210 1,187 ‐977 138 628 ‐49020 Lueu Timur 237,354 142 178 ‐36 452 875 ‐423 702 463 23921 Makassar 1,271,870 22 955 ‐933 4 4,689 ‐4,685 2 2,482 ‐2,48022 Pare‐pare 118,842 43 89 ‐46 4 438 ‐434 10 232 ‐22223 Pa lopo 146,482 75 110 ‐35 11 540 ‐529 106 286 ‐180
Tota l 7,908,519 4,908 5,939 ‐1,031 30,982 29,158 1,824 11,476 15,435 ‐3,959
0.750941365 3.686899521 1.951643663
Production ton Consumption Balance Production ton Consumption Ba lance Production ton Consumption Ba lance
1 Selayar 121,749 153 ‐153 175 307 ‐132 42 169 ‐1272 Bulukumba 394,746 150 496 ‐346 77 995 ‐918 71 548 ‐4773 Bantaeng 174,176 337 219 118 214 439 ‐225 283 242 414 Jeneponto 334,175 6 420 ‐414 16 842 ‐826 464 ‐4645 Takalar 257,974 324 ‐324 177 650 ‐473 63 358 ‐2956 Gowa 617,317 697 776 ‐79 1,146 1,556 ‐410 1,474 856 6187 Sinja i 228,304 17 287 ‐270 6 575 ‐569 134 317 ‐1838 Maros 306,687 173 386 ‐213 309 773 ‐464 228 426 ‐1989 Pangkep 298,701 2 376 ‐374 107 753 ‐646 54 414 ‐36010 Barru 162,985 0 205 ‐205 23 411 ‐388 10 226 ‐21611 Bone 711,748 208 895 ‐687 1,184 1,794 ‐610 1,666 988 67812 Soppeng 230,744 13 290 ‐277 14 582 ‐568 29 320 ‐29113 Wajo 381,066 479 ‐479 201 960 ‐759 2 529 ‐52714 Sidrap 252,483 318 ‐318 307 636 ‐329 350 ‐35015 Pinrang 351,042 2 441 ‐439 114 885 ‐771 45 487 ‐44216 Enrekang 190,576 5,834 240 5,594 633 480 153 4,284 264 4,02017 Luwu 328,180 13 413 ‐400 912 827 85 28 455 ‐42718 Tator 469,339 535 590 ‐55 362 1,183 ‐821 1,416 651 76519 Luwu Utara 321,979 86 405 ‐319 32 811 ‐779 11 447 ‐43620 Lueu Timur 237,354 21 299 ‐278 71 598 ‐527 329 ‐32921 Makassar 1,271,870 1,600 ‐1,600 9 3,206 ‐3,197 1,765 ‐1,76522 Pare‐pare 118,842 149 ‐149 300 ‐300 165 ‐16523 Pa lopo 146,482 184 ‐184 34 369 ‐335 6 203 ‐197
Tota l 7,908,519 8,094 9,946 ‐1,852 6,123 19,932 ‐13,809 9,846 10,973 ‐1,127
1.257661471 2.520306168 1.38745
Population
Spinach Tomato Eggplant
Population
String Bean Cucumber Pumpkin
Population
Kidney Bean Long Bean Big Chi l i + Smal l Chi l i
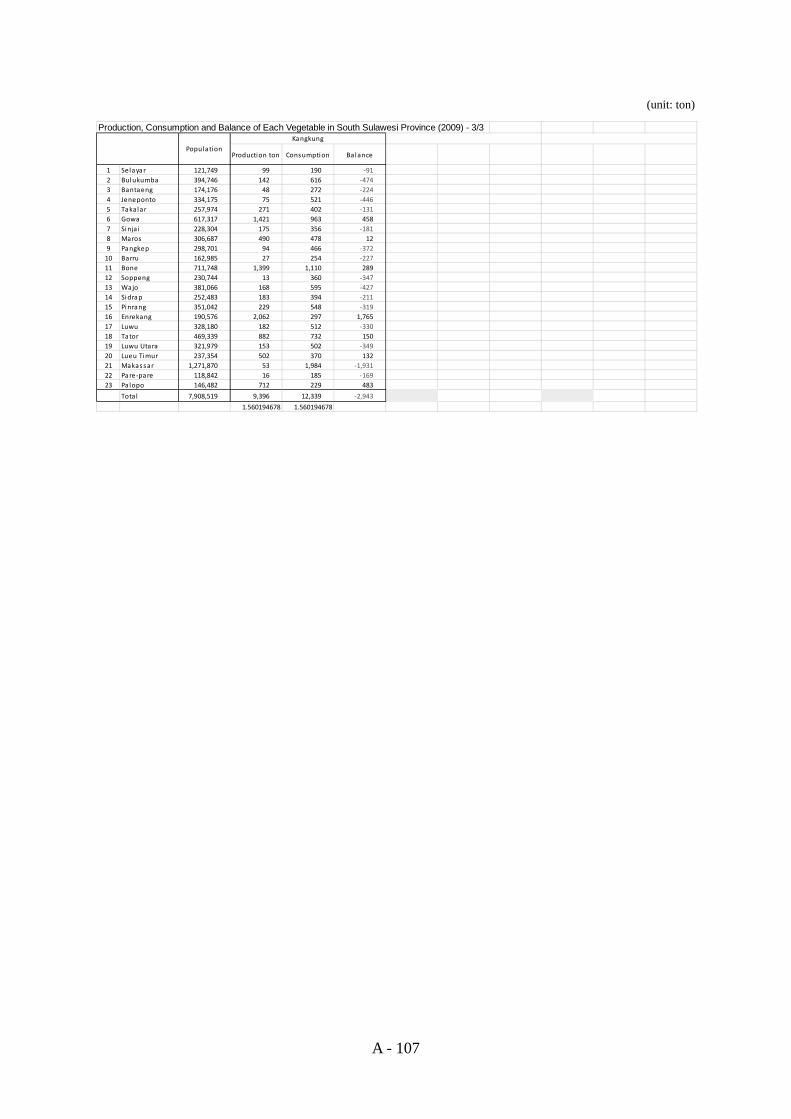
A - 107
(unit: ton) Production, Consumption and Balance of Each Vegetable in South Sulawesi Province (2009) - 3/3
Production ton Consumption Balance
1 Selayar 121,749 99 190 ‐912 Bulukumba 394,746 142 616 ‐4743 Bantaeng 174,176 48 272 ‐2244 Jeneponto 334,175 75 521 ‐4465 Takalar 257,974 271 402 ‐1316 Gowa 617,317 1,421 963 4587 Sinja i 228,304 175 356 ‐1818 Maros 306,687 490 478 129 Pangkep 298,701 94 466 ‐37210 Barru 162,985 27 254 ‐22711 Bone 711,748 1,399 1,110 28912 Soppeng 230,744 13 360 ‐34713 Wajo 381,066 168 595 ‐42714 Sidrap 252,483 183 394 ‐21115 Pinrang 351,042 229 548 ‐31916 Enrekang 190,576 2,062 297 1,76517 Luwu 328,180 182 512 ‐33018 Tator 469,339 882 732 15019 Luwu Utara 321,979 153 502 ‐34920 Lueu Timur 237,354 502 370 13221 Makassar 1,271,870 53 1,984 ‐1,93122 Pare‐pare 118,842 16 185 ‐16923 Pa lopo 146,482 712 229 483
Tota l 7,908,519 9,396 12,339 ‐2,943
1.560194678 1.560194678
PopulationKangkung
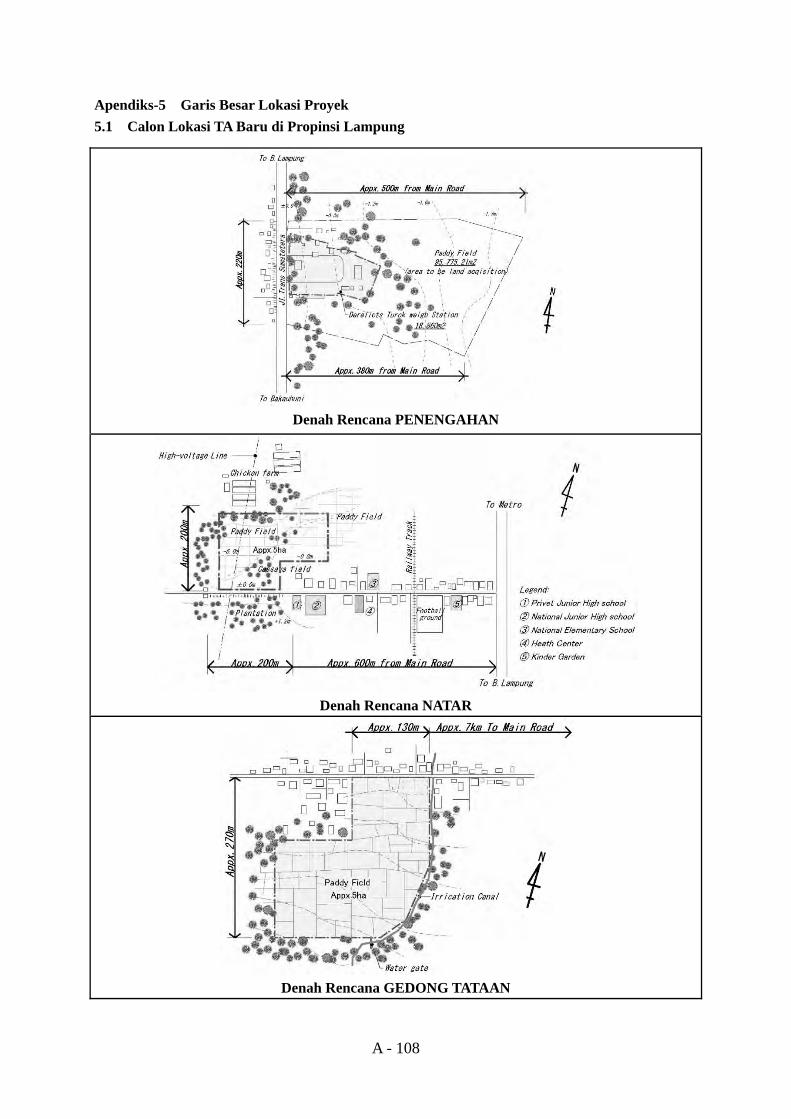
A - 108
Apendiks-5 Garis Besar Lokasi Proyek 5.1 Calon Lokasi TA Baru di Propinsi Lampung
Denah Rencana PENENGAHAN
Denah Rencana NATAR
Denah Rencana GEDONG TATAAN
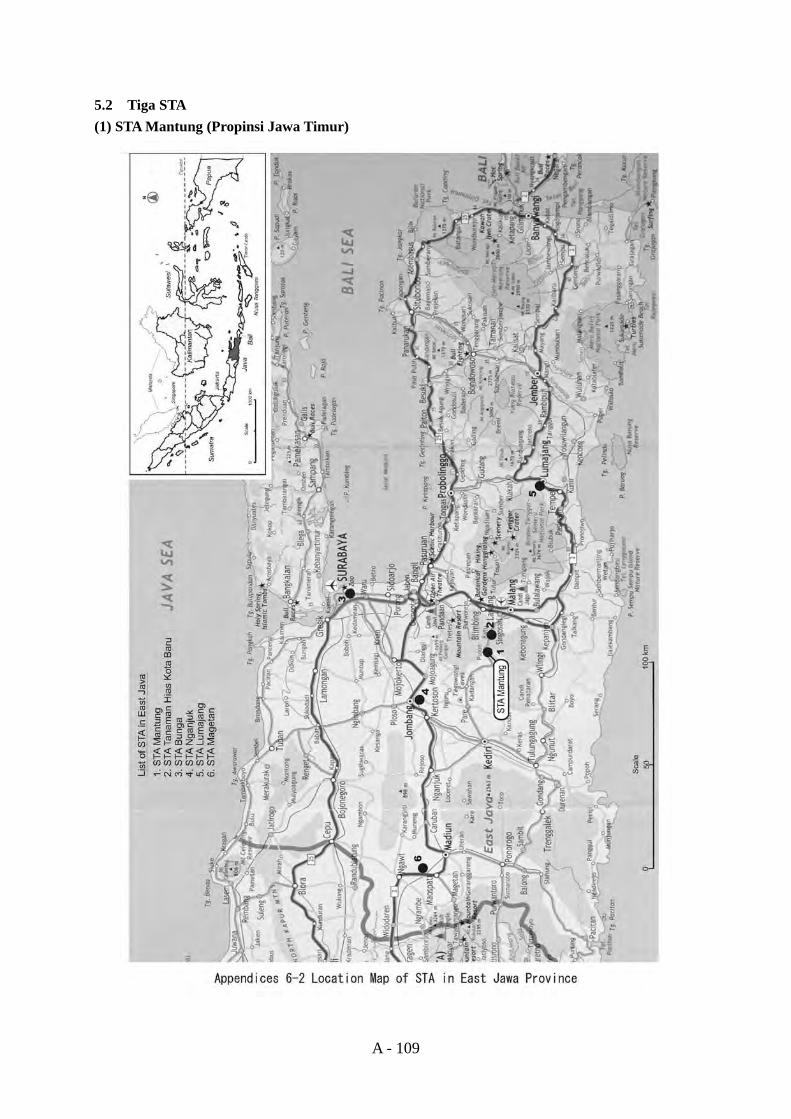
A - 109
5.2 Tiga STA (1) STA Mantung (Propinsi Jawa Timur)
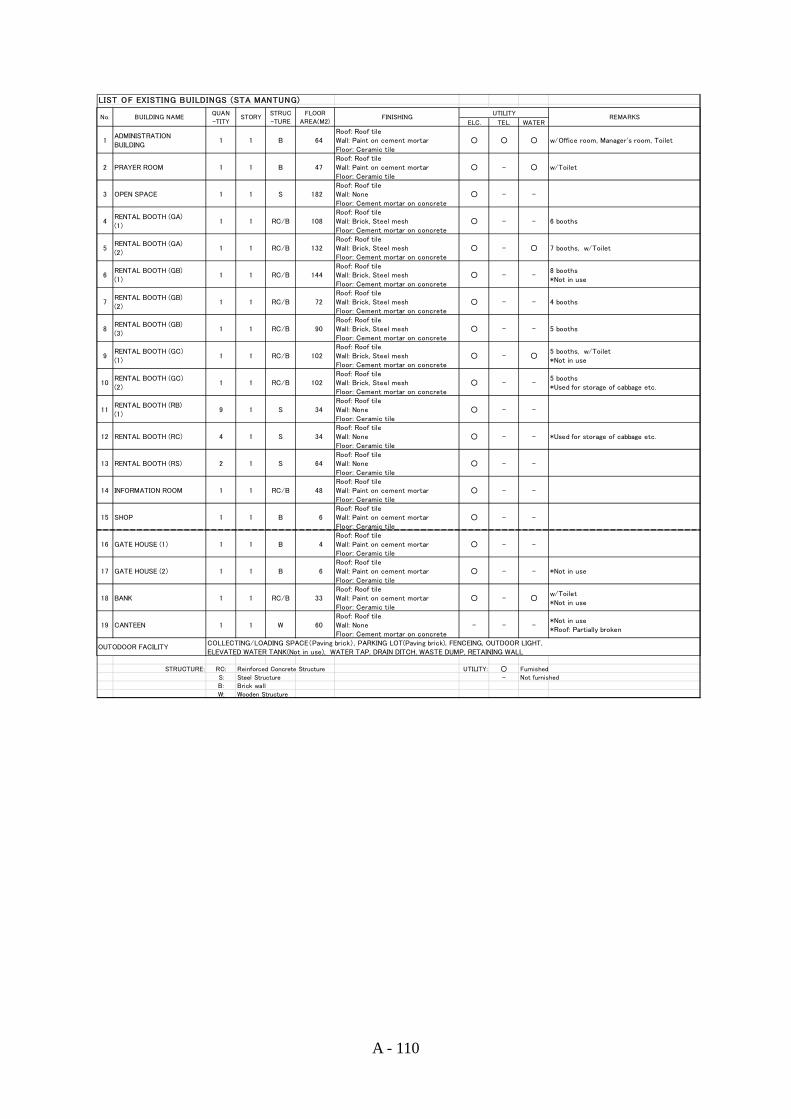
A - 110
LIST OF EXISTING BUILDINGS (STA MANTUNG)
ELC. TEL. WATER
1ADMINISTRATIONBUILDING
1 1 B 64Roof: Roof tileWall: Paint on cement mortarFloor: Ceramic tile
○ ○ ○ w/Office room, Manager's room, Toilet
2 PRAYER ROOM 1 1 B 47Roof: Roof tileWall: Paint on cement mortarFloor: Ceramic tile
○ - ○ w/Toilet
3 OPEN SPACE 1 1 S 182Roof: Roof tileWall: NoneFloor: Cement mortar on concrete
○ - -
4RENTAL BOOTH (GA)(1)
1 1 RC/B 108Roof: Roof tileWall: Brick, Steel meshFloor: Cement mortar on concrete
○ - - 6 booths
5RENTAL BOOTH (GA)(2)
1 1 RC/B 132Roof: Roof tileWall: Brick, Steel meshFloor: Cement mortar on concrete
○ - ○ 7 booths, w/Toilet
6RENTAL BOOTH (GB)(1)
1 1 RC/B 144Roof: Roof tileWall: Brick, Steel meshFloor: Cement mortar on concrete
○ - -8 booths*Not in use
7RENTAL BOOTH (GB)(2)
1 1 RC/B 72Roof: Roof tileWall: Brick, Steel meshFloor: Cement mortar on concrete
○ - - 4 booths
8RENTAL BOOTH (GB)(3)
1 1 RC/B 90Roof: Roof tileWall: Brick, Steel meshFloor: Cement mortar on concrete
○ - - 5 booths
9RENTAL BOOTH (GC)(1)
1 1 RC/B 102Roof: Roof tileWall: Brick, Steel meshFloor: Cement mortar on concrete
○ - ○5 booths, w/Toilet*Not in use
10RENTAL BOOTH (GC)(2)
1 1 RC/B 102Roof: Roof tileWall: Brick, Steel meshFloor: Cement mortar on concrete
○ - -5 booths*Used for storage of cabbage etc.
11RENTAL BOOTH (RB)(1)
9 1 S 34Roof: Roof tileWall: NoneFloor: Ceramic tile
○ - -
12 RENTAL BOOTH (RC) 4 1 S 34Roof: Roof tileWall: NoneFloor: Ceramic tile
○ - - *Used for storage of cabbage etc.
13 RENTAL BOOTH (RS) 2 1 S 64Roof: Roof tileWall: NoneFloor: Ceramic tile
○ - -
14 INFORMATION ROOM 1 1 RC/B 48Roof: Roof tileWall: Paint on cement mortarFloor: Ceramic tile
○ - -
15 SHOP 1 1 B 6Roof: Roof tileWall: Paint on cement mortarFloor: Ceramic tile
○ - -
16 GATE HOUSE (1) 1 1 B 4Roof: Roof tileWall: Paint on cement mortarFloor: Ceramic tile
○ - -
17 GATE HOUSE (2) 1 1 B 6Roof: Roof tileWall: Paint on cement mortarFloor: Ceramic tile
○ - - *Not in use
18 BANK 1 1 RC/B 33Roof: Roof tileWall: Paint on cement mortarFloor: Ceramic tile
○ - ○w/Toilet*Not in use
19 CANTEEN 1 1 W 60Roof: Roof tileWall: NoneFloor: Cement mortar on concrete
- - -*Not in use*Roof: Partially broken
STRUCTURE: RC: Reinforced Concrete Structure UTILITY: ○ Furnished
S: Steel Structure - Not furnished
B: Brick wall
W: Wooden Structure
OUTODOOR FACILITY
FLOOR
AREA(M2)
COLLECTING/LOADING SPACE(Paving brick), PARKING LOT(Paving brick), FENCEING, OUTDOOR LIGHT,ELEVATED WATER TANK(Not in use), WATER TAP, DRAIN DITCH, WASTE DUMP, RETAINING WALL
UTILITYNo. BUILDING NAME
QUAN
-TITYSTORY
STRUC
-TUREFINISHING REMARKS
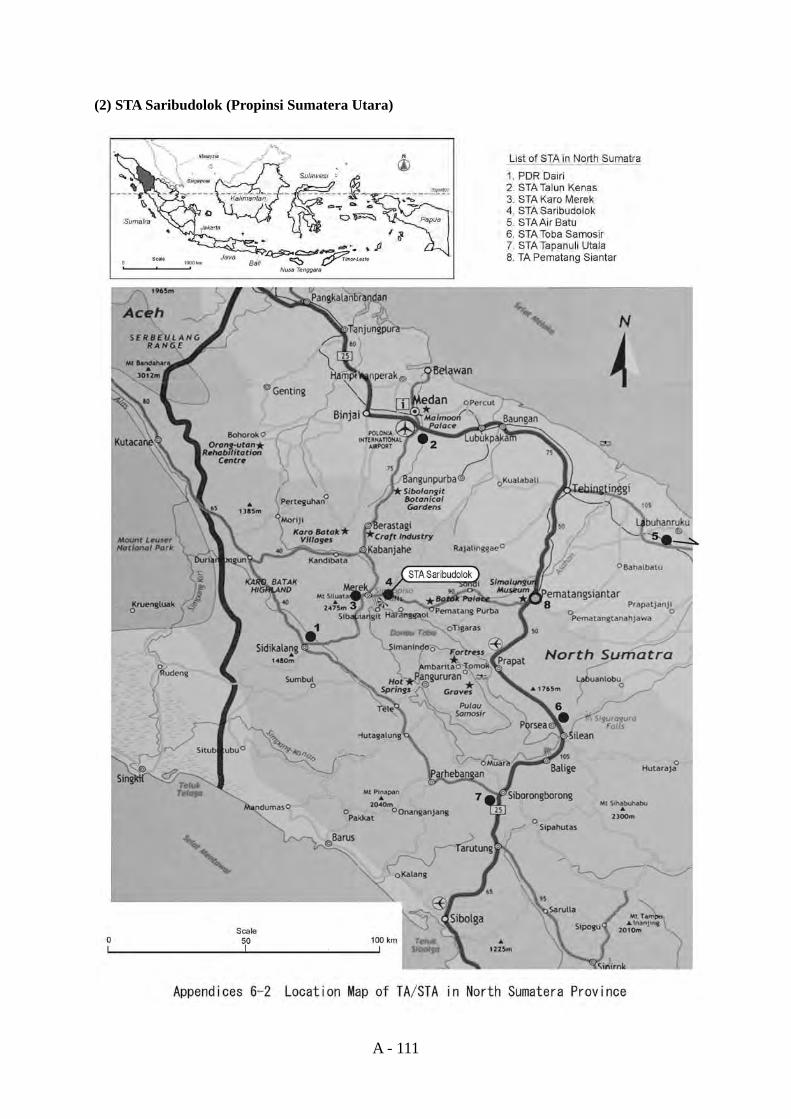
A - 111
(2) STA Saribudolok (Propinsi Sumatera Utara)
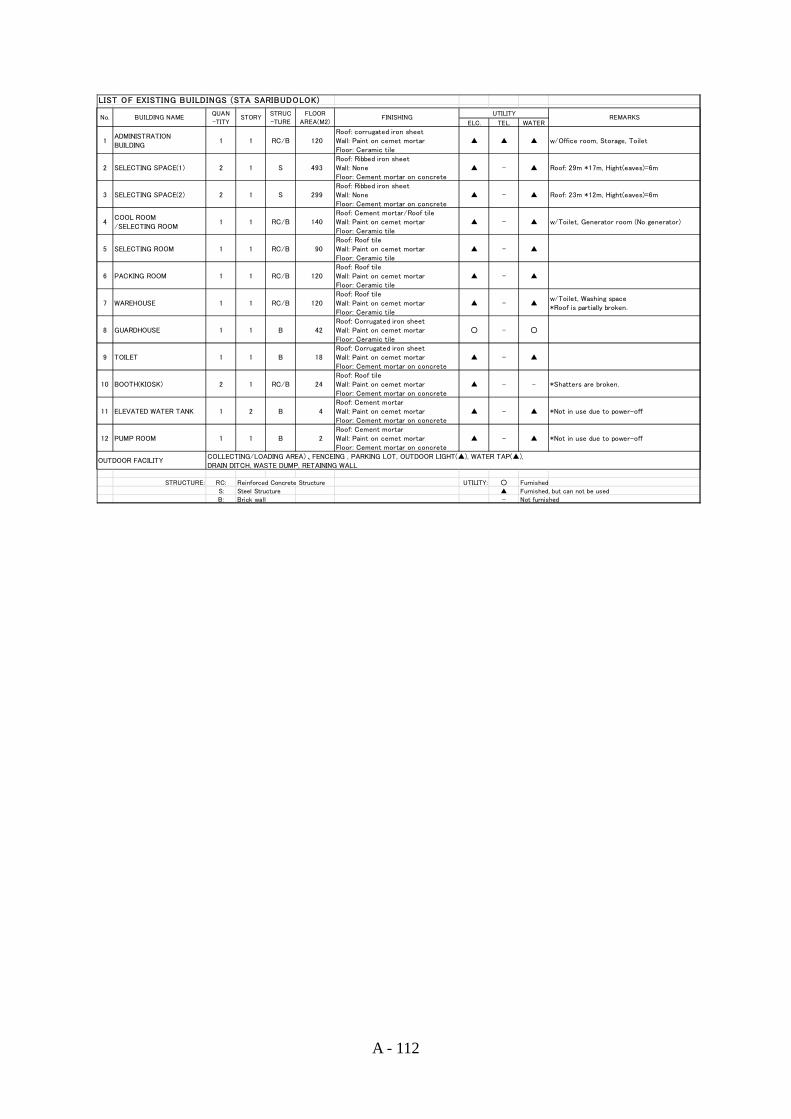
A - 112
LIST OF EXISTING BUILDINGS (STA SARIBUDOLOK)
ELC. TEL. WATER
1ADMINISTRATIONBUILDING
1 1 RC/B 120Roof: corrugated iron sheetWall: Paint on cemet mortarFloor: Ceramic tile
▲ ▲ ▲ w/Office room, Storage, Toilet
2 SELECTING SPACE(1) 2 1 S 493Roof: Ribbed iron sheetWall: NoneFloor: Cement mortar on concrete
▲ - ▲ Roof: 29m *17m, Hight(eaves)=6m
3 SELECTING SPACE(2) 2 1 S 299Roof: Ribbed iron sheetWall: NoneFloor: Cement mortar on concrete
▲ - ▲ Roof: 23m *12m, Hight(eaves)=6m
4COOL ROOM/SELECTING ROOM
1 1 RC/B 140Roof: Cement mortar/Roof tileWall: Paint on cemet mortarFloor: Ceramic tile
▲ - ▲ w/Toilet, Generator room (No generator)
5 SELECTING ROOM 1 1 RC/B 90Roof: Roof tileWall: Paint on cemet mortarFloor: Ceramic tile
▲ - ▲
6 PACKING ROOM 1 1 RC/B 120Roof: Roof tileWall: Paint on cemet mortarFloor: Ceramic tile
▲ - ▲
7 WAREHOUSE 1 1 RC/B 120Roof: Roof tileWall: Paint on cemet mortarFloor: Ceramic tile
▲ - ▲w/Toilet, Washing space*Roof is partially broken.
8 GUARDHOUSE 1 1 B 42Roof: Corrugated iron sheetWall: Paint on cemet mortarFloor: Ceramic tile
○ - ○
9 TOILET 1 1 B 18Roof: Corrugated iron sheetWall: Paint on cemet mortarFloor: Cement mortar on concrete
▲ - ▲
10 BOOTH(KIOSK) 2 1 RC/B 24Roof: Roof tileWall: Paint on cemet mortarFloor: Cement mortar on concrete
▲ - - *Shatters are broken.
11 ELEVATED WATER TANK 1 2 B 4Roof: Cement mortarWall: Paint on cemet mortarFloor: Cement mortar on concrete
▲ - ▲ *Not in use due to power-off
12 PUMP ROOM 1 1 B 2Roof: Cement mortarWall: Paint on cemet mortarFloor: Cement mortar on concrete
▲ - ▲ *Not in use due to power-off
STRUCTURE: RC: Reinforced Concrete Structure UTILITY: ○ Furnished
S: Steel Structure ▲ Furnished, but can not be used
B: Brick wall - Not furnished
STRUC
-TURE
FLOOR
AREA(M2)FINISHING
UTILITYREMARKS
OUTDOOR FACILITYCOLLECTING/LOADING AREA)、FENCEING , PARKING LOT, OUTDOOR LIGHT(▲), WATER TAP(▲),DRAIN DITCH, WASTE DUMP, RETAINING WALL
No. BUILDING NAMEQUAN
-TITYSTORY
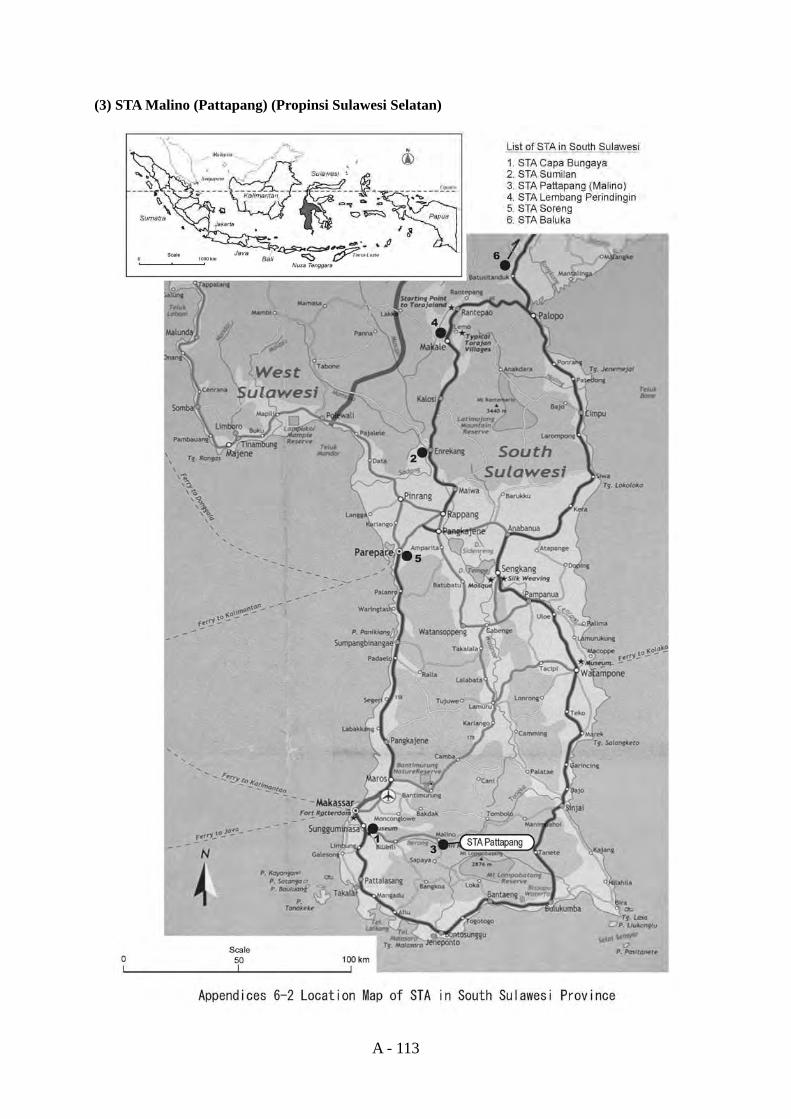
A - 113
(3) STA Malino (Pattapang) (Propinsi Sulawesi Selatan)
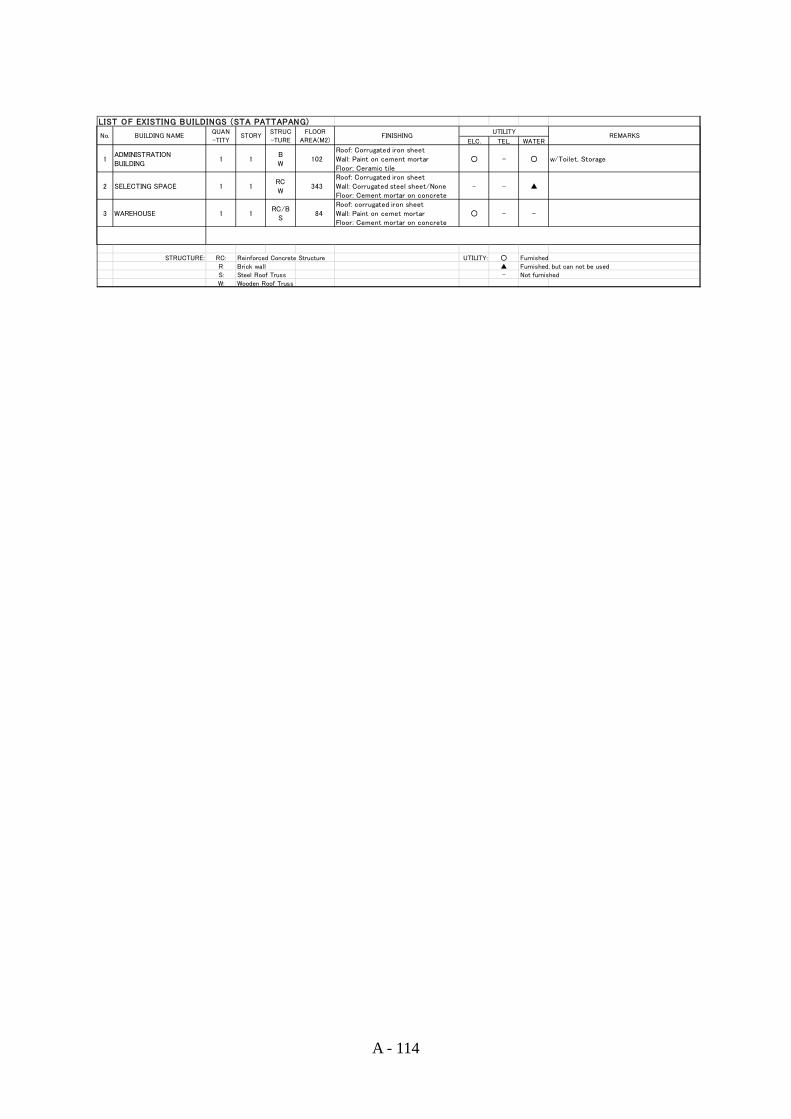
A - 114
LIST OF EXISTING BUILDINGS (STA PATTAPANG)
ELC. TEL. WATER
1ADMINISTRATIONBUILDING
1 1BW
102Roof: Corrugated iron sheetWall: Paint on cement mortarFloor: Ceramic tile
○ - ○ w/Toilet, Storage
2 SELECTING SPACE 1 1RCW
343Roof: Corrugated iron sheetWall: Corrugated steel sheet/NoneFloor: Cement mortar on concrete
- - ▲
3 WAREHOUSE 1 1RC/B
S84
Roof: corrugated iron sheetWall: Paint on cemet mortarFloor: Cement mortar on concrete
○ - -
STRUCTURE: RC: Reinforced Concrete Structure UTILITY: ○ Furnished
R Brick wall ▲ Furnished, but can not be usedS: Steel Roof Truss - Not furnished
W: Wooden Roof Truss
REMARKSNo. BUILDING NAMEQUAN
-TITYSTORY
STRUC
-TURE
FLOOR
AREA(M2)FINISHING
UTILITY
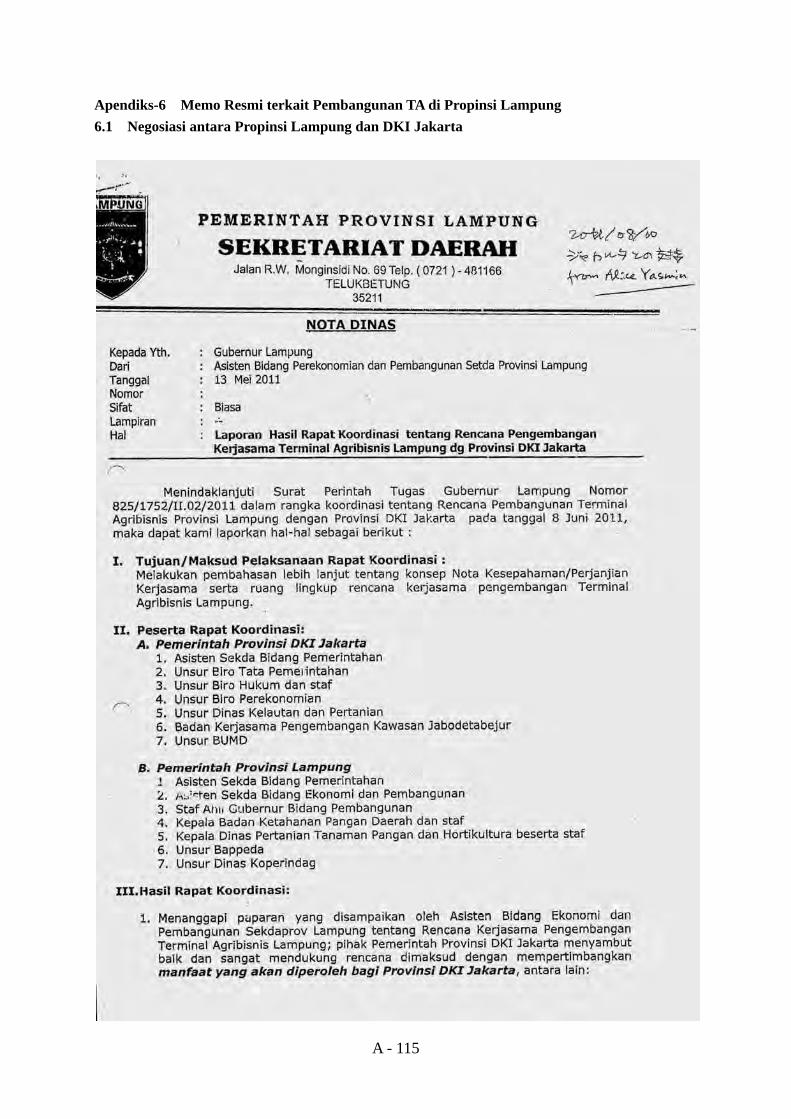
A - 115
Apendiks-6 Memo Resmi terkait Pembangunan TA di Propinsi Lampung 6.1 Negosiasi antara Propinsi Lampung dan DKI Jakarta
A - 116
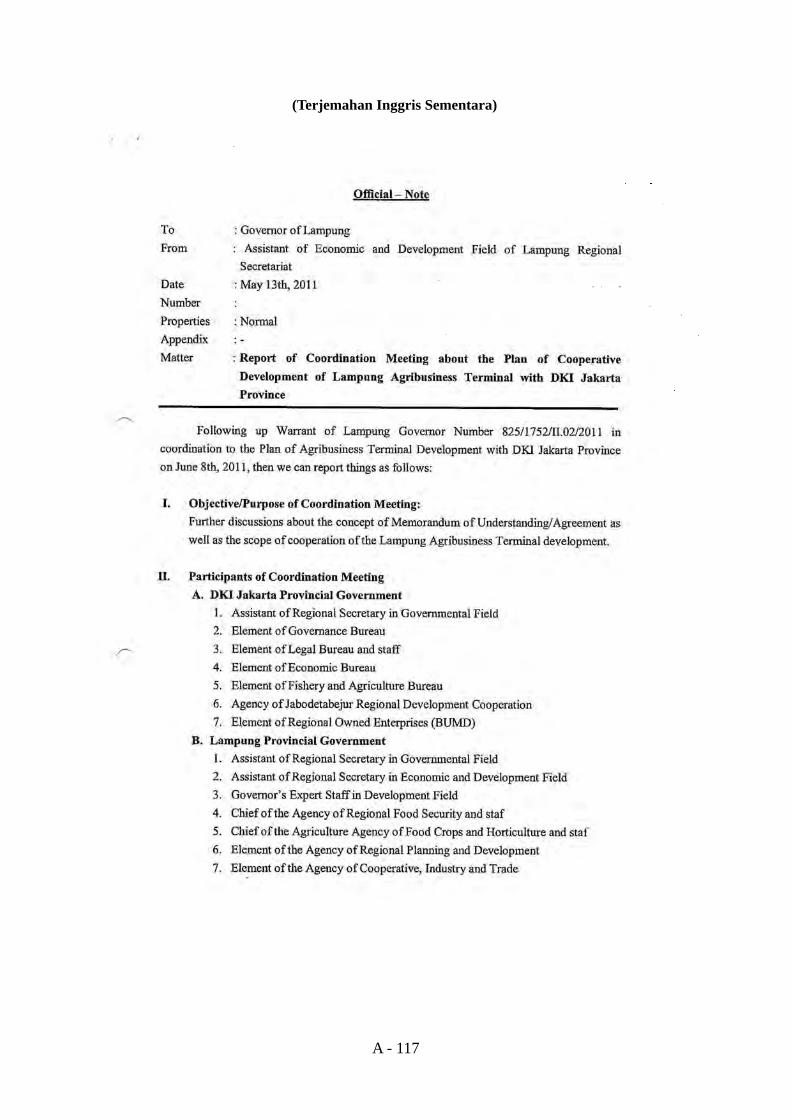
A - 117
(Terjemahan Inggris Sementara)
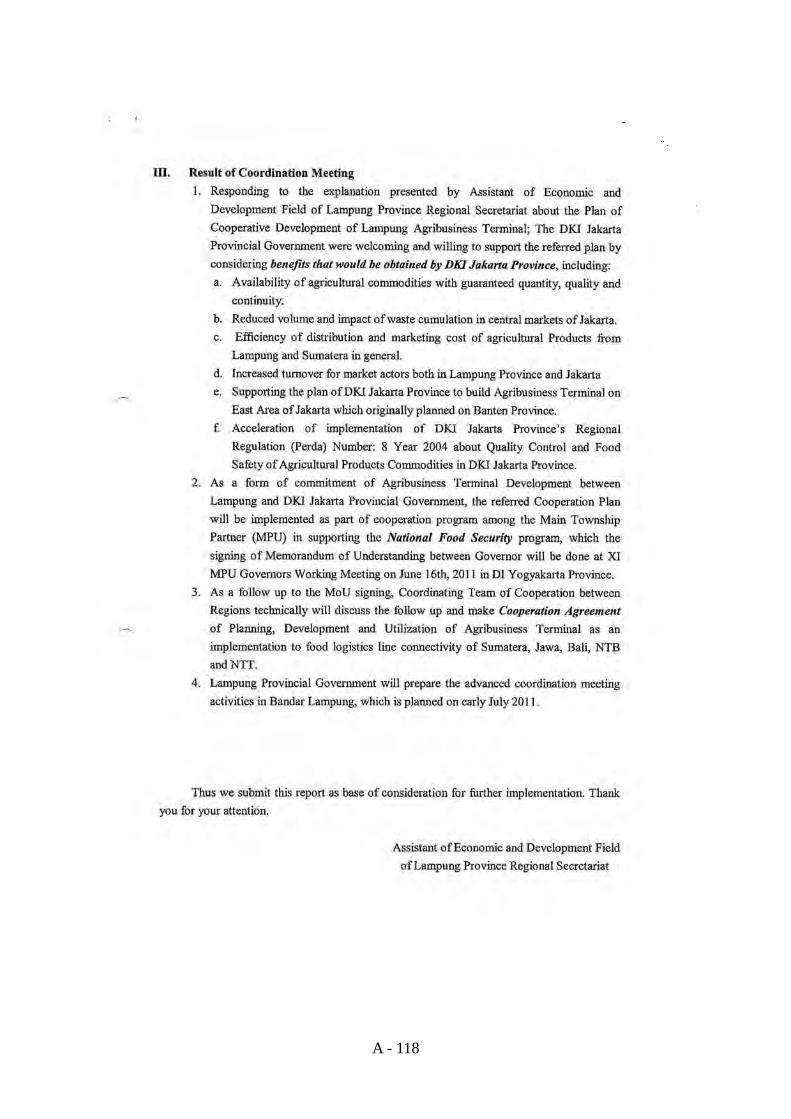
A - 118
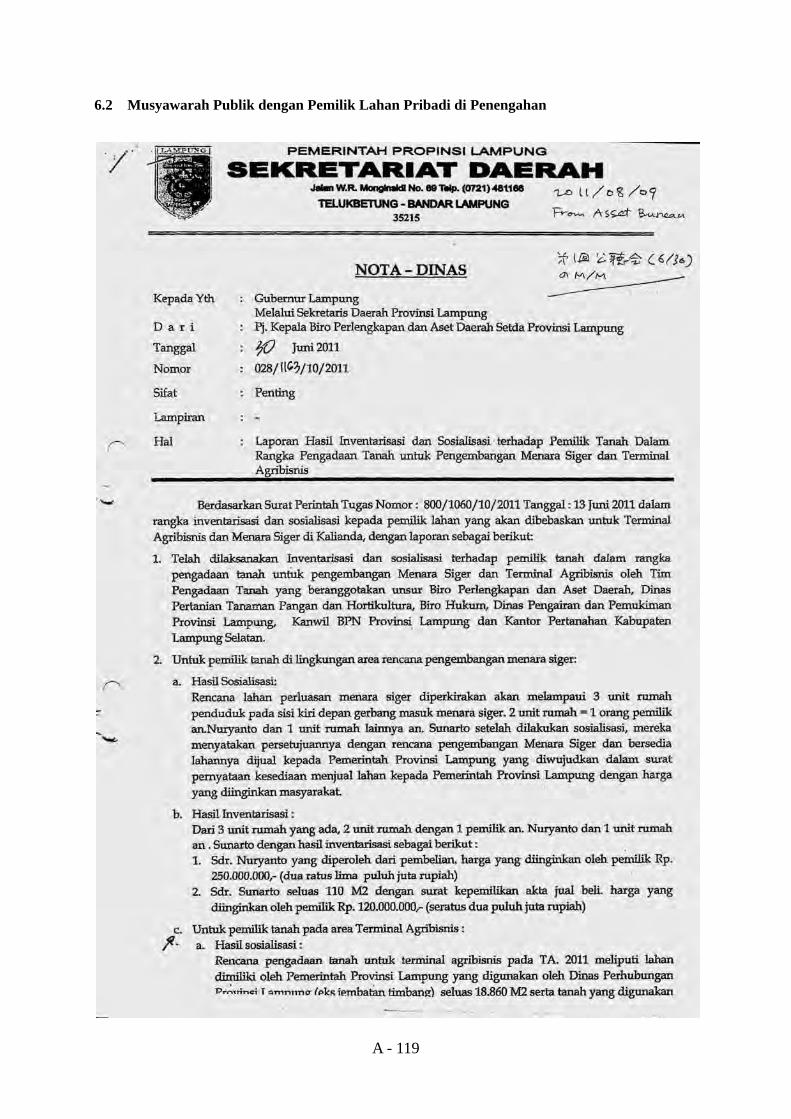
A - 119
6.2 Musyawarah Publik dengan Pemilik Lahan Pribadi di Penengahan
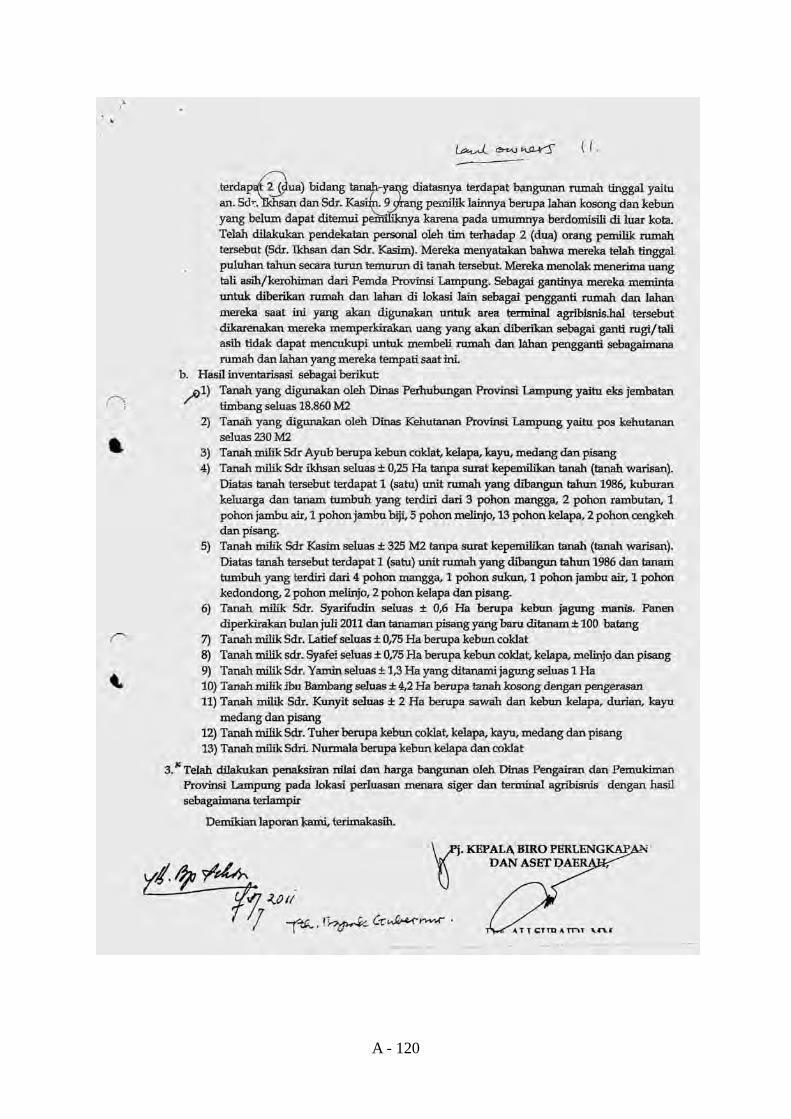
A - 120
A - 121
(Terjemahan Inggris Sementara)
A - 122
A - 123
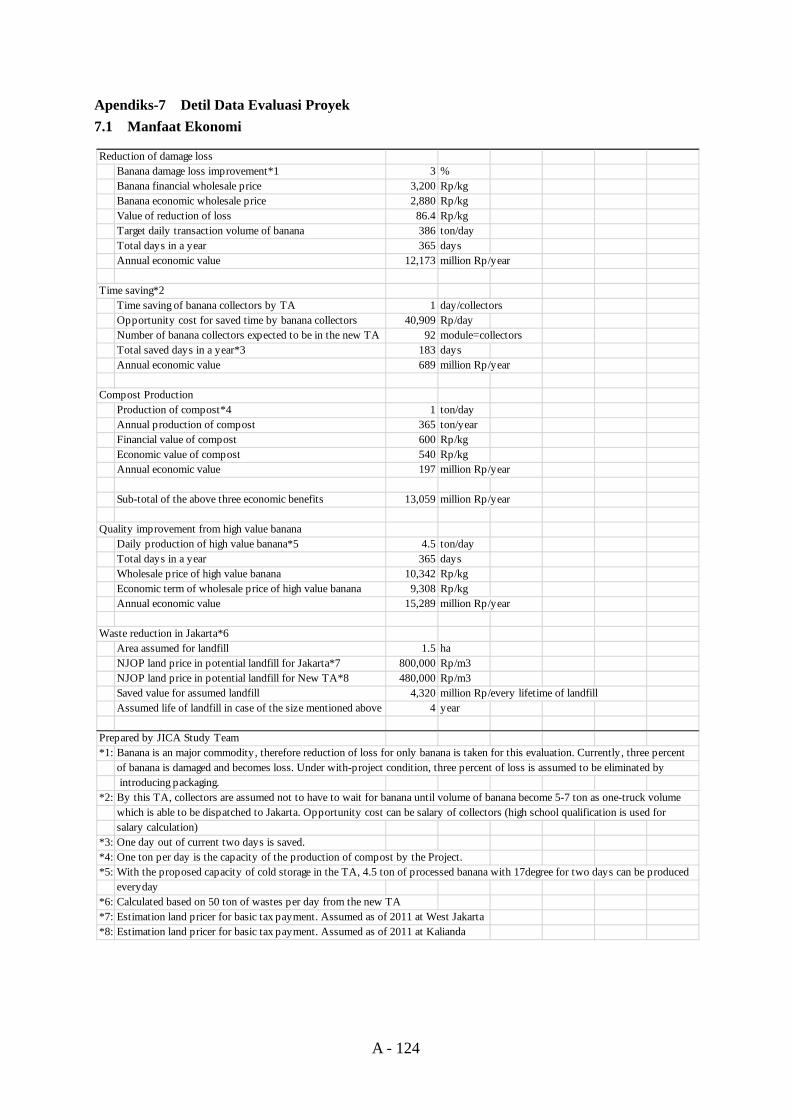
A - 124
Apendiks-7 Detil Data Evaluasi Proyek 7.1 Manfaat Ekonomi
Reduction of damage lossBanana damage loss improvement*1 3 %Banana financial wholesale price 3,200 Rp/kgBanana economic wholesale price 2,880 Rp/kgValue of reduction of loss 86.4 Rp/kgTarget daily transaction volume of banana 386 ton/dayTotal days in a year 365 daysAnnual economic value 12,173 million Rp/year
Time saving*2Time saving of banana collectors by TA 1 day/collectorsOpportunity cost for saved time by banana collectors 40,909 Rp/dayNumber of banana collectors expected to be in the new TA 92 module=collectorsTotal saved days in a year*3 183 daysAnnual economic value 689 million Rp/year
Compost ProductionProduction of compost*4 1 ton/dayAnnual production of compost 365 ton/yearFinancial value of compost 600 Rp/kgEconomic value of compost 540 Rp/kgAnnual economic value 197 million Rp/year
Sub-total of the above three economic benefits 13,059 million Rp/year
Quality improvement from high value bananaDaily production of high value banana*5 4.5 ton/dayTotal days in a year 365 daysWholesale price of high value banana 10,342 Rp/kgEconomic term of wholesale price of high value banana 9,308 Rp/kgAnnual economic value 15,289 million Rp/year
Waste reduction in Jakarta*6Area assumed for landfill 1.5 haNJOP land price in potential landfill for Jakarta*7 800,000 Rp/m3NJOP land price in potential landfill for New TA*8 480,000 Rp/m3Saved value for assumed landfill 4,320 million Rp/every lifetime of landfillAssumed life of landfill in case of the size mentioned above 4 year
Prepared by JICA Study Team*1: Banana is an major commodity, therefore reduction of loss for only banana is taken for this evaluation. Currently, three percent
of banana is damaged and becomes loss. Under with-project condition, three percent of loss is assumed to be eliminated by introducing packaging.
*2: By this TA, collectors are assumed not to have to wait for banana until volume of banana become 5-7 ton as one-truck volume which is able to be dispatched to Jakarta. Opportunity cost can be salary of collectors (high school qualification is used for salary calculation)
*3: One day out of current two days is saved.*4: One ton per day is the capacity of the production of compost by the Project.*5: With the proposed capacity of cold storage in the TA, 4.5 ton of processed banana with 17degree for two days can be produced
everyday*6: Calculated based on 50 ton of wastes per day from the new TA*7: Estimation land pricer for basic tax payment. Assumed as of 2011 at West Jakarta*8: Estimation land pricer for basic tax payment. Assumed as of 2011 at Kalianda
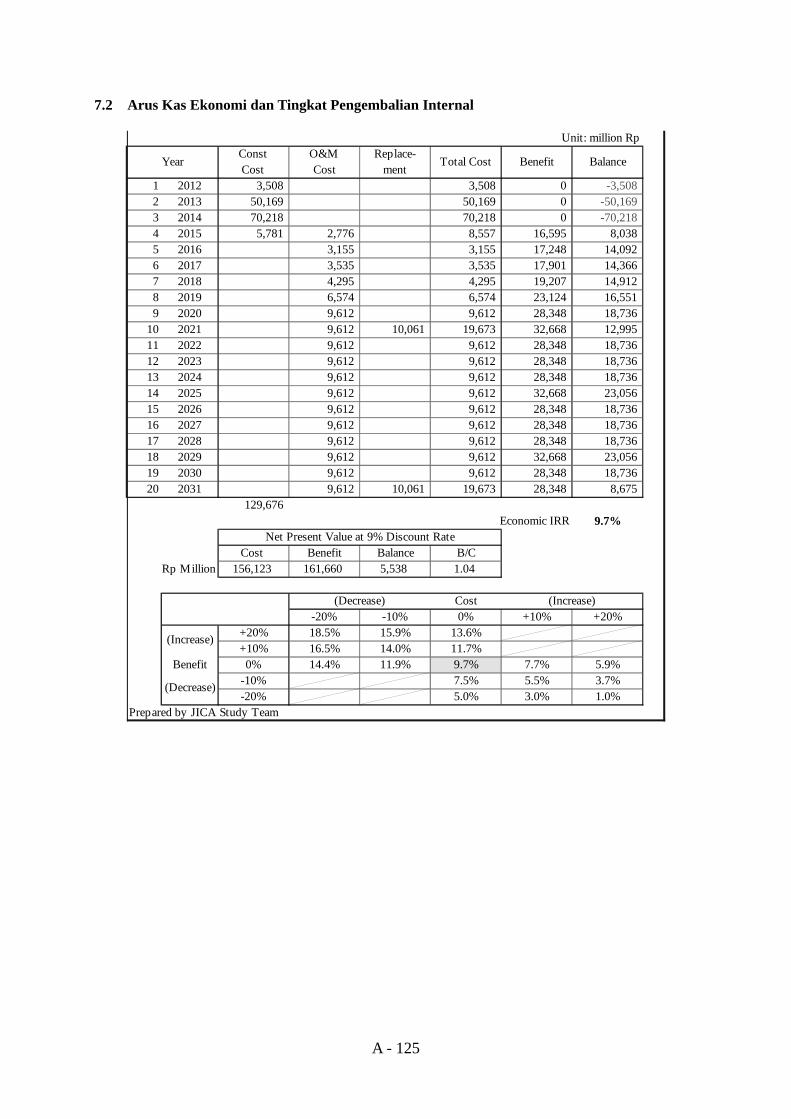
A - 125
7.2 Arus Kas Ekonomi dan Tingkat Pengembalian Internal
Unit: million Rp
YearConstCost
O&MCost
Replace-ment
Total Cost Benefit Balance
1 2012 3,508 3,508 0 -3,508 2 2013 50,169 50,169 0 -50,169 3 2014 70,218 70,218 0 -70,218 4 2015 5,781 2,776 8,557 16,595 8,0385 2016 3,155 3,155 17,248 14,0926 2017 3,535 3,535 17,901 14,3667 2018 4,295 4,295 19,207 14,9128 2019 6,574 6,574 23,124 16,5519 2020 9,612 9,612 28,348 18,736
10 2021 9,612 10,061 19,673 32,668 12,99511 2022 9,612 9,612 28,348 18,73612 2023 9,612 9,612 28,348 18,73613 2024 9,612 9,612 28,348 18,73614 2025 9,612 9,612 32,668 23,05615 2026 9,612 9,612 28,348 18,73616 2027 9,612 9,612 28,348 18,73617 2028 9,612 9,612 28,348 18,73618 2029 9,612 9,612 32,668 23,05619 2030 9,612 9,612 28,348 18,73620 2031 9,612 10,061 19,673 28,348 8,675
129,676Economic IRR 9.7%
Net Present Value at 9% Discount RateCost Benefit Balance B/C
Rp Million 156,123 161,660 5,538 1.04
Cost-20% -10% 0% +10% +20%
+20% 18.5% 15.9% 13.6%+10% 16.5% 14.0% 11.7%
Benefit 0% 14.4% 11.9% 9.7% 7.7% 5.9%-10% 7.5% 5.5% 3.7%-20% 5.0% 3.0% 1.0%
Prepared by JICA Study Team
(Decrease) (Increase)
(Increase)
(Decrease)
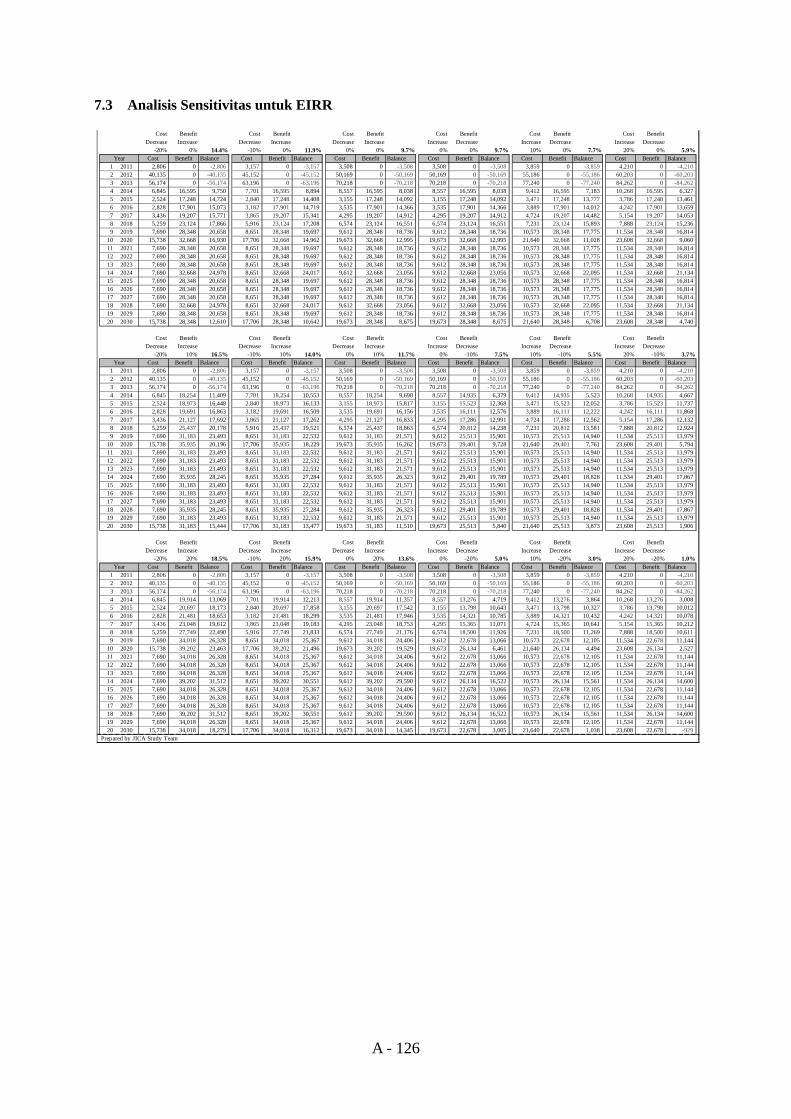
A - 126
7.3 Analisis Sensitivitas untuk EIRR
Cost Benefit Cost Benefit Cost Benefit Cost Benefit Cost Benefit Cost BenefitDecrease Increase Decrease Increase Decrease Increase Increase Decrease Increase Decrease Increase Decrease
-20% 0% 14.4% -10% 0% 11.9% 0% 0% 9.7% 0% 0% 9.7% 10% 0% 7.7% 20% 0% 5.9%Year Cost Benefit Balance Cost Benefit Balance Cost Benefit Balance Cost Benefit Balance Cost Benefit Balance Cost Benefit Balance
1 2011 2,806 0 -2,806 3,157 0 -3,157 3,508 0 -3,508 3,508 0 -3,508 3,859 0 -3,859 4,210 0 -4,210 2 2012 40,135 0 -40,135 45,152 0 -45,152 50,169 0 -50,169 50,169 0 -50,169 55,186 0 -55,186 60,203 0 -60,203 3 2013 56,174 0 -56,174 63,196 0 -63,196 70,218 0 -70,218 70,218 0 -70,218 77,240 0 -77,240 84,262 0 -84,262 4 2014 6,845 16,595 9,750 7,701 16,595 8,894 8,557 16,595 8,038 8,557 16,595 8,038 9,412 16,595 7,183 10,268 16,595 6,3275 2015 2,524 17,248 14,724 2,840 17,248 14,408 3,155 17,248 14,092 3,155 17,248 14,092 3,471 17,248 13,777 3,786 17,248 13,4616 2016 2,828 17,901 15,073 3,182 17,901 14,719 3,535 17,901 14,366 3,535 17,901 14,366 3,889 17,901 14,012 4,242 17,901 13,6597 2017 3,436 19,207 15,771 3,865 19,207 15,341 4,295 19,207 14,912 4,295 19,207 14,912 4,724 19,207 14,482 5,154 19,207 14,0538 2018 5,259 23,124 17,866 5,916 23,124 17,208 6,574 23,124 16,551 6,574 23,124 16,551 7,231 23,124 15,893 7,888 23,124 15,2369 2019 7,690 28,348 20,658 8,651 28,348 19,697 9,612 28,348 18,736 9,612 28,348 18,736 10,573 28,348 17,775 11,534 28,348 16,814
10 2020 15,738 32,668 16,930 17,706 32,668 14,962 19,673 32,668 12,995 19,673 32,668 12,995 21,640 32,668 11,028 23,608 32,668 9,06011 2021 7,690 28,348 20,658 8,651 28,348 19,697 9,612 28,348 18,736 9,612 28,348 18,736 10,573 28,348 17,775 11,534 28,348 16,81412 2022 7,690 28,348 20,658 8,651 28,348 19,697 9,612 28,348 18,736 9,612 28,348 18,736 10,573 28,348 17,775 11,534 28,348 16,81413 2023 7,690 28,348 20,658 8,651 28,348 19,697 9,612 28,348 18,736 9,612 28,348 18,736 10,573 28,348 17,775 11,534 28,348 16,81414 2024 7,690 32,668 24,978 8,651 32,668 24,017 9,612 32,668 23,056 9,612 32,668 23,056 10,573 32,668 22,095 11,534 32,668 21,13415 2025 7,690 28,348 20,658 8,651 28,348 19,697 9,612 28,348 18,736 9,612 28,348 18,736 10,573 28,348 17,775 11,534 28,348 16,81416 2026 7,690 28,348 20,658 8,651 28,348 19,697 9,612 28,348 18,736 9,612 28,348 18,736 10,573 28,348 17,775 11,534 28,348 16,81417 2027 7,690 28,348 20,658 8,651 28,348 19,697 9,612 28,348 18,736 9,612 28,348 18,736 10,573 28,348 17,775 11,534 28,348 16,81418 2028 7,690 32,668 24,978 8,651 32,668 24,017 9,612 32,668 23,056 9,612 32,668 23,056 10,573 32,668 22,095 11,534 32,668 21,13419 2029 7,690 28,348 20,658 8,651 28,348 19,697 9,612 28,348 18,736 9,612 28,348 18,736 10,573 28,348 17,775 11,534 28,348 16,81420 2030 15,738 28,348 12,610 17,706 28,348 10,642 19,673 28,348 8,675 19,673 28,348 8,675 21,640 28,348 6,708 23,608 28,348 4,740
Cost Benefit Cost Benefit Cost Benefit Cost Benefit Cost Benefit Cost BenefitDecrease Increase Decrease Increase Decrease Increase Increase Decrease Increase Decrease Increase Decrease
-20% 10% 16.5% -10% 10% 14.0% 0% 10% 11.7% 0% -10% 7.5% 10% -10% 5.5% 20% -10% 3.7%Year Cost Benefit Balance Cost Benefit Balance Cost Benefit Balance Cost Benefit Balance Cost Benefit Balance Cost Benefit Balance
1 2011 2,806 0 -2,806 3,157 0 -3,157 3,508 0 -3,508 3,508 0 -3,508 3,859 0 -3,859 4,210 0 -4,210 2 2012 40,135 0 -40,135 45,152 0 -45,152 50,169 0 -50,169 50,169 0 -50,169 55,186 0 -55,186 60,203 0 -60,203 3 2013 56,174 0 -56,174 63,196 0 -63,196 70,218 0 -70,218 70,218 0 -70,218 77,240 0 -77,240 84,262 0 -84,262 4 2014 6,845 18,254 11,409 7,701 18,254 10,553 8,557 18,254 9,698 8,557 14,935 6,379 9,412 14,935 5,523 10,268 14,935 4,6675 2015 2,524 18,973 16,448 2,840 18,973 16,133 3,155 18,973 15,817 3,155 15,523 12,368 3,471 15,523 12,052 3,786 15,523 11,7376 2016 2,828 19,691 16,863 3,182 19,691 16,509 3,535 19,691 16,156 3,535 16,111 12,576 3,889 16,111 12,222 4,242 16,111 11,8687 2017 3,436 21,127 17,692 3,865 21,127 17,262 4,295 21,127 16,833 4,295 17,286 12,991 4,724 17,286 12,562 5,154 17,286 12,1328 2018 5,259 25,437 20,178 5,916 25,437 19,521 6,574 25,437 18,863 6,574 20,812 14,238 7,231 20,812 13,581 7,888 20,812 12,9249 2019 7,690 31,183 23,493 8,651 31,183 22,532 9,612 31,183 21,571 9,612 25,513 15,901 10,573 25,513 14,940 11,534 25,513 13,979
10 2020 15,738 35,935 20,196 17,706 35,935 18,229 19,673 35,935 16,262 19,673 29,401 9,728 21,640 29,401 7,761 23,608 29,401 5,79411 2021 7,690 31,183 23,493 8,651 31,183 22,532 9,612 31,183 21,571 9,612 25,513 15,901 10,573 25,513 14,940 11,534 25,513 13,97912 2022 7,690 31,183 23,493 8,651 31,183 22,532 9,612 31,183 21,571 9,612 25,513 15,901 10,573 25,513 14,940 11,534 25,513 13,97913 2023 7,690 31,183 23,493 8,651 31,183 22,532 9,612 31,183 21,571 9,612 25,513 15,901 10,573 25,513 14,940 11,534 25,513 13,97914 2024 7,690 35,935 28,245 8,651 35,935 27,284 9,612 35,935 26,323 9,612 29,401 19,789 10,573 29,401 18,828 11,534 29,401 17,86715 2025 7,690 31,183 23,493 8,651 31,183 22,532 9,612 31,183 21,571 9,612 25,513 15,901 10,573 25,513 14,940 11,534 25,513 13,97916 2026 7,690 31,183 23,493 8,651 31,183 22,532 9,612 31,183 21,571 9,612 25,513 15,901 10,573 25,513 14,940 11,534 25,513 13,97917 2027 7,690 31,183 23,493 8,651 31,183 22,532 9,612 31,183 21,571 9,612 25,513 15,901 10,573 25,513 14,940 11,534 25,513 13,97918 2028 7,690 35,935 28,245 8,651 35,935 27,284 9,612 35,935 26,323 9,612 29,401 19,789 10,573 29,401 18,828 11,534 29,401 17,86719 2029 7,690 31,183 23,493 8,651 31,183 22,532 9,612 31,183 21,571 9,612 25,513 15,901 10,573 25,513 14,940 11,534 25,513 13,97920 2030 15,738 31,183 15,444 17,706 31,183 13,477 19,673 31,183 11,510 19,673 25,513 5,840 21,640 25,513 3,873 23,608 25,513 1,906
Cost Benefit Cost Benefit Cost Benefit Cost Benefit Cost Benefit Cost BenefitDecrease Increase Decrease Increase Decrease Increase Increase Decrease Increase Decrease Increase Decrease
-20% 20% 18.5% -10% 20% 15.9% 0% 20% 13.6% 0% -20% 5.0% 10% -20% 3.0% 20% -20% 1.0%Year Cost Benefit Balance Cost Benefit Balance Cost Benefit Balance Cost Benefit Balance Cost Benefit Balance Cost Benefit Balance
1 2011 2,806 0 -2,806 3,157 0 -3,157 3,508 0 -3,508 3,508 0 -3,508 3,859 0 -3,859 4,210 0 -4,210 2 2012 40,135 0 -40,135 45,152 0 -45,152 50,169 0 -50,169 50,169 0 -50,169 55,186 0 -55,186 60,203 0 -60,203 3 2013 56,174 0 -56,174 63,196 0 -63,196 70,218 0 -70,218 70,218 0 -70,218 77,240 0 -77,240 84,262 0 -84,262 4 2014 6,845 19,914 13,069 7,701 19,914 12,213 8,557 19,914 11,357 8,557 13,276 4,719 9,412 13,276 3,864 10,268 13,276 3,0085 2015 2,524 20,697 18,173 2,840 20,697 17,858 3,155 20,697 17,542 3,155 13,798 10,643 3,471 13,798 10,327 3,786 13,798 10,0126 2016 2,828 21,481 18,653 3,182 21,481 18,299 3,535 21,481 17,946 3,535 14,321 10,785 3,889 14,321 10,432 4,242 14,321 10,0787 2017 3,436 23,048 19,612 3,865 23,048 19,183 4,295 23,048 18,753 4,295 15,365 11,071 4,724 15,365 10,641 5,154 15,365 10,2128 2018 5,259 27,749 22,490 5,916 27,749 21,833 6,574 27,749 21,176 6,574 18,500 11,926 7,231 18,500 11,269 7,888 18,500 10,6119 2019 7,690 34,018 26,328 8,651 34,018 25,367 9,612 34,018 24,406 9,612 22,678 13,066 10,573 22,678 12,105 11,534 22,678 11,144
10 2020 15,738 39,202 23,463 17,706 39,202 21,496 19,673 39,202 19,529 19,673 26,134 6,461 21,640 26,134 4,494 23,608 26,134 2,52711 2021 7,690 34,018 26,328 8,651 34,018 25,367 9,612 34,018 24,406 9,612 22,678 13,066 10,573 22,678 12,105 11,534 22,678 11,14412 2022 7,690 34,018 26,328 8,651 34,018 25,367 9,612 34,018 24,406 9,612 22,678 13,066 10,573 22,678 12,105 11,534 22,678 11,14413 2023 7,690 34,018 26,328 8,651 34,018 25,367 9,612 34,018 24,406 9,612 22,678 13,066 10,573 22,678 12,105 11,534 22,678 11,14414 2024 7,690 39,202 31,512 8,651 39,202 30,551 9,612 39,202 29,590 9,612 26,134 16,522 10,573 26,134 15,561 11,534 26,134 14,60015 2025 7,690 34,018 26,328 8,651 34,018 25,367 9,612 34,018 24,406 9,612 22,678 13,066 10,573 22,678 12,105 11,534 22,678 11,14416 2026 7,690 34,018 26,328 8,651 34,018 25,367 9,612 34,018 24,406 9,612 22,678 13,066 10,573 22,678 12,105 11,534 22,678 11,14417 2027 7,690 34,018 26,328 8,651 34,018 25,367 9,612 34,018 24,406 9,612 22,678 13,066 10,573 22,678 12,105 11,534 22,678 11,14418 2028 7,690 39,202 31,512 8,651 39,202 30,551 9,612 39,202 29,590 9,612 26,134 16,522 10,573 26,134 15,561 11,534 26,134 14,60019 2029 7,690 34,018 26,328 8,651 34,018 25,367 9,612 34,018 24,406 9,612 22,678 13,066 10,573 22,678 12,105 11,534 22,678 11,14420 2030 15,738 34,018 18,279 17,706 34,018 16,312 19,673 34,018 14,345 19,673 22,678 3,005 21,640 22,678 1,038 23,608 22,678 -929
Prepared by JICA Study Team

A - 126
7.3 Analisis Sensitivitas untuk FIRR
Cost Benefit Cost Benefit Cost Benefit Cost Benefit Cost Benefit Cost BenefitDecrease Increase Decrease Increase Decrease Increase Increase Decrease Increase Decrease Increase Decrease
-20% 0% 14.4% -10% 0% 11.9% 0% 0% 9.7% 0% 0% 9.7% 10% 0% 7.7% 20% 0% 5.9%Year Cost Benefit Balance Cost Benefit Balance Cost Benefit Balance Cost Benefit Balance Cost Benefit Balance Cost Benefit Balance
1 2011 2,806 0 -2,806 3,157 0 -3,157 3,508 0 -3,508 3,508 0 -3,508 3,859 0 -3,859 4,210 0 -4,210 2 2012 40,135 0 -40,135 45,152 0 -45,152 50,169 0 -50,169 50,169 0 -50,169 55,186 0 -55,186 60,203 0 -60,203 3 2013 56,174 0 -56,174 63,196 0 -63,196 70,218 0 -70,218 70,218 0 -70,218 77,240 0 -77,240 84,262 0 -84,262 4 2014 6,845 16,595 9,750 7,701 16,595 8,894 8,557 16,595 8,038 8,557 16,595 8,038 9,412 16,595 7,183 10,268 16,595 6,3275 2015 2,524 17,248 14,724 2,840 17,248 14,408 3,155 17,248 14,092 3,155 17,248 14,092 3,471 17,248 13,777 3,786 17,248 13,4616 2016 2,828 17,901 15,073 3,182 17,901 14,719 3,535 17,901 14,366 3,535 17,901 14,366 3,889 17,901 14,012 4,242 17,901 13,6597 2017 3,436 19,207 15,771 3,865 19,207 15,341 4,295 19,207 14,912 4,295 19,207 14,912 4,724 19,207 14,482 5,154 19,207 14,0538 2018 5,259 23,124 17,866 5,916 23,124 17,208 6,574 23,124 16,551 6,574 23,124 16,551 7,231 23,124 15,893 7,888 23,124 15,2369 2019 7,690 28,348 20,658 8,651 28,348 19,697 9,612 28,348 18,736 9,612 28,348 18,736 10,573 28,348 17,775 11,534 28,348 16,814
10 2020 15,738 32,668 16,930 17,706 32,668 14,962 19,673 32,668 12,995 19,673 32,668 12,995 21,640 32,668 11,028 23,608 32,668 9,06011 2021 7,690 28,348 20,658 8,651 28,348 19,697 9,612 28,348 18,736 9,612 28,348 18,736 10,573 28,348 17,775 11,534 28,348 16,81412 2022 7,690 28,348 20,658 8,651 28,348 19,697 9,612 28,348 18,736 9,612 28,348 18,736 10,573 28,348 17,775 11,534 28,348 16,81413 2023 7,690 28,348 20,658 8,651 28,348 19,697 9,612 28,348 18,736 9,612 28,348 18,736 10,573 28,348 17,775 11,534 28,348 16,81414 2024 7,690 32,668 24,978 8,651 32,668 24,017 9,612 32,668 23,056 9,612 32,668 23,056 10,573 32,668 22,095 11,534 32,668 21,13415 2025 7,690 28,348 20,658 8,651 28,348 19,697 9,612 28,348 18,736 9,612 28,348 18,736 10,573 28,348 17,775 11,534 28,348 16,81416 2026 7,690 28,348 20,658 8,651 28,348 19,697 9,612 28,348 18,736 9,612 28,348 18,736 10,573 28,348 17,775 11,534 28,348 16,81417 2027 7,690 28,348 20,658 8,651 28,348 19,697 9,612 28,348 18,736 9,612 28,348 18,736 10,573 28,348 17,775 11,534 28,348 16,81418 2028 7,690 32,668 24,978 8,651 32,668 24,017 9,612 32,668 23,056 9,612 32,668 23,056 10,573 32,668 22,095 11,534 32,668 21,13419 2029 7,690 28,348 20,658 8,651 28,348 19,697 9,612 28,348 18,736 9,612 28,348 18,736 10,573 28,348 17,775 11,534 28,348 16,81420 2030 15,738 28,348 12,610 17,706 28,348 10,642 19,673 28,348 8,675 19,673 28,348 8,675 21,640 28,348 6,708 23,608 28,348 4,740
Cost Benefit Cost Benefit Cost Benefit Cost Benefit Cost Benefit Cost BenefitDecrease Increase Decrease Increase Decrease Increase Increase Decrease Increase Decrease Increase Decrease
-20% 10% 16.5% -10% 10% 14.0% 0% 10% 11.7% 0% -10% 7.5% 10% -10% 5.5% 20% -10% 3.7%Year Cost Benefit Balance Cost Benefit Balance Cost Benefit Balance Cost Benefit Balance Cost Benefit Balance Cost Benefit Balance
1 2011 2,806 0 -2,806 3,157 0 -3,157 3,508 0 -3,508 3,508 0 -3,508 3,859 0 -3,859 4,210 0 -4,210 2 2012 40,135 0 -40,135 45,152 0 -45,152 50,169 0 -50,169 50,169 0 -50,169 55,186 0 -55,186 60,203 0 -60,203 3 2013 56,174 0 -56,174 63,196 0 -63,196 70,218 0 -70,218 70,218 0 -70,218 77,240 0 -77,240 84,262 0 -84,262 4 2014 6,845 18,254 11,409 7,701 18,254 10,553 8,557 18,254 9,698 8,557 14,935 6,379 9,412 14,935 5,523 10,268 14,935 4,6675 2015 2,524 18,973 16,448 2,840 18,973 16,133 3,155 18,973 15,817 3,155 15,523 12,368 3,471 15,523 12,052 3,786 15,523 11,7376 2016 2,828 19,691 16,863 3,182 19,691 16,509 3,535 19,691 16,156 3,535 16,111 12,576 3,889 16,111 12,222 4,242 16,111 11,8687 2017 3,436 21,127 17,692 3,865 21,127 17,262 4,295 21,127 16,833 4,295 17,286 12,991 4,724 17,286 12,562 5,154 17,286 12,1328 2018 5,259 25,437 20,178 5,916 25,437 19,521 6,574 25,437 18,863 6,574 20,812 14,238 7,231 20,812 13,581 7,888 20,812 12,9249 2019 7,690 31,183 23,493 8,651 31,183 22,532 9,612 31,183 21,571 9,612 25,513 15,901 10,573 25,513 14,940 11,534 25,513 13,979
10 2020 15,738 35,935 20,196 17,706 35,935 18,229 19,673 35,935 16,262 19,673 29,401 9,728 21,640 29,401 7,761 23,608 29,401 5,79411 2021 7,690 31,183 23,493 8,651 31,183 22,532 9,612 31,183 21,571 9,612 25,513 15,901 10,573 25,513 14,940 11,534 25,513 13,97912 2022 7,690 31,183 23,493 8,651 31,183 22,532 9,612 31,183 21,571 9,612 25,513 15,901 10,573 25,513 14,940 11,534 25,513 13,97913 2023 7,690 31,183 23,493 8,651 31,183 22,532 9,612 31,183 21,571 9,612 25,513 15,901 10,573 25,513 14,940 11,534 25,513 13,97914 2024 7,690 35,935 28,245 8,651 35,935 27,284 9,612 35,935 26,323 9,612 29,401 19,789 10,573 29,401 18,828 11,534 29,401 17,86715 2025 7,690 31,183 23,493 8,651 31,183 22,532 9,612 31,183 21,571 9,612 25,513 15,901 10,573 25,513 14,940 11,534 25,513 13,97916 2026 7,690 31,183 23,493 8,651 31,183 22,532 9,612 31,183 21,571 9,612 25,513 15,901 10,573 25,513 14,940 11,534 25,513 13,97917 2027 7,690 31,183 23,493 8,651 31,183 22,532 9,612 31,183 21,571 9,612 25,513 15,901 10,573 25,513 14,940 11,534 25,513 13,97918 2028 7,690 35,935 28,245 8,651 35,935 27,284 9,612 35,935 26,323 9,612 29,401 19,789 10,573 29,401 18,828 11,534 29,401 17,86719 2029 7,690 31,183 23,493 8,651 31,183 22,532 9,612 31,183 21,571 9,612 25,513 15,901 10,573 25,513 14,940 11,534 25,513 13,97920 2030 15,738 31,183 15,444 17,706 31,183 13,477 19,673 31,183 11,510 19,673 25,513 5,840 21,640 25,513 3,873 23,608 25,513 1,906
Cost Benefit Cost Benefit Cost Benefit Cost Benefit Cost Benefit Cost BenefitDecrease Increase Decrease Increase Decrease Increase Increase Decrease Increase Decrease Increase Decrease
-20% 20% 18.5% -10% 20% 15.9% 0% 20% 13.6% 0% -20% 5.0% 10% -20% 3.0% 20% -20% 1.0%Year Cost Benefit Balance Cost Benefit Balance Cost Benefit Balance Cost Benefit Balance Cost Benefit Balance Cost Benefit Balance
1 2011 2,806 0 -2,806 3,157 0 -3,157 3,508 0 -3,508 3,508 0 -3,508 3,859 0 -3,859 4,210 0 -4,210 2 2012 40,135 0 -40,135 45,152 0 -45,152 50,169 0 -50,169 50,169 0 -50,169 55,186 0 -55,186 60,203 0 -60,203 3 2013 56,174 0 -56,174 63,196 0 -63,196 70,218 0 -70,218 70,218 0 -70,218 77,240 0 -77,240 84,262 0 -84,262 4 2014 6,845 19,914 13,069 7,701 19,914 12,213 8,557 19,914 11,357 8,557 13,276 4,719 9,412 13,276 3,864 10,268 13,276 3,0085 2015 2,524 20,697 18,173 2,840 20,697 17,858 3,155 20,697 17,542 3,155 13,798 10,643 3,471 13,798 10,327 3,786 13,798 10,0126 2016 2,828 21,481 18,653 3,182 21,481 18,299 3,535 21,481 17,946 3,535 14,321 10,785 3,889 14,321 10,432 4,242 14,321 10,0787 2017 3,436 23,048 19,612 3,865 23,048 19,183 4,295 23,048 18,753 4,295 15,365 11,071 4,724 15,365 10,641 5,154 15,365 10,2128 2018 5,259 27,749 22,490 5,916 27,749 21,833 6,574 27,749 21,176 6,574 18,500 11,926 7,231 18,500 11,269 7,888 18,500 10,6119 2019 7,690 34,018 26,328 8,651 34,018 25,367 9,612 34,018 24,406 9,612 22,678 13,066 10,573 22,678 12,105 11,534 22,678 11,144
10 2020 15,738 39,202 23,463 17,706 39,202 21,496 19,673 39,202 19,529 19,673 26,134 6,461 21,640 26,134 4,494 23,608 26,134 2,52711 2021 7,690 34,018 26,328 8,651 34,018 25,367 9,612 34,018 24,406 9,612 22,678 13,066 10,573 22,678 12,105 11,534 22,678 11,14412 2022 7,690 34,018 26,328 8,651 34,018 25,367 9,612 34,018 24,406 9,612 22,678 13,066 10,573 22,678 12,105 11,534 22,678 11,14413 2023 7,690 34,018 26,328 8,651 34,018 25,367 9,612 34,018 24,406 9,612 22,678 13,066 10,573 22,678 12,105 11,534 22,678 11,14414 2024 7,690 39,202 31,512 8,651 39,202 30,551 9,612 39,202 29,590 9,612 26,134 16,522 10,573 26,134 15,561 11,534 26,134 14,60015 2025 7,690 34,018 26,328 8,651 34,018 25,367 9,612 34,018 24,406 9,612 22,678 13,066 10,573 22,678 12,105 11,534 22,678 11,14416 2026 7,690 34,018 26,328 8,651 34,018 25,367 9,612 34,018 24,406 9,612 22,678 13,066 10,573 22,678 12,105 11,534 22,678 11,14417 2027 7,690 34,018 26,328 8,651 34,018 25,367 9,612 34,018 24,406 9,612 22,678 13,066 10,573 22,678 12,105 11,534 22,678 11,14418 2028 7,690 39,202 31,512 8,651 39,202 30,551 9,612 39,202 29,590 9,612 26,134 16,522 10,573 26,134 15,561 11,534 26,134 14,60019 2029 7,690 34,018 26,328 8,651 34,018 25,367 9,612 34,018 24,406 9,612 22,678 13,066 10,573 22,678 12,105 11,534 22,678 11,14420 2030 15,738 34,018 18,279 17,706 34,018 16,312 19,673 34,018 14,345 19,673 22,678 3,005 21,640 22,678 1,038 23,608 22,678 -929
Prepared by JICA Study Team
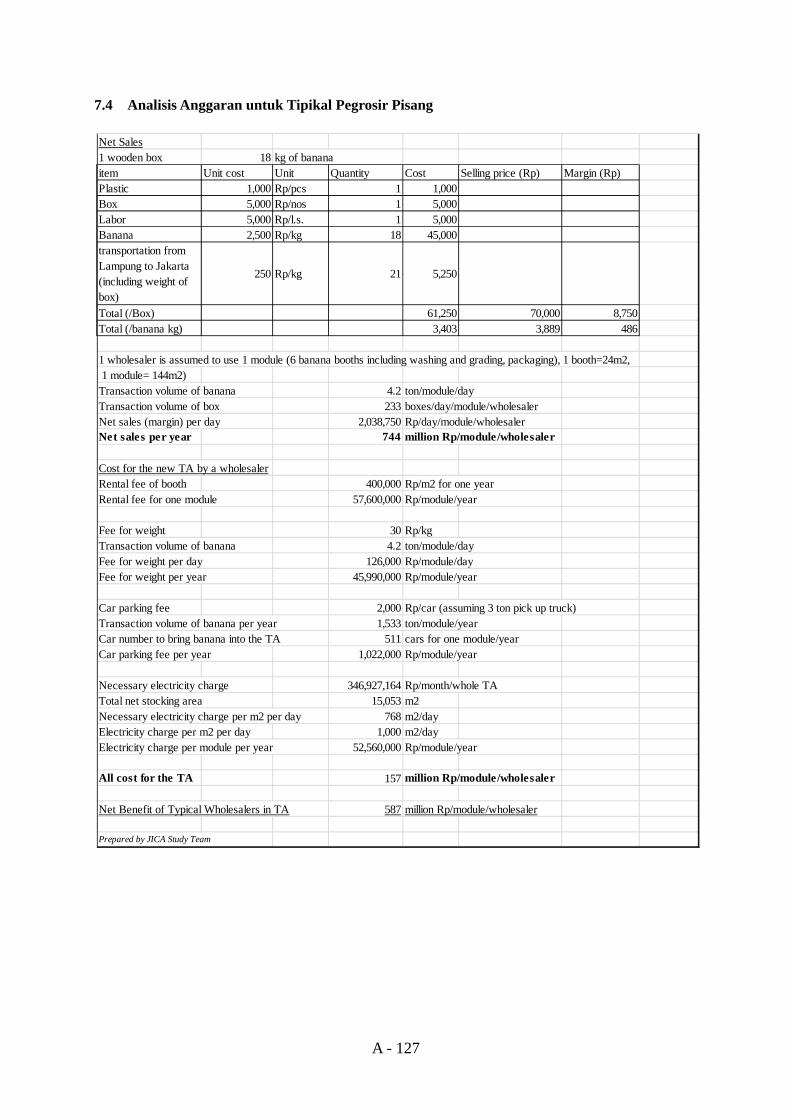
A - 127
7.4 Analisis Anggaran untuk Tipikal Pegrosir Pisang
Net Sales1 wooden box 18 kg of bananaitem Unit cost Unit Quantity Cost Selling price (Rp) Margin (Rp)Plastic 1,000 Rp/pcs 1 1,000Box 5,000 Rp/nos 1 5,000Labor 5,000 Rp/l.s. 1 5,000Banana 2,500 Rp/kg 18 45,000transportation fromLampung to Jakarta(including weight ofbox)
250 Rp/kg 21 5,250
Total (/Box) 61,250 70,000 8,750Total (/banana kg) 3,403 3,889 486
1 wholesaler is assumed to use 1 module (6 banana booths including washing and grading, packaging), 1 booth=24m2, 1 module= 144m2)Transaction volume of banana 4.2 ton/module/dayTransaction volume of box 233 boxes/day/module/wholesalerNet sales (margin) per day 2,038,750 Rp/day/module/wholesalerNet sales per year 744 million Rp/module/wholesaler
Cost for the new TA by a wholesalerRental fee of booth 400,000 Rp/m2 for one yearRental fee for one module 57,600,000 Rp/module/year
Fee for weight 30 Rp/kgTransaction volume of banana 4.2 ton/module/dayFee for weight per day 126,000 Rp/module/dayFee for weight per year 45,990,000 Rp/module/year
Car parking fee 2,000 Rp/car (assuming 3 ton pick up truck)Transaction volume of banana per year 1,533 ton/module/yearCar number to bring banana into the TA 511 cars for one module/yearCar parking fee per year 1,022,000 Rp/module/year
Necessary electricity charge 346,927,164 Rp/month/whole TATotal net stocking area 15,053 m2Necessary electricity charge per m2 per day 768 m2/dayElectricity charge per m2 per day 1,000 m2/dayElectricity charge per module per year 52,560,000 Rp/module/year
All cost for the TA 157 million Rp/module/wholesaler
Net Benefit of Typical Wholesalers in TA 587 million Rp/module/wholesaler
Prepared by JICA Study Team
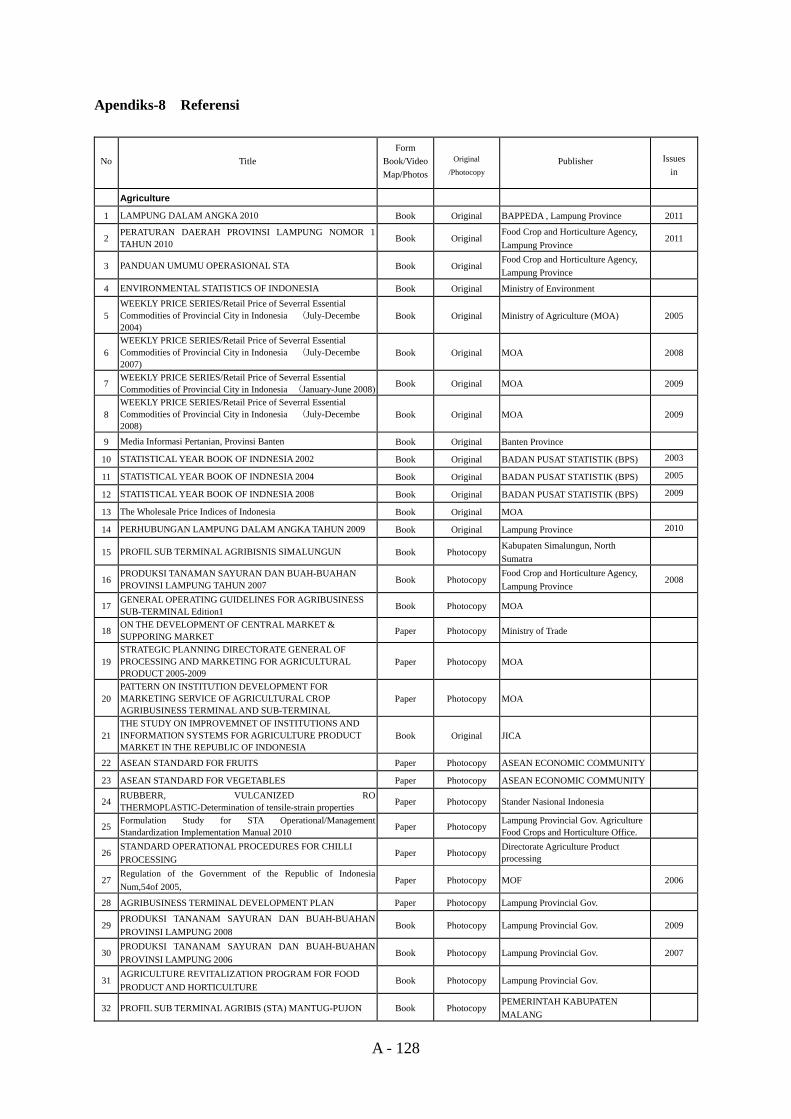
A - 128
Apendiks-8 Referensi
No Title Form
Book/VideoMap/Photos
Original
/Photocopy Publisher Issues
in
Agriculture
1 LAMPUNG DALAM ANGKA 2010 Book Original BAPPEDA , Lampung Province 2011
2 PERATURAN DAERAH PROVINSI LAMPUNG NOMOR 1 TAHUN 2010 Book Original
Food Crop and Horticulture Agency, Lampung Province
2011
3 PANDUAN UMUMU OPERASIONAL STA Book Original Food Crop and Horticulture Agency, Lampung Province
4 ENVIRONMENTAL STATISTICS OF INDONESIA Book Original Ministry of Environment
5 WEEKLY PRICE SERIES/Retail Price of Severral Essential Commodities of Provincial City in Indonesia (July-Decembe 2004)
Book Original Ministry of Agriculture (MOA) 2005
6 WEEKLY PRICE SERIES/Retail Price of Severral Essential Commodities of Provincial City in Indonesia (July-Decembe 2007)
Book Original MOA 2008
7 WEEKLY PRICE SERIES/Retail Price of Severral Essential Commodities of Provincial City in Indonesia (January-June 2008) Book Original MOA 2009
8 WEEKLY PRICE SERIES/Retail Price of Severral Essential Commodities of Provincial City in Indonesia (July-Decembe 2008)
Book Original MOA 2009
9 Media Informasi Pertanian, Provinsi Banten Book Original Banten Province
10 STATISTICAL YEAR BOOK OF INDNESIA 2002 Book Original BADAN PUSAT STATISTIK (BPS) 2003
11 STATISTICAL YEAR BOOK OF INDNESIA 2004 Book Original BADAN PUSAT STATISTIK (BPS) 2005
12 STATISTICAL YEAR BOOK OF INDNESIA 2008 Book Original BADAN PUSAT STATISTIK (BPS) 2009
13 The Wholesale Price Indices of Indonesia Book Original MOA
14 PERHUBUNGAN LAMPUNG DALAM ANGKA TAHUN 2009 Book Original Lampung Province 2010
15 PROFIL SUB TERMINAL AGRIBISNIS SIMALUNGUN Book Photocopy Kabupaten Simalungun, North Sumatra
16 PRODUKSI TANAMAN SAYURAN DAN BUAH-BUAHAN PROVINSI LAMPUNG TAHUN 2007 Book Photocopy
Food Crop and Horticulture Agency, Lampung Province
2008
17 GENERAL OPERATING GUIDELINES FOR AGRIBUSINESS SUB-TERMINAL Edition1 Book Photocopy MOA
18 ON THE DEVELOPMENT OF CENTRAL MARKET & SUPPORING MARKET Paper Photocopy Ministry of Trade
19 STRATEGIC PLANNING DIRECTORATE GENERAL OF PROCESSING AND MARKETING FOR AGRICULTURAL PRODUCT 2005-2009
Paper Photocopy MOA
20 PATTERN ON INSTITUTION DEVELOPMENT FOR MARKETING SERVICE OF AGRICULTURAL CROP AGRIBUSINESS TERMINAL AND SUB-TERMINAL
Paper Photocopy MOA
21 THE STUDY ON IMPROVEMNET OF INSTITUTIONS AND INFORMATION SYSTEMS FOR AGRICULTURE PRODUCT MARKET IN THE REPUBLIC OF INDONESIA
Book Original JICA
22 ASEAN STANDARD FOR FRUITS Paper Photocopy ASEAN ECONOMIC COMMUNITY
23 ASEAN STANDARD FOR VEGETABLES Paper Photocopy ASEAN ECONOMIC COMMUNITY
24 RUBBERR, VULCANIZED RO THERMOPLASTIC-Determination of tensile-strain properties Paper Photocopy Stander Nasional Indonesia
25 Formulation Study for STA Operational/Management Standardization Implementation Manual 2010 Paper Photocopy
Lampung Provincial Gov. Agriculture Food Crops and Horticulture Office.
26 STANDARD OPERATIONAL PROCEDURES FOR CHILLI PROCESSING
Paper Photocopy Directorate Agriculture Product processing
27 Regulation of the Government of the Republic of Indonesia Num,54of 2005,
Paper Photocopy MOF 2006
28 AGRIBUSINESS TERMINAL DEVELOPMENT PLAN Paper Photocopy Lampung Provincial Gov.
29 PRODUKSI TANANAM SAYURAN DAN BUAH-BUAHAN PROVINSI LAMPUNG 2008
Book Photocopy Lampung Provincial Gov. 2009
30 PRODUKSI TANANAM SAYURAN DAN BUAH-BUAHAN PROVINSI LAMPUNG 2006
Book Photocopy Lampung Provincial Gov. 2007
31 AGRICULTURE REVITALIZATION PROGRAM FOR FOOD PRODUCT AND HORTICULTURE
Book Photocopy Lampung Provincial Gov.
32 PROFIL SUB TERMINAL AGRIBIS (STA) MANTUG-PUJON Book Photocopy PEMERINTAH KABUPATEN MALANG
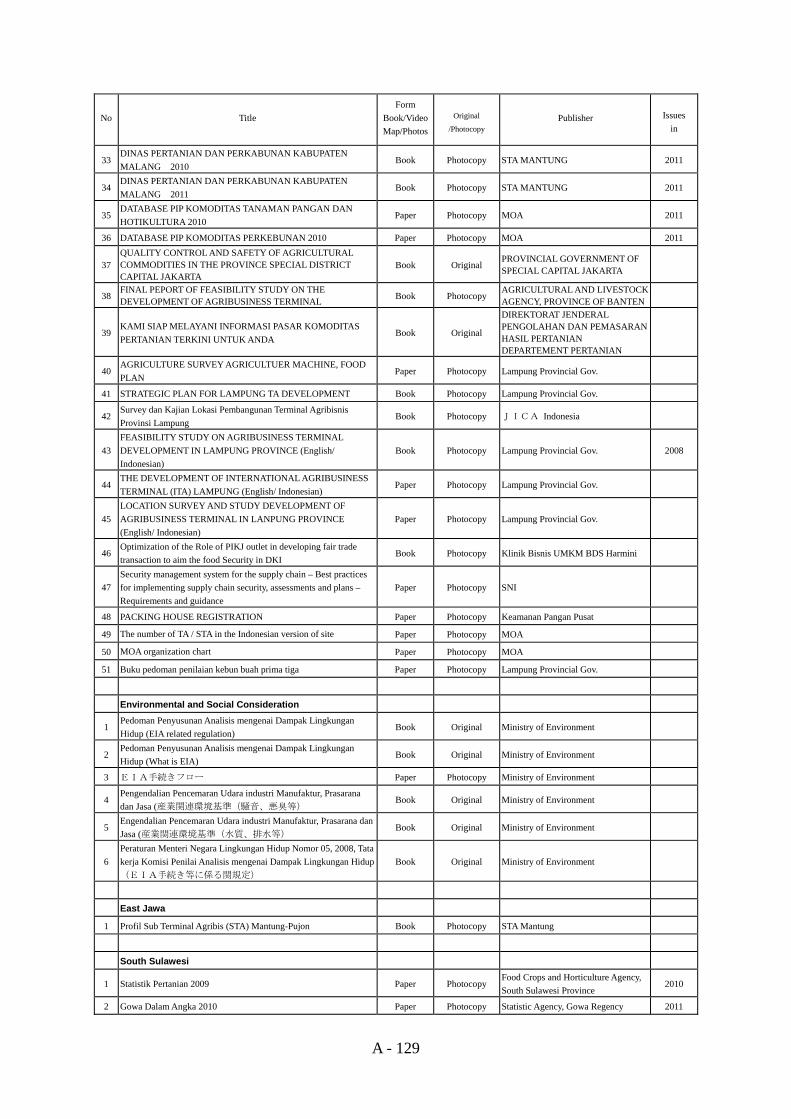
A - 129
No Title Form
Book/VideoMap/Photos
Original
/Photocopy Publisher Issues
in
33 DINAS PERTANIAN DAN PERKABUNAN KABUPATEN MALANG 2010
Book Photocopy STA MANTUNG 2011
34 DINAS PERTANIAN DAN PERKABUNAN KABUPATEN MALANG 2011
Book Photocopy STA MANTUNG 2011
35 DATABASE PIP KOMODITAS TANAMAN PANGAN DAN HOTIKULTURA 2010
Paper Photocopy MOA 2011
36 DATABASE PIP KOMODITAS PERKEBUNAN 2010 Paper Photocopy MOA 2011
37 QUALITY CONTROL AND SAFETY OF AGRICULTURAL COMMODITIES IN THE PROVINCE SPECIAL DISTRICT CAPITAL JAKARTA
Book Original PROVINCIAL GOVERNMENT OF SPECIAL CAPITAL JAKARTA
38 FINAL PEPORT OF FEASIBILITY STUDY ON THE DEVELOPMENT OF AGRIBUSINESS TERMINAL Book Photocopy
AGRICULTURAL AND LIVESTOCK AGENCY, PROVINCE OF BANTEN
39 KAMI SIAP MELAYANI INFORMASI PASAR KOMODITAS PERTANIAN TERKINI UNTUK ANDA
Book Original
DIREKTORAT JENDERAL PENGOLAHAN DAN PEMASARAN HASIL PERTANIAN DEPARTEMENT PERTANIAN
40 AGRICULTURE SURVEY AGRICULTUER MACHINE, FOOD PLAN
Paper Photocopy Lampung Provincial Gov.
41 STRATEGIC PLAN FOR LAMPUNG TA DEVELOPMENT Book Photocopy Lampung Provincial Gov.
42 Survey dan Kajian Lokasi Pembangunan Terminal Agribisnis Provinsi Lampung
Book Photocopy JICA Indonesia
43 FEASIBILITY STUDY ON AGRIBUSINESS TERMINAL DEVELOPMENT IN LAMPUNG PROVINCE (English/ Indonesian)
Book Photocopy Lampung Provincial Gov. 2008
44 THE DEVELOPMENT OF INTERNATIONAL AGRIBUSINESS TERMINAL (ITA) LAMPUNG (English/ Indonesian)
Paper Photocopy Lampung Provincial Gov.
45 LOCATION SURVEY AND STUDY DEVELOPMENT OF AGRIBUSINESS TERMINAL IN LANPUNG PROVINCE (English/ Indonesian)
Paper Photocopy Lampung Provincial Gov.
46 Optimization of the Role of PIKJ outlet in developing fair trade transaction to aim the food Security in DKI
Book Photocopy Klinik Bisnis UMKM BDS Harmini
47 Security management system for the supply chain – Best practices for implementing supply chain security, assessments and plans – Requirements and guidance
Paper Photocopy SNI
48 PACKING HOUSE REGISTRATION Paper Photocopy Keamanan Pangan Pusat
49 The number of TA / STA in the Indonesian version of site Paper Photocopy MOA
50 MOA organization chart Paper Photocopy MOA
51 Buku pedoman penilaian kebun buah prima tiga Paper Photocopy Lampung Provincial Gov.
Environmental and Social Consideration
1 Pedoman Penyusunan Analisis mengenai Dampak Lingkungan Hidup (EIA related regulation)
Book Original Ministry of Environment
2 Pedoman Penyusunan Analisis mengenai Dampak Lingkungan Hidup (What is EIA)
Book Original Ministry of Environment
3 EIA手続きフロー Paper Photocopy Ministry of Environment
4 Pengendalian Pencemaran Udara industri Manufaktur, Prasarana dan Jasa (産業関連環境基準(騒音、悪臭等)
Book Original Ministry of Environment
5 Engendalian Pencemaran Udara industri Manufaktur, Prasarana dan Jasa (産業関連環境基準(水質、排水等)
Book Original Ministry of Environment
6 Peraturan Menteri Negara Lingkungan Hidup Nomor 05, 2008, Tata kerja Komisi Penilai Analisis mengenai Dampak Lingkungan Hidup (EIA手続き等に係る関規定)
Book Original Ministry of Environment
East Jawa
1 Profil Sub Terminal Agribis (STA) Mantung-Pujon Book Photocopy STA Mantung
South Sulawesi
1 Statistik Pertanian 2009 Paper Photocopy Food Crops and Horticulture Agency, South Sulawesi Province
2010
2 Gowa Dalam Angka 2010 Paper Photocopy Statistic Agency, Gowa Regency 2011
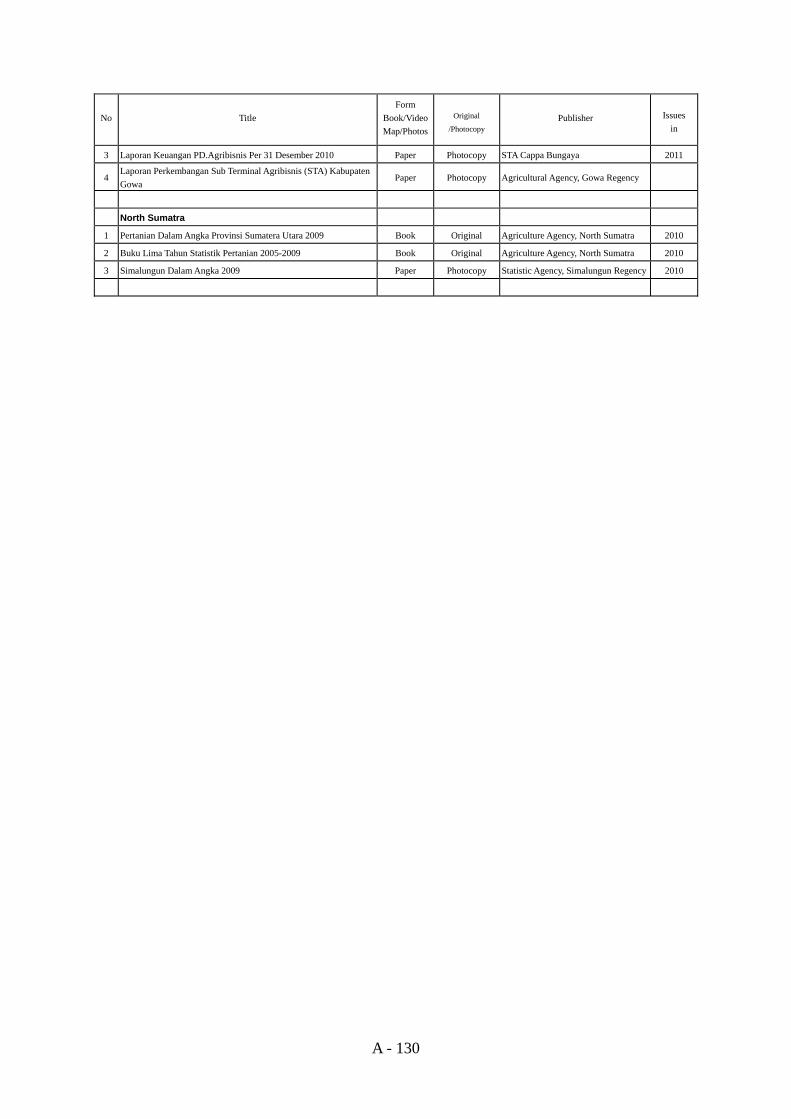
A - 130
No Title Form
Book/VideoMap/Photos
Original
/Photocopy Publisher Issues
in
3 Laporan Keuangan PD.Agribisnis Per 31 Desember 2010 Paper Photocopy STA Cappa Bungaya 2011
4 Laporan Perkembangan Sub Terminal Agribisnis (STA) Kabupaten Gowa
Paper Photocopy Agricultural Agency, Gowa Regency
North Sumatra
1 Pertanian Dalam Angka Provinsi Sumatera Utara 2009 Book Original Agriculture Agency, North Sumatra 2010
2 Buku Lima Tahun Statistik Pertanian 2005-2009 Book Original Agriculture Agency, North Sumatra 2010
3 Simalungun Dalam Angka 2009 Paper Photocopy Statistic Agency, Simalungun Regency 2010
