1 1 the analyst’s perspective: ad-hoc analysis with microsoft powerpivot and office 2010 excel...
TRANSCRIPT
11
The Analyst’s Perspective: Ad-hoc Analysis with Microsoft PowerPivot and Office 2010 ExcelRafal LukawieckiStrategic Consultant, Project Botticelli [email protected]
22
Objectives
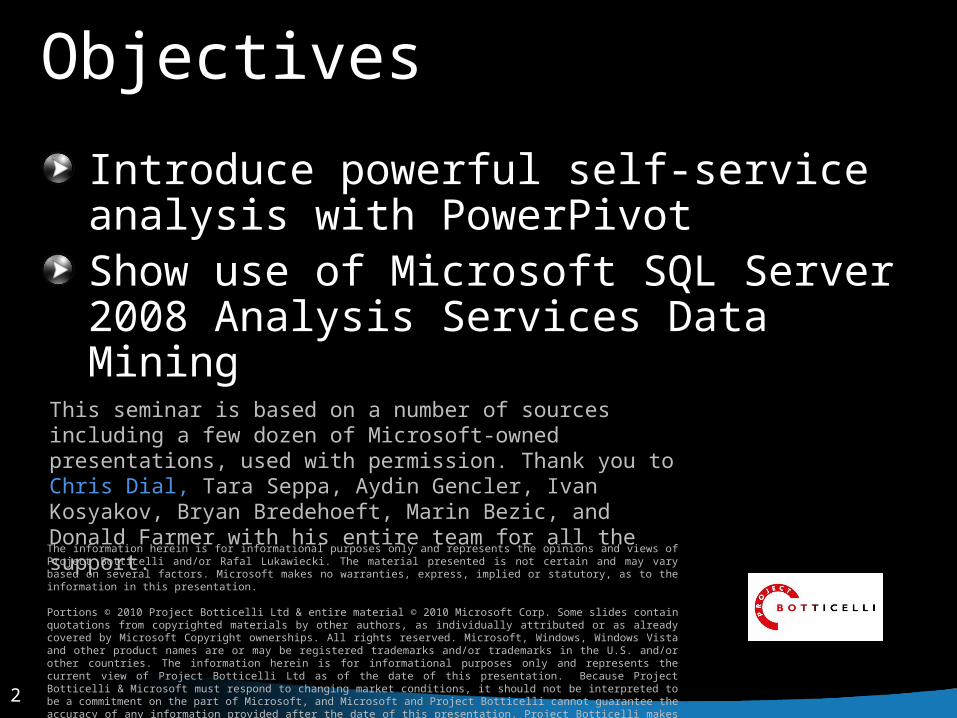
Introduce powerful self-service analysis with PowerPivotShow use of Microsoft SQL Server 2008 Analysis Services Data Mining
The information herein is for informational purposes only and represents the opinions and views of Project Botticelli and/or Rafal Lukawiecki. The material presented is not certain and may vary based on several factors. Microsoft makes no warranties, express, implied or statutory, as to the information in this presentation.
Portions © 2010 Project Botticelli Ltd & entire material © 2010 Microsoft Corp. Some slides contain quotations from copyrighted materials by other authors, as individually attributed or as already covered by Microsoft Copyright ownerships. All rights reserved. Microsoft, Windows, Windows Vista and other product names are or may be registered trademarks and/or trademarks in the U.S. and/or other countries. The information herein is for informational purposes only and represents the current view of Project Botticelli Ltd as of the date of this presentation. Because Project Botticelli & Microsoft must respond to changing market conditions, it should not be interpreted to be a commitment on the part of Microsoft, and Microsoft and Project Botticelli cannot guarantee the accuracy of any information provided after the date of this presentation. Project Botticelli makes no warranties, express, implied or statutory, as to the information in this presentation. E&OE.
This seminar is based on a number of sources including a few dozen of Microsoft-owned presentations, used with permission. Thank you to Chris Dial, Tara Seppa, Aydin Gencler, Ivan Kosyakov, Bryan Bredehoeft, Marin Bezic, and Donald Farmer with his entire team for all the support.

3
PowerPivot
44
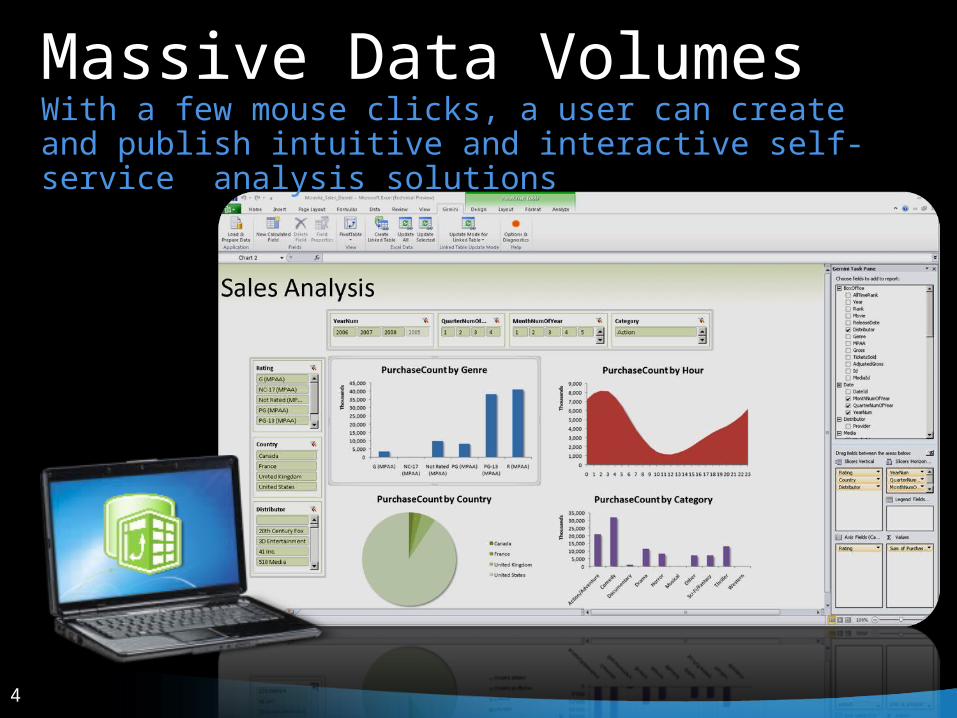
Massive Data VolumesWith a few mouse clicks, a user can create and publish intuitive and interactive self-service analysis solutions
6
1. Analysing Massive Data Volumes Using PowerPivot
2. Slicer as a Better Filter
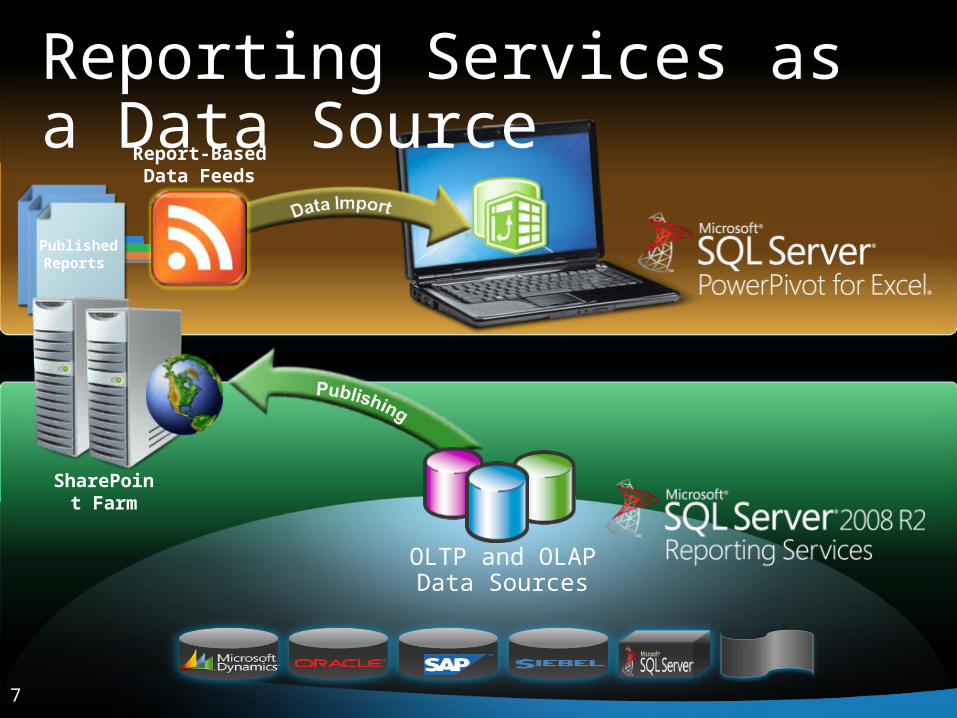
77
Published
Reports
SharePoint Farm
Report-Based
Data Feeds
OLTP and OLAP Data Sources
Reporting Services as a Data Source
8
1. Report as a Data Source for Analysis
99
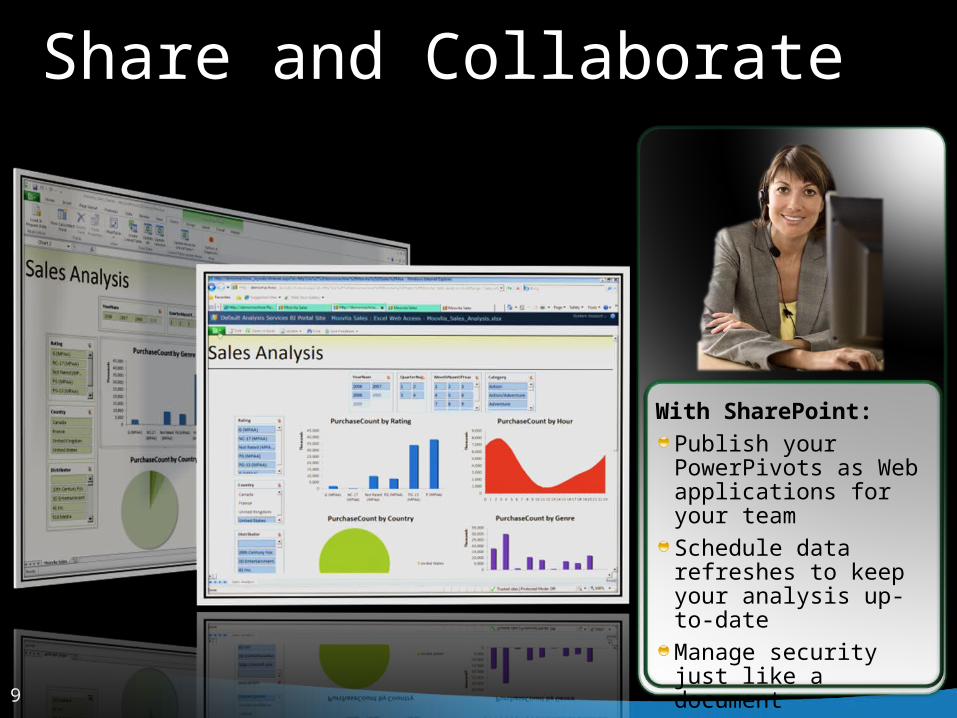
Share and Collaborate
With SharePoint:Publish your PowerPivots as Web applications for your teamSchedule data refreshes to keep your analysis up-to-dateManage security just like a document
1010
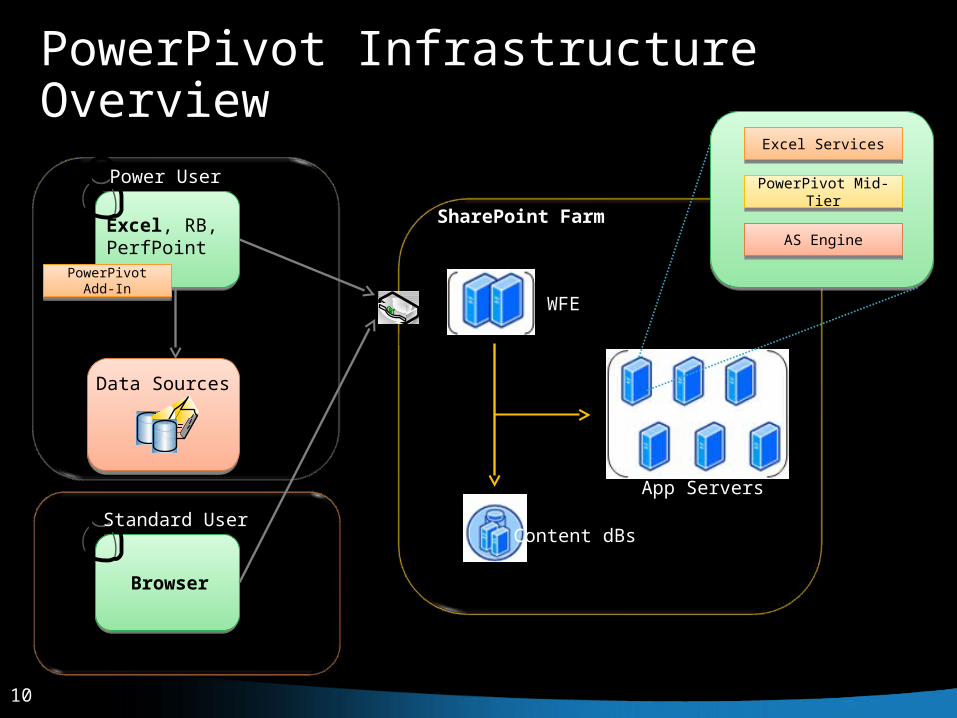
PowerPivot Infrastructure Overview
SharePoint Farm
WFE
App Servers
Content dBs
NLB
Excel, RB, PerfPoint
Power User
Data Sources
Excel ServicesExcel Services
PowerPivot Mid-TierPowerPivot Mid-Tier
AS EngineAS Engine
Browser
Standard User
PowerPivot Add-InPowerPivot Add-In
1111
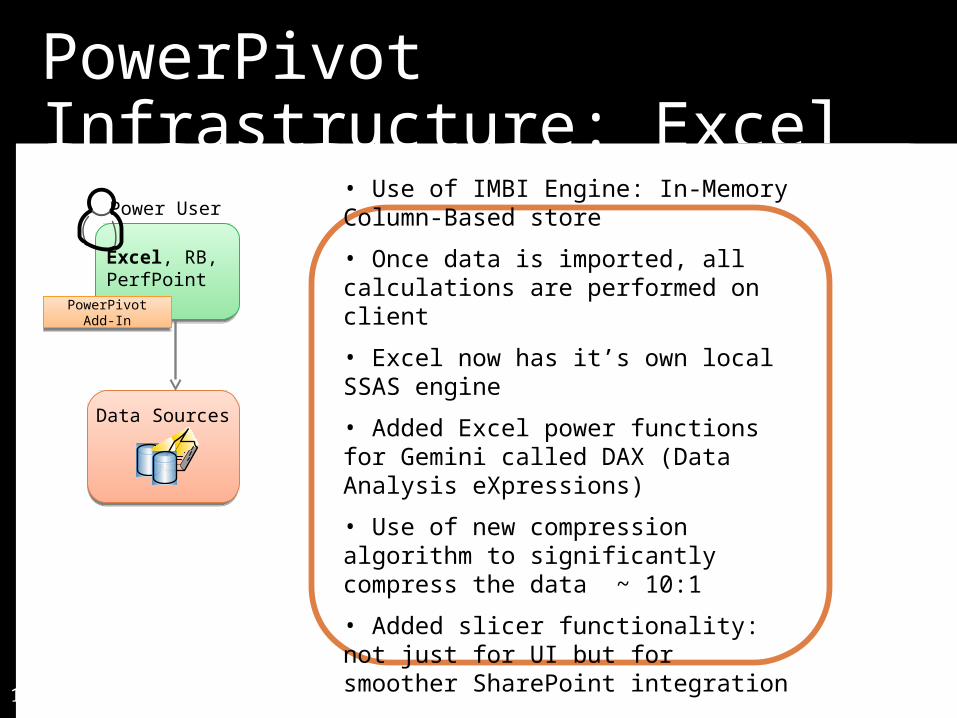
PowerPivot Infrastructure: Excel
SharePoint Farm
WFE
App Servers
Content dBs
NLB
Excel ServicesExcel Services
Gemini Mid-TierGemini Mid-Tier
Gemini EngineGemini Engine
Browser
Standard User
Excel, RB, PerfPoint
Power User
Data Sources
• Use of IMBI Engine: In-Memory Column-Based store
• Once data is imported, all calculations are performed on client
• Excel now has it’s own local SSAS engine
• Added Excel power functions for Gemini called DAX (Data Analysis eXpressions)
• Use of new compression algorithm to significantly compress the data ~ 10:1
• Added slicer functionality: not just for UI but for smoother SharePoint integration
PowerPivot Add-InPowerPivot Add-In
1212
Excel, RB, PerfPoint
Power User
Data Sources
Browser
Standard User
SharePoint Farm
WFE
App Servers
Content dBs
NLB
Excel ServicesExcel Services
PowerPivot Mid-Tier
PowerPivot Mid-Tier
AS EngineAS Engine
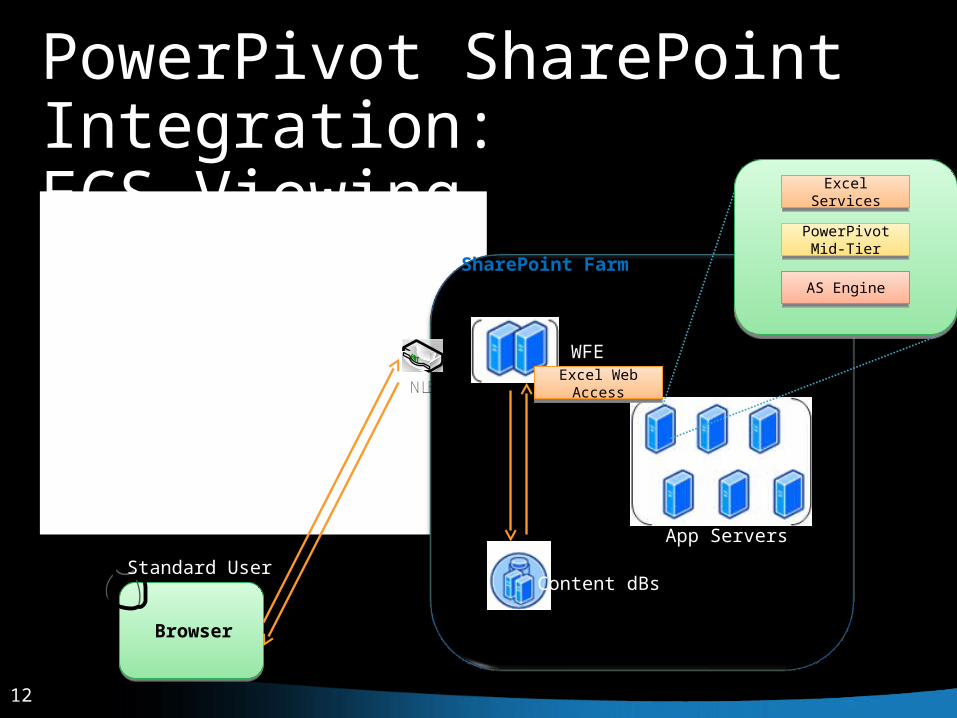
PowerPivot SharePoint Integration: ECS Viewing
Excel Web AccessExcel Web Access
1313
Excel, RB, PerfPoint
Power User
Data Sources
Browser
Standard User
SharePoint Farm
WFE
App Servers
Content dBs
NLB
Excel ServicesExcel Services
PowerPivot Mid-Tier
PowerPivot Mid-Tier
AS EngineAS Engine
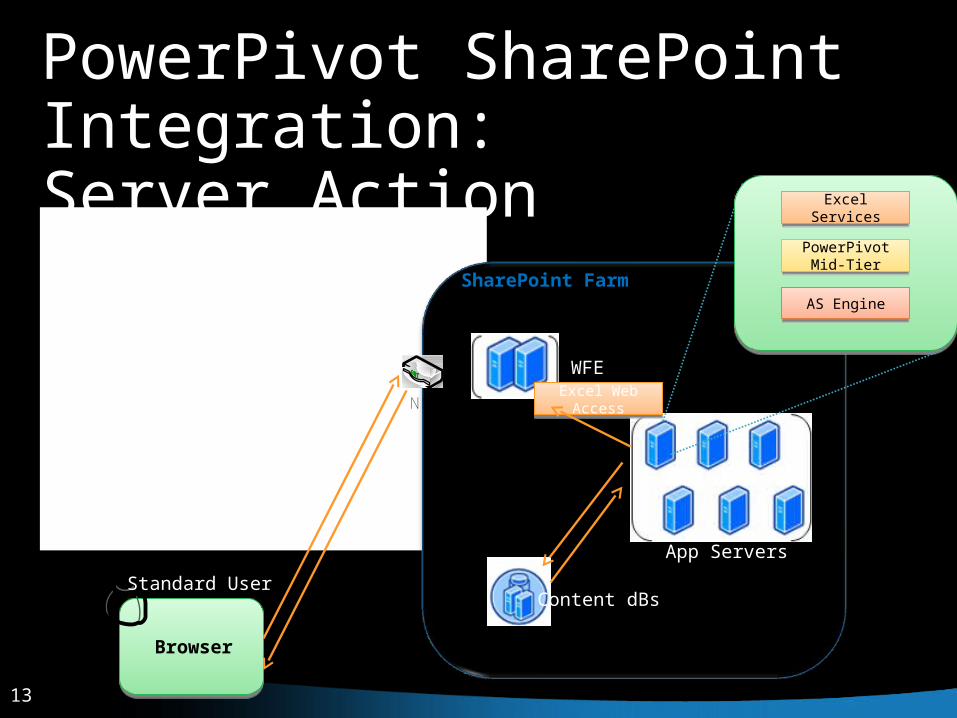
PowerPivot SharePoint Integration: Server Action
Excel Web AccessExcel Web Access
1414
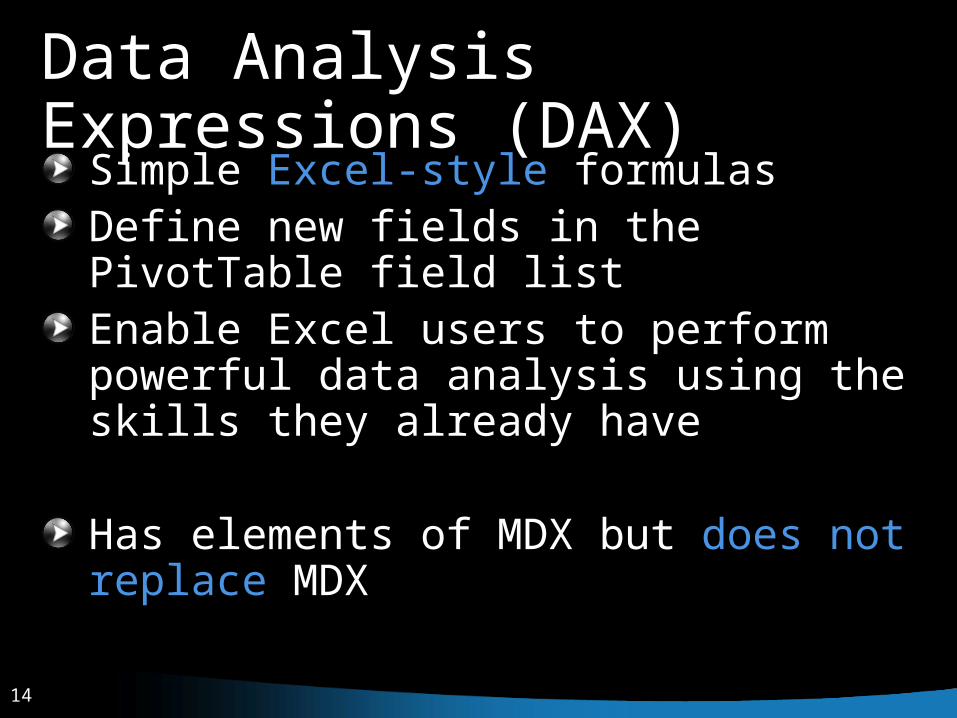
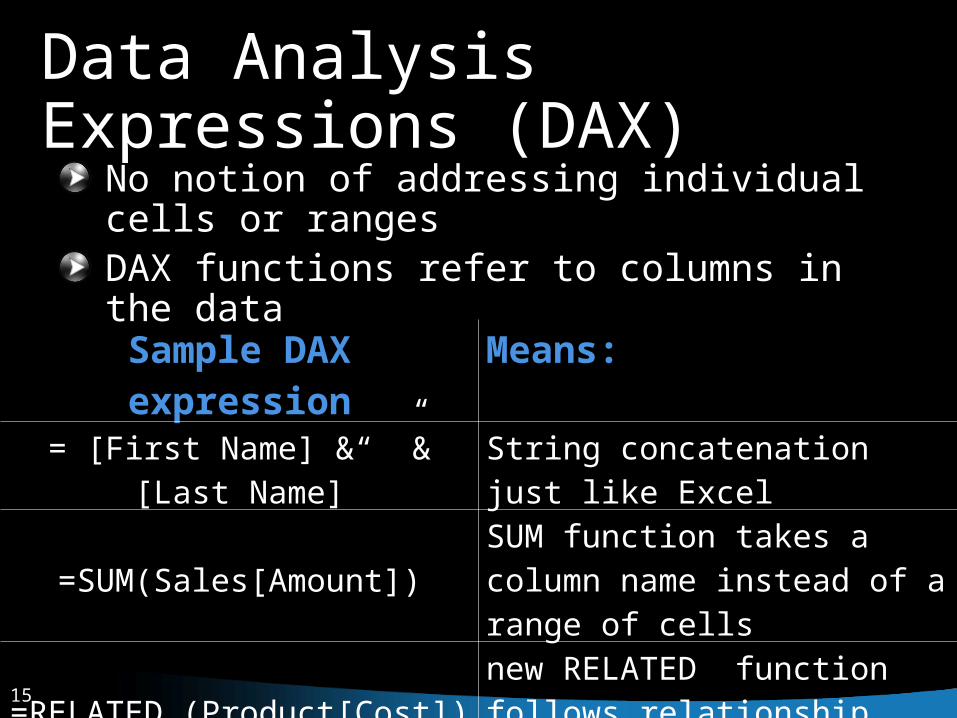
Data Analysis Expressions (DAX)
Simple Excel-style formulas Define new fields in the PivotTable field list Enable Excel users to perform powerful data analysis using the skills they already have
Has elements of MDX but does not replace MDX
1515
Data Analysis Expressions (DAX)
No notion of addressing individual cells or rangesDAX functions refer to columns in the data
Sample DAX expression Means:= [First Name] &“ ”& [Last Name] String concatenation just like Excel
=SUM(Sales[Amount])SUM function takes a column name instead of a range of cells
=RELATED (Product[Cost])new RELATED function follows relationship between tables
1616
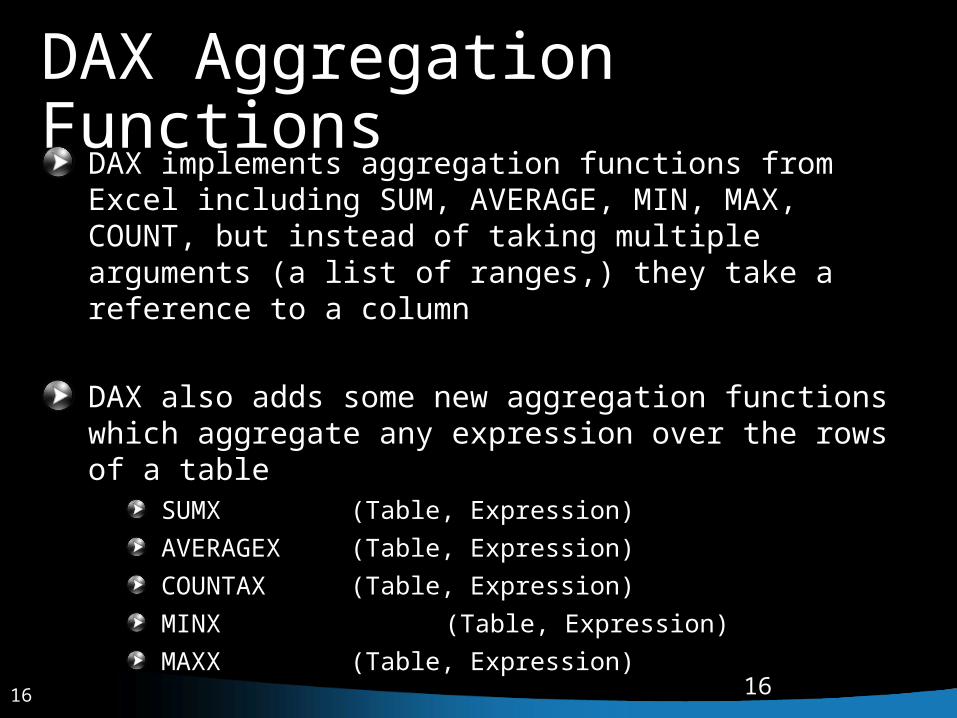
DAX Aggregation FunctionsDAX implements aggregation functions from Excel including SUM, AVERAGE, MIN, MAX, COUNT, but instead of taking multiple arguments (a list of ranges,) they take a reference to a column
DAX also adds some new aggregation functions which aggregate any expression over the rows of a table
SUMX (Table, Expression)AVERAGEX (Table, Expression)COUNTAX (Table, Expression)MINX (Table, Expression)MAXX (Table, Expression)
16
1717
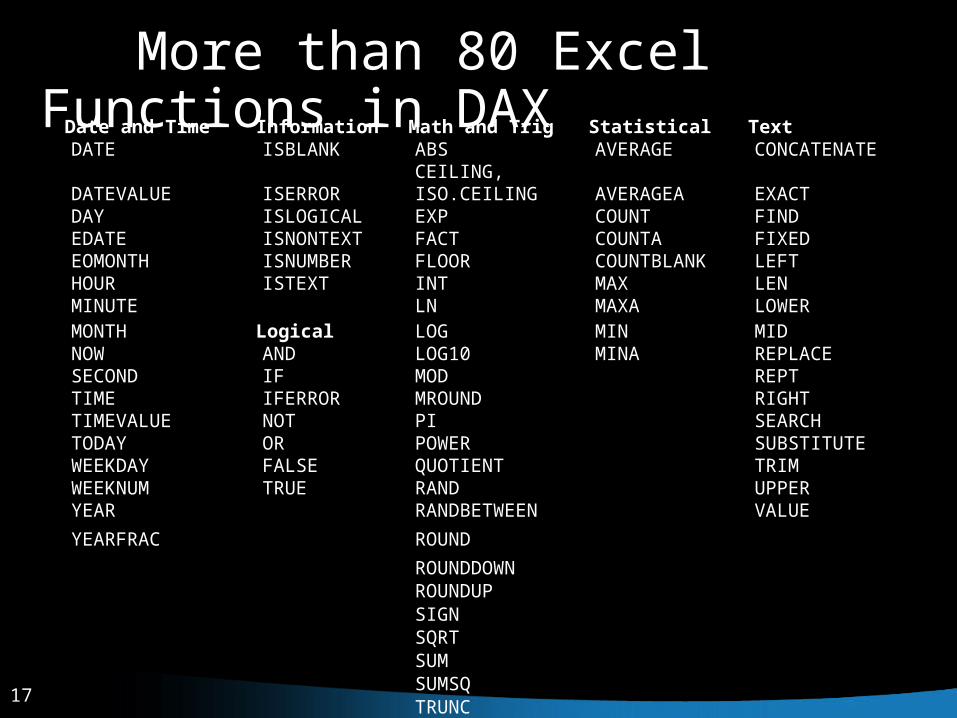
More than 80 Excel Functions in DAXDate and Time Information Math and Trig Statistical TextDATE ISBLANK ABS AVERAGE CONCATENATEDATEVALUE ISERROR CEILING, ISO.CEILING AVERAGEA EXACTDAY ISLOGICAL EXP COUNT FINDEDATE ISNONTEXT FACT COUNTA FIXEDEOMONTH ISNUMBER FLOOR COUNTBLANK LEFTHOUR ISTEXT INT MAX LENMINUTE LN MAXA LOWERMONTH Logical LOG MIN MIDNOW AND LOG10 MINA REPLACESECOND IF MOD REPTTIME IFERROR MROUND RIGHTTIMEVALUE NOT PI SEARCHTODAY OR POWER SUBSTITUTEWEEKDAY FALSE QUOTIENT TRIMWEEKNUM TRUE RAND UPPERYEAR RANDBETWEEN VALUE
YEARFRAC ROUND
ROUNDDOWNROUNDUPSIGNSQRTSUMSUMSQTRUNC
1818
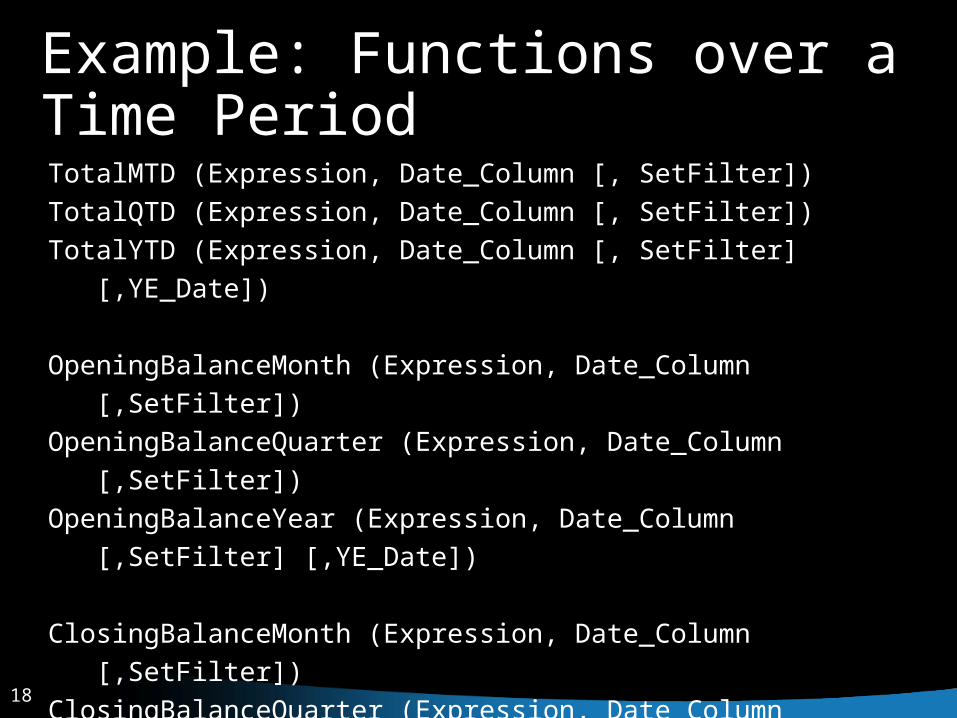
Example: Functions over a Time Period TotalMTD (Expression, Date_Column [, SetFilter])TotalQTD (Expression, Date_Column [, SetFilter])TotalYTD (Expression, Date_Column [, SetFilter] [,YE_Date])
OpeningBalanceMonth (Expression, Date_Column [,SetFilter])OpeningBalanceQuarter (Expression, Date_Column [,SetFilter])OpeningBalanceYear (Expression, Date_Column [,SetFilter] [,YE_Date])
ClosingBalanceMonth (Expression, Date_Column [,SetFilter])ClosingBalanceQuarter (Expression, Date_Column [,SetFilter]) ClosingBalanceYear (Expression, Date_Column [,SetFilter] [,YE_Date])

19
1. Simplicity of DAX to Relate and Analyse Data
20
Data Mining
2121
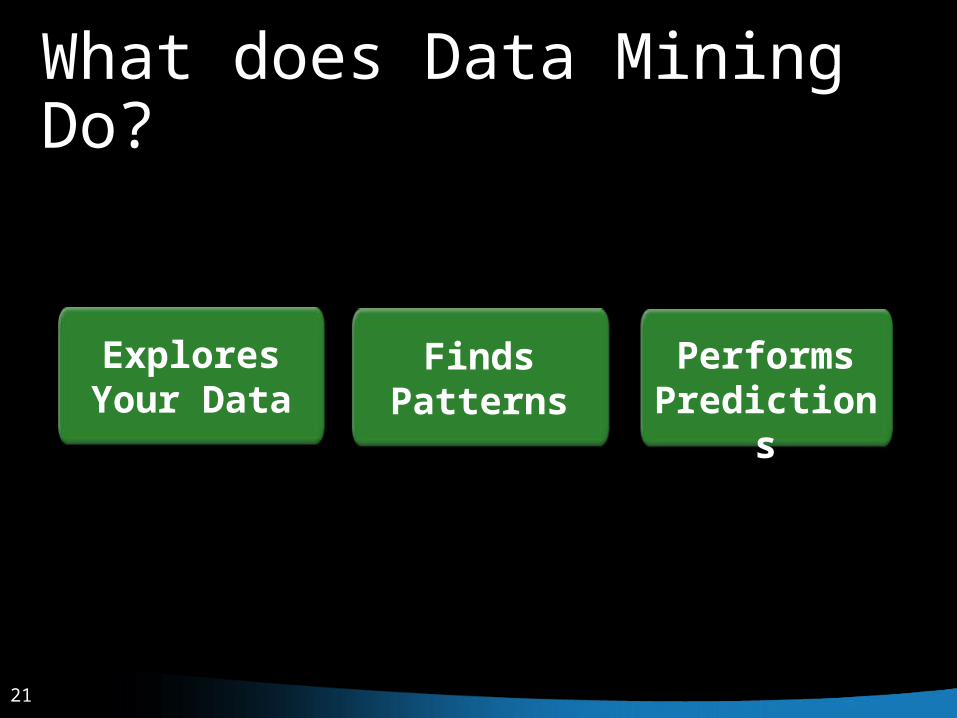
What does Data Mining Do?
Explores Your Data
Finds Patterns
Performs Predictions
2222
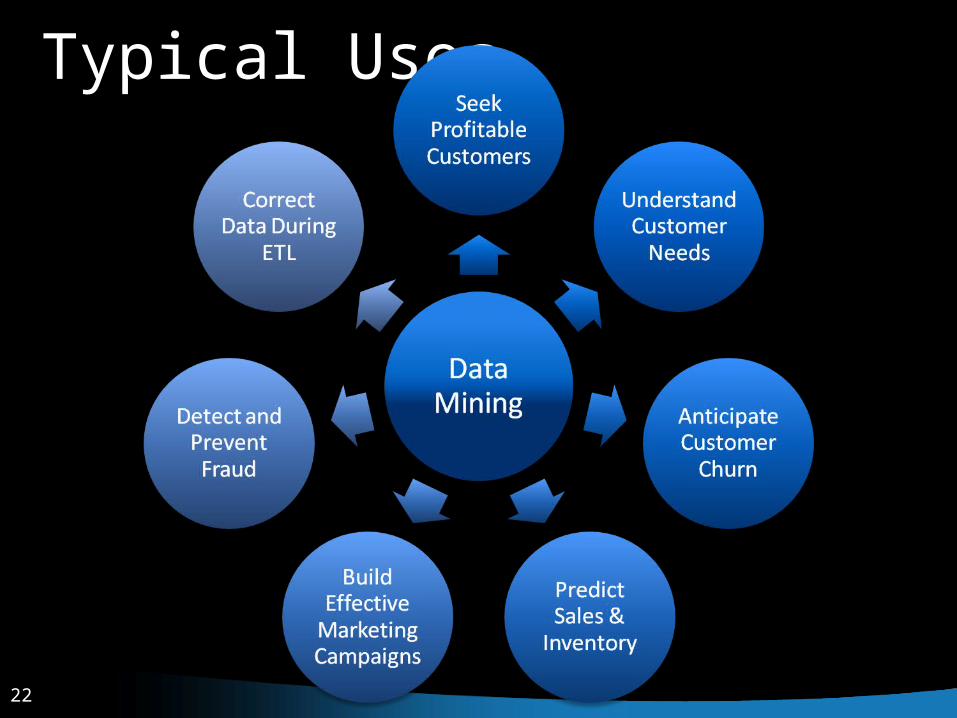
Typical Uses
2323
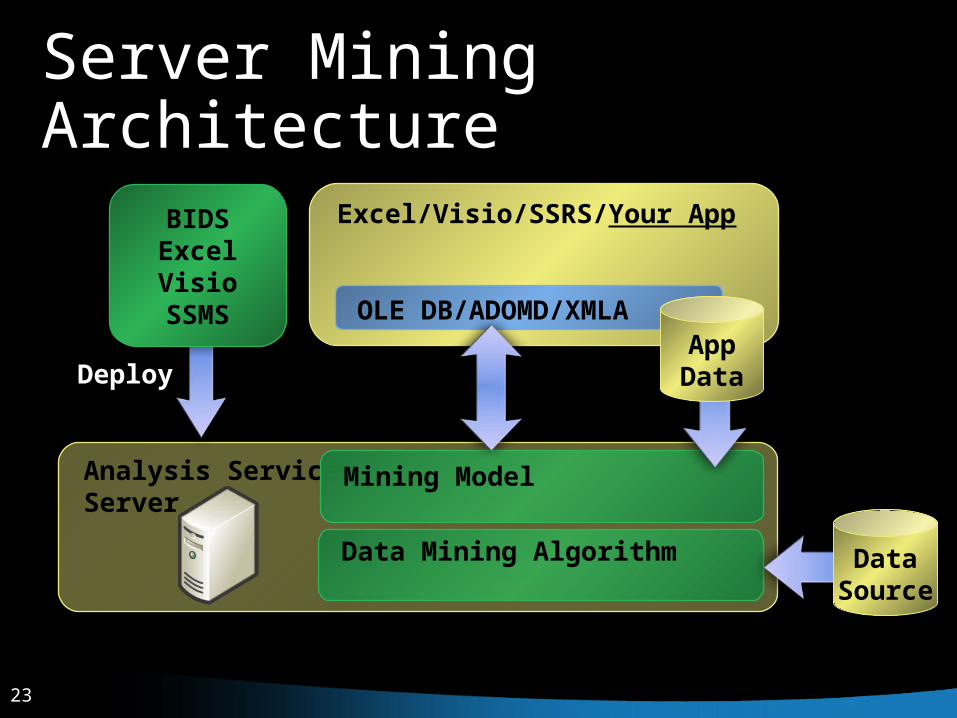
Analysis ServicesServer
Mining Model
Data Mining Algorithm DataSource
Server Mining Architecture
Excel/Visio/SSRS/Your App
OLE DB/ADOMD/XMLA
Deploy
BIDSExcelVisioSSMS
AppData
2424
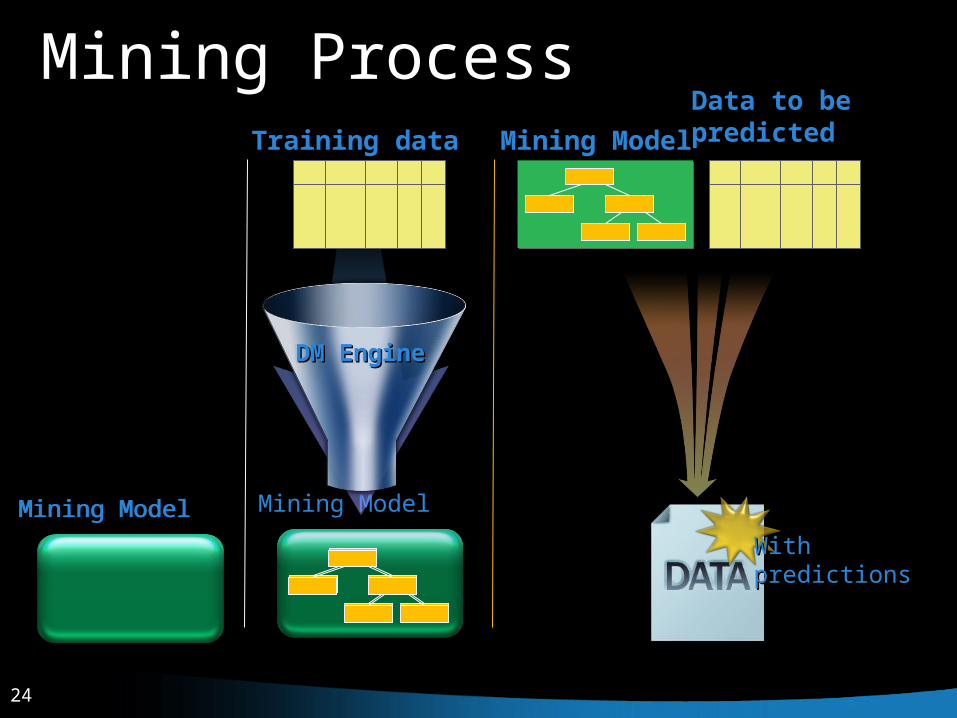
Mining Model Mining ModelMining ModelMining Model
Mining Process
DM EngineDM EngineDM EngineDM Engine
Training dataTraining data
Data to be Data to be predictedpredictedMining ModelMining Model
With With predictionspredictions
25
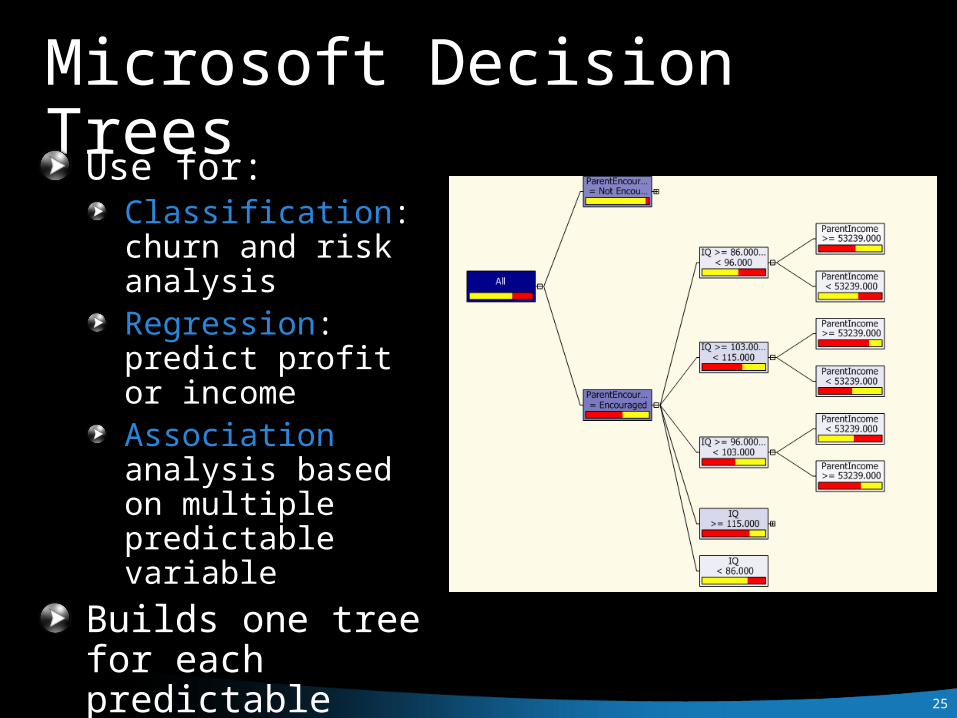
Microsoft Decision TreesUse for:
Classification: churn and risk analysisRegression: predict profit or income Association analysis based on multiple predictable variable
Builds one tree for each predictable attributeFast
26
1. Decision Trees for Classification of Customers’ Buying Potential
2727
Profitability and Risk
Finding what makes a customer profitable is also classification or regressionTypically solved with:
Decision Trees (Regression), Linear Regression,and Neural Networks or Logistic Regression
Often used for predictionImportant to predict probability of the predicted, or expected profit
Risk scoringLogistic Regression and Neural Networks
2828
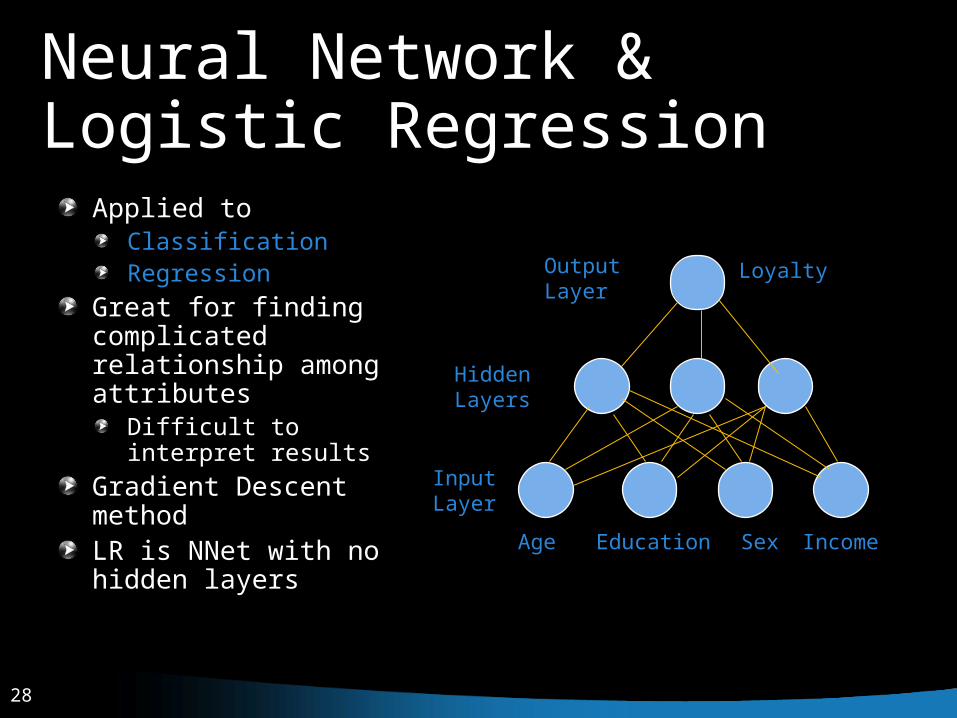
Neural Network & Logistic Regression
Applied toClassificationRegression
Great for finding complicated relationship among attributes
Difficult to interpret resultsGradient Descent methodLR is NNet with no hidden layers
Age Education Sex Income
Input Layer
Hidden Layers
Output Layer
Loyalty

29
1. Neural Networks for Predicting Lending Risk
30
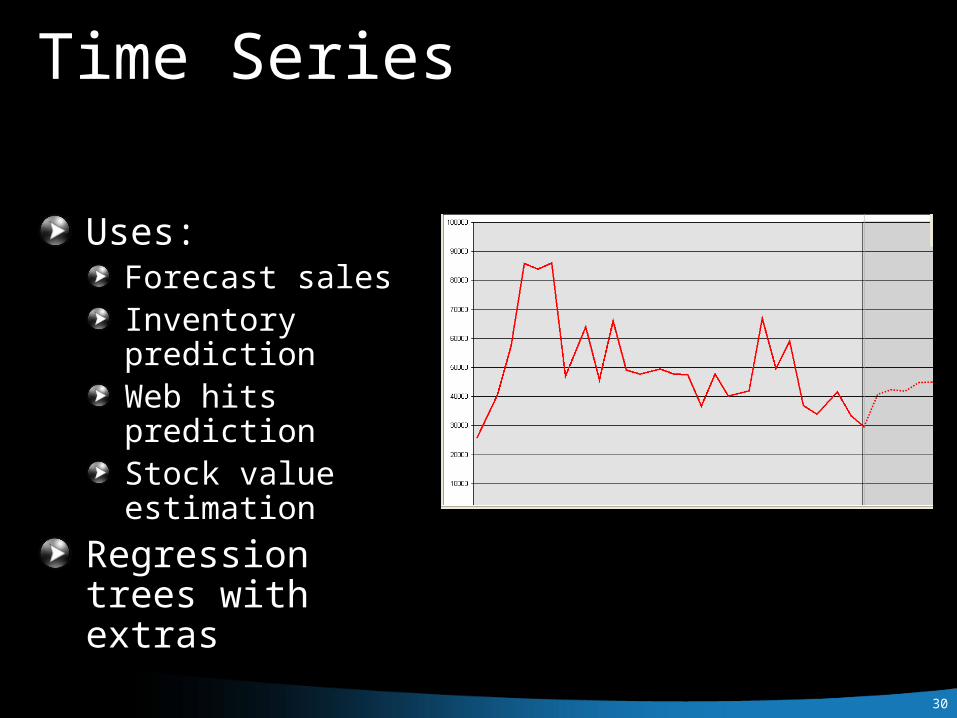
Time Series
Uses:Forecast salesInventory predictionWeb hits predictionStock value estimation
Regression trees with extras
31
1. Foerecasting Sales with Time Series
3232
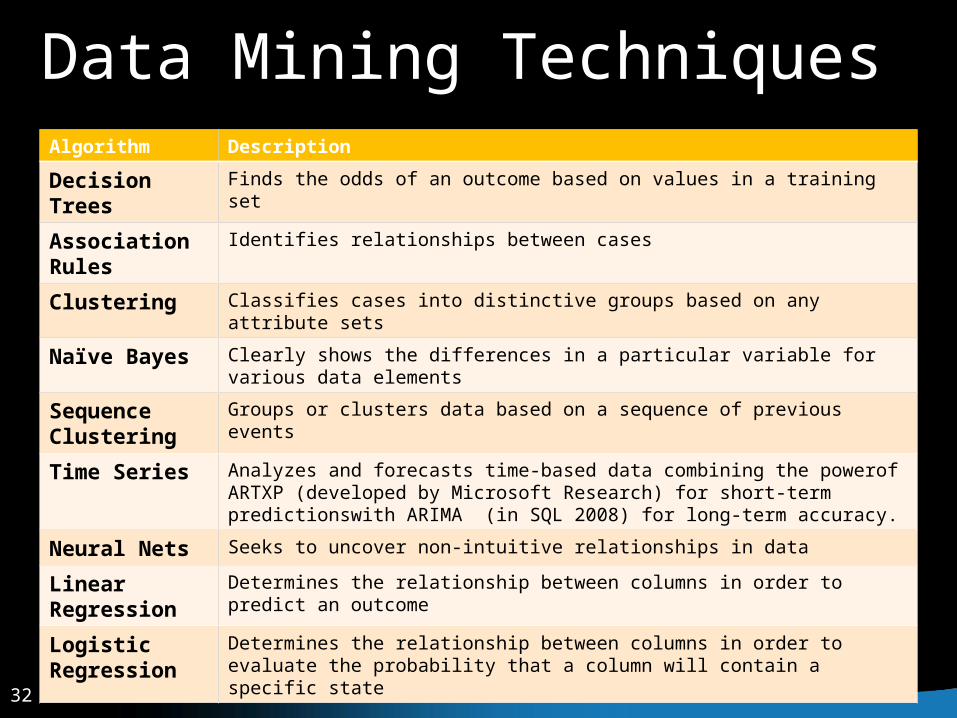
Data Mining TechniquesAlgorithm Description
Decision Trees Finds the odds of an outcome based on values in a training set
Association Rules Identifies relationships between cases
Clustering Classifies cases into distinctive groups based on any attribute sets
Naïve Bayes Clearly shows the differences in a particular variable for various data elements
Sequence Clustering
Groups or clusters data based on a sequence of previous events
Time Series Analyzes and forecasts time-based data combining the powerof ARTXP (developed by Microsoft Research) for short-term predictionswith ARIMA (in SQL 2008) for long-term accuracy.
Neural Nets Seeks to uncover non-intuitive relationships in data
Linear Regression Determines the relationship between columns in order to predict an outcome
Logistic Regression
Determines the relationship between columns in order to evaluate the probability that a column will contain a specific state
3434
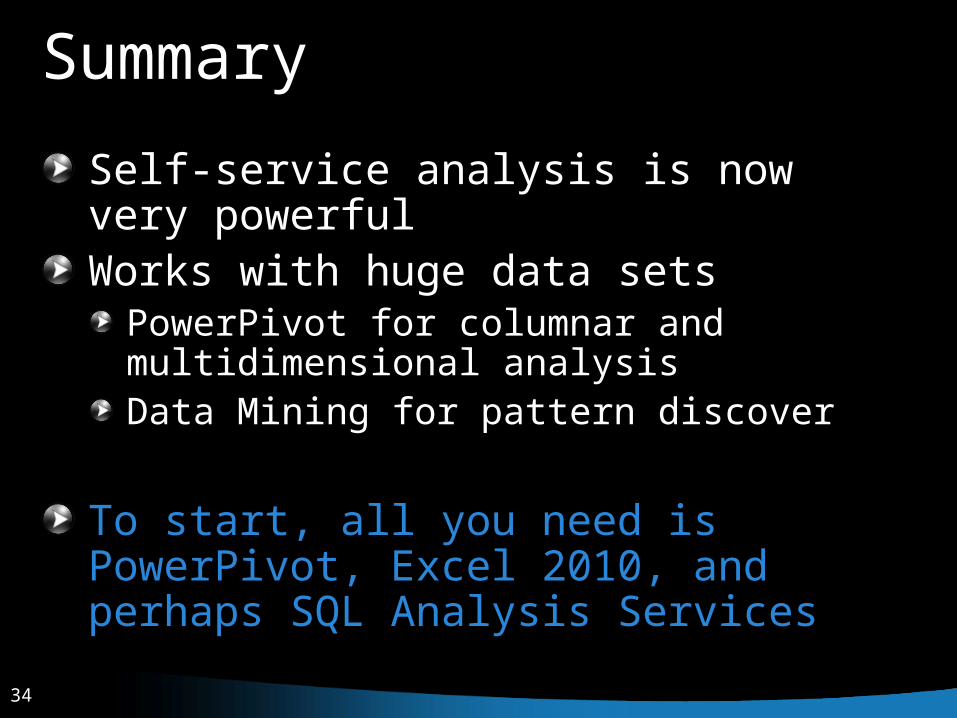
Summary
Self-service analysis is now very powerfulWorks with huge data sets
PowerPivot for columnar and multidimensional analysisData Mining for pattern discover
To start, all you need is PowerPivot, Excel 2010, and perhaps SQL Analysis Services
3535
© 2010 Microsoft Corporation & Project Botticelli Ltd. All rights reserved.
The information herein is for informational purposes only and represents the opinions and views of Project Botticelli and/or Rafal Lukawiecki. The material presented is not certain and may vary based on several factors. Microsoft makes no warranties, express, implied or statutory, as to the information in this presentation.
Portions © 2010 Project Botticelli Ltd & entire material © 2010 Microsoft Corp. Some slides contain quotations from copyrighted materials by other authors, as individually attributed or as already covered by Microsoft Copyright ownerships. All rights reserved. Microsoft, Windows, Windows Vista and other product names are or may be registered trademarks and/or trademarks in the U.S. and/or other countries. The information herein is for informational purposes only and represents the current view of Project Botticelli Ltd as of the date of this presentation. Because Project Botticelli & Microsoft must respond to changing market conditions, it should not be interpreted to be a commitment on the part of Microsoft, and Microsoft and Project Botticelli cannot guarantee the accuracy of any information provided after the date of this presentation. Project Botticelli makes no warranties, express, implied or statutory, as to the information in this presentation. E&OE.