1 2 10.2% - energies renouvelables
TRANSCRIPT

21
bio
ga
s ba
ro
met
er
bio
ga
s ba
ro
met
er
biogas baRoMeTeR – EUROBSERV’ER – noveMbeR 2014 biogas baRoMeTeR – EUROBSERV’ER – noveMbeR 2014
10.2%Biogas primary energy production growth in 2013.
biogasbarometer
the expansion of biogas energy usage has continued across the european Union. according to eurobser v ’er, about 13. 4 million tonnes oil
equivalent (mtoe) of biogas primary energy were produced during 2013, which is 1.2 mtoe more than in 2012 representing a 10.2% growth. However, the biogas sector’s momentum was more sluggish than in 2012 (16.9% between 2011 and 2012, giving an additional 1.8 mtoe) and it is expected to lose some of its impetus in 2014 in a number of countries whose sector expansion controlling policy changes will limit the future use of energy crops.
52.3 tWhof biogas electricity produced in 2013
in the European Union.
13.4 mtoeof biogas primary energy produced in 2013
in the European Union.
A study carried out by EurObserv’ER.
vel
tec
bio
po
wer
the biomethane refinery in Könnern, germany, is supplied by nearly 30 farmers, who bring 120 000 tons of biomass. the production is about 15 millions of m³ of biomethane per year.

43
bio
ga
s ba
ro
met
er
bio
ga
s ba
ro
met
er
biogas barometer – EUROBSERV’ER – november 2014 biogas barometer – EUROBSERV’ER – november 2014
Anaerobic digesters specially desi-
gned to recover energy produce
most of the biogas across the Euro-
pean Union. The plants come in different
types and sizes ranging from small anae-
robic digesters on farms, larger co-diges-
tion (or multi-product) plants and house-
hold waste methane production plants.
Their feedstock (raw materials) is typi-
cally slurry, farming waste, green waste,
food-processing waste and domestic
refuse but the facilities can also use culti-
vated farm crops such as intermediate
crops (crucifers, grasses, etc.), and other
energy crops (maize, etc.), to optimize
the methanisation reaction by introdu-
cing carbon. The umbrella term “other
biogas” covers the output of these ins-
tallations for the sake of convenience, to
distinguish it from the biogas produced
by wastewater treatment plants that pro-
duce methane from sewage sludge only
and from landfill biogas whose output
is directly captured inside the landfills
rather than being produced by an indus-
trial plant.
The eU prodUced 13.4 mToe of biogas in 2013
In 2013, biogas energy output, put at
almost 13.4 Mtoe, again enjoyed two-
digit growth (10.2% up on 2012). However
the sector confirmed the loss of impetus
sparked by the biogas policy changes
of the European Union’s two main pro-
ducer countries, Germany and Italy (see
below). The decline started in 2012 jud-
ging from the fact that the 21.7% growth
rate between 2010 and 2011 dropped to
16,9% between 2011 and 2012.
For many years, “other biogas” has domi-
nated the distribution of the European
Union’s primary biogas energy output
(table 1 and graph 1). EurObserv’ER puts
its share at 69.0% of EU output in 2013,
a long way ahead of landfill biogas at
21.6%, and wastewater treatment biogas
at 9.4%. Yet this “other biogas” category
does not universally hold the largest
share across the Member States. It tends
to predominate in those countries, pri-
marily Germany, Italy, Austria and the
Czech Republic that have developed an
industrial methanisation sector. Landfill
biogas can also dominate the breakdown
(as is the case in the UK, France, Spain,
Portugal and Ireland) while wastewater
treatment biogas seldom prevails (Swe-
den and Poland).
Biogas is a renewable energy that can be
recovered in different ways, most com-
monly as electricity and heat through
cogeneration (tables 2 and 3). As it stands,
electricity production is the main biogas
energy recovery form regardless of whe-
ther or not it is produced through coge-
neration. In 2013, output stood at about
52.3 TWh (which equates to 4 499 ktoe of
final energy), which is a 12.7% increase
over 2012. Heat sold to district heating
networks increased to 432. 4 ktoe in
2013, which represents 22.4% year-on-
year growth. Self-consumed heat (used
directly on the production sites), is put
at a further 2 010 ktoe in 2013 – a 4.6%
increase on 2012).
If there are outlets close to the methani-
sation plant, the biogas can be fully har-
nessed with maximum energy efficiency
to produce heat. It can also be refined
into biomethane so that it can be put to
use in the same way as natural gas, in
the form of electricity in cogeneration
plants, but also as biofuel for natural gas-
powered vehicles (NGVs) or even injected
into the natural gas grid. Grid injection
offers advantages since it enables the
biomethane to be stored at lower cost
and postpone its use until required, but
this comes with the proviso that the faci-
lity must be sited close to a natural gas
grid to keep grid access costs down. Bio-
methane storage on the production site
is feasible but technically more compli-
cated and expensive to implement. The
advantage for operators is that they can
play a part in balancing the grid while
waiting for the right time in the supply
and demand cycle to sell their electricity
at the best price. Policies discussed for
example in Germany for the creation of
capacity power markets may pave the
way for the expansion of this option.
Biomethane is on the up and up
Biomethane production is primarly gai-
ning in popularity with the countries of
the European Union, because it enables
them to reduce their reliance on natural
gas imports. On the basis of various stu-
dies such as the final 2014 report of the
European Green Gas Grid project, the IEA
Bioenergy Biomethane study published
in September 2014 and the DENA (German
Energy Agency) biomethane barometer,
EurObserv’ER found at least 258 biome-
thane plants in service in the European
Union at the end of June 2014 in just
12 member countries.
The countries most involved in bio -
m e t ha n e p r o du c t io n a r e G e r ma ny
(151 plants), Sweden (53 plants), the
Netherlands (23 plants), Austria (10 plants),
Finland (6 plants) and the small country
Luxembourg (3 plants). More recently
the UK (4 plants), France (3 plants), Italy
(2 plants), Denmark (1 plant), Hungary
(1 plant) and Croatia (1 plant) have become
involved and offer considerable develop-
ment potential. Most of the output from
these plants is intended for grid injec-
tion but could also be used on site when
required. Other countries only use their
output on their sewage treatment sites
to produce electricity and heat or use it as
biofuel. This applies in particular to most
of Sweden’s sewage treatment plants
(only 11 plants inject biomethane into the
grid) and also to Finland, Italy, Croatia and
Hungary.
Germany’s biomethane output dwarfs the
rest of the European Union’s. According
to the DENA biomethane sector barome-
ter, Germany already had 151 biomethane
plants at the end of June 2014 (146 at the
end of 2013) with production capacity of
around 93 650 Nm3/h (normal cubic metres
per hour). The Federal grid agency (Bun-
desnetzagentur) says that the amount of
biomethane injected into Germany’s natu-
ral gas grid has practically doubled since
2011. It has risen from 275 million Nm3 in
2011 (i.e. 256 084 toe), to 413 million Nm3 in
2012 (384 591 toe), then to 520 million Nm3
in 2013 (484 230 toe). Biomethane now
accounts for 7.2% of Germany’s primary
biogas energy output. Now most of these
plants operate using a large proportion
of energy crops. According to DENA, the
breakdown of materials used by quantity
(tonnes of “fresh” matter) for producing
biomethane in 2013 was 59.6% maize,
16.3% other energy crops, 12.3% slurry,
7.9% miscellaneous organic waste and
3.9% harvest residues.
Biomethane production is also increasing
sharply in other countries. In the Nether-
lands, Statistics Netherlands claims that
it increased by 70.3% between 2012 and
2013 to reach 35 600 toe, or 11.8% of the
country’s primary biogas energy output.
In Austria, biomethane output reached
More than 14 000 methanisation plants in Europe
Methanisation is a waste treatment and energy recovery process. It produces
gas, called biogas, primarily composed of methane (50-70%) and carbon
dioxide. The reaction also produces a digester’s sludge that can be harvested
as an agricultural fertilizer. Anaerobic digesters process different types of
organic feedstock, liquid and solid waste and also plants that optimize their
processing and yield. A European Biogas Association (EBA) report claims that in
2012 13 800 anaerobic digesters were in service in Europe (the European Union
+ Switzerland) with about 7 400 MW of electricity generating capacity. By the
end of 2013, the 14 000 anaerobic digester threshold had been left far behind,
with Germany alone having installed 335 additional facilities over the year.
The sustainability requirements of biogas called into question
The biogas and biomethane production conditions are at the centre of heated negotiations at European Union level. On
28 July, the European Commission published a working document on the sustainability of solid and gaseous biomass used
for electricity, heating and cooling. In the section on biogas, the report highlighted the environmental issues stemming
from the use of energy crops and encouraged the use of a higher percentage of manure, slurry and other organic waste to
improve the greenhouse gas emission performance of biogas installations. The report’s main line is that the percentage
reduction in greenhouse gas emissions from bioenergy such as biogas should be at least 70% less than fossil fuels, which is
a higher target than 60% target actually defined by the Directive to come into effect from 1 January 2018 (for installations
that start producing in January 2017). The sector feels that this percentage will be very hard to achieve, especially for
biomethane production whose greenhouse gas emission performance levels would be measured in comparison with natural
gas, applying the new European Commission-proposed method, and no longer against the mean European fossil energy
mix excluding fuel that was previously used and more advantageous. However, a JRC (Joint Research Centre) report that
accompanies the document, reckons that this target can be achieved provided certain production conditions apply with a
100% organic waste pathway or a co-digestion blend of 70% slurry to 30% maize. Negotiations between the stakeholders
over the wording of a draft directive being prepared for presentation to the European Parliament and European Council are
expected to be tough. The European Commission has already warned that no draft directive on these sustainability criteria
would be expected before 2020.
bio
gen
20
14 w
ww
.bio
gen
.co
.uk
the Westwood aD plant in Northamptonshire, UK, processes 65 000 tons of food waste per year to produce power injected into the grid.
65
bio
ga
s ba
ro
met
er
bio
ga
s ba
ro
met
er
biogas barometer – EUROBSERV’ER – november 2014 biogas barometer – EUROBSERV’ER – november 2014
Tabl. n° 1Primary energy production of biogas in the European Union in 2012 and 2013* (in ktoe)
2012 2013*
CountryLandfill
gasSewage
sludge gas(1)
Others biogas(2) Total
Landfill gas
Sewage sludge gas(1)
Others biogas(2) Total
Germany 123.7 372.1 5920.4 6 416.2 108.8 392.8 6 215.3 6 716.8
United Kingdom** 1 533.9 269.7 0.0 1 803.6 1 538.2 286.2 0.0 1 824.4
Italy 370.6 42.0 766.1 1 178.8 410.8 48.5 1 356.1 1 815.4
Czech Republic 31.7 39.4 303.8 374.9 28.9 39.6 502.5 571.1
France** 279.1 79.6 53.3 412.0 280.0 80.0 105.0 465.0
Netherlands 29.9 53.1 214.5 297.5 24.6 57.8 220.3 302.8
Spain** 140.8 33.8 116.2 290.8 124.0 29.8 102.4 256.1
Poland 53.7 79.3 60.8 193.8 61.8 91.2 98.2 251.2
Austria 3.8 18.2 184.3 206.4 3.7 18.4 174.6 196.8
Belgium** 32.4 17.2 108.0 157.7 29.2 15.5 97.2 141.9
Sweden** 12.6 73.6 40.6 126.8 13.6 79.3 43.7 136.6
Denmark** 5.6 21.2 77.9 104.7 5.3 20.3 74.4 100.0
Greece 69.4 15.8 3.4 88.6 67.5 16.1 4.8 88.4
Hungary 14.3 18.7 46.8 79.8 14.3 20.1 47.8 82.2
Slovakia 3.1 13.8 45.1 62.0 3.4 14.8 48.5 66.6
Portugal 54.0 1.7 0.7 56.4 61.8 2.7 0.8 65.3
Finland 31.6 13.9 12.4 57.9 31.7 14.6 13.2 59.5
Ireland** 43.0 7.5 5.4 55.9 43.1 7.5 5.4 56.0
Latvia** 18.4 5.7 27.8 51.9 18.4 5.7 27.9 52.0
Slovenia 6.9 3.1 28.2 38.1 7.1 2.8 24.8 34.7
Romania** 1.4 0.1 25.9 27.3 1.5 0.1 28.4 30.0
Croatia 2.0 3.1 11.4 16.6 2.1 3.2 12.8 18.0
Lithuania 6.1 3.1 2.3 11.6 7.1 3.6 4.8 15.5
Luxembourg 0.1 1.3 12.0 13.4 0.1 1.3 11.4 12.8
Cyprus 0.0 0.0 11.4 11.4 0.0 0.0 12.0 12.0
Estonia** 2.2 0.7 0.0 2.9 5.4 1.8 0.0 7.2
Bulgaria 0.0 0.0 0.1 0.1 0.0 0.0 0.1 0.1
Malta 0.0 0.0 0.0 0.0 0.0 0.0 0.0 0.0
EU 2 870.3 1 187.8 8 079.0 12 137.1 2 892.3 1 253.6 9 232.7 13 378.7
(1) Urban and industrial. (2) Decentralised agricultural plant, municipal solid waste methanisation plant, centralised co-digestion plant.
*First estimations. **Whenever the information was not available, the breakdown between the different types of biogas was estimated by EurObserv’ER
for the year 2013 on the basis of the breakdown observed in 2012. Source: EurObserv’ER 2014.
4 729 toe in 2013 (55 GWh), according to
the Association of gas suppliers and hea-
ting networks, and the connection of two
new plants drove output up to 3 009 toe
(35 GWh) over the first 4 months of the
year. In Finland, the biogas sector is almost
purely driven by transport. According the
Finnish biogas association, Biomethane
consumption in transport increased by
168% in 2013 compared the previous year,
to 2 820 toe (32.8 GWh). In France, a specific
Feed-in Tariff for biomethane injection
has been introduced and a tendering sys-
tem is soon to be rolled out, raising expec-
tations for the fortunes of its fledgling
injected biomethane sector.
One of the biogas sector’s ambitions is to
form a European biomethane market that
would stimulate the production, exchange
and use of biomethane. Six national bio-
methane registers (in Austria, Denmark,
France, Germany, Switzerland and the
UK), that can provide biomethane grid
injection flow traceability right through to
its end use (quality, injected volume), are
cooperating to set up common standards
and strengthen the European statutory
framework to set up this market. They aim
to harmonize the national registers and
create the conditions for mutual accep-
tance and recognition of biomethane gua-
rantees of origin.
news from around the main producer countries
About-face for biogas policy in GermanyThe new renewable energy law (EEG 2014)
came into force in Germany on 1 August
2014 and marks a turnaround for bio-
gas. Future production will be much less
geared to using energy crops. One of the
new law’s aims is to reduce the financial
cost of energy transition by slowing the
growth of the most expensive electricity-
generating sectors. Solid biomass and
biogas find themselves in the line of fire.
Under the terms of the new law, instal-
lations commissioned before 1 August
will continue to enjoy the rights acqui-
red through the previous law (EEG 2012)
and special arrangements are offered
to plants licensed since 24 January 2014.
One of the main measures of the new
law affecting biogas is the withdrawal
of the premium for using energy crops
(NawaRo-Bonus), to encourage the use
of organic and farming waste. Another
major upset is that to limit the remune-
ration of biogas installations, biogas
plants with capacity in excess of 100 kW
will henceforth only be eligible for finan-
cial support of up to 50% of their nominal
installation capacity.
The 20-year term for Feed-in Tariffs will
stay in force, but a quarterly 0.5% reduc-
tion will apply starting in 2016.
Another central point is that there will be
a restriction on the additional capacity
of biomass (including biogas) installa-
tions installed annually to 100 MW. Every
three months, a 1.27% reduction rate will
apply if the 100-MW limit is achieved over
the rolling 12-month reference period.
This quarterly reduction will be applied
until the 100 -MW ceiling is no longer
achieved over the reference period.
The new payment system is still more
generous to small installations that
t r a n s for m a gr icultur a l wa s t e . T h e
highest rate, which is € 0.2373 per kWh
only applies to <75 kW plants running on
slurry. The tariff payable to plants that
generate electricity from organic waste
is € 0.1526 per kWh for capacities up to
500 kW and € 0.1338 per kWh for capaci-
ties up to 20 MW. Biomass installations
generally (including biogas plants that
process other feedstock besides farming
residue or organic waste) will be paid a
new tariff of € 0.1366 per kWh for <150 kW
capacities, € 0.1178 per kWh for up to
500 kW, € 0.1055 per kWh for up to 5 MW
and € 0.0585 per kWh for up to 20 MW.
The Feed-in Tariffs for landfill biogas are
even lower in 2014... € 0.0834 per kWh for
up to 500 kW, and € 0.0571 per kWh for up
to 5 MW with a higher reduction rate of
1.5%. For its part sewage treatment plant
biogas is paid a Feed-in Tariff of € 0.0659
per kWh for up to 500 kW and € 0.0571 per
kWh for up to 5 MW with the same 1.5%
annual reduction rate
The setting of the 100 -MW ceiling on
new biogas installations will result in
a sharp drop in their number from 2015
onwards. The German biogas association
(Fachverband Biogas) puts the additional
electricity capacity of the biogas plants
in 2014 at 262 MW, or 147 additional ins-
tallations, which would increase the
number of biogas plants by the end of
2014 to 7 960 with 3 804 MW of electrical
capacity.
Looking on a slightly brighter side, the
new German circular economy legisla-
tion of February 2012 that transposes
the European waste framework direc-
tive makes separate biowaste collec-
tion mandatory by the 2015 timeline
for the whole of the country, which will
provide the methanisation sector with
new sources to replace the use of energy
crops.
Setback for the Italian biogas market The Ministerial Decree of 6 July 2012 on
new incentive systems for renewable
electricity production that applied from
1 January 2013 has completely shifted Ita-
lian policy on biogas. Taking a leaf out of
Germany’s book, the Italian government
wants to curb the rise of its biogas sec-
tor by significantly reducing the Feed-in
Tariffs (by 10 and 30% depending on the
segments) and by introducing a quota
policy. The decree has limited the accu-
mulated capacity of new biomass (not
only biogas) plants to 170 MW in 2013
and still further in 2014 and 2015 down
to 160 MW. The government has also cho-
sen to encourage the development of
small plants (up to 600 kW) through its
new tariff policy and to give preference
wel
tec
bio
po
wer
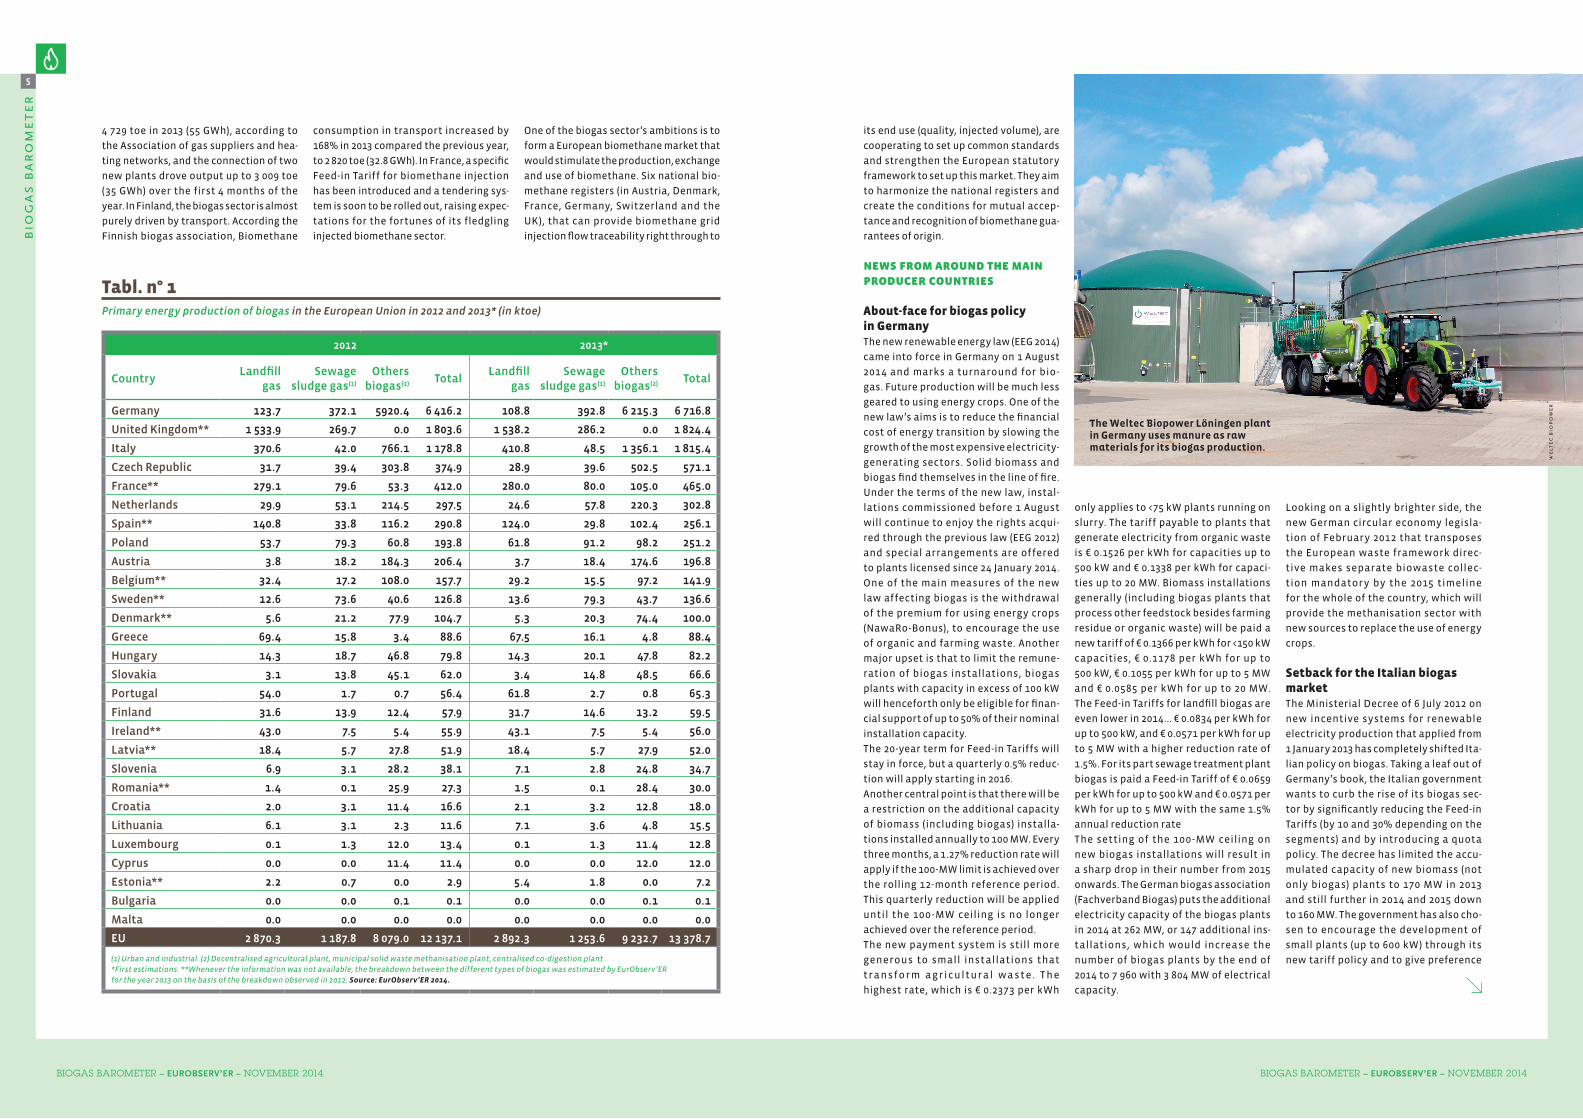
The Weltec Biopower Löningen plant in germany uses manure as raw materials for its biogas production.

87
bio
ga
s ba
ro
met
er
bio
ga
s ba
ro
met
er
biogas barometer – EUROBSERV’ER – november 2014 biogas barometer – EUROBSERV’ER – november 2014
Tabl. n° 3Gross heat production from biogas in the European Union in 2012 and in 2013* (in ktoe) in the transformation sector**
2012 2013*
Country Heat only plant CHP plant Total Heat only plant CHP plant Total
Italy 0.3 138.5 138.8 0.3 200.8 201.1
Germany 33.2 47.8 81.0 33.5 70.5 104.0
Denmark 5.9 29.5 35.5 4.2 20.7 24.8
France 2.8 10.6 13.4 2.8 10.6 13.4
Czech Republic 0.0 8.7 8.7 0.0 11.6 11.6
Sweden 5.4 5.7 11.2 5.4 5.7 11.2
Latvia 0.0 10.9 10.9 0.0 10.9 10.9
Slovenia 0.0 9.3 9.3 0.0 8.8 8.8
Finland 6.2 1.6 7.8 6.2 1.6 7.8
Poland 0.3 4.8 5.1 0.0 7.2 7.2
Belgium 0.0 6.6 6.6 0.0 6.6 6.6
Austria 1.9 5.2 7.1 1.9 4.4 6.3
Netherlands 0.0 4.4 4.4 0.0 3.7 3.7
Romania 0.9 2.4 3.3 0.9 2.4 3.3
Croatia 0.0 2.7 2.7 0.0 3.0 3.0
Slovakia 0.0 2.7 2.7 0.0 2.9 2.9
Lithuania 0.0 1.2 1.2 0.0 2.3 2.3
Hungary 0.4 0.9 1.3 0.4 0.9 1.3
Luxembourg 0.0 1.0 1.0 0.0 1.1 1.1
Cyprus 0.0 1.0 1.0 0.0 1.0 1.0
Estonia 0.0 0.1 0.1 0.0 0.1 0.1
EU 57.4 295.8 353.2 55.6 376.8 432.4
*Estimate.**Heat sold to the district heating network or to the industrial units. Source: EurObserv’ER 2014.
Tabl. n° 2Gross electricity production from biogas in the European Union in 2012 and 2013* (in GWh)
2012 2013*
CountryElectricity
only plantsCHP plants
Total electricity
Electricity only plants
CHP plantsTotal
electricity
Germany 5 916.0 21 322.0 27 238.0 6 338.0 22 662.0 29 000.0
Italy 2 160,0 2 458.0 4 618.0 3 435.0 4 013.0 7 448.0
United Kingdom 5 249.2 625.0 5 874.2 5 265.7 665.0 5 930.7
Czech Republic 55.0 1 412.0 1 467.0 55.0 2 239.0 2 294.0
France 754.9 530.0 1 284.9 893.6 627.4 1 521.0
Netherlands 68.0 940.0 1 008.0 60.0 906.0 966.0
Spain 765.0 101.0 866.0 802.1 105.9 908.0
Poland 0.0 565.4 565.4 0.0 882.5 882.5
Austria 592.0 46.0 638.0 574.0 41.0 615.0
Belgium 90.4 573.1 663,5 81.5 516.5 598.0
Denmark 2.5 375.7 378.2 1.7 255.3 257.0
Portugal 199.0 10.0 209.0 238.0 10.0 248.0
Hungary 153.4 81.3 234.7 100.3 142.5 242.8
Latvia 0.0 223.0 223.0 0.0 223.0 223.0
Greece 40.0 164.3 204.3 39.2 177.2 216.4
Slovakia 88.0 102.0 190.0 94.0 110.0 204.0
Ireland 175.0 24.0 199.0 175.9 24.1 200.0
Slovenia 4.9 148.2 153.0 4.2 136.8 141.0
Finland 57.0 82.0 139.0 57.4 82.6 140.0
Croatia 0.0 56.8 56.8 0.0 63.2 63.2
Lithuania 0.0 42.0 42.0 0.0 59.0 59.0
Luxembourg 0.0 57.9 57.9 0.0 55.3 55.3
Cyprus 0.0 50.0 50.0 0.0 52.0 52.0
Romania 0.0 19.0 19.0 0.0 25.8 25.8
Estonia 0.0 15.8 15.8 0.0 21.0 21.0
Sweden 0.0 22.0 22.0 0.0 12.0 12.0
Malta 0.0 2.0 2.0 0.0 3.0 3.0
Bulgaria 0.0 0.3 0.3 0.0 0.5 0.5
EU 16 370.4 30 048.8 46 419.1 18 215.6 34 111.6 52 327.2
*Estimate. Source: EurObserv’ER 2014.
to the use of by-products and farming
waste over energy crops. The Feed-in
Tariff for biogas produced from organic
waste, guaranteed for 20 years, is the
most lucrative at € 0.236 per kWh up to
300 kW. It changes to € 0.206 per kWh
for up to 600 kW. It then slips to € 0.178
per kWh for up to 1 MW, € 0.125 per kWh
for up to 5 MW and to € 0.101 per kWh for
higher capacities. Biogas produced from
farm-sourced products becomes much
less attractive at € 0.18 per kWh for up to
300 kW, down to € 0.16 per kWh for up to
600 kW, then to € 0.14 per kWh for up to
1 MW, € 0.102 per kWh for up to 5 MW and
to € 0.091 per kWh for higher capacities.
Additional subsidies may be awarded
for high-yield cogeneration systems
depending on GHG emission reductions
and the use of local resources. The initial
effects of this new policy were naturally
felt in 2013, when the mean size of new
installations plummeted together with
the sharp drop in newly installed biogas
capacity. The Italian electricity trans-
mission system operator Terna claims
that the additional capacity provided by
newly-installed biogas plants (all sources
taken together) dropped from 569.2 MW
in 2012 (on the basis of 684 new plants) to
45.7 MW in 2013 (on the basis of 140 new
plants). At the end of 2013, the country’s
electricity-generating capacity was up
to 1 388.4 MW for 1 611 plants. Farming
biogas (agricultural matter and livestock
manure) alone accounted for 945.7 MW
(68.1% of the capacity) for 1 299 plants.
The government now wants to gear its
biogas policy to biomethane production.
Italy has set up a Feed-in Tariff for bio-
methane production for NGV vehicles,
cogeneration or grid injection (Decree of
5 December 2013). The rates have not yet
been officially published, but the QualE-
nergia website suggests that they should
be around twice the price of natural gas,
coupled with a 20-year term purchase
contract. The government hopes that
once this measure has fully defined the
payment conditions, annual biomethane
output will in time rise to 5-8 billion m3.
France … Europe’s new vector for growth?Along with the UK, France is no doubt
the most promising country for biogas
development. The French Observation
and Statistics Office (SOeS) states that
primary biogas output increased by 17%
in 2013 to 454 ktoe (preliminary figures),
having increased by 13% in 2012. This
growth can be put down to the significant
public aid mechanisms set up comprising
the heat fund, more attractive Feed-in
Tariffs and regulations and the creation
of a Feed-in Tariff for biomethane injec-
tion into the natural gas grids. Electri-
city production has obtained the most
for the time being , as output rose to
1.5 TWh in 2013. The country’s ambitions
for biogas were reiterated in the Energy
Transition for Green Growth draft law.
Ecology Minister, Ségolène Royal, has
ambitions to launch 1 500 methanisa-
tion plant projects over the next three
years.
The government also plans to put out
tenders for biomethane injection into
the natural ga s grid and gra dually

109
bio
ga
s ba
ro
met
er
bio
ga
s ba
ro
met
er
biogas barometer – EUROBSERV’ER – november 2014 biogas barometer – EUROBSERV’ER – november 2014
N 400 km
Estonia* n° 267.2
Slovakia n° 1566.6
Lithuania n° 2315.5
Hungary n° 1482.2
Czech Republic n° 4
571.1
Sweden* n° 11
136.6
Poland n° 8251.2
Greece n° 13
88.4
Malta
Italy n° 3
1 815.4
Portugal n° 1665.3
France n° 5465.0
United Kingdom n° 21 824.4
256.1
Spain n° 7
Denmark* n° 12100,0
Austria n° 9196.8
TOTAL EU
13 378.7
Ireland n° 1856.0
Germany n° 1
6 716.8
34.7Slovenia n° 20
18.0Croatia n° 22
Netherlands n° 6302.8
Finland n° 1759.5
Belgium* n° 10141.9
Luxembourg n° 2412.8
Cyprus n° 2512.0
Latvia* n° 19
52.0
Romania* n° 2130.0
Bulgaria n° 270.1
Primary production of biogas in the European Union in 2012 and 2013** (in ktoe)
* First estimations. ** Whenever the information was not available, the breakdown between the different types of biogas was estimated by EurObserv’ER for the year
2013 on the basis of the breakdown observed in 2012. Source: EurObserv’ER 2014.
Green figures show total biogas production in ktoe.
Key
349,6
Landfill gas. Urban sewage and industrial effluent sludge gas. Other biogas.Decentralised agricultural plant, municipal waste methanisation plant, centralised co-digestion plant.
increase the renewable gas share. The
biogas Feed-in Tariffs were revised for
electricity production in 2011 . They
break down into a basic tariff now in
the range € 0.1119 to 0.1337 per kWh in
line with installation capacity, that may
be topped up by an energy efficiency
premium of € 0-0.04 per kWh and a pre-
mium for processing livestock effluents
of € 0-0.026 per kWh. Thus the maximum
tariff could be € 0.20 per kWh. France has
also introduced a Feed-in Tariff for injec-
ted biomethane which is in the range
€ 0.45-0.95 per kWh geared to the ins-
tallation size for non-hazardous waste
storage installations. The other metha-
nisation plants are eligible for Feed-in
Tariffs for injected biomethane made
up of a basic tariff of € 0.64–0.95 per kWh
geared to the installation size that may
be topped up by a premium calculated
on the basis of the nature of the matter
treated by the methanisation process.
This premium ranges from € 0.02- 0.03
per kWh if the feedstock exclusively
comprises agricultural waste or waste
from agricultural or agri-business pro-
ducts. It is € 0.05 per kWh if the feeds-
tock exclusively comprises household
waste. In the case of “mixed” feedstock,
the premium is weighted and calculated
in proportion to the feedstock quanti-
ties used by the plant.
Last important point, in the bill on energy
transition voted at the first reading in the
National Assembly on 14 October 2014,
Parliament adopted an amendment that
prohibits dedicated energy crops for
methanisation, the use of intermediate
crops remaining allowed. The bill will be
submitted to the Senate in early 2015.
The Netherlands, the UK and Denmark
are other European Union countries
that have set up Feed-in Tariffs for bio-
methane injection.
resTrUcTUring of The meThanisaTion indUsTry conTinUes
The slump in the growth of the German
and Italian markets that were up to now
the European growth drivers for biogas
has driven the European sector into a
major restructuring exercise. A number
of anaerobic digester manufacturers
decided two or three years ago to diver-
sify their income sources to get through
this tough patch and invest in operating
their own plants. They have also deve-
loped the business abroad in the most
promising European markets and also
outside Europe in the Asian and Ameri-
can markets.
Despite their efforts, a number of them
are having difficulty keeping afloat .
Many of the players are in dire financial
straits and others have been forced out
of the market. The most high profile fai-
lure was that of Biogas Nord AG in Sep-
tember 2013, which was one of the lea-
ding German manufacturers. MT Energie
(table 4), another German player is still
in business and pushing ahead with res-
tructuring. Its first financial results for
the year 2013 announced last 30 June
report a loss of 23.3 million euros, which
is more than 25% of the company’s pro-
visional sales put at 87.7 million euros.
The situation has forced it to close its
offices in the United States, Canada
and Australia effectively ruling out
any possibility of expanding into these
markets. Last 25 September, the group
announced that it would be shedding
65 jobs on its main production site at
Zeven in Northern Germany because
of the German renewable energy law
reform. Last July, the company which
is still in a poor financial position, rea-
ched an agreement with its financial
partners. Its improved financial results
for the first half-year of 2014 through the
company’s strong showing in the French
and British markets may have eased the
agreement through. Another source of
growth for the group is the construction
of biogas refining plants. MT Energie,
which has created a special subsidiary,
MT BioMethan, for the production of
biomethane plants, has announced the
construction of 8 projects in in the Cham-
pagne-Ardenne region of France by 2016,
whose second plant at Ussy-sur-Marne
has been on stream since September
f. b
oya
dji
an
– s
ca
nia
the scania truck retailer released two trucks using biomethane as fuel, for the french biofood retail chain biocoop.

1211
bio
ga
s ba
ro
met
er
bio
ga
s ba
ro
met
er
biogas barometer – EUROBSERV’ER – november 2014 biogas barometer – EUROBSERV’ER – november 2014
The next barometer will cover solid biomass
This barometer was prepared by Observ’ER in the scope of the “EurObserv’ER” Project which groups together Observ’ER (FR), ECN (NL), Institute for Renewable Energy (EC BREC I.E.O, PL), Jožef Stefan Institute (SL), Renac (DE) and Frankfurt School of Finance & Management (DE). Sole responsibility for the publication’s content lies with its authors. It does not represent the opinion of the European Communities nor that of Ademe or Caisse des dépôts. The European Commission, Ademe and Caisse des dépôts may not be held responsible for any use that may be made of the information published. This action benefits from the financial support of Ademe, the Intelligent Energy – Europe programme and Caisse des dépôts. Translation: Shula Tennenhaus/Parlance.
EurObserv’ER is posting an interactive database of the barometer indicators on the www.energies-renouvelables.org (French-language) and www.eurobserv-er.org (English-language) sites. Click the “Interactive EurObserv’ER Database” banner to download the barometer data in Excel format.
DownloadCo-funded by the Intelligent Energy EuropeProgramme of the European Union
Tabl. n° 4Representatives firms of the methanisation sector in Europeat the end of 2013
Compagny CountryNomber
of references in 2013
Electrical capacity installed in 2013
(in MWe)
Employees in 2013
AB Energy (Gruppo AB) Italy 650 700 500
MT Energie Germany 600 356 650
Envitec Biogas AG * Germany 456 335 350
Biogas Weser-Ems Germany 360 n.a. 100
PlanET Biogastechnik Germany 330 134 < 200
Schmack Biogas GmbH Germany < 300 130 376
Weltec Biopower GmbH Germany 300 76 80
UTS Biogastechnik (Anaergia Group) Germany 176 350 125
Bioconstruct Germany 219 123 >100
BTS Italia Italy 178 145 125
* Including plants under construction. Source: EurObserv’ER 2014.
2 676
4 456
2 275 2 4422 700
4 500
2012 2013 2015 2020
NREAP roadmaps
Current trend
Graph. n° 2Comparison of the current trend of biogas heat consumption against the NREAP (National Renewable Energy Action Plans) roadmap (in ktoe)
Source: EurObserv’ER 2014.
2014. MT Energie is also constructing its
biggest biomethane production plant
for the German sugar refiner SüdZuc-
ker. The energy produced by this plant
will supply about 6 000 households with
electricity and heat 2 000 homes.
Another front line player from Germany,
Envitec Biogas, clearly improved its
financial situation over the first half of
2014, with sales up by 9.5% to 75.3 mil-
lion euros, and an EBIT of 5.3 million
euros compared to a loss of 1.7 million
euros the previous year. The company
claims that its income for the full 2014
tax year should be 145-165 million euros
and is banking on a positive EBIT. The
company e xplains that this per for-
mance can be largely attributed to its
operating business, as Envitec Biogas
has a 57-MW portfolio of plants that it
manages with other investment par-
tners. The results can also be put down
to the realignment of its manufactu-
ring activity, which after suffering a
5.2 million euro loss last year, posted a
0.6 million euro surplus in the first half
year. The company has also decided to
expand internationally. At the end of
June 2014, its export order book was
worth 34 .1 million euros, which is a
55.7% increase out of a total of 55.7 mil-
lion euros. It views the most attractive
markets as being the French, UK and
Chinese markets, but also reckons new
markets are emerging in Japan and the
Philippines, where the company has
sent its first containers.
how mUch will biogas be conTribUTing in 2020 and 2030?
Today methanisation is fully recognized
as an exemplary process for treating
waste and recovering energy and that
can reduce energy reliance on natural
gas. However the development potential
of the biogas sector now hangs in the
balance as the very fast growth in out-
put of the leading countries for agricul-
tural methanisation has been achieved
by wholesale recourse to energy crops.
The growth pattern has been recently
challenged by the European Commis-
sion that insists that biogas production
should be primarily based on the use of
by-products and organic waste. Perforce,
current uncertainties about forthcoming
European legislation on biomass sustai-
nability and limiting the use of energy
crops have and will have an impact on the
biogas sector’s growth potential.
On the other hand, the countries of the
EU are also under obligation to organize
recovery circuits for the various types of
organic waste and set up sorting systems
to collect them, through European waste
regulations (Directive 2008/98/EC). The
application of this directive, and discus-
sions are currently going on to strengthen
its criteria (a draft directive has been filed
along these lines), will contribute new fer-
mentable waste to the sector that should
make up in part for the decreased use of
energy crops.
In order to recover, the biogas sector
requires fast decisions about the envi-
ronmental requirement levels for biogas
and biomethane production with regard
to GHG emissions, so that they can be
included in the European renewable
energy target calculations. Thus the
future development of the biogas sector
is essentially a political issue.
Accordingly, the best estimates for 2020
are those defined by each Member State
in the national renewable energy action
plans (NREAPs) for the EU of 28, which fore-
cast that the biogas sector will contri-
bute up to 4 456 ktoe of heat production
(graph. 2) and 64.2 TWh (5 423 ktoe) of elec-
tricity production (graph. 1), equating
to combined final energy consumption
of 9 879 ktoe. The European Biogas Asso-
ciation (EBA) reckons that 28 billion m3 of
biogas (natural gas equivalent) will have
to be produced to achieve the NREAP tar-
gets, which could equate to 1.5% of the
European Union’s primary energy mix and
5% of its natural gas consumption. For
2030, the EBA puts potential biogas output
at 50 billion m3 (natural gas equivalent).
Therefore, if suitable policies are set up,
the European biogas industry could sup-
ply 2-4% of the EU’s electricity needs and
15-30% of the methane market in 2030.
According to the European Green Gas
Sources: Statistic Austria, APEE (Bulgaria),
University of Zagreb (Croatia), Ministry
of Industry and Trade (Czech Republic),
University of eastern Finland, SOeS
(France), AGEE-Stat (Germany), CRES
(Greece), University of Miskolc (Hungary),
Ministry of Economic Development (Italy),
Statistics Lithuania, STATEC (Luxembourg),
Statistics Netherlands, The Institute
for Renewable Energy (Poland), DGGE
(Portugal), Energy Center Bratislava
(Slovakia), IJS (Slovenia), DECC (United
Kingdom), AIE, Observ’ER.
Grids project, Europe’s technical poten-
tial for biomethane would be even higher
if anaerobic biogas production were to
be added to synthetic biogas production
(bio-SNG) primarily produced from solid
biomass. For the EU of 27, the maximum
theoretical potential is in the range
151 to 246 billion Nm3 of biomethane
per annum that equates to energy out-
put of 130.8 to 212.2 Mtoe. Natural gas
dependency would be much less of an
issue in Europe, whereas biomethane
production sustainability might be a
much heavier issue.
2012 2013 2015 2020
44 112
64 238
46 41952 327 56 000
65 000
NREAP roadmaps
Current trend
Graph. n° 1Comparison of the current trend ofelectricity biogas generation against the NREAP (National Renewable Energy Action Plans) roadmap (in GWh)
Source: EurObserv’ER 2014.