1 2 3 input strategic drivers challenges
TRANSCRIPT

L B Finance PLC | Annual Report 2020/21
Total assets
Dividend per share
Cost to income ratio
Rs. 140.57 Bn Rs. 7/-
30.56 %KEY OUTPUT
HighesteverprofitaftertaxinLBFhistory
LowestcosttoincomeratioinLBFhistory
Dynamicimpairmentmodelpoweredbymachinelearningtoimprovetheaccuracyofforecasting
FUTURE
Introducebusinessintelligentplatformsanduseofartificialintelligenceforcreditdecisions
Achievesustainablegrowth
7
8
SDG impactRelated material themes and drivers Related stakeholders and concerns
Sustainablygrowingrevenue
Deliveringappropriateshareholderreturns
Regionalexpansion
Processexcellence
Improvingsustainablebusinessperformance
Ensuringfinancialsustainability
Improvingstakeholderengagement
SPACE FOR DEVELOPMENT
Portfoliogrowthopportunitiesthroughnewbusinesslocationsandrelocationofexistingoutletsalignwithbusinessexpansionstrategy
EnhancecreditevaluationandcollectioneffortstoreducetheNPLstopreCOVID-19levels
5 APPROACHES TO MANAGING FINANCE CAPITAL OUTCOMES
Budgetarycontrolsandmonthlymanagementaccounts
BranchandproductprofitabilitythroughOracleprofitabilityandcostmanagementcloudservice
Cashflowandliquiditymanagement
Soundriskmanagement,complianceframeworkandinternalpoliciesandprocedures
6
Visitwebpageforourphilosophy,ManagementapproachesandanalysisofFinancialCapital
HOW IT ADDS VALUES Returnsgeneratedbyourbusinessenhancesourfinancialcapital,whichinturnisusedtorepayourinvestorswithdividendpaymentsandtherestretainedtoaidbusinessoperationsandgrowththroughenhancingothercapitals.
FINANCIALCAPITAL
WHAT IT INCLUDES OurFinancialCapitalincludesourmonetaryresources,whichhavebeencontributedbyourinvestorsandarebeingenhancedthroughourbusinessactivities.Ourkeysourcesoffinancialcapitalcompriseequity,debtandcustomerdepositsbesidesothersourcesoffunds.
STRATEGIC DRIVERS
Focusmoreoncorebusiness
Growexposuresprudently,alignedtoriskappetite
MaintaintheNIMatdifferentmarketconditions
Continuationofcostoptimisation
Improvedoperatingefficiencythroughprocessoptimisationandautomation
MaintainthelowestNon-performingloanratiointheindustry
Becostefficientwhileinvestingforgrowth
Deliverconsistentreturnonequity
INPUT
Shareholders’funds
Depositsbase
Otherincomesources
Longandshort-termborrowings
Earningsretainedafterdividenddistribution
CHALLENGES
Lacklustermacroeconomicconditions
Elevatedcreditriskexertedpressureonearnings
MaintainingtheNIMwhenmarketinterestratesarevolatileanduncertain
ContinuationofrevenuegeneratingactivitieswiththeCOVID-19restrictions
1 2 3
TRADE OFF
Thesoftwareandinfrastructuralinvestmentsintoourcoresystems,thatwemaketowardsachievingprocessefficiency,inturn,helpsustomaintainourlowcosttoincomeratioandquickerserviceintheformof
turnaroundtimes,whichenablesustooperatecompetitivelyinthemarket.Whilemonetaryinvestmentsinourmanufactured,intellectual,human,socialandrelationshipandnaturalcapitalsarekeytothedevelopmentofthesecapitals
inthemselves,theseinvestmentsalsotranslatetoutilisationofthecapitalstobetransformedbacktofinancialcapitalintheformofmaterialreturnstothesevariousstakeholders.
4
Fitch rating reaffirmed
NPL Paid to the government as taxes
Highest ever PAT
ROE
A- (lka) 5.36% Rs. 3.96 Bn Rs. 6.80 Bn 26.58%
CAPITAL REPORTS
FC
L B Finance PLC | Annual Report 2020/21

L B Finance PLC | Annual Report 2020/21 L B Finance PLC | Annual Report 2020/21
Despite the pandemic creating a challenging business environment underpinned by high uncertainty, L B Finance PLC navigated the year with resilience and closed it with strong business momentum, by delivering a profit after tax of Rs. 6.80 Billion which reflected 31.15% growth over the previous financial year.
InassessingthefinancialperformanceoftheGroup,managementusesarangeofKeyPerformanceIndicators(KPIs)whichfocusontheCompany’sfinancialstrength,deliveryofsustainablereturnsandcostmanagement.WebelievethattheperformancegiveninbelowKPIswhicharenotpartofSLFRSswouldprovidevaluableinformationtoourstakeholders.
TheframeworkusedintheanalysisoftheKPIsistheCAMELratingsystem.CAMELisaratingsystemthatisusedtoratebanksandfinancialinstitutionsaccordingtofivefactors.Thefivefactorsarerepresentedbytheacronym“CAMEL–CapitalAdequacy,AssetsQuality,Management’sEfficiency,EarningsandLiquidity”.
KPI Definition Its Importance and How L B Finance Performed
C CAPITAL ADEQUACY
Tier I and Tier II
Capitalrequirementsarepartoftheregulatoryframeworktoensurebanksandnon-bankingfinancialinstitutionsaresupervised.CapitalratiosexpressthecapitalasapercentageofitsRiskWeightedAssets(RWA)asdefinedbytheCentralBankofSriLanka(CBSL).Capitalrequirementsaremeasuredattwotiers,namelyTierIandTierII.
LBFinance’scapitalmanagementobjectiveistomaximisetheshareholdervaluebyprudentlymanagingthelevelandmixofitscapital.
LBFinanceTierIandTierIIcapitaladequacyratiosasattheendofthefinancialyearstoodat23.87%and25.32%respectivelycomparedtotheminimumregulatoryrequirementof7%(TierI)and11%(TierII).ThisreflectstheresilientcapitalgenerationthroughtheprofitsoftheCompany.CapitalgenerationduringtheyearwaspartiallyoffsetbytheRs.1.66Billioninterimdividendpaidduringthefinancialyear.
Tier I Ratio
23.87%2020:19.04% Tier II Ratio
25.32%2020:20.75%
A ASSETS QUALITY
Non-Performing Advances (NPA)
GrossNPAindicatestheamountofdefaultedloansgrantedbyaninstitutionbeyondadefinedperiod.ThisratioaimstoidentifyNPAasapercentageofitstotaladvances. Ontheotherhand,NetNPAratioindicatestheoutstandingamountofgrossNPA,netofprovisioningfortheNPAasapercentageofitstotaladvances.ProvisioningistherecognitionofpotentiallossesarisingfromNPA.
LBFinanceaimstopreventundueconcentrationandtail-risks(largeunexpectedlosses)bymaintainingadiversifiedcreditportfolio,client,industryandproduct-specificconcentrationsareassessedandmanagedagainstitsriskappetite.
GrossNPAratioslightlyincreasedto5.36%in2020/21from3.93%in2019/20.DeteriorationofGrossNPAratioduringtheyearwasdrivenbytheunprecedentedeconomicimpactanddisruptionfromCOVID-19.NeverthelesstheNetNPAratioinyear2020/21isonly0.10%whichreflectsthattheCompanyhasprovidedforNPAswithastrongprovisioncoveragecloseto100%.
EvenduringthelacklustermacroeconomicconditionsCompanywasabletomaintainitsrecordofNPAratiossubstantiallylowerthantheNBFIsector.
Gross NPL
5.36% 2020:3.93% Net NPL
0.10% 2020:(0.12%)
M MANAGEMENT’S EFFICIENCY
Cost to Income Ratio
Costtoincomeratioisafinancialmeasurederivedthroughoperatingexpensesdividedbytotaloperatingincome.
ThisisameasureLBFinanceusestoassesstheproductivityofthebusinessoperations.Managingthecostbaseisakeyexecutionpriorityformanagementandincludesareviewofallcategoriesofspendingandananalysisofhowwecanrunthebusinessmoreefficientlytoensurethatcostsareincreasingataslowerratethanincome. LBFinance’scosttoincomeratioimprovedto30.56%inyear2020/21comparedto33.44%inyear2019/20whichdemonstratesimprovedmanagementefficiency.
Cost to Income
30.56% 2020:33.44%
E EARNINGS
Return on Equity (ROE)
ROEiscalculatedbydividingtheprofitaftertaxfromtheaveragetotalequity.
ReturnonEquity(ROE)isthemostcommoninternalperformancemeasureofaCompany’sprofitabilityfromtheshareholder’spointofview.Thismeasureindicateshowwellthemanagementgeneratesreturnfromtheshareholder’sequity.
LBFinanceachievedROEof26.58%intheyear2020/21comparedto25.04%inthepreviousyearwhichdemonstratesLBFinance’sabilitytoexecuteitsstrategiestomaximisetheshareholderwealth.
Return on Equity
26.58% 2020:25.04%
L LIQUIDITY
Liquid Assets Ratio
Liquidassetsratioiscalculatedbydividingtheliquidassetsfromtotaldepositliabilitiesandrelevantborrowings.
CBSLrequiredminimumamountofliquidassetsremainat6%oftimedeposits,10%ofsavingsdepositsand5%ofoutstandingborrowingsexcludingsecuredborrowings.TheCompanyhasmaintaineditsliquiditylevelswellabovetherequiredliquidassetsasperCBSLRequirement.
TheCompany’soverallobjectiveistomaintaintheadequateliquiditywhilemanagingthetradeoffwiththeprofitability.TheCompany’soverallliquidassetsasapercentageoftotaldepositliabilitiesandborrowingshoveredaround16%duringtheyearended2020/21and2019/20whichindicatesthat LBFinanceisinastrongpositionintermsofitsliquidity.
Liquidity Ratio
17.89% 2020:15.65%
CAPITAL REPORTS
Financial Capital

L B Finance PLC | Annual Report 2020/21 L B Finance PLC | Annual Report 2020/21
Year ended 31 March 2021 2020 Change
Rs. ‘000 Rs. ‘000 %
Income 29,766,124 31,222,860 (5)
InterestIncome 27,457,741 29,160,292 (6)
Less:InterestExpenses 11,522,802 13,615,391 (15)
Net Interest Income 15,934,939 15,544,901 3
Non-Interest Income
FeeandCommissionIncome 2,184,947 1,941,626 13
NetTradingIncome 6,323 (2,099) >100
OtherOperatingIncome 117,113 123,041 (5)
Total Operating Income 18,243,322 17,607,469 4
Less: Impairment Charges and Other Losses 1,691,734 1,831,057 (8)
Net Operating Income 16,551,588 15,776,412 5
Less: Operating Expenses
PersonnelExpenses 2,959,823 3,005,189 (2)
DepreciationofProperty, PlantandEquipment 728,793 697,508 4
AmortisationofIntangibleAssets 16,446 15,882 4
OtherOperatingExpenses 1,870,828 2,168,986 (14)
Total Operating Expenses 5,575,890 5,887,565 (5)
Operating Profit before Tax on Financial Services 10,975,698 9,888,847 11
Less: Tax on Financial Services 1,669,323 2,278,560 (27)
Profit before Taxation 9,306,375 7,610,287 22
Less: Income Tax Expense 2,503,778 2,423,234 3
Profit for the Year 6,802,597 5,187,053 31
Net Interest Income
Definition: Interestincomerecognisedfromourlendingproductsthatweoffertoourcustomers,lessinterestexpenseonthedepositsthatourcustomersplacewithusanddebtfundingsourcefromourlenders.
Drivers:Lendingbase,NPLratio,productpricing,marketvolatility,marketinterestrates.
Non-Interest Income
Definition:Alsoknownasotherincome,consistingoffeeandcommissionincome,nettradingincomeandotheroperatingincome.
Drivers:Capitalmarketactivities,marketvolatility,otherincomerecogniseoncreditgranting.
Impairment Charges and Other losses
Definition:Expectedlossesarisingduetotheinabilityofcustomerstorepaytheirdebttotheentity.
Drivers:Customerrepaymentbehavior,lossgivendefaultrate,probabilityofdefaultrate,macroeconomicfactors,exposureatdefault.
Operating Expenses
Definition:Costsincurredtogeneratecurrentandfuturerevenues.Consistingofpersonnelexpenditure,depreciationandamortisationandotheroperatingexpenses.
Drivers:Inflation,headcount,investmentsinbranchesandITinfrastructure,generalcoststooperate,marketingandpromotionalactivities.
Taxes
Definition:Includedirecttaxessuchasincometax,debtrepaymentlevy,VATandNBTonfinancialservices.Taxisacompulsoryfinancialchargeorsomeothertypeoflevyimposedontaxpayers.
Drivers:Levelofoperationalprofitability,governmentpolicies,applicabletaxrates,allowablecreditsandexemptincome.
INCOME STATEMENT Net Interest Income
OurinterestincomewasRs.27.45Billionfortheyear2020/21comparedto Rs.29.16Billion,fortheyear2019/20,declineofRs.1.71Billionor5.84%.ThedeclinewasprimaryduetothereductionininterestratesandthemonetaryeasingprovidedtoourcustomersincompliancewiththedirectionsissuedbytheCentral
BankofSriLanka(CBSL).Moreover,declineintheinterestincomewasaffectedwiththedegrowthinourleaserentalsreceivableandstockoutonhireduetotherestrictionsimposedonimportationofmotorvehicleswhichinturndiminishedthenumberofvehicleregistrations.
Ontheotherhand,interestexpensesreducedbyRs.2.09Billionwhichwas15.37%lessthanthepreviousyear.ThiswasdrivenbythecontinuousdeclineinmaximuminterestratestobepaidinrespectofdepositsanddebtinstrumentsaspublishedbytheCBSLinlinewiththegovernmentpolicies.
2020/21 2019/20 Increase/(Decrease)
Rs. ‘000 Rs. ‘000 Rs. ‘000 Change %
InterestIncome 27,457,741 29,160,292 (1,702,551) (5.84)
InterestExpenses 11,522,802 13,615,391 (2,092,589) (15.37)
NetInterestIncome 15,934,939 15,544,901 390,038 2.51
AverageInterest-EarningAssets 131,110,968 130,007,658 1,103,310 0.85
AverageInterest-BearingLiabilities 111,671,145 113,708,200 (2,037,055) (1.79)
2020/21 2019/20 Change
% % %
InterestYieldonAverageInterestEarningAssets 20.94 22.43 (1.49)
CostofFundsonAverageInterestBearingLiabilities 10.32 11.97 (1.65)
InterestSpread 10.62 10.46 0.16
NetInterestMargin(NIM) 12.15 11.96 0.19
Motor vehicle registration
0
10,000
20,000
30,000
40,000
Apr 2
020
May
202
0
Jun
2020
Jul 2
020
Aug
2020
Sep
2020
Oct
202
0
Nov
202
0
Dec
202
0
Jan
2021
Feb
2021
Mar
202
1
(No. of vehicles)
2019/20 2020/21 Source: Central Bank of Sri Lanka
Comparison of AWPLR
0
3
6
9
12
15
Apr 2
020
May
202
0
Jun
2020
Jul 2
020
Aug
2020
Sep
2020
Oct
202
0
Nov
202
0
Dec
202
0
Jan
202 1
Feb
2021
Mar
202
1
(%)
2019/20 2020/21 Source: Central Bank of Sri Lanka
Despitethedeclineintheinterestincome,ournetinterestincomegrewby2.51%toRs.15.93Billionduetohighfrequencyofre-pricingindepositbaseasagainstloans,especiallyleaseswithlongertermtenure,impactedpositivelyonournetinterestmargin.
CAPITAL REPORTS
Financial Capital
Non Interest Income
Feesandcommissionincomegrewby12.53%toRs.2.18Billionasaresultofhighertransactionvolumesthroughloansandreceivablesparticularlythegrowthingoldloan.Further,ournettradingincomerecordedagainofRs.6.32Millionduetothefavorablemarketvolatilityofequitysecuritiesheldfortrading.ItwasalsonotedthattherewasamarginaldeclineinourotheroperatingincometoRs.117.11Millionor4.82%duringtheyear.
Non interest income
0 500 1,000 1,500 2,000 2,500
2018
2017
2019
2020
2021
(Rs. Mn)
Credit Related Fees and Commissions Service Charge

L B Finance PLC | Annual Report 2020/21 L B Finance PLC | Annual Report 2020/21
ANALYSIS OF IMPAIRMENT
CHARGES AND OTHER LOSSES
Loans and Receivables
Stage 01 Stage 02 Stage 03 Total
Lease Rentals Receivable and
Stock out on Hire
Total
Total Impairment Charges and Other Losses
Others
Rs. 550 Mn2020:Rs.100Mn
Rs. 66 Mn2020:Rs.0.6Mn
Rs. 526 Mn2020:Rs.1,012Mn
Rs. 1,142 Mn2020:Rs.1,113Mn
Rs. 143 Mn2020:(Rs.114Mn)
Rs. 693 Mn2020:(Rs.14Mn)
Rs. 1,691 Mn2020:Rs.1,831Mn
(Rs. 62 Mn)2020:(Rs.71Mn)
Rs. 1,147 Mn2020:Rs.1,865Mn
Rs. 1,753 Mn2020:Rs.1902Mn
(Rs. 153 Mn)2020:Rs.50Mn
(Rs. 87 Mn)2020:Rs.51Mn
Rs. 621 Mn2020:Rs.853Mn
Rs. 611 Mn2020:Rs.789Mn
Operating Expenses
Operatingexpensesdecreasedby5.29%toRs.5.57Billionfortheyear2020/21,duetoreductioningeneralandadministrativeexpensescomparedtothepreviousyearfollowingadisciplinedcostmanagementwithreductionsincostacrossallmajorcostcategories.
Advertisingandbusinesspromotionsincludedintheotheroperatingexpensesplummetedby55.81%intheyear2020/21comparedtoprioryearasaconsequenceofsubsidingouradvertisingandbusinesspromotion.
Moreover,theCompanymanagedtomaintainitscostperemployeewithinthebudgetedlevelsdemonstratingitsabilitytoalignwiththeCompanystrategyinunprecedenttimeframes.ItisalsonoteworthythatthecosttoincomeratiooftheCompanyimprovedby2.88%from33.44%to30.56%duringtheyearbyreportingthelowestcosttoincomeratioinLBFinancehistoryindicatingtheeffectiveandefficientcostmanagementeffortsoftheCompany.
Total operating expensesvs total operating income
0
5,000
10,000
15,000
20,000
0
10
20
30
40
(Rs. Mn) (%)
Total operating incomeTotal operating expensesCI Ratio
2017
2018
2019
2020
2021
CAPITAL REPORTS
Financial Capital
Impairment Charges and Other Losses
ImpairmentchargesandotherlosseswereRs.1.69Billionfortheyear2020/21.ThiswasprimarilydrivenbynegativeimpactsfromCOVID-19whichresultedinextrememacroeconomicdownturn.
However,themanagementoftheCompanycontinuedtoprovideoversighttothecreditmonitoring,managementandrecoveryoffinancereceivablesinmanagingcreditriskandimprovingassetqualityhelpedtoreducetheimpairmentchargesforthecurrentfinancialyearcomparedtothepreviousfinancialyear.
Inadditionthedecreaseofimpairmentchargesandotherlossesof7.61%wasalsocontributedbytheadditionalimpairmentprovisionsintheyear2019/20asmanagementoverlaytoflattenthehighamplitudeofthefutureimpairmentwiththeexpectedadversemacroeconomicconditionduetoCOVID-19crisis.Further,thereductioninimpairmentchargesandotherlosseswerecontributedbytheoverallreductioninthelendingbasedueto,
Theslowergrowththanexpectedinthelendingvolumes
Pre-terminationofcreditfacilitiesresultingfromtheimprovedvehiclepricesinthemarket
Inherentearlyterminationsthatarewitnessedwhenthemarketinterestratesarereducing
Itshouldbetakenintoconsiderationthatthereductionintheimpairmentchargesandotherlosses,alsodemonstratestheassetqualityoftheCompanywhichwasevidentwiththeoneofthelowestNPAratiosinNBFIsector.
Taxes
LBFinancetaxexpenseconsistsoftwomainelementsnamelytaxesonfinancialservicesandincometax.
TaxonfinancialservicesreducedtoRs.1.66Billion,whichwas26.74%lessthantheprioryear.ThiswasmainlyduetotaxreformstoabolishthedebtrepaymentlevyandNBTonfinancialserviceswitheffectfrom1January2020.
Financial Highlights 2020/21 2019/20 2018/19
Rs.’000 Rs.’000 Rs.’000
ProfitbeforeTaxonFinancialServices 10,975,698 9,888,847 9,756,268TaxonFinancialServices 1,669,323 2,278,560 2,015,619ProfitafterTaxonFinancialServices 9,306,375 7,610,287 7,740,649CurrentIncomeTax(A) 2,913,969 2,683,698 2,441,729DeferredTaxationCharge/(Reversal) -Incomestatement(B) (410,191) (260,464) 244,260
TaxationCharge-IncomeStatementC=(A+B) 2,503,778 2,423,234 2,685,989DeferredTaxationCharge/(Reversal) -OtherComprehensiveIncome(D) 9,684 (11,678) 6,712
TotalTaxExpensefortheFinancialYearE=(C+D) 2,513,462 2,411,556 2,692,701
EffectiveTaxRate(TaxationCharge/Profit afterTaxonFinancialServices) 27.01% 31.69% 34.79%
EffectiveTaxRate(TaxationCharge/ProfitbeforeTaxonFinancialServices) 22.90% 24.39% 27.60%
TheeffectiveincometaxrateoftheCompanydecreasedto27.01%duringtheyearfrom31.69%reportedinthepreviousyear.Thiswasmainlyduetofollowingdownwardtaxadjustmentseffectedduringthelastquarterof2019/20.
Corporatetaxraterevisionfrom28%to24%hadafavorableimpacttothereductionineffectiveincometaxrate.
Decreaseintaxesonfinancialservicesduetotheabolitionofthedebtrepaymentlevy(effectivefrom1January2020),nationbuildingtax(effectivefrom1December2019)enabledtheCompanytopostanincreaseintheoperatingprofitaftertaxonfinancialservices.
TheCompanyasaresponsibletaxpayerhasataxstrategythatoutlinetheframeworkbywhichtheCompany’staxobligationsaremetfromanoperationalandriskmanagementperspective.Weadoptanoverarchingriskphilosophyinrelationtotaxmatterswhichaimstomitigateanyadverseorunexpectedfinancialconsequencesandprotectourreputation.TotaldirecttaxpaidfromtheCompanyamountedtoRs.3.54BillioncomparedtotheRs.5.60BillionintheprioryeardownbyRs.2.06Billionduetotheabovesaidtaxreformsintroduced.
Similarly,indirecttaxcollectedfromValueAddedTax(VAT),WithholdingTax(WHT),PAYEandstampdutyamountedtoRs.425.60MillioncomparedtotheRs.1,223.56Millionpaidintheprioryearwhichrepresentsa65.22%reductionduetothetaxreformsintroduced.
Direct taxes
0
500
1,000
1,500
2,000
2,500
3,000
2020 2021
(Rs. Mn)
Income TaxValue Added Tax on Financial ServicesCrop Insurance Levy
Indirect taxes (%)
Value Added TaxNation Building TaxStamp DutyWithholding Tax on Dividend and InterestPAYE Tax/Advanced Personal Income Tax
37.97
20.92
2.57
26.56
8.38
41.57
42.22
0.5
19.31
2021
2020
Rs. 1.7 Bn Rs. 1.1 Bn
Profit After Tax
DespitethedisruptionsonoperationscausedbyCOVID-19pandemictheCompanywasabletodeliveraresilientperformance.TheCompanyreportedprofitaftertaxofRs.6.80BillionwhichisRs.1.62Billionor31.15%higherthanthepreviousyear.Theriseinprofitprimarilyreflectingtheimpactoftheincreaseinnetinterestincome,effectivecreditcostmanagementresultinginmanageableimpairmentcharges,reductioninoperatingexpensesandthesavingsresultingfromthetaxregulatoryreforms.
PROFIT AFTER TAX For the year ended 31 March 2021
PROFIT BEFORE TAX ON FINANCIAL SERVICES For the year ended 31 March 2021
31% 11%
FY 21 Rs. 6.8 Bn
FY 20 Rs. 5.1 Bn
FY 21 Rs. 10.9 Bn
FY 20 Rs. 9.8 Bn
L B Finance PLC | Annual Report 2020/21 L B Finance PLC | Annual Report 2020/21
As at 31 March 2021 2020 Change
Rs. ‘000 Rs. ‘000 %
Assets
Cash and Cash Equivalents 6,187,300 6,162,637 0
FinancialAssetsRecognisedThroughProfitorLoss-MeasuredatFairValue 10,862 4,648 >100
Financial Assets at Amortised Cost - Loans and Receivables 66,778,188 58,239,254 15
Financial Assets at Amortised Cost - Lease Rentals Receivable and Stock out on Hire 47,359,635 60,626,670 (22)
FinancialAssetsMeasuredatFairValueThroughOtherComprehensiveIncome 77,789 59,141 32
Other Financial Assets 10,453,903 9,119,681 15
OtherNonFinancialAssets 920,406 967,469 (5)
InvestmentinSubsidiary 521,162 521,162 -
Property,PlantandEquipmentand Right-of-UseAssets 8,241,259 8,221,248 0
IntangibleAssets 26,021 41,809 (38)
Total Assets 140,576,525 143,963,719 (2)
Liabilities
Due to Banks 16,467,179 22,771,085 (28)
Financial Liabilities at Amortised Cost - Due to Depositors 85,860,070 89,256,435 (4)
Debt Instruments Issued and Other Borrowed Funds 3,113,916 3,111,186 0
OtherFinancialLiabilities 3,043,526 2,766,410 10
OtherNonFinancialLiabilities 1,028,054 909,266 13
CurrentTaxLiabilities 1,872,154 766,752 >100
DeferredTaxLiabilities 637,073 1,037,580 (39)
PostEmploymentBenefitLiability 365,265 345,456 6
Total Liabilities 112,387,237 120,964,170 (7)
Equity
StatedCapital 838,282 838,282 -
Reserves 7,596,106 6,216,939 22
RetainedEarnings 19,754,900 15,944,328 24
TotalEquityAttributabletoEquityHoldersoftheCompany 28,189,288 22,999,549 23
Non-ControllingInterest - - -
Total Equity 28,189,288 22,999,549 23
Total Liabilities and Equity 140,576,525 143,963,719 (2)
Cash and Cash Equivalents
Definition:ValueofaCompany’sassetsthatarecashorcanbeconvertedintocashimmediately.Includescashinhand,bankbalancesandtreasurybills/bondsrepurchaseagreements.
Drivers:Liquidityrequirements(CompanyandCBSL),creditgranting,recoveriesandfundingfromdepositsandothersources.
Lending Portfolio
Definition:MaininterestearningassetstotheCompanywhichconsistsofloansandreceivables,leaserentalsreceivableandstockoutonhire.
Drivers:Marketinterestrates,Companiesriskappetite,marketcompetition,lendingvolumes,pre-terminationsandrepayments.
Other Financial Assets
Definition:Consistsoftreasurybillsrepurchaseagreements,investmentinfixeddeposits,insurancepremiumreceivableandsundrydebtors.
Drivers:Liquidityrequirements,marketinterestrates,excessfunds.
Due to Banks
Definition:Consistsoftheexternalborrowingsfrombanksincludingoverdrafts,securitisations,termloansandsyndications.
Drivers:Marketgrowth,fundingrequirements,marketinterestrates,repayments,gearingratio.
Financial Liabilities at Amortised Cost - Due to Depositors
Definition:Compriseofinterestbearingsavingsdepositsandtermdeposits.
Drivers:Fundingrequirements,marketgrowth,marketinterestrates,depositrenewalratio.
Debt Instruments Issued and Other Borrowed Funds
Definition:Consistoflistedunsecureddebentures.
Drivers:Fundingrequirements,marketinterestrates,Companystability,TierIIcapitaladequacyrequirements.
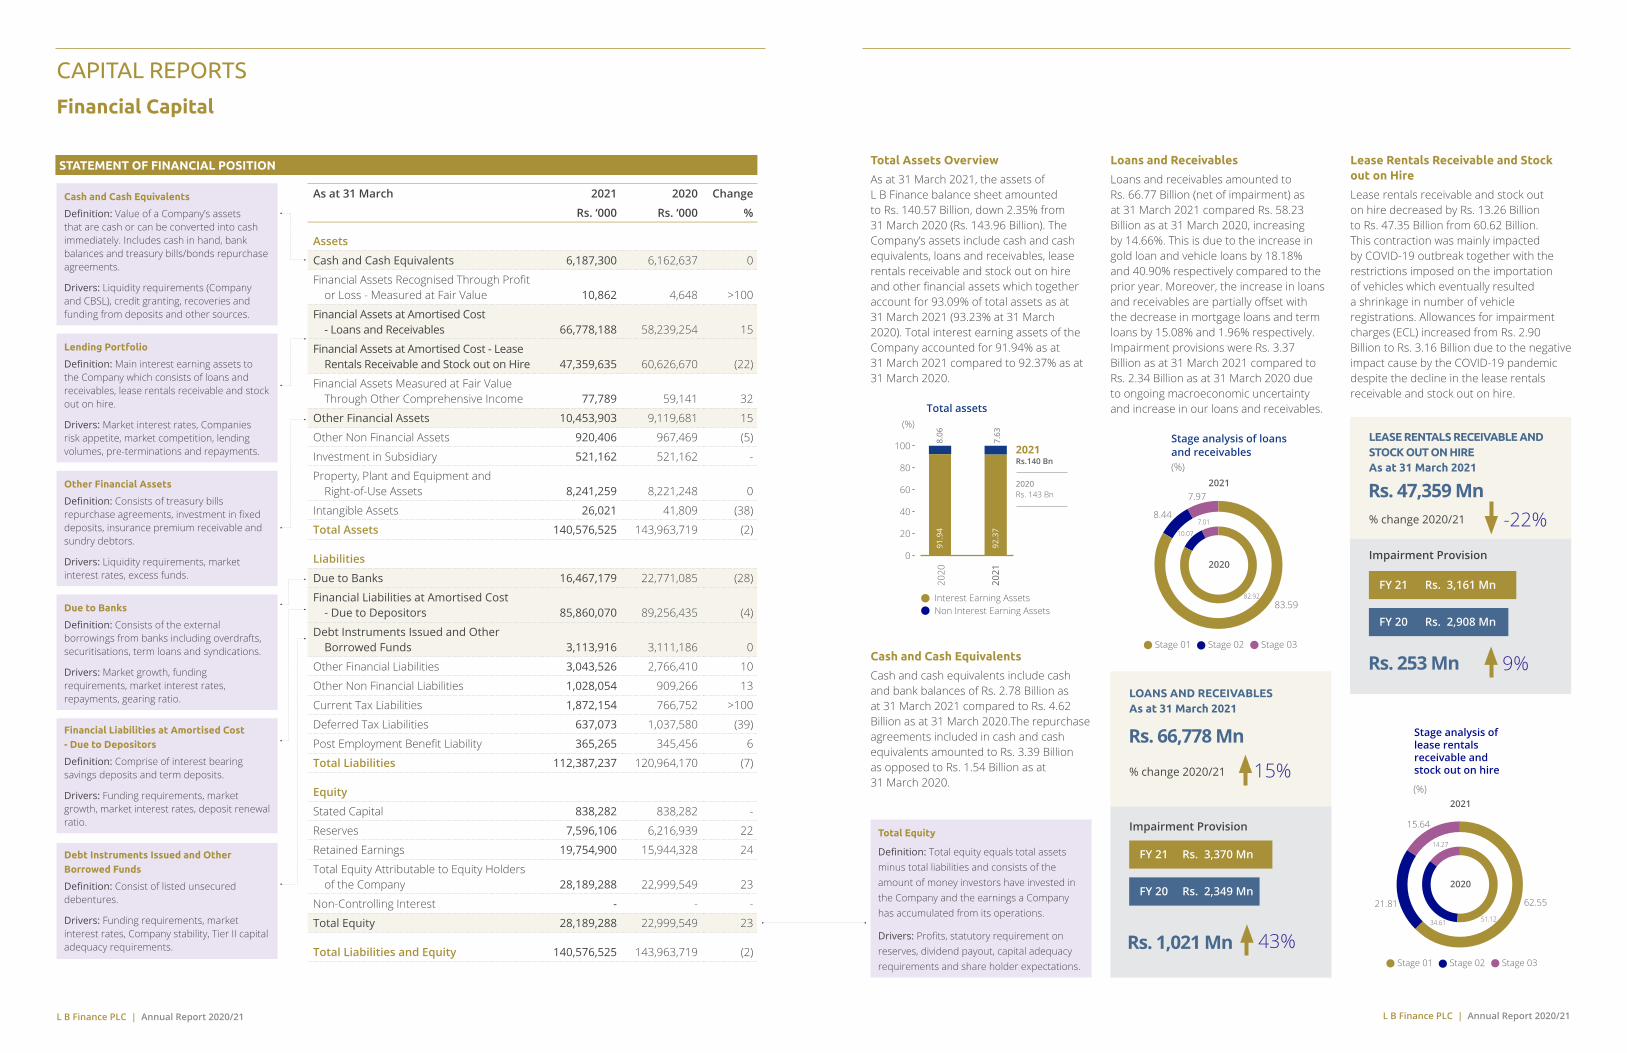
Total Equity
Definition:Totalequity equals total assetsminus total liabilitiesandconsistsoftheamountofmoneyinvestorshaveinvestedintheCompanyandtheearningsaCompanyhasaccumulatedfromitsoperations.
Drivers:Profits,statutoryrequirementonreserves,dividendpayout,capitaladequacyrequirementsandshareholderexpectations.
STATEMENT OF FINANCIAL POSITION Total Assets Overview
Asat31March2021,theassetsof LBFinancebalancesheetamounted toRs.140.57Billion,down2.35%from 31March2020(Rs.143.96Billion).TheCompany’sassetsincludecashandcashequivalents,loansandreceivables,leaserentalsreceivableandstockoutonhireandotherfinancialassetswhichtogetheraccountfor93.09%oftotalassetsasat 31March2021(93.23%at31March2020).TotalinterestearningassetsoftheCompanyaccountedfor91.94%asat 31March2021comparedto92.37%asat31March2020.
Total assets
0
20
40
60
80
100
2020
2021
(%)
2021Rs.140 Bn
2020Rs. 143 Bn
Interest Earning AssetsNon Interest Earning Assets
92.3
7
91.9
48.
06
7.63
Cash and Cash Equivalents
CashandcashequivalentsincludecashandbankbalancesofRs.2.78Billionasat31March2021comparedtoRs.4.62Billionasat31March2020.TherepurchaseagreementsincludedincashandcashequivalentsamountedtoRs.3.39Billion asopposedtoRs.1.54Billionasat 31March2020.
Loans and Receivables
Loansandreceivablesamountedto Rs.66.77Billion(netofimpairment)asat31March2021comparedRs.58.23Billionasat31March2020,increasingby14.66%.Thisisduetotheincreaseingoldloanandvehicleloansby18.18%and40.90%respectivelycomparedtotheprioryear.Moreover,theincreaseinloansandreceivablesarepartiallyoffsetwiththedecreaseinmortgageloansandtermloansby15.08%and1.96%respectively.ImpairmentprovisionswereRs.3.37Billionasat31March2021comparedtoRs.2.34Billionasat31March2020duetoongoingmacroeconomicuncertaintyandincreaseinourloansandreceivables.
Stage analysis of loansand receivables (%)
Stage 01 Stage 02 Stage 03
83.5982.92
10.07
7.018.44
7.972021
2020
Lease Rentals Receivable and Stock out on Hire
LeaserentalsreceivableandstockoutonhiredecreasedbyRs.13.26BilliontoRs.47.35Billionfrom60.62Billion.ThiscontractionwasmainlyimpactedbyCOVID-19outbreaktogetherwiththerestrictionsimposedontheimportationofvehicleswhicheventuallyresultedashrinkageinnumberofvehicleregistrations.Allowancesforimpairmentcharges(ECL)increasedfromRs.2.90BilliontoRs.3.16BillionduetothenegativeimpactcausebytheCOVID-19pandemicdespitethedeclineintheleaserentalsreceivableandstockoutonhire.
CAPITAL REPORTS
Financial Capital
Rs. 47,359 Mn
Rs. 253 Mn
LEASE RENTALS RECEIVABLE AND STOCK OUT ON HIRE As at 31 March 2021
% change 2020/21 -22%
Impairment Provision
9%
Rs. 66,778 Mn
Rs. 1,021 Mn
LOANS AND RECEIVABLES As at 31 March 2021
% change 2020/21 15%
43%
Impairment Provision
(%)
62.5521.81
15.64
34.61
14.27
51.12
2021
2020
Stage analysis oflease rentalsreceivable andstock out on hire
Stage 01 Stage 02 Stage 03
FY 21 Rs. 3,370 Mn
FY 20 Rs. 2,349 Mn
FY 21 Rs. 3,161 Mn
FY 20 Rs. 2,908 Mn

L B Finance PLC | Annual Report 2020/21 L B Finance PLC | Annual Report 2020/21
Credit Quality
CreditqualityoftheCompanywasaffectedwiththedisruptiontoeconomicactivitieswhichhadanadverseimpactonincreaseinourimpairmentprovisionbyRs.1.28BillionfromRs.5.25Billionasat31March2020toRs.6.53Billionasat31March2021.
Weidentifycounterpartiesthat,demonstratethelikelihoodofdefaultsandmadeprovisionsbasedontheECLmodeloftheCompany,whichfactorsintheforwardeconomicoutlook.LBFinanceusesadynamicimpairmentmodelpoweredbymachinelearningtechniquesdevelopedwithColomboScienceandTechnologyCELLofUniversityofColombotoimprovetheaccuracyofforecastingwhichensuresthattheCompanyadequatelyprovidedforthedelinquentfacilities.
Credit Quality of Assets Gross Carrying Value Allowance for Impairment
Allowance by Categories
Defaulted Exposures
Non- Defaulted Exposures
Individual Collective
Rs. ’000 Rs. ’000 Rs. ’000 Rs. ’000 Rs. ’000
As at 31 March 2021LoansandReceivables 5,590,002 64,558,907 3,370,721 2,339,239 1,031,482 LeaseRentalsReceivableandStockoutonHire 7,903,567 42,617,339 3,161,271 2,487,333 673,938 Total 13,493,569 107,176,246 6,531,992 4,826,572 1,705,420
11.18% 88.82%
As at 31 March 2020LoansandReceivables 4,249,210 56,339,350 2,349,306 1,915,499 433,807LeaseRentalsReceivableandStockoutonHire 9,069,309 54,465,394 2,908,033 2,223,973 684,060Total 13,318,519 110,804,746 5,257,339 4,139,472 1,117,867
10.73% 89.27%
Financial Highlights 2021 2020 2019
Rs. ‘000 Rs. ‘000 Rs. ‘000
GrossLoans(WithUnearnedIncome) 134,801,208 143,625,411 140,149,944UnearnedIncome 14,131,393 19,502,148 22,950,300GrossLoans 120,669,815 124,123,263 117,199,644GrossNon-PerformingLoans(WithUnearnedIncome) 7,232,046 5,648,464 3,773,333UnearnedIncomeofNon-PerformingLoans 575,528 536,198 276,867GrossNon-PerformingLoans 6,656,518 5,112,266 3,496,466SLFRS09ECLProvision 6,531,992 5,257,339 3,746,911RegulatoryProvision 5,194,045 3,897,772 2,642,510Excess/(Shortfall)ECLProvisionComparedtoRegulatoryProvision 1,337,947 1,359,567 1,104,401
ECLProvisionasaPercentageofGrossLoans 5.41% 4.24% 3.20%ECLProvisionasaPercentageofNon-PerformingLoans 98.13% 102.84% 107.16%
RegulatoryProvisionasaPercentageofGrossLoans 4.30% 3.14% 2.25%RegulatoryProvisionasaPercentageofNon-PerformingLoans 78.03% 76.24% 75.58%NPL:GrossLoans 5.52% 4.12% 2.98%NPL:GrossLoans-UnearnedIncomeBasis 5.36% 3.93% 2.69%NetNon-PerformingLoans 0.10% -0.12% -0.21%
TheregulatoryprovisionsaremadeonloansandadvancesundertheDirectionNo03of2006on“Provisionforbadanddoubtfuldebts”(andsubsequentamendmentsthereof)issuedbytheCBSL.
TheECLasperSLFRS09-FinancialInstrumentsisRs.1,337.94Millionexcessasattheendof31March2021(Rs.1,359.56Millionasat 31March2020)overtheregulatoryprovisionrequiredasperthesaiddirectionsissuedbytheCentralBankofSriLanka.
Other Financial Assets
Otherfinancialassetsmainlycomposedoftreasurybillsrepurchasedagreementsandinvestmentsinfixeddepositstomeetstatutoryliquidityrequirements.Otherfinancialassetsincreasedby14.63%toRs.10.45BillionfromRs.9.11Billion.ThiswasdrivenbytheincreaseininvestmentsinfixeddepositsfromRs.3.42BilliontoRs.6.50BillionwhichovershadowedthedeclineintreasurybillrepurchasedagreementsbyRs.1.92Billionasat 31March2021.
Other financial assets (%)
Investment in Fixed DepositsTreasury Bills Repurchase AgreementsOthers
62.21
33.84
3.95
2.52 59.90
37.58
2020
2021
Liability Overview
TheCompany’sliabilitiesamountedto Rs.112.38Billionasat31March2021down7.09%fromRs.120.96Billionasat31March2020.TheCompany’smainliabilitiesconsistofduetobanks,duetodepositorsanddebtinstrumentsissuedandotherborrowedfunds.Theseitemstogetherrepresented93.82%ofourtotalliabilitiesasat31March2021(95.18%asat31March2020).The7.09%decreaseinliabilitywasmainlyduetothe27.68%droporRs.6.30BilliondecreaseinduetobankscomparedtoprioryearofRs.22.77Billioninlinewiththelendingportfoliocontraction.
Due to Banks
Duetobanksdeclinedby27.68%to Rs.16.46Billionasat31March2021fromRs.22.77Billionasat31March2020.Whilethedecreaseismainlyduetothesettlementoftheamountsduetobankswithitsstrongliquidityposition.TheCompanyhasborrowedRs.15.78Billionintheyear2021(2020-Rs.14.58Billion)tomanagethematuritymismatchofassetsandliabilitiesandmaintaintheexistingfundingmixoftheCompany.
2021 2020
Rs. ‘000 Rs. ‘000
Bank Overdrafts 988,099 720,411
DebtFunding fromBanks 15,479,080 22,050,674
DuetoBanks 16,467,179 22,771,085
22.05
15.782.38
(24.73)
(Rs. Bn)
15.48
As a
t 1Ap
ril 2
020
Loan
sO
btai
ned
Inte
rest
Reco
gnis
ed
Repa
ymen
ts
As a
t 31
Mar
ch 2
021
Debt funding
Due to Depositors
DuetodepositorsamountstoRs.85.86BilliondownRs.3.39Billionfrom31March2020.Thiswasprimarilydrivenbythe4.48%dropinthefixeddepositseasingtheconcentrationonlargervaluedepositswhilemaintaininghealthylevelsofliquidityforbusinessoperation.
Debt Instruments Issued and Other Borrowed Funds – Debentures
ThiscategoryincludesRs.3.00BillionlisteddebenturesissuedinDecember2017ofwhichRs.2.00BillionweresubordinateddebenturestostrengthenTierIIcapital.DebtinstrumentsissuedandotherborrowedfundsremainedatRs.3.11Billionasat31March2021and2020.
Shareholders’ Equity
Shareholders’equityamountstoRs.28.18Billionasat31March2021comparedwithRs.22.99Billionasat31March2020.ThisRs.5.18BillionincreaseismainlyattributabletotheprofitoftheyearwhichamountedtoRs.6.80BillionandpartiallyoffsetbytheRs.1.66Billioninterimdividendspaidinrespectoftheyearended31March2021.
ItisalsonoteworthythattheCompanysub-divideditsshareson10March2021wherebyeverysharewassub-dividedintofourshareswithoutanychangetothestatedcapitaloftheCompanytherebyincreasingthenumberofsharesinissuefrom138,514,284sharesto554,057,136shares.
CAPITAL REPORTS
Financial Capital
Change 2020/21
Rs. 5.2 Bn
Rs. 28.2 Bn2020 Rs. 23.0 Bn
SHAREHOLDERS’ EQUITY As at 31 March 2021
Rs. 6.8 Bn Profits
(Rs. 1.6 Bn) Interim Dividends
23%

L B Finance PLC | Annual Report 2020/21 L B Finance PLC | Annual Report 2020/21
Commitments and Contingencies
Commitmentsandcontingenciesmainlyconsistofimportletterofcredits,guaranteesissuedtobanksandotherinstitutionsandfinancingcommitmentsgiventocustomers.
Commitmentsandcontingenciesbalancesdeclinedby53.15%fromRs.1.92Billionasat31March2020toRs.0.90Billionasat31March2021mainlyduetothedeclineinfinancingcommitmentsgiventocustomers.
Commitments andcontingencies
0
500
1,000
1,500
2,000
2020 2021
(Rs. Mn)
Contingent LiabilitiesCommitmentsTotal Commitments andContingent Liabilities
53%
CAPITAL REPORTS
Financial Capital
Statement of Cash Flows
WeactivelymanagetheCompany’sliquidityandfundingtosupportourbusinessstrategyandmeetregulatoryrequirementsatalltimes,includingunderstress.ThisisevidentwiththeincreaseinouroperatingcashflowfromoperatingactivitiesfromRs.5.67BilliontoRs.8.42BillionwiththeincreaseinprofitsdemonstratingitsabilitytoturnouttheprofitsgeneratedbytheCompanyintocash.Thecashgeneratedthroughtheoperationsarebeingmainlyusedtosettletheamountsduetobanksandtopayinterimdividendtoourshareholders.
Thisreflectsanadditionalwayofviewingourperformancethatwebelieveisusefultoinvestorsbecauseitrepresentscashthathasbeengeneratedbythecompanythroughitsoperations.
5.44
8.41
(Rs. Bn)
(0.42)
(8.23)
(8.23)
5.20
Statement of cash flows
As a
t Beg
inni
ngof
the
Year
Inve
stin
gAc
tiviti
es
Ope
ratin
gAc
tiviti
es
Fina
ncin
gAc
tiviti
es
As a
t End
of th
e Ye
ar
HORIZONTAL ANALYSIS OF FINANCIAL STATEMENTS
Horizontalanalysis isusedinthereviewofaCompany’sFinancialStatementsovermultipleperiods.Itisusuallydepictedaspercentagegrowthoverthesamelineiteminthebaseyear. Ourhorizontalanalysis allowsfinancialstatementuserstoeasilyspottrendsandgrowthpatterns.
Statement of Financial Position
As at 31 March
CAGR* Current Year Rs. ‘000
Percentage Change Base Year Rs. ‘000
2021 2021 2020 2019 2018 2017 2016
AssetsCashandCashEquivalents 0% 6,187,300 2% 2% (33%) (3%) (52%) 6,051,898FinancialAssetsRecognisedThroughProfitorLoss-MeasuredatFairValue 0% 10,862 2% (56%) (36%) (9%) (5%) 10,645
FinancialAssetsatAmortisedCost-LoansandReceivables 20% 66,778,188 152% 120% 79% 51% 27% 26,449,169
FinancialAssetsatAmortisedCost-LeaseRentalsReceivableandStockOutonHire 1% 47,359,635 5% 34% 46% 39% 23% 45,104,836
FinancialAssetsMeasuredatFairValueThroughOtherComprehensiveIncome (11%) 77,789 (44%) (57%) (35%) (12%) (15%) 138,411
OtherFinancialAssets 20% 10,453,903 152% 120% 161% 63% 62% 4,142,716OtherNonFinancialAssets 11% 920,406 71% 80% 98% 51% (43%) 538,898InvestmentinSubsidiary 100% 521,162 100% 100% 100% 100% 0% -Property,PlantandEquipment 32% 8,241,259 303% 302% 222% 129% 72% 2,045,295IntangibleAssets (6%) 26,021 (25%) 20% 15% 38% 41% 34,765Total Assets 11% 140,576,525 66% 70% 61% 43% 22% 84,516,636
Liabilities DuetoBanks 2% 16,467,179 13% 56% 69% 57% 63% 14,577,233FinancialLiabilitiesatAmortisedCost-DuetoDepositors 10% 85,860,070 61% 67% 56% 37% 13% 53,379,801
DebtInstrumentsIssuedandOtherBorrowedFunds 4% 3,113,916 20% 20% 19% 98% (21%) 2,601,282
OtherFinancialLiabilities 10% 3,043,526 63% 48% 6% (6%) 7% 1,869,940OtherNonFinancialLiabilities 11% 1,028,054 72% 52% 246% 43% 13% 597,806CurrentTaxLiabilities 20% 1,872,154 153% 3% 88% (15%) (7%) 741,251DeferredTaxLiabilities 35% 637,073 345% 625% 815% 640% 252% 143,142PostEmploymentBenefitLiability 24% 365,265 188% 172% 102% 82% 21% 126,858Total Liabilities 9% 112,387,237 52% 63% 59% 42% 22% 74,037,317
EquityStatedCapital 0% 838,282 0% 0% 0% 0% 0% 838,282Reserves 23% 7,596,106 184% 133% 95% 60% 28% 2,670,537RetainedEarnings 23% 19,754,900 183% 129% 78% 47% 18% 6,970,499Total Equity 22% 28,189,288 169% 119% 76% 46% 19% 10,479,319Total Liabilities and Equity 11% 140,576,525 66% 70% 61% 43% 22% 84,516,636
L B MICROFINANCE MYANMAR COMPANY LIMITED (LBM)
ProfitbeforetaxofLBMoperationdecreased50.03%toRs.21.44MillionfromRs.42.90Millionreflectingachallengingoperatingenvironmentandincreasedcreditimpairmentcharges.NetinterestincomeofLBMincreased9.83%to Rs.132.71MilliondespitetheCOVID-19pandemicduetothehighertransactionalvolumesduringthefirstthreequartersofthefinancialyear.OuroperationsatMyanmarduringthelastquarterofthefinancialyearwasdisruptedduetotherisksassociatedwithpoliticalinstability,civilunrestandmilitaryconflictprevailed.
ImpairmentchargesandotherlossesincreasedtoRs.36.17Million(2020- Rs.25.43Million)duetothedeteriorationineconomicoutlookdrivenbytheCOVID-19pandemicandcurrentpoliticaltension.
Operationalexpensesincreased64.74%toRs.86.06MillionfromRs.52.23MillionreflectingtheLBM’sexpansionsintothenewregions.
TotalassetsofLBMamountedto Rs.909.93Millionasat31March2021primarilyconsistofloansandreceivablesbalancewhichaccountsfor75.74%ofthetotalassetsofLBM.
GrossloansandreceivablesincreasedtoRs.688.39MillionfromRs.554.09Millionor24.24%increasepredominantlyduetothecontinuedcustomersupportofLBMtothecustomersaswellasstrongcustomerretention.Duetodepositorsincreased36.62%toRs.80.14MillionfromRs.58.66Millionaligningwiththeincreaseinloansandreceivables.
*CAGR-CompoundAnnualGrowthRate

L B Finance PLC | Annual Report 2020/21 L B Finance PLC | Annual Report 2020/21
Income Statement CAGR* Current Year Rs. ‘000
Percentage Change Base Year Rs. ‘000
Year ended 31 March 2021 2021 2020 2019 2018 2017 2016
Income 14% 29,766,124 90% 100% 87% 60% 24% 15,646,467
InterestIncome 14% 27,457,741 90% 102% 90% 62% 24% 14,428,729
InterestExpenses 15% 11,522,802 100% 136% 124% 99% 41% 5,773,255
NetInterestIncome 13% 15,934,939 84% 80% 67% 37% 13% 8,655,474
OtherOperatingIncome 14% 2,308,383 90% 69% 57% 36% 19% 1,217,737
TotalOperatingIncome 13% 18,243,322 85% 78% 65% 37% 14% 9,873,212
ImpairmentChargesand OtherLosses 33% 1,691,734 311% 345% 139% 63% (110%) 411,793
TotalOperatingExpenses 9% 5,575,890 57% 66% 58% 43% 24% 3,543,352
ProfitbeforeTaxation 12% 9,306,375 75% 43% 45% 22% 10% 5,324,615
TaxonFinancialServices 23% 1,669,323 181% 284% 240% 125% 73% 593,452
IncomeTaxExpense 9% 2,503,778 56% 51% 67% 39% 22% 1,606,822
Profit for the Year 13% 6,802,597 83% 40% 36% 14% 5% 3,717,792
VERTICAL ANALYSIS OF FINANCIAL STATEMENTS
Verticalanalysis isamethodofFinancialStatementsanalysis inwhicheachlineitemislistedasapercentageofabasefigure withinthestatement.
Statement of Financial Position Percentage ChangeAs at 31 March 2021 2020 2019 2018 2017 2016
AssetsCashandCashEquivalents 4% 4% 3% 5% 3% 7%FinancialAssetsRecognisedThroughProfitorLoss -MeasuredatFairValue 0% 0% 0% 0% 0% 0%
FinancialAssetsatAmortisedCost-LoansandReceivables 48% 40% 35% 33% 33% 31%FinancialAssetsatAmortisedCost-LeaseRentalsReceivableandStockOutonHire 34% 42% 48% 52% 54% 53%
FinancialAssetsMeasuredatFairValueThroughOtherComprehensiveIncome 0% 0% 0% 0% 0% 0%
OtherFinancialAssets 7% 6% 8% 6% 7% 5%OtherNonFinancialAssets 1% 1% 1% 1% 0% 1%InvestmentinSubsidiary 0% 0% 0% 0% 0% 0%Property,PlantandEquipment 6% 6% 5% 4% 3% 2%IntangibleAssets 0% 0% 0% 0% 0% 0%
Total Assets 100% 100% 100% 100% 100% 100%
Liabilities
DuetoBanks 12% 16% 18% 19% 23% 17%FinancialLiabilitiesatAmortisedCost-DuetoDepositors 61% 62% 61% 60% 59% 63%DebtInstrumentsIssuedandOtherBorrowedFunds 2% 2% 2% 4% 2% 3%OtherFinancialLiabilities 2% 2% 1% 1% 2% 2%OtherNonFinancialLiabilities 1% 1% 2% 1% 1% 1%CurrentTaxLiabilities 1% 1% 1% 1% 1% 1%DeferredTaxLiabilities 0% 1% 1% 1% 0% 0%PostEmploymentBenefitLiability 0% 0% 0% 0% 0% 0%Total Liabilities 80% 84% 86% 87% 88% 88%
Equity
StatedCapital 1% 1% 1% 1% 1% 1%Reserves 14% 11% 9% 8% 8% 8%RetainedEarnings 5% 4% 4% 4% 3% 3%Total Equity 20% 16% 14% 13% 12% 12%
Total Liabilities and Equity 100% 100% 100% 100% 100% 100%
CAPITAL REPORTS
Financial Capital
*CAGR-CompoundAnnualGrowthRate
Statement of Financial Position
0
50
100
150
200
2017
2018
2019
2020
2021
(%)
Lending Base Total AssetsDue to Depositors Total Equity
Income Statement
0
30
60
90
120
150
(%)
Interest Income Total Operating Expenses Interest Expenses Profit for the Year
2017
2018
2019
2020
2021
TREND ANALYSIS OF FINANCIAL STATEMENTS
L B Finance PLC | Annual Report 2020/21 L B Finance PLC | Annual Report 2020/21
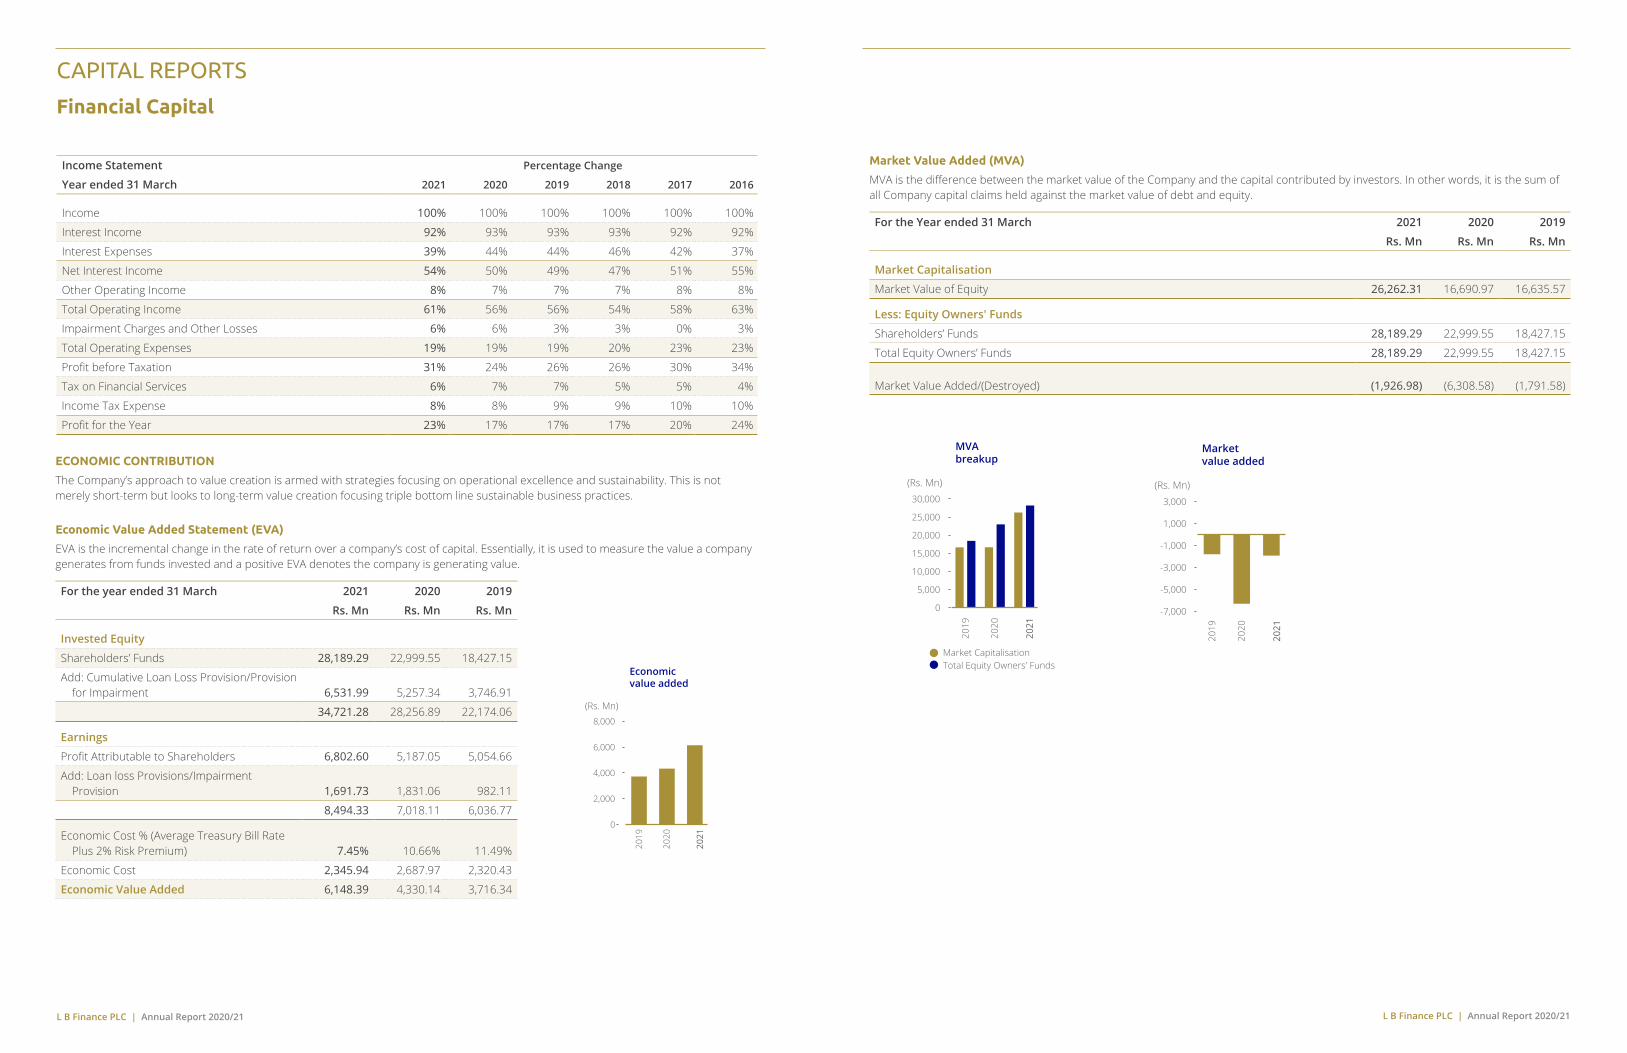
Income Statement Percentage Change
Year ended 31 March 2021 2020 2019 2018 2017 2016
Income 100% 100% 100% 100% 100% 100%
InterestIncome 92% 93% 93% 93% 92% 92%
InterestExpenses 39% 44% 44% 46% 42% 37%
NetInterestIncome 54% 50% 49% 47% 51% 55%
OtherOperatingIncome 8% 7% 7% 7% 8% 8%
TotalOperatingIncome 61% 56% 56% 54% 58% 63%
ImpairmentChargesandOtherLosses 6% 6% 3% 3% 0% 3%
TotalOperatingExpenses 19% 19% 19% 20% 23% 23%
ProfitbeforeTaxation 31% 24% 26% 26% 30% 34%
TaxonFinancialServices 6% 7% 7% 5% 5% 4%
IncomeTaxExpense 8% 8% 9% 9% 10% 10%
ProfitfortheYear 23% 17% 17% 17% 20% 24%
ECONOMIC CONTRIBUTION
TheCompany’sapproachtovaluecreationisarmedwithstrategiesfocusingonoperationalexcellenceandsustainability.Thisisnotmerelyshort-termbutlookstolong-termvaluecreationfocusingtriplebottomlinesustainablebusinesspractices.
Economic Value Added Statement (EVA)
EVAistheincrementalchangeintherateofreturnoveracompany’scostofcapital.Essentially,itisusedtomeasurethevalueacompanygeneratesfromfundsinvestedandapositiveEVAdenotesthecompanyisgeneratingvalue.
For the year ended 31 March 2021 2020 2019
Rs. Mn Rs. Mn Rs. Mn
Invested Equity
Shareholders’Funds 28,189.29 22,999.55 18,427.15
Add:CumulativeLoanLossProvision/ProvisionforImpairment 6,531.99 5,257.34 3,746.91
34,721.28 28,256.89 22,174.06
Earnings
ProfitAttributabletoShareholders 6,802.60 5,187.05 5,054.66
Add:LoanlossProvisions/ImpairmentProvision 1,691.73 1,831.06 982.11
8,494.33 7,018.11 6,036.77
EconomicCost%(AverageTreasuryBillRatePlus2%RiskPremium) 7.45% 10.66% 11.49%
EconomicCost 2,345.94 2,687.97 2,320.43
Economic Value Added 6,148.39 4,330.14 3,716.34
Economic value added
0
2,000
4,000
6,000
8,000
2019
2020
2021
(Rs. Mn)
Market Value Added (MVA)
MVAisthedifferencebetweenthemarketvalueoftheCompanyandthecapitalcontributedbyinvestors.Inotherwords,itisthesumofallCompanycapitalclaimsheldagainstthemarketvalueofdebtandequity.
For the Year ended 31 March 2021 2020 2019
Rs. Mn Rs. Mn Rs. Mn
Market Capitalisation
MarketValueofEquity 26,262.31 16,690.97 16,635.57
Less: Equity Owners' Funds
Shareholders’Funds 28,189.29 22,999.55 18,427.15
TotalEquityOwners’Funds 28,189.29 22,999.55 18,427.15
MarketValueAdded/(Destroyed) (1,926.98) (6,308.58) (1,791.58)
MVAbreakup
0
5,000
10,000
15,000
20,000
25,000
30,000
2019
2020
2021
(Rs. Mn)
Market CapitalisationTotal Equity Owners' Funds
Market value added
-7,000
-5,000
-3,000
-1,000
1,000
3,000
2019
2020
2021
(Rs. Mn)
CAPITAL REPORTS
Financial Capital

L B Finance PLC | Annual Report 2020/21 L B Finance PLC | Annual Report 2020/21
VALUEDISTRIBUTED
Rs. 29,766 Mn
InterestIncome
Rs. 27,458 Mn
Fee and CommissionIncome
Rs. 2,185 Mn
Net Trading Income
Rs. 6 Mn
Other OperatingIncome
Rs. 117 Mn
ValueGenerated
Rs. 29,766 Mn
16% 10%Economic Value Retained within the Business To Employees Salaries and Benefits
14% 37%Operating Costs To Depositors and Lenders
2019
2020
2021
2019
2020
2021
Rs. 3
,638
Mn
Rs. 4
,927
Mn
Rs. 4
,730
Mn
Rs. 2
,683
Mn
Rs. 2
,987
Mn
Rs. 2
,956
Mn
2019
2020
2021
2019
2020
2021
Rs. 3
,809
Mn
Rs. 4
,657
Mn
Rs. 4
,207
Mn
Rs. 1
3,21
9 M
n
Rs. 1
2,36
2 M
n
Rs. 1
1,12
5 M
n
7%To Providers of Capital
2019
2020
2021
Rs. 2
,252
Mn
Rs. 3
97 M
n
Rs. 2
,060
Mn
16% To Government
2019
2020
2021
Rs. 5
,014
Mn
Rs. 4
,651
Mn
Rs. 4
,508
Mn
Information on the generated and distributed value provides a basic indication of how the Company has created wealth for the stakeholders.
Components of the economic value generated and distributed provide an economic profile of the Company, which may be useful for controlling other performance indicators. Economic value generated and distributed portrays the direct monetary value added to local economy.
DIRECT ECONOMIC VALUE GENERATED AND DISTRIBUTED
For the Year ended 31 March 2021 2020 2019
Rs. Mn % Rs. Mn % Rs. Mn %
Direct Economic Value GeneratedInterestIncome 27,457.74 29,160.29 27,363.77FeeandCommissionIncome 2,184.95 1,941.63 1,782.07NetTradingIncome 6.32 (2.10) (2.56)OtherOperatingIncome 117.11 123.04 134.74Economic Value Generated 29,766.12 31,222.86 29,278.02
Economic Value DistributedOperating CostsDepreciationandAmortisationSetAside 745.24 713.39 435.38ImpairmentChargeforLoansandOtherLosses 1,691.73 1,831.06 982.11TrainingCost 4.02 18.56 10.95OtherOperatingExpenses 1,765.83 2,094.40 2,380.39
4,206.82 14.13 4,657.41 14.92 3,808.83 13.01
To EmployeesEmployeesSalariesandBenefits 2,955.81 2,986.63 2,682.61
2,955.81 9.93 2,986.63 9.57 2,682.61 9.16
To Depositors and LendersInterestExpenses 11,125.01 13,218.85 12,361.66
11,125.01 37.37 13,218.85 42.34 12,361.66 42.22
To Providers of CapitalDividendtoShareholders 1,662.17 - 1,662.17InteresttoDebentureHolders 397.79 396.55 589.66
2,059.96 6.92 396.55 1.27 2,251.83 7.69
To GovernmentIncomeTaxExpenses 2,913.97 2,683.70 2,441.73DebtRepaymentLevy - 684.71 401.53VATandNBTonFinancialServices 1,669.32 1,593.85 1,614.09CropInsuranceLevy 67.71 52.06 51.00
4,651.00 15.63 5,014.32 16.06 4,508.35 15.40
To CommunitySocialResponsibilityProjects 37.29 22.52 26.95
37.29 0.13 22.52 0.07 26.95 0.09
Economic Value Retained 4,730.24 15.89 4,926.60 15.78 3,637.79 12.42
Economic Value Distributed 29,766.12 100.00 31,222.86 100.00 29,278.02 100.00
CAPITAL REPORTS
Financial Capital
L B Finance PLC | Annual Report 2020/21 L B Finance PLC | Annual Report 2020/21
INVESTORS
LBFalwayspayattentiontomaximiseshareholders’wealthbycarefullymanagingriskandreturnwhilecraftingthebusinessstrategiesinthebestinterestofitsshareholderssincethelifebloodofLBFisitsinvestors.Weengagewithourshareholderswhoareinterestedandinvestedinthesuccessandsustainabilityofourbusiness.Doingsohelpsustounderstandexpectationsandleadstobetteroutcomesoverthelong-term.
ThishelpedtheBoardtobuildanunderstandingofwhatmatterstoourinvestorsinthelong-termandtobuildalastingandtrustingrelationshipwithourshareholders.
How does LBF Engage with its Stakeholders?
TheBoardadoptsavarietyofmethodstoengagementwithitshareholderstounderstandtheviewoftheshareholders.
TheAGMisanimportanteventintheCompany’scorporatecalendarandanexcellentopportunitytoengagewithshareholdersandforshareholderstoaskquestionsfromtheBoard.
Annualreportandinterimfinancialstatementsofthecompanywiththeendeavorstoprovideallshareholderswithclear,consistent,high-qualityinformationatregularintervals,inaccordancewithbestmarketpracticeandtherecommendationsofstockmarketauthoritiesisalsoanotherformofcommunication.
LBFalsousespressconferencesandmediareleasestoprovidebriefingabouttheCompany’sstrategy,majoreventsconcerningtheCompany’sbusinessaswell.
Engagement in Action During COVID-19
Despitethechallengescausedbythepandemic,theCompanyheldits2020AGMwithaattendanceoflimitednumberofshareholderspresencewherepossibleasaresultoftheprohibitiononpublicgatherings.TheBoardalsoensuredthatallshareholdershadtheopportunitytoraisequestionsattheAGM.
Shareholders Return
Share priceappreciation
0
10
20
30
40
50
(Rs.) 57%
2021Rs. 47.40
2020Rs. 30.13
2020
2021
InlightofthechallengesimposedbytheCOVID-19pandemicandinresponsetotherestrictionsimposedoncashdividendfromtheCentralBankofSriLanka,theBoarddecidednottodeclarefinaldividendpaymentforfinancialyear2019/20whichwasexpectedtobepaidinthefirstquarterof2020/21.TheBoardconcludedthisdifficultdecisionwasprudenttopreserveadditionalcapitaltocontinuetoservetheneedsofthecustomersintimeofcrisiswhileunderstandingtheshort-termadverseimpactontheshareholders.However,withtheimprovementsintheperformanceduringtheyear,theCompanypaidaninterimdividendofRs.12.00pershare(basedonnumberofsharespriortothesharesub-division)duringthefinancialyear2020/21.TheCompanyalsoproposedafinaldividendofRs.4.00share(basedonpostsub-divisionofshares)toensurea
sustainablereturntotheshareholdersoftheCompany.
DespitetheCOVID-19pandemic,thesharepricesoftheCompanyincreasedby57%basedontherestatedmarketpricepersharereflectingthecontinuedinvestorinterestinsharesoftheCompanyduringtheyear.
SharePriceasattheBeginningoftheYear Rs.120.50
RestatedMarketPriceBasedontheSub-Division Rs.30.13
SharePriceasattheEndoftheYear Rs.47.40
SharePriceAppreciation Rs.17.28
DividendperShare(basedonPostSub-Division) Rs.7.00
TotalReturnperShare Rs.24.28
TotalYieldperShare 80.58%
Thisdemonstratesthatweremainfocusedonachievingsustainable,long-termearningsgrowthandmaintainstabledividendincomestreamtoourshareholders.
Share Sub-Division
BasedontherecommendationsmadebytheBoard,on10March2021shareholdersapprovedthesub-divisionofordinarysharesonthebasisofasub-divisionofeveryone(01)ordinaryshareintofour(04)ordinaryshares,thusincreasingtheexisting138,514,284issuedordinarysharesoftheCompanyto554,057,136ordinaryshareswithoutinanywaychangingtheStatedCapitaloftheCompany,whichwouldremainatRs.838,282,159/-.Thesharesplitwaseffectedwiththeintentionofloweringthesharepricesofthesharestoapricerangewhichisaffordabletomostinvestorsandincreasingtheliquidityofshares.
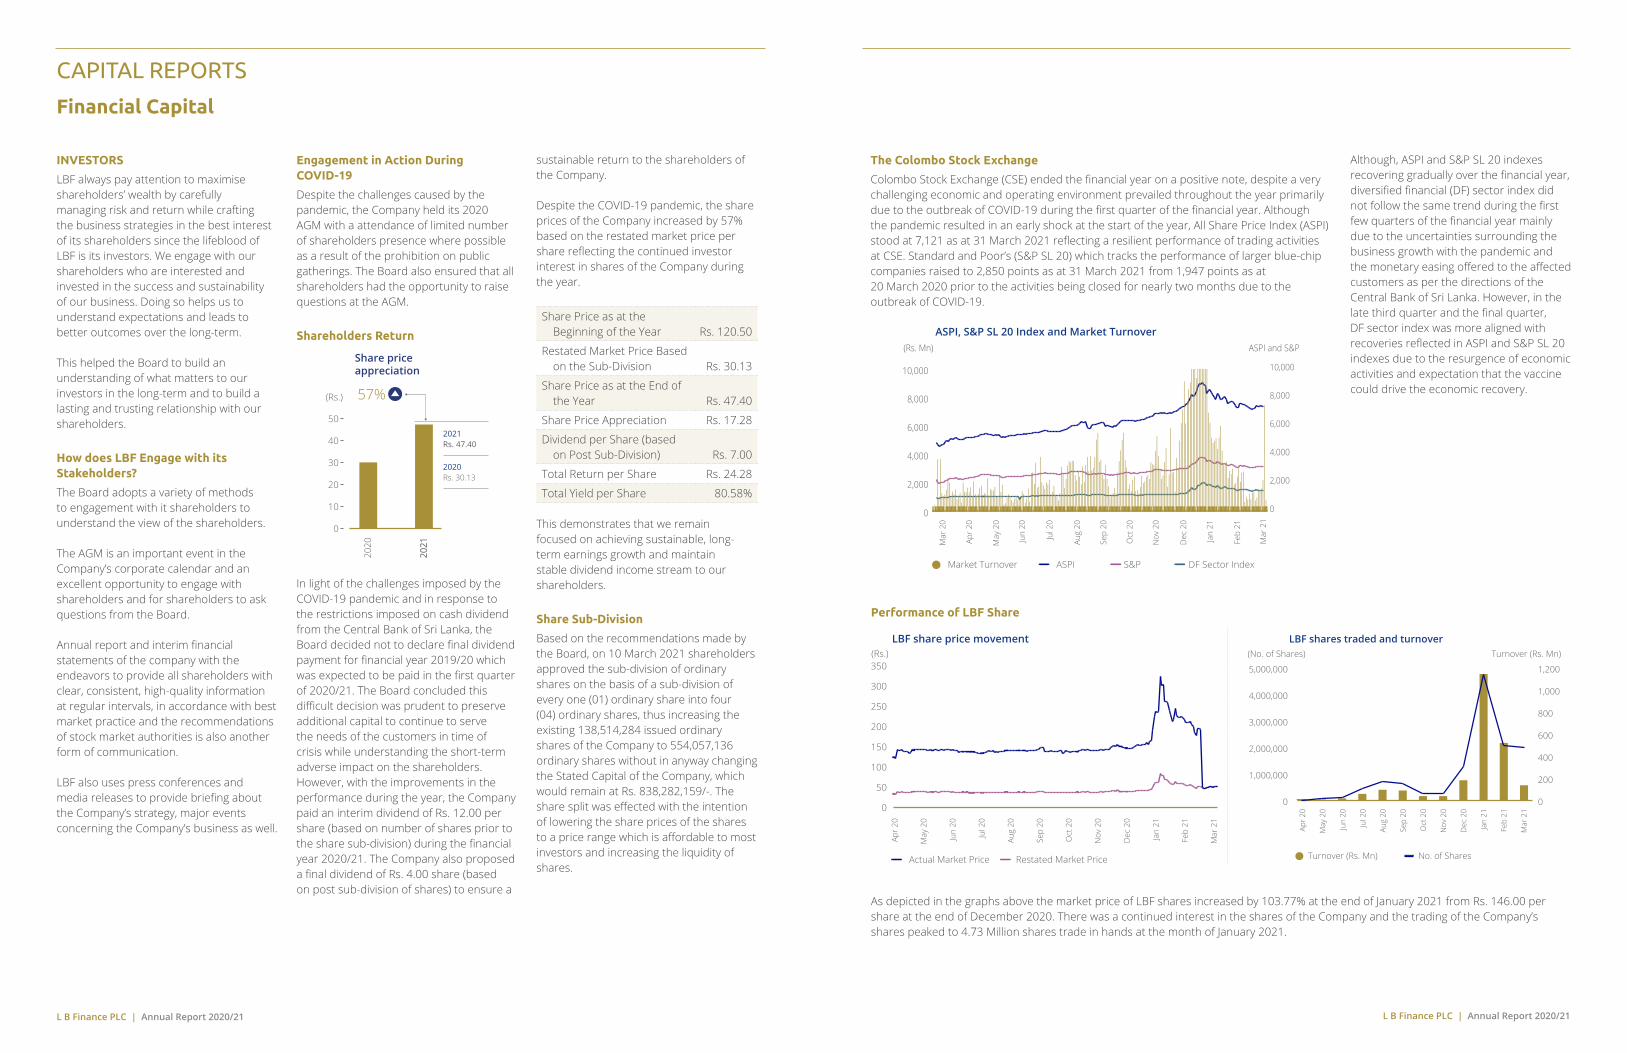
The Colombo Stock Exchange
ColomboStockExchange(CSE)endedthefinancialyearonapositivenote,despiteaverychallengingeconomicandoperatingenvironmentprevailedthroughouttheyearprimarilyduetotheoutbreakofCOVID-19duringthefirstquarterofthefinancialyear.Althoughthepandemicresultedinanearlyshockatthestartoftheyear,AllSharePriceIndex(ASPI)stoodat7,121asat31March2021reflectingaresilientperformanceoftradingactivitiesatCSE.StandardandPoor’s(S&PSL20)whichtrackstheperformanceoflargerblue-chipcompaniesraisedto2,850pointsasat31March2021from1,947pointsasat 20March2020priortotheactivitiesbeingclosedfornearlytwomonthsduetotheoutbreakofCOVID-19.
0
2,000
4,000
6,000
8,000
10,000
ASPI, S&P SL 20 Index and Market Turnover
0
2,000
4,000
6,000
8,000
10,000
Market Turnover
Mar
20
Apr 2
0
May
20
Jun
20
Jul 2
0
Aug
20
Sep
20
Oct
20
Nov
20
Dec
20
Jan
21
Feb
21
Mar
21
ASPI
S&P
DF Sector Index
(Rs. Mn) ASPI and S&P
Although,ASPIandS&PSL20indexesrecoveringgraduallyoverthefinancialyear,diversifiedfinancial(DF)sectorindexdidnotfollowthesametrendduringthefirstfewquartersofthefinancialyearmainlyduetotheuncertaintiessurroundingthebusinessgrowthwiththepandemicandthemonetaryeasingofferedtotheaffectedcustomersasperthedirectionsoftheCentralBankofSriLanka.However,inthelatethirdquarterandthefinalquarter,DFsectorindexwasmorealignedwithrecoveriesreflectedinASPIandS&PSL20indexesduetotheresurgenceofeconomicactivitiesandexpectationthatthevaccinecoulddrivetheeconomicrecovery.
Performance of LBF Share
LBF share price movement
0
50
100
150
200
250
300
350
Actual Market Price Restated Market Price
(Rs.)
Mar
21
Apr 2
0
May
20
Jun
20
Jul 2
0
Aug
20
Sep
20
Oct
20
Nov
20
Dec
20
Jan
21
Feb
21
AsdepictedinthegraphsabovethemarketpriceofLBFsharesincreasedby103.77%attheendofJanuary2021fromRs.146.00pershareattheendofDecember2020.TherewasacontinuedinterestinthesharesoftheCompanyandthetradingoftheCompany’ssharespeakedto4.73MillionsharestradeinhandsatthemonthofJanuary2021.
CAPITAL REPORTS
Financial Capital
LBF shares traded and turnover
No. of Shares
0
200
400
600
800
1,000
1,200
0
1,000,000
2,000,000
3,000,000
4,000,000
5,000,000
Turnover (Rs. Mn)
(No. of Shares) Turnover (Rs. Mn)
Mar
21
Apr 2
0
May
20
Jun
20
Jul 2
0
Aug
20
Sep
20
Oct
20
Nov
20
Dec
20
Jan
21
Feb
21

L B Finance PLC | Annual Report 2020/21 L B Finance PLC | Annual Report 2020/21
Annual Performance
2020/21 2019/20 2018/19
Share Price
Highest(Rs.) 348.75 167.50 129.90
Lowest(Rs.) *42.6 114.00 110.00
Closing(Rs.) *47.4 120.50 120.10
NumberofTransactions 21,681 2,995 1,857
NumberofSharesTraded 12,559,335 3,552,610 2,845,955
ValueofSharesTraded(Rs.Billion) 2.32 0.5 0.33
NumberofDaysTraded 216 223 218
AverageDailyTurnover(Rs.Million) 10.73 2.27 1.41
MarketCapitalisation(Rs.Billion) 26.26 16.69 16.70
*Pricepersharerepresentsthesharepriceafterthesharesub-division.
Quarterly Performance
Quarter 1 Quarter 2 Quarter 3 Quarter 4
Share PriceHighest(Rs.) 142.00 154.00 151.90 348.75
Lowest(Rs.) 114.80 128.00 129.00 *42.6
Closing(Rs.) 140.00 143.70 146.00 *47.4
NumberofTransactions 685 3,540 3,319 14,137
NumberofSharesTraded 169,819 1,790,586 1,810,166 8,788,764
ValueofSharesTraded(Rs.Million) 23.40 242.09 254.59 1,798.27
NumberofDaysTraded 35 64 62 55
AverageDailyTurnover(Rs.Million) 0.67 3.78 4.11 32.70
*Noticeablereductioninpricepershareofthequarter4representsthesharepriceafterthesharesub-division.
FLOAT ADJUSTED MARKET CAPITALISATION
TheFloatadjustedmarketcapitalisationasat31March2021–Rs.5,714,447,683/-
TheFloatadjustedmarketcapitalisationoftheCompanyfallsunderOption5ofRule7.13.1(a)oftheListingRulesoftheColomboStockExchangeandtheCompanyhascompliedwiththeminimumpublicholdingrequirementapplicableunderthesaidoption.
LBF SHARE
General Information
As at 31 March 2021 2020
TotalNumberofSharesinIssue 554,057,136 138,514,284
PublicShareholding 21.76% 21.83%
BetaValueAgainstASPI 2.48 1.43
Other Information
Stocksymbol LFIN.N0000
Newswire codes of LBF Share:
Bloomberg LFIN.SL
Dowjones LFINN
Reuters LFIN.CM
CAPITAL REPORTS
Financial Capital
Weaimtodelivertheexpectationofourshareholdersthroughexecutionofourstrategieswhileservingourcustomertomeettheirneeds.
LBFinanceprudentlymanageitsearningswithapolicytoprovidesustainablereturntoshareholderswhilegivingthemanagementtheflexibilitytoreinvestcapitaltogrowtheCompany.
Weareinvestedtoprovidelongtermvaluetoourshareholders.
LBFinancestrivetocreatevalueforourshareholderfundinginassessingtheperformanceofafundagainstthemarketorindustrybenchmarks.
Weensurethatthecompanyisoperatedonafoundationofstrengthandiswell-positionedtodeliversustainablereturnstoourshareholders.
MARKET CAPITALISATION (AS AT 31 MARCH)
Year Shareholders’ Funds
Rs. Mn
LFIN Market Capitalisation
Rs. Mn
CSE Market Capitalisation
Rs. Mn
Market Capitalisation as % of CSE Market
Capitalisation
2016 10,479 14,696 2,586,150 0.57%
2017 12,510 16,400 2,662,860 0.62%
2018 15,349 16,604 3,032,710 0.54%
2019 18,427 16,635 2,605,899 0.64%
2020 22,999 16,690 2,128,266 0.78%
2021 28,189 26,262 3,111,259 0.84%
2019
2020
2021
29.9
3%
26.5
8%
Return onEquity
25.0
4%
2019
2020
2021
Rs. 9
.12
Rs. 9
.36
Rs. 1
2.28
EarningsPer Share
2019
2020
2021
Rs. 3
3.26
Rs. 4
1.51
Rs. 5
0.88
Net Assets Valueper Share
2019
2020
2021
3.29
3.22
3.86
Price Earnings (PE)
2019
2020
2021
Rs. 1
8,42
7 M
n
Rs. 2
2,99
9 M
n
Rs. 2
8,18
9 M
n
ShareholderFunds
AsindicatedabovethemarketcapitalisationoftheCompanyincreasedfromRs.16.69Billionin2020toRs.26.26Billionin2021accountingfor0.84%(2020–0.78%)ofthetotalmarketcapitalisation.TheCompany’ssharesareoneofthemostprominentsharesamongthelistedsharesoftheCompany.ThetotalmarketcapitalisationoftheCSEasat31March2021wasRs.3,111BillioncomparedtoRs.2,128Billionasat31March2020anincreaseof46.19%.MarketcapitalisationoftheCompanyalsoincreasedsignificantlyfromRs.16.69BilliontoRs.26.26Billionor57.34%increase.
KEY SHAREHOLDER DATA
L B Finance PLC | Annual Report 2020/21 L B Finance PLC | Annual Report 2020/21
CAPITAL REPORTS
Financial Capital
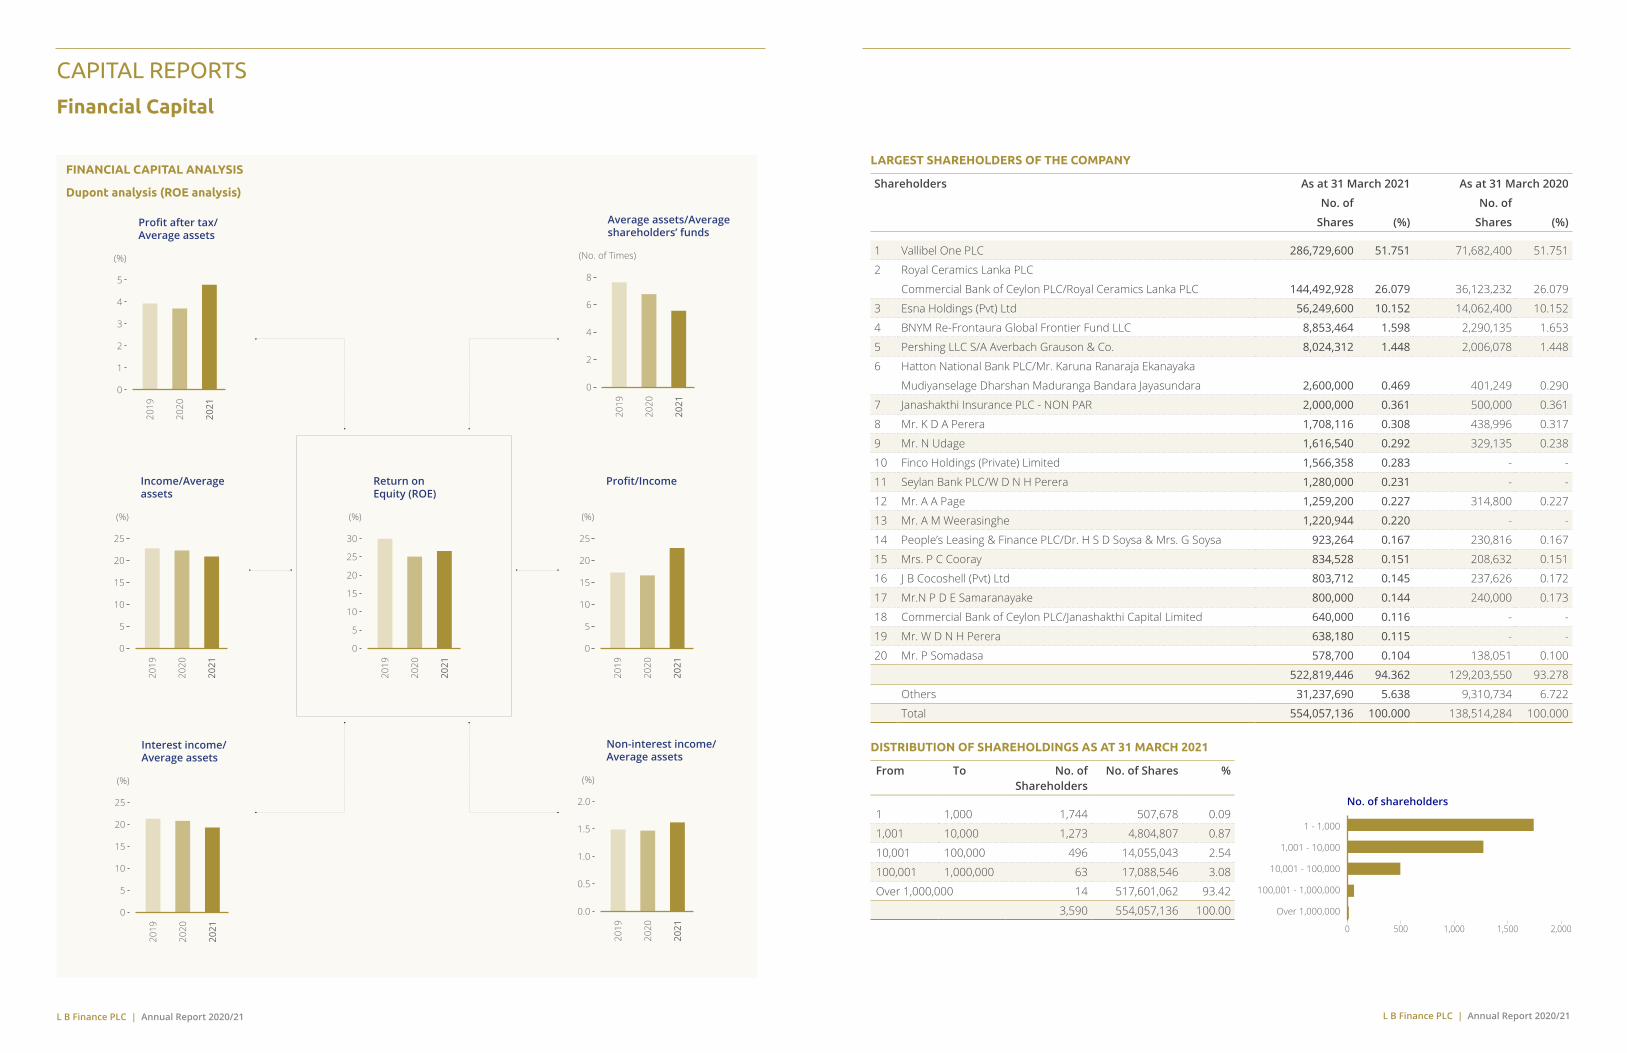
LARGEST SHAREHOLDERS OF THE COMPANY
Shareholders As at 31 March 2021 As at 31 March 2020
No. of No. of
Shares (%) Shares (%)
1 VallibelOnePLC 286,729,600 51.751 71,682,400 51.751
2 RoyalCeramicsLankaPLC
CommercialBankofCeylonPLC/RoyalCeramicsLankaPLC 144,492,928 26.079 36,123,232 26.079
3 EsnaHoldings(Pvt)Ltd 56,249,600 10.152 14,062,400 10.152
4 BNYMRe-FrontauraGlobalFrontierFundLLC 8,853,464 1.598 2,290,135 1.653
5 PershingLLCS/AAverbachGrauson&Co. 8,024,312 1.448 2,006,078 1.448
6 HattonNationalBankPLC/Mr.KarunaRanarajaEkanayaka
MudiyanselageDharshanMadurangaBandaraJayasundara 2,600,000 0.469 401,249 0.290
7 JanashakthiInsurancePLC-NONPAR 2,000,000 0.361 500,000 0.361
8 Mr.KDAPerera 1,708,116 0.308 438,996 0.317
9 Mr.NUdage 1,616,540 0.292 329,135 0.238
10 FincoHoldings(Private)Limited 1,566,358 0.283 - -
11 SeylanBankPLC/WDNHPerera 1,280,000 0.231 - -
12 Mr.AAPage 1,259,200 0.227 314,800 0.227
13 Mr.AMWeerasinghe 1,220,944 0.220 - -
14 People’sLeasing&FinancePLC/Dr.HSDSoysa&Mrs.GSoysa 923,264 0.167 230,816 0.167
15 Mrs.PCCooray 834,528 0.151 208,632 0.151
16 JBCocoshell(Pvt)Ltd 803,712 0.145 237,626 0.172
17 Mr.NPDESamaranayake 800,000 0.144 240,000 0.173
18 CommercialBankofCeylonPLC/JanashakthiCapitalLimited 640,000 0.116 - -
19 Mr.WDNHPerera 638,180 0.115 - -
20 Mr.PSomadasa 578,700 0.104 138,051 0.100
522,819,446 94.362 129,203,550 93.278
Others 31,237,690 5.638 9,310,734 6.722
Total 554,057,136 100.000 138,514,284 100.000
DISTRIBUTION OF SHAREHOLDINGS AS AT 31 MARCH 2021
From To No. of Shareholders
No. of Shares %
1 1,000 1,744 507,678 0.09
1,001 10,000 1,273 4,804,807 0.87
10,001 100,000 496 14,055,043 2.54
100,001 1,000,000 63 17,088,546 3.08
Over1,000,000 14 517,601,062 93.42
3,590 554,057,136 100.00
No. of shareholders
0 500 1,000 1,500 2,000
1 - 1,000
1,001 - 10,000
10,001 - 100,000
100,001 - 1,000,000
Over 1,000,000
FINANCIAL CAPITAL ANALYSIS
Dupont analysis (ROE analysis)
Return onEquity (ROE)
0
5
10
15
20
25
30
(%)
2019
2020
2021
Profit after tax/Average assets
0
1
2
3
4
5
(%)
2019
2020
2021
Average assets/Averageshareholders’ funds
0
2
4
6
8
(No. of Times)
2019
2020
2021
Income/Averageassets
0
5
10
15
20
25
(%)
2019
2020
2021
Profit/Income
0
5
10
15
20
25
(%)
2019
2020
2021
Interest income/Average assets
0
5
10
15
20
25
(%)
2019
2020
2021
Non-interest income/Average assets
0.0
0.5
1.0
1.5
2.0
(%)
2019
2020
2021
L B Finance PLC | Annual Report 2020/21 L B Finance PLC | Annual Report 2020/21
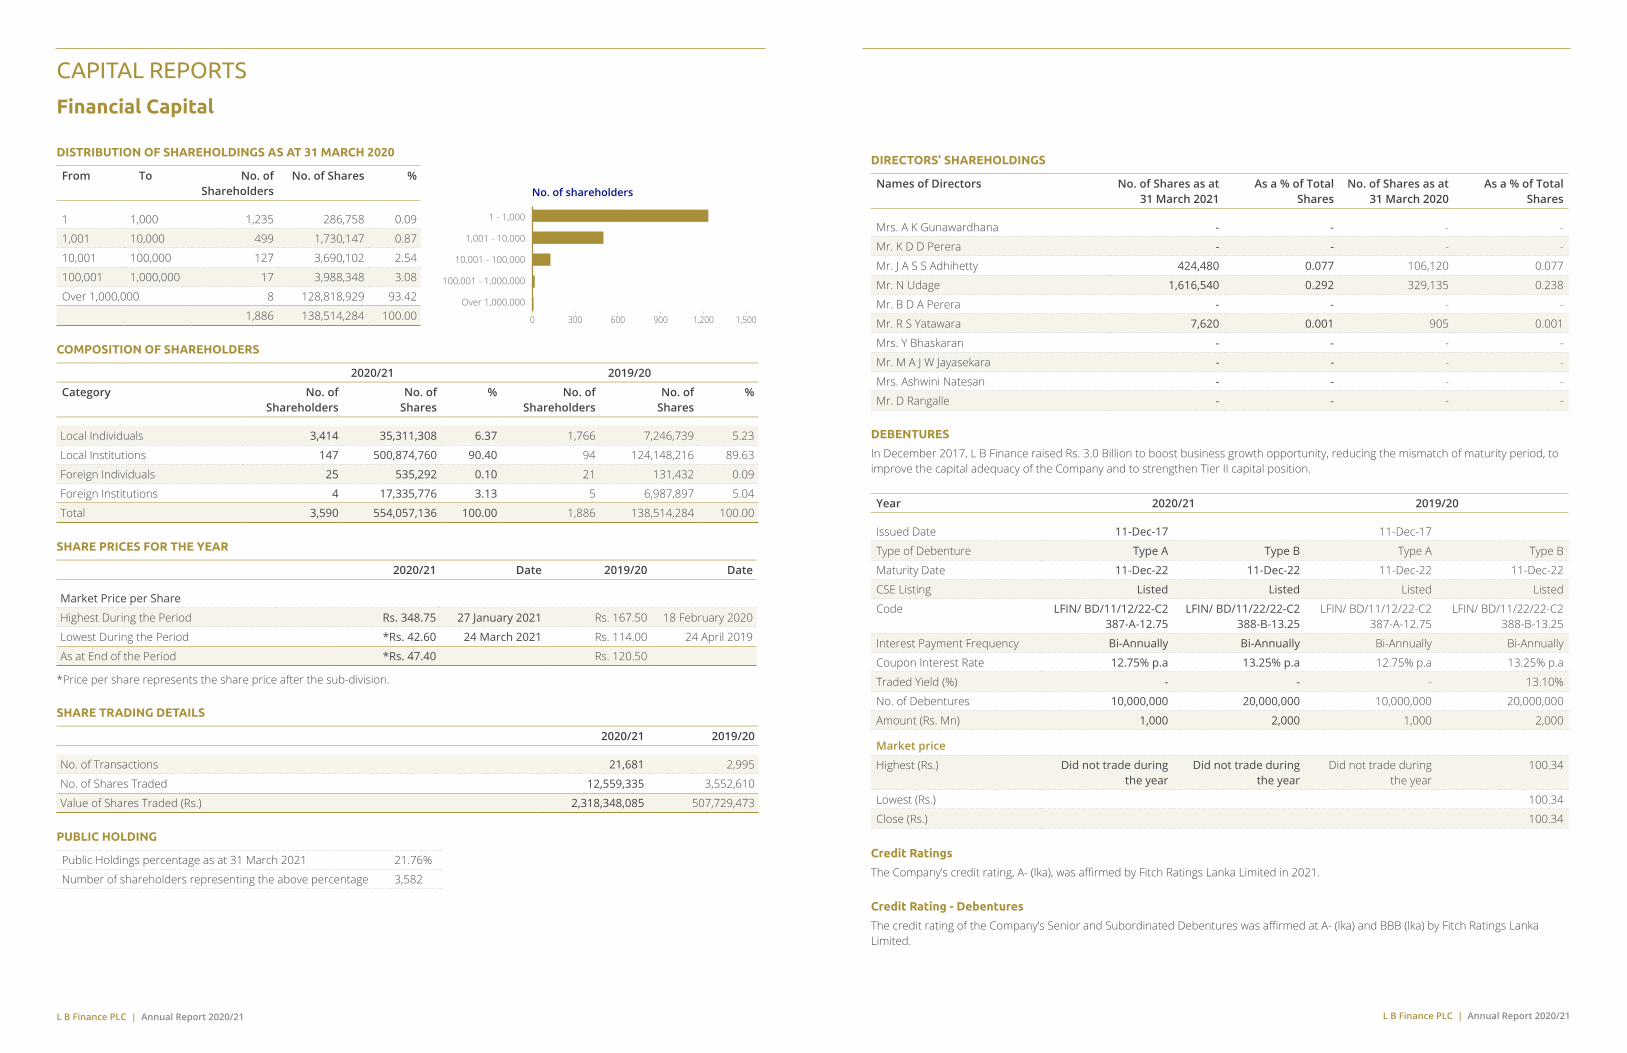
DISTRIBUTION OF SHAREHOLDINGS AS AT 31 MARCH 2020
From To No. of Shareholders
No. of Shares %
1 1,000 1,235 286,758 0.09
1,001 10,000 499 1,730,147 0.87
10,001 100,000 127 3,690,102 2.54
100,001 1,000,000 17 3,988,348 3.08
Over1,000,000 8 128,818,929 93.42
1,886 138,514,284 100.00
COMPOSITION OF SHAREHOLDERS
2020/21 2019/20
Category No. of Shareholders
No. of Shares
% No. of Shareholders
No. of Shares
%
LocalIndividuals 3,414 35,311,308 6.37 1,766 7,246,739 5.23
LocalInstitutions 147 500,874,760 90.40 94 124,148,216 89.63
ForeignIndividuals 25 535,292 0.10 21 131,432 0.09
ForeignInstitutions 4 17,335,776 3.13 5 6,987,897 5.04
Total 3,590 554,057,136 100.00 1,886 138,514,284 100.00
SHARE PRICES FOR THE YEAR
2020/21 Date 2019/20 Date
Market Price per Share
HighestDuringthePeriod Rs. 348.75 27 January 2021 Rs.167.50 18February2020
LowestDuringthePeriod *Rs. 42.60 24 March 2021 Rs.114.00 24April2019
AsatEndofthePeriod *Rs. 47.40 Rs.120.50
*Pricepersharerepresentsthesharepriceafterthesub-division.
SHARE TRADING DETAILS
2020/21 2019/20
No.ofTransactions 21,681 2,995
No.ofSharesTraded 12,559,335 3,552,610
ValueofSharesTraded(Rs.) 2,318,348,085 507,729,473
PUBLIC HOLDING
PublicHoldingspercentageasat31March2021 21.76%
Numberofshareholdersrepresentingtheabovepercentage 3,582
No. of shareholders
0 300 600 900 1,200 1,500
1 - 1,000
1,001 - 10,000
10,001 - 100,000
100,001 - 1,000,000
Over 1,000,000
DIRECTORS’ SHAREHOLDINGS
Names of Directors No. of Shares as at 31 March 2021
As a % of Total Shares
No. of Shares as at 31 March 2020
As a % of Total Shares
Mrs.AKGunawardhana - - - -
Mr.KDDPerera - - - -
Mr.JASSAdhihetty 424,480 0.077 106,120 0.077
Mr.NUdage 1,616,540 0.292 329,135 0.238
Mr.BDAPerera - - - -
Mr.RSYatawara 7,620 0.001 905 0.001
Mrs.YBhaskaran - - - -
Mr.MAJWJayasekara - - - -
Mrs.AshwiniNatesan - - - -
Mr.DRangalle - - - -
DEBENTURES
InDecember2017,LBFinanceraisedRs.3.0Billiontoboostbusinessgrowthopportunity,reducingthemismatchofmaturityperiod,toimprovethecapitaladequacyoftheCompanyandtostrengthenTierIIcapitalposition.
Year 2020/21 2019/20
IssuedDate 11-Dec-17 11-Dec-17
TypeofDebenture Type A Type B TypeA TypeB
MaturityDate 11-Dec-22 11-Dec-22 11-Dec-22 11-Dec-22
CSEListing Listed Listed Listed Listed
Code LFIN/ BD/11/12/22-C2 387-A-12.75
LFIN/ BD/11/22/22-C2 388-B-13.25
LFIN/BD/11/12/22-C2387-A-12.75
LFIN/BD/11/22/22-C2388-B-13.25
InterestPaymentFrequency Bi-Annually Bi-Annually Bi-Annually Bi-Annually
CouponInterestRate 12.75% p.a 13.25% p.a 12.75%p.a 13.25%p.a
TradedYield(%) - - - 13.10%
No.ofDebentures 10,000,000 20,000,000 10,000,000 20,000,000
Amount(Rs.Mn) 1,000 2,000 1,000 2,000
Market price
Highest(Rs.) Did not trade during the year
Did not trade during the year
Didnottradeduringtheyear
100.34
Lowest(Rs.) 100.34
Close(Rs.) 100.34
Credit Ratings
TheCompany’screditrating,A-(lka),wasaffirmedbyFitchRatingsLankaLimitedin2021.
Credit Rating - Debentures
ThecreditratingoftheCompany’sSeniorandSubordinatedDebentureswasaffirmedatA-(lka)andBBB(lka)byFitchRatingsLankaLimited.
CAPITAL REPORTS
Financial Capital