1. 2 bank results shareholders diversification efficiency segments community opportunities
TRANSCRIPT
11
22
BankBank
ResultsResults
ShareholdersShareholders
DiversificationDiversification
EfficiencyEfficiency
SegmentsSegments
CommunityCommunity
OpportunitiesOpportunities

33
Economic OutlookEconomic Outlook
IncorporationsIncorporations
SegmentationSegmentation
Corporate GovernanceCorporate Governance
AcquisitionsAcquisitions
EfficiencyEfficiency
44
BankBank
ResultsResults
ShareholdersShareholders
DiversificationDiversification
EfficiencyEfficiency
SegmentsSegments
CommunityCommunity
OpportunitiesOpportunities
55
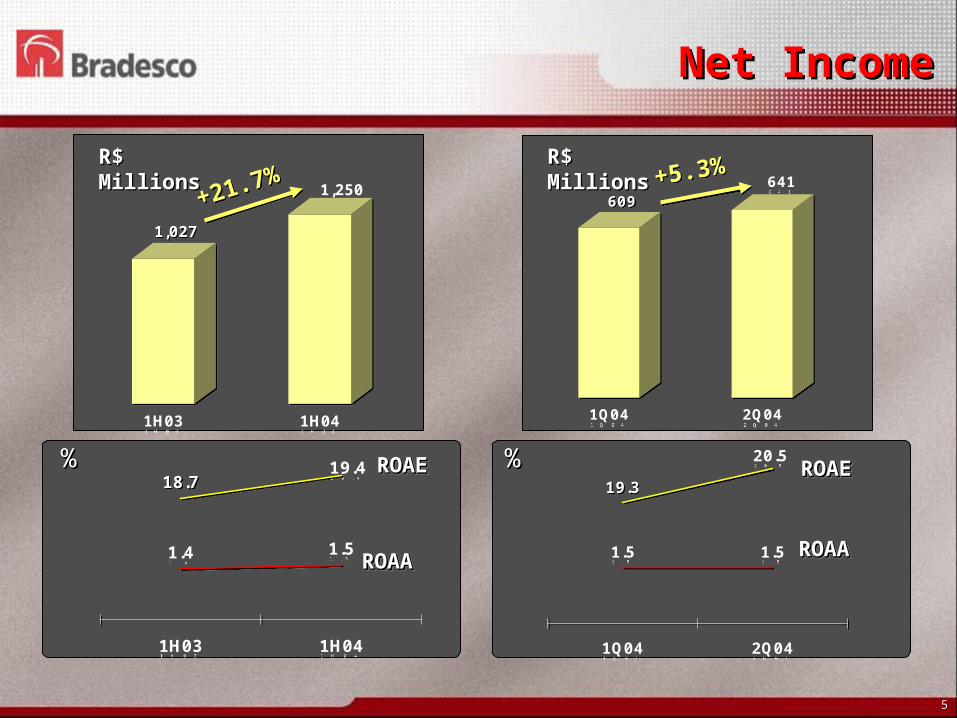
Net IncomeNet Income
1,027
1,250
1H03 1H04
1,027
1,250
1H03 1H04
R$ R$ MillionsMillions
+21.7%+21.7%
609641
1Q04 2Q04
609641
1Q04 2Q04
+5.3%+5.3%
18.719.4
1.4 1.5
1H03 1H04
18.719.4
1.4 1.5
1H03 1H04
%% ROAEROAEROAEROAE
ROAAROAAROAAROAA
%%
R$ R$ MillionsMillions
19.3
20.5
1.51.5
1Q04 2Q04
19.3
20.5
1.51.5
1Q04 2Q04
ROAEROAEROAEROAE
ROAAROAAROAAROAA
66
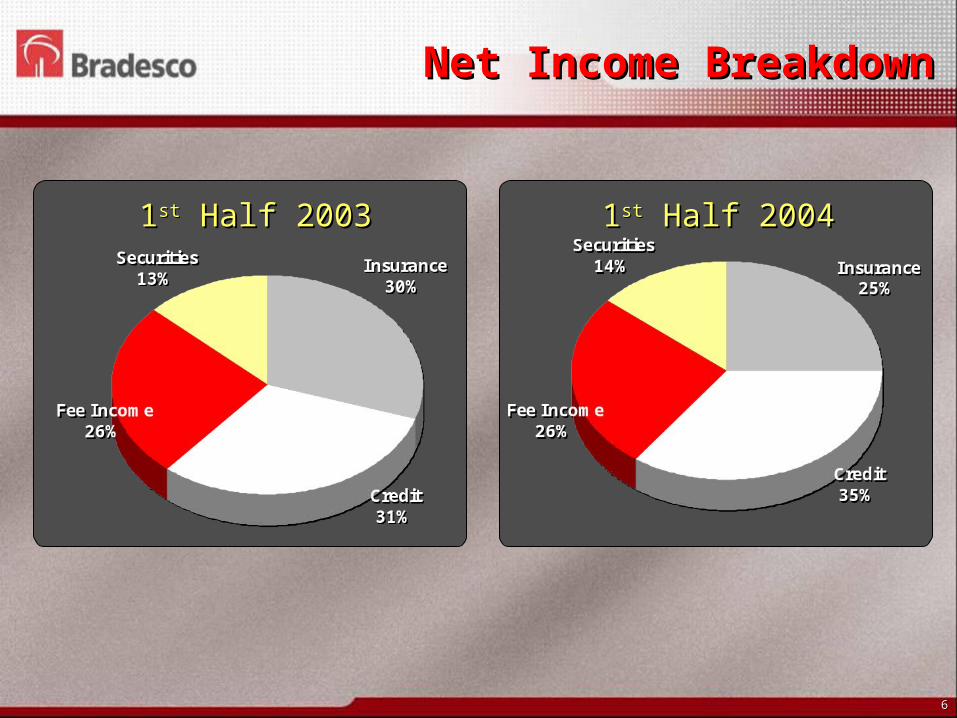
Net Income BreakdownNet Income Breakdown
11stst Half 2003 Half 2003 11stst Half 2004 Half 2004
77
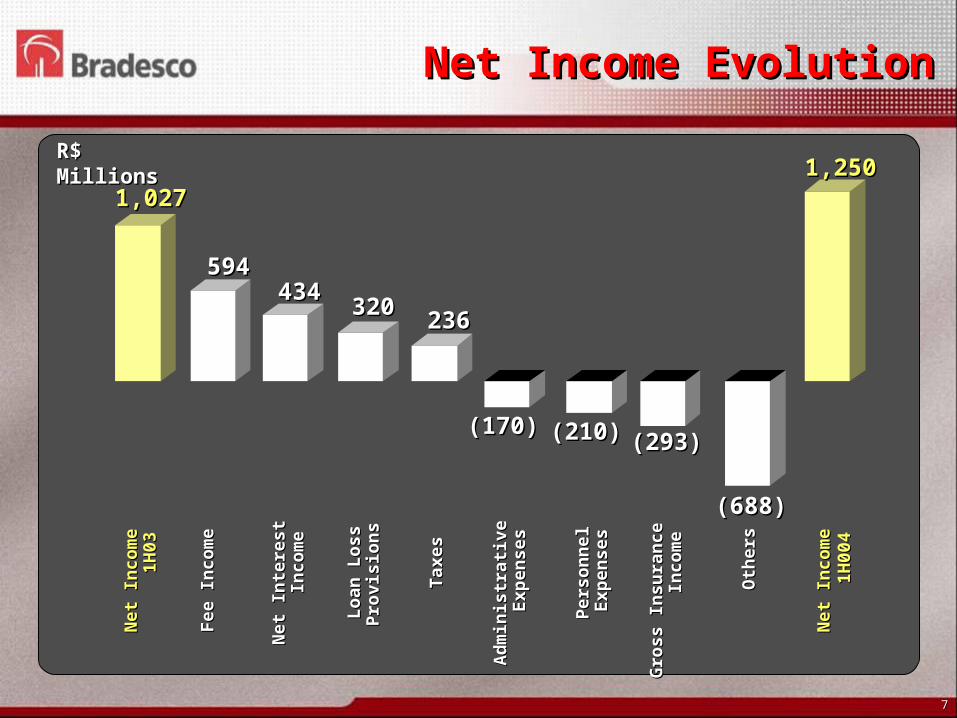
Net Income EvolutionNet Income Evolution
1,2501,2501,0271,027
Net
Incom
eN
et
Incom
e1H
03
1H
03
434434N
et
Inte
rest
Net
Inte
rest
Incom
eIn
com
e320320
Loan
Loss
Loan
Loss
Pro
vis
ion
sP
rovis
ion
s
594594
Fee I
ncom
eFee I
ncom
e
(210)(210)
Pers
on
nel
Pers
on
nel
Exp
en
ses
Exp
en
ses
(170)(170)
Ad
min
istr
ati
ve
Ad
min
istr
ati
ve
Exp
en
ses
Exp
en
ses
(293)(293)
Gro
ss I
nsu
ran
ce
Gro
ss I
nsu
ran
ce
Incom
eIn
com
e
236236
Taxes
Taxes
(688)(688)
Oth
ers
Oth
ers
Net
Incom
eN
et
Incom
e1H
004
1H
004
R$ R$ MillionsMillions
88
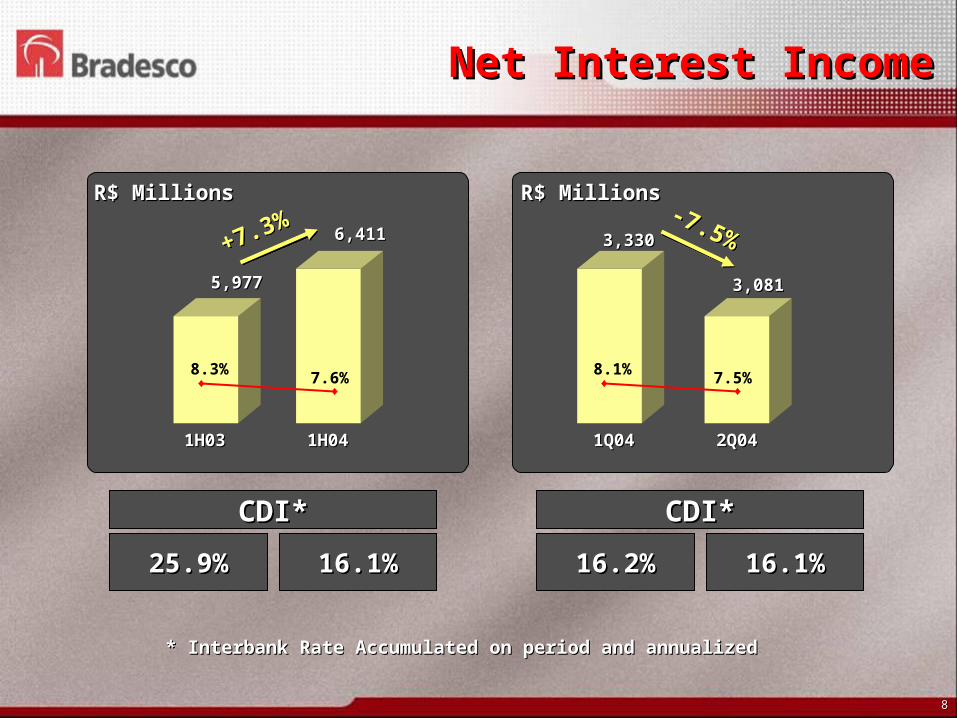
CDI*CDI*
5,9775,977
6,4116,411
1H031H03 1H041H04
Net Interest IncomeNet Interest Income
+7.3%+7.3% -7.5%
-7.5%
25.9%25.9% 16.1%16.1% 16.2%16.2% 16.1%16.1%
CDI*CDI*
R$ MillionsR$ Millions
8.3% 7.6%
1Q041Q04 2Q042Q04
3,0813,081
3,3303,330
8.1% 7.5%
* Interbank Rate Accumulated on period and annualized* Interbank Rate Accumulated on period and annualized
R$ MillionsR$ Millions

99
2,100
2,694
1H03 1H04
2,100
2,694
1H03 1H04
Fee IncomeFee Income
+28.3%+28.3% 1,3191,375
1Q04 2Q04
1,3191,375
1Q04 2Q04
+4.2%+4.2%
R$ MillionsR$ Millions R$ MillionsR$ Millions
1010
509509
630630
394394
482482
246246
423423
271271
371371
285285 301301
124124 1261269090 100100
443535
1818 3131
158158195195
Serv
ice
Serv
ice
Card
sC
ard
s
Asse
Asse tt
Cre
dit
Cre
dit
Collecti
on
Collecti
on
Inte
rban
kIn
terb
an
k
of
Taxes
of
Taxes
Con
sort
ium
Con
sort
ium
Cu
sto
dy
Cu
sto
dy
an
d B
rokera
ge
an
d B
rokera
ge
Oth
ers
Oth
ers
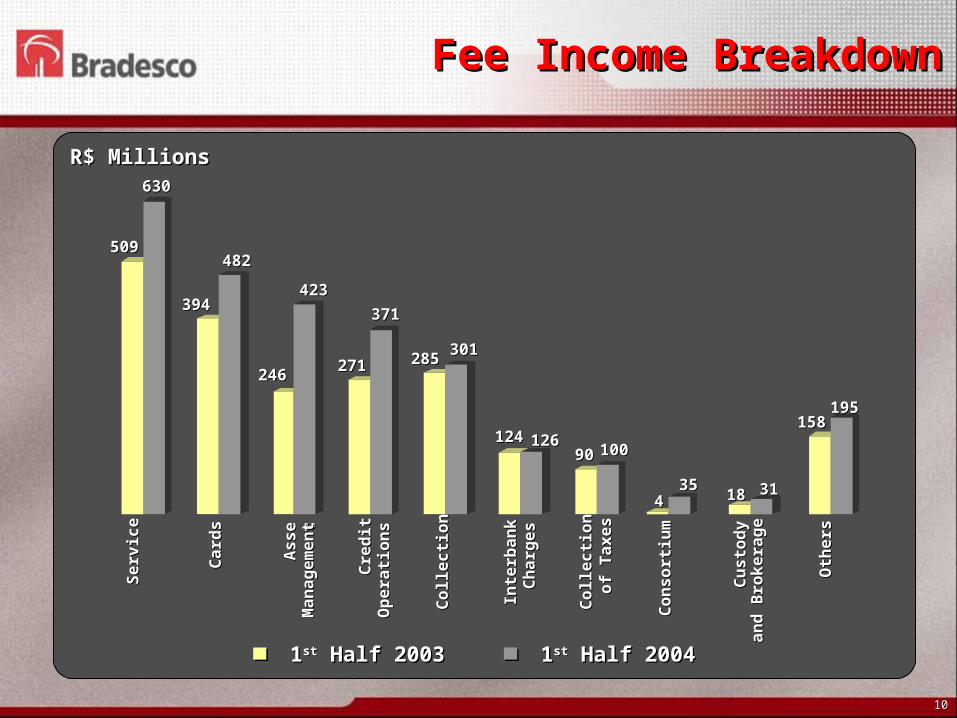
Fee Income Fee Income BreakdownBreakdown
11stst Half 2003 Half 2003 11stst Half 2004 Half 2004
R$ MillionsR$ Millions
Man
ag
em
en
Man
ag
em
en tt
Op
era
tion
sO
pera
tion
s
Ch
arg
es
Ch
arg
es
Collecti
on
Collecti
on
1111
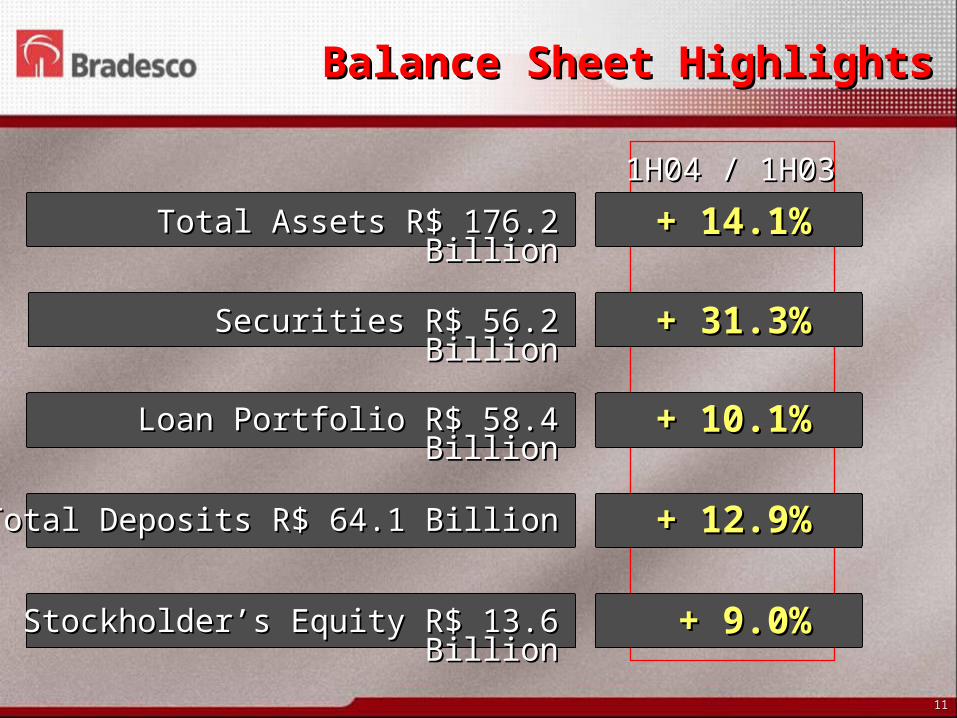
Balance Sheet HighlightsBalance Sheet Highlights
Total Assets R$ 176.2 BillionTotal Assets R$ 176.2 Billion
+ 31.3%+ 31.3%
Loan Portfolio R$ 58.4 BillionLoan Portfolio R$ 58.4 Billion
+ 12.9%+ 12.9%
Stockholder’s Equity R$ 13.6 Stockholder’s Equity R$ 13.6 BillionBillion
+ 14.1%+ 14.1%
Securities R$ 56.2 Securities R$ 56.2 BillionBillion
+ 10.1%+ 10.1%
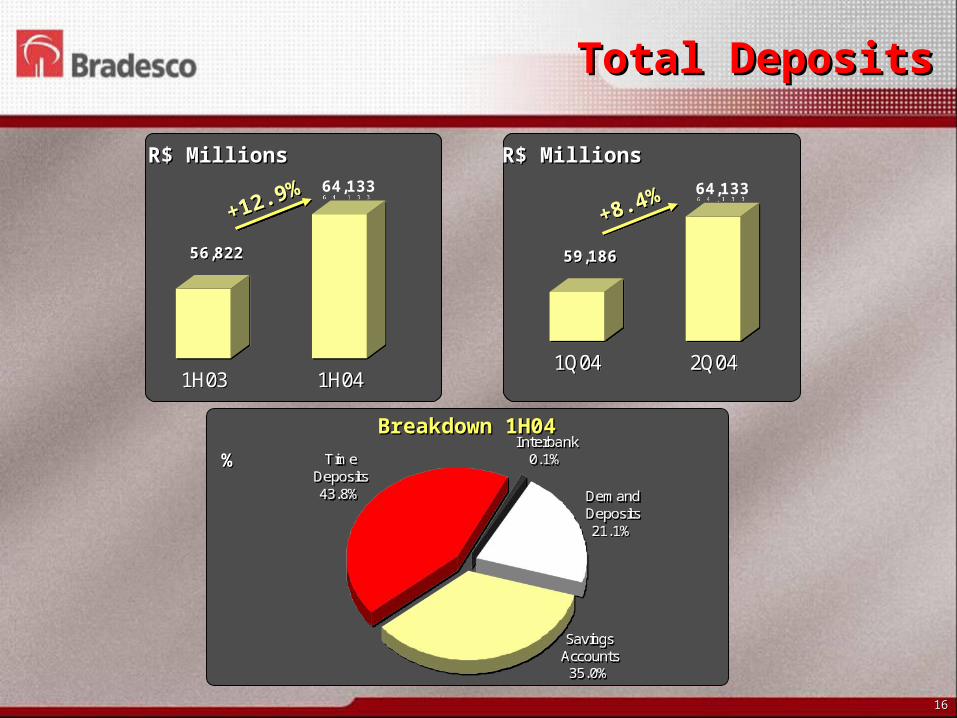
Total Deposits R$ 64.1 BillionTotal Deposits R$ 64.1 Billion
+ 9.0%+ 9.0%
1H04 / 1H031H04 / 1H03

1212
Total AssetsTotal Assets
+14.1%
+14.1% +9.5%+9.5%
R$ MillionsR$ Millions R$ MillionsR$ Millions
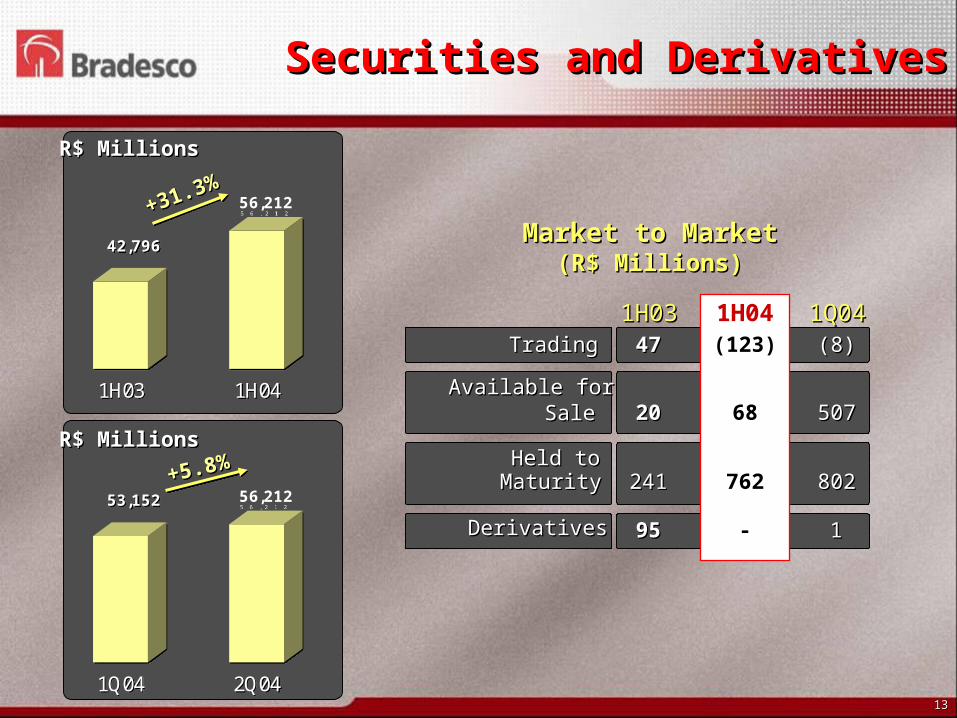
1313
53,152 56,212
1Q04 2Q04
53,152 56,212
1Q04 2Q04
42,796
56,212
1H03 1H04
42,796
56,212
1H03 1H04
Securities and DerivativesSecurities and Derivatives
+31.3%+31.3%
+5.8%+5.8%
1H031H03 1Q041Q04TradingTrading 4747 (8)(8)
Available forAvailable forSaleSale 2020 507507
Held toHeld toMaturityMaturity 241241 802802
DerivativesDerivatives 9595 11
Market to MarketMarket to Market(R$ Millions)(R$ Millions)
R$ MillionsR$ Millions
R$ MillionsR$ Millions
1H04(123)
68
762
-
1414
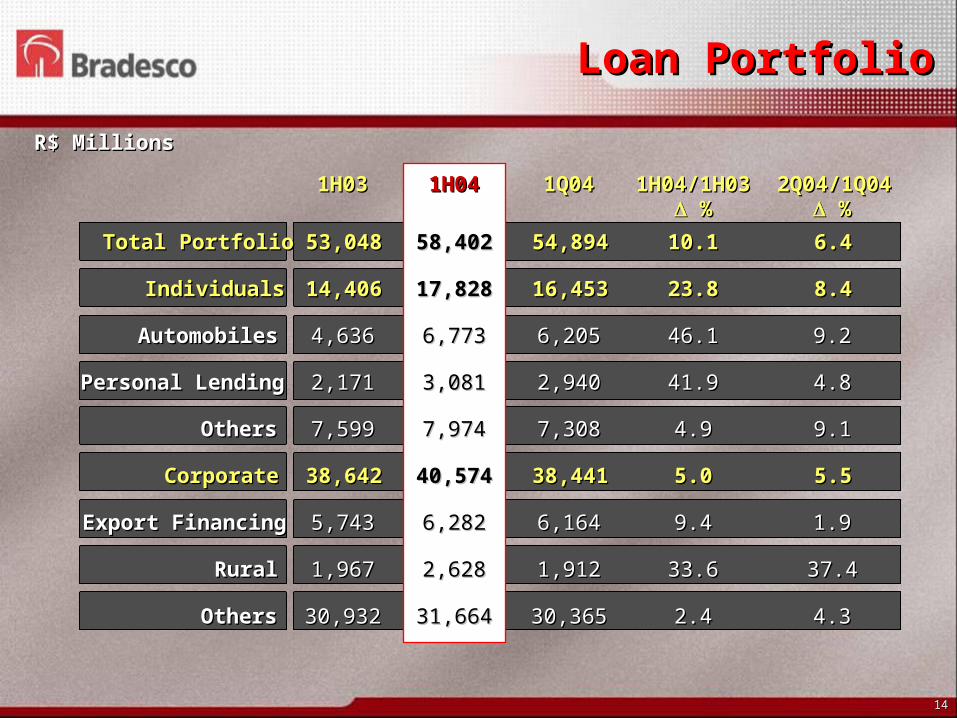
Loan PortfolioLoan Portfolio
1H031H03 1Q041Q04 1H04/1H031H04/1H03 %%
2Q04/1Q042Q04/1Q04 %%
Total PortfolioTotal Portfolio 53,04853,048 54,89454,894 10.110.1 6.46.4
IndividualsIndividuals 14,40614,406 16,45316,453 23.823.8 8.48.4
AutomobilesAutomobiles 4,6364,636 6,2056,205 46.146.1 9.29.2
Personal LendingPersonal Lending 2,1712,171 2,9402,940 41.941.9 4.84.8
OthersOthers 7,5997,599 7,3087,308 4.94.9 9.19.1
CorporateCorporate 38,64238,642 38,44138,441 5.05.0 5.55.5
Export FinancingExport Financing 5,7435,743 6,1646,164 9.49.4 1.91.9
RuralRural 1,9671,967 1,9121,912 33.633.6 37.437.4
OthersOthers 30,93230,932 30,36530,365 2.42.4 4.34.3
R$ MillionsR$ Millions
1H041H04
58,40258,402
17,82817,828
6,7736,773
3,0813,081
7,9747,974
40,57440,574
6,2826,282
2,6282,628
31,66431,664
1515
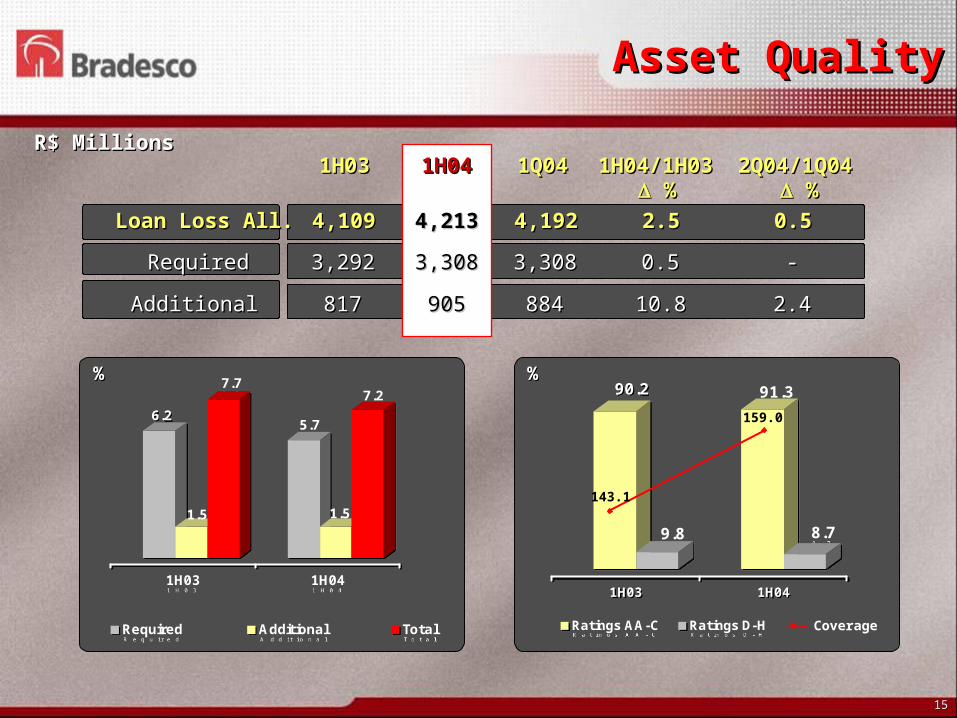
6.2
1.5
7.7
5.7
1.5
7.2
1H03 1H04
Required Additional Total
6.2
1.5
7.7
5.7
1.5
7.2
1H03 1H04
Required Additional Total
90.2
9.8
91.3
8.7
1H03 1H04
Ratings AA-C Ratings D-H
90.2
9.8
91.3
8.7
1H03 1H04
Ratings AA-C Ratings D-H
Asset QualityAsset Quality
143.1
159.0
Coverage
Loan Loss All.Loan Loss All. 4,1094,109 4,1924,192 2.52.5 0.50.5
RequiredRequired 3,2923,292 3,3083,308 0.50.5 --
AdditionalAdditional 817817 884884 10.810.8 2.42.4
1H031H03 1Q041Q04 1H04/1H031H04/1H03 %%
2Q04/1Q042Q04/1Q04 %%
%% %%
4,2134,213
3,3083,308
905905
1H041H04R$ MillionsR$ Millions
1616
56,822
64,133
1H03 1H04
56,822
64,133
1H03 1H04
59,186
64,133
1Q04 2Q04
59,186
64,133
1Q04 2Q04
Breakdown 1H04Breakdown 1H04
Total DepositsTotal Deposits
+12.9%+12.9%
+8.4%+8.4%
R$ MillionsR$ Millions
%%
R$ MillionsR$ Millions

1717
12,522
13,650
1H03 1H04
11.5
3.0
10.9
4.8
BIS RatioBIS Ratio
14.514.515.715.7
Stockholder's EquityStockholder's Equity
+9.0%+9.0%
R$ MillionsR$ Millions
Tier ITier I
Tier IITier II
1H041H041H031H03
Total Capital - 1H04Total Capital - 1H04%%
Tier ITier I69.469.4
Tier IITier II30.630.6
%%

1818
BankBank
ResultsResults
ShareholdersShareholders
DiversificationDiversification
EfficiencyEfficiency
SegmentsSegments
CommunityCommunity
OpportunitiesOpportunities

1919
Major ShareholdersMajor Shareholders
ON- Common Stock
PN- Preferred Stock
Elo Participações
Família Aguiar
FREE FLOAT
47,44% ON2, 59% PN
5,03% ON5,00% PN
3,58% ON2,71% PN
1,22% ON1,22% PN
25,06% ON 87,43% PN
5,48% ON0,03% PN
12,19% ON1,02% PN
2020
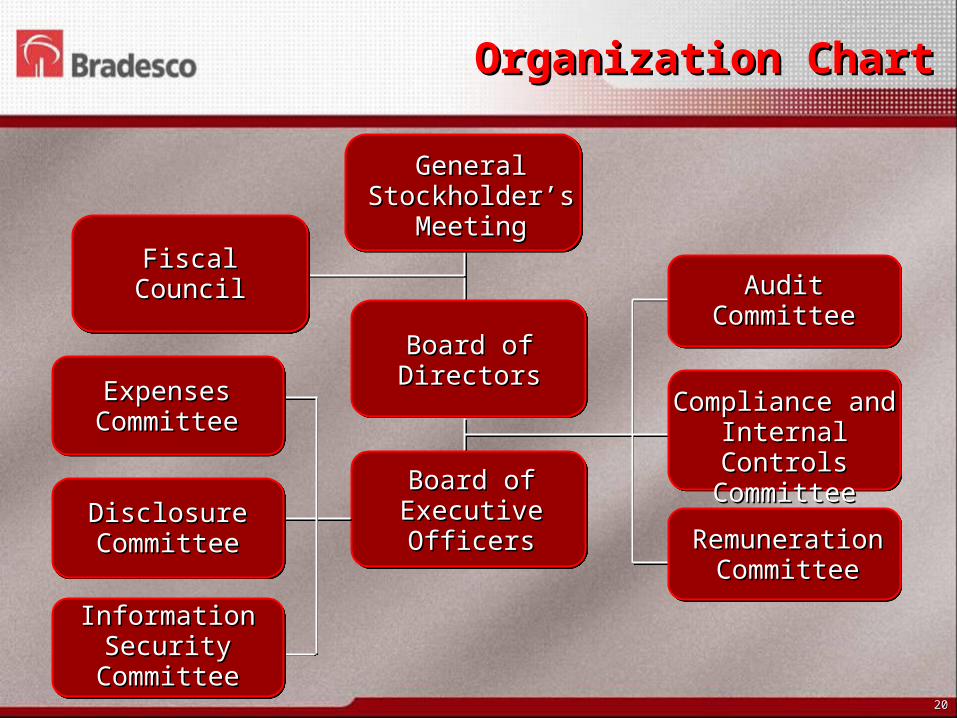
Organization ChartOrganization Chart
General General Stockholder’s Stockholder’s
MeetingMeetingFiscal Fiscal
CouncilCouncil
Board of Board of Executive Executive OfficersOfficers
Board of Board of DirectorsDirectors
Audit Audit CommitteeCommittee
Compliance and Compliance and Internal Controls Internal Controls
CommitteeCommittee
Remuneration Remuneration CommitteeCommittee
Expenses Expenses CommitteeCommittee
Disclosure Disclosure CommitteeCommittee
Information Information Security Security
CommitteeCommittee

2121
Corporate GovernanceCorporate Governance
BestBestPracticesPractices
BestBestPracticesPractices
Tag AlongTag Along
Independent Independent MembersMembers
Level 1 Level 1 BovespaBovespa
NYSE NYSE (20F)(20F)
Code of Code of EthicsEthics
Sarbanes Sarbanes OxleyOxley
Investor Investor RelationsRelations
CommitteCommitteeses

2222
Stockholder's Stockholder's RemunerationRemuneration
BestBestPracticesPractices
BestBestPracticesPractices
Preferred Preferred Stock + 10%Stock + 10%
Stocks Stocks buyback buyback programprogram
Monthly Monthly Dividends Dividends PaymentsPayments
LiquidityLiquidity
Corporate Corporate GovernancGovernanc
eeBylaws Bylaws Min. 30% Min. 30% PaymentPayment
Best Dividend Payment Policy
(Economática)
Major Dividend Payerof Financial Market - Last 10
Years(Lafis Consultoria)
2323
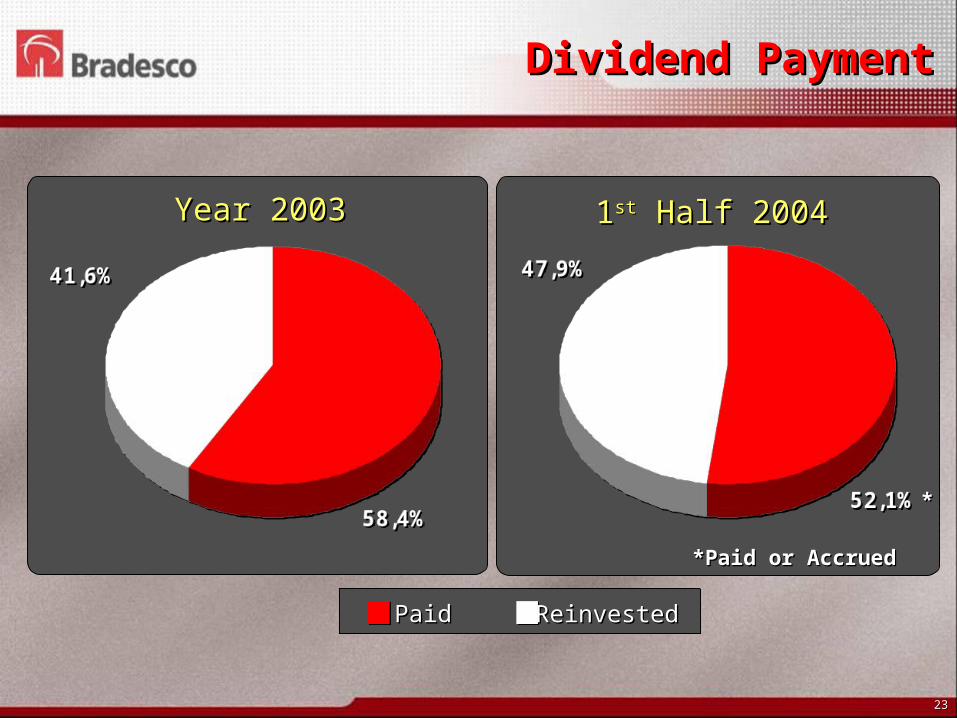
Dividend PaymentDividend Payment
Year 2003Year 2003 11stst Half 2004 Half 2004
*Paid or Accrued*Paid or Accrued
**
PaidPaid ReinvestedReinvested
2424
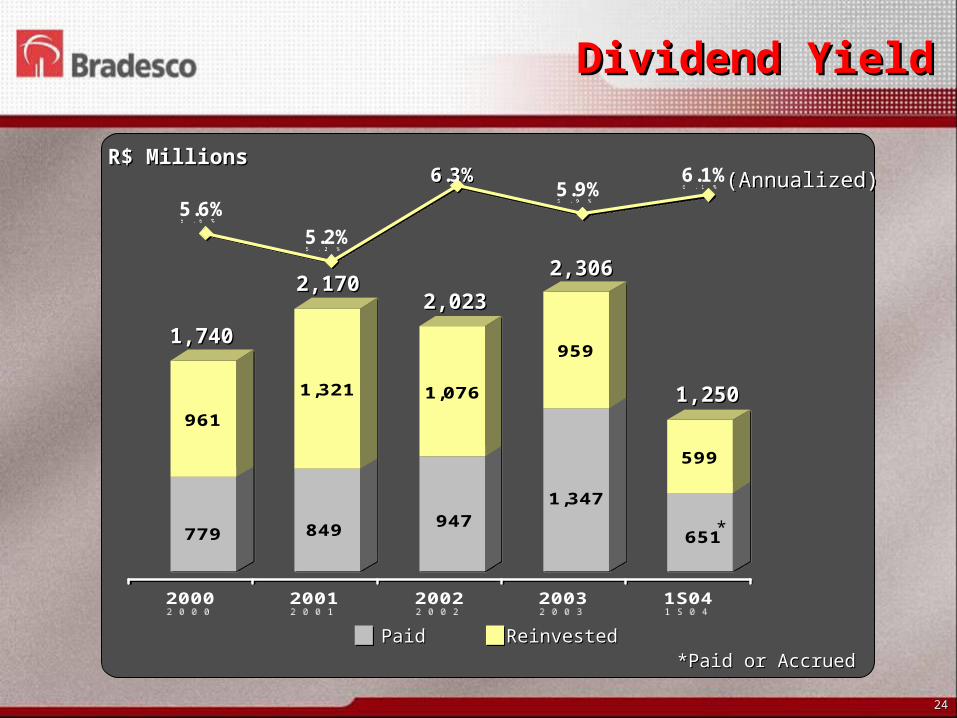
6.3%
5.6%
6.1%
5.2%
5.9%6.3%
5.6%
6.1%
5.2%
5.9%
779
961
849
1,321
947
1,076
1,347
959
651
599
2000 2001 2002 2003 1S04
779
961
849
1,321
947
1,076
1,347
959
651
599
2000 2001 2002 2003 1S04
Dividend YieldDividend Yield
R$ MillionsR$ Millions
1,7401,740
2,1702,1702,0232,023
2,3062,306
1,2501,250
PaidPaid ReinvestedReinvested
(Annualized)(Annualized)
*Paid or Accrued*Paid or Accrued
*

2525
Investor RelationsInvestor Relations
Best Practices
IR Website
Road Shows
One-on-Ones
Meeting with Analysts
2626
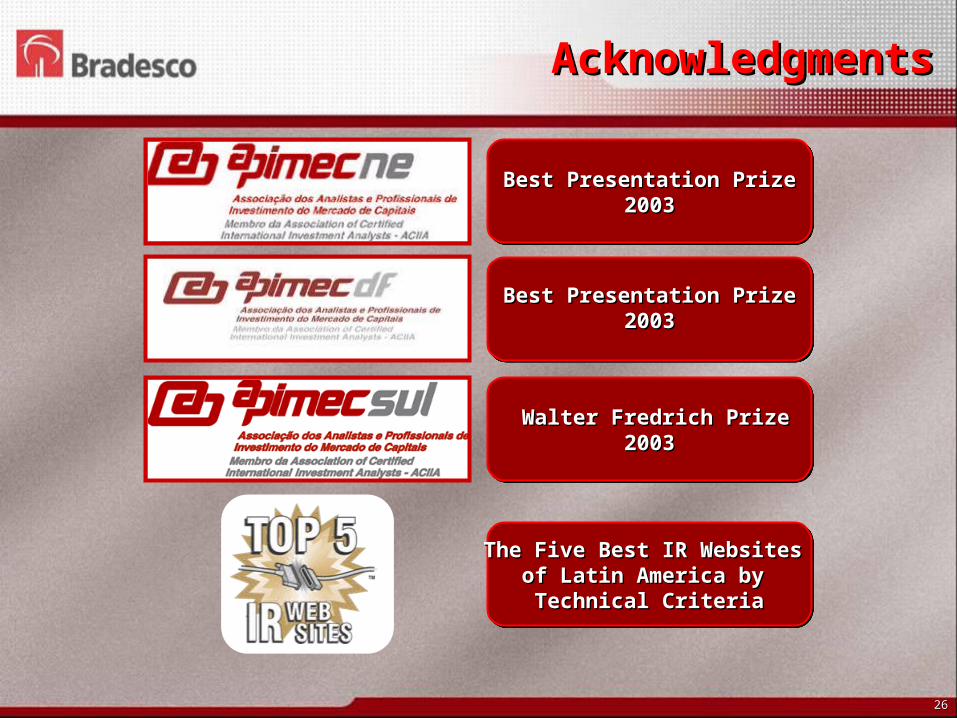
AcknowledgmentsAcknowledgments
Walter Fredrich PrizeWalter Fredrich Prize20032003
Best Presentation PrizeBest Presentation Prize20032003
The Five Best IR Websites The Five Best IR Websites of Latin America by of Latin America by Technical CriteriaTechnical Criteria
Best Presentation PrizeBest Presentation Prize20032003
2727
BankBank
ResultsResults
ShareholdersShareholders
DiversificationDiversification
EfficiencyEfficiency
SegmentsSegments
CommunityCommunity
OpportunitiesOpportunities
2828
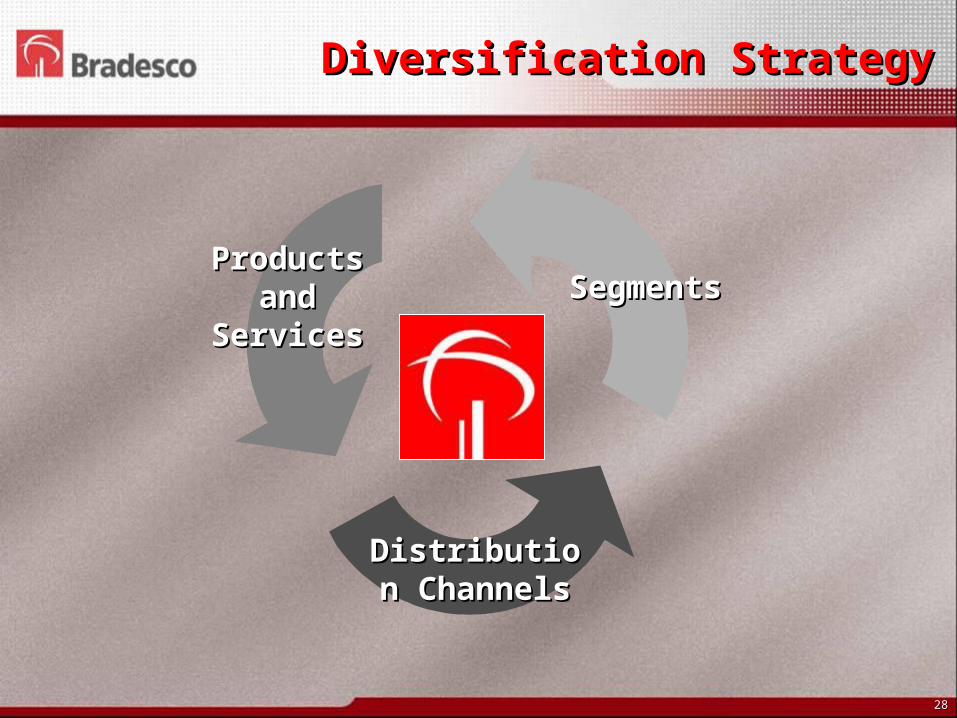
Diversification StrategyDiversification Strategy
SegmentsSegmentsProducts Products
and and ServicesServices
Distribution Distribution ChannelsChannels
2929
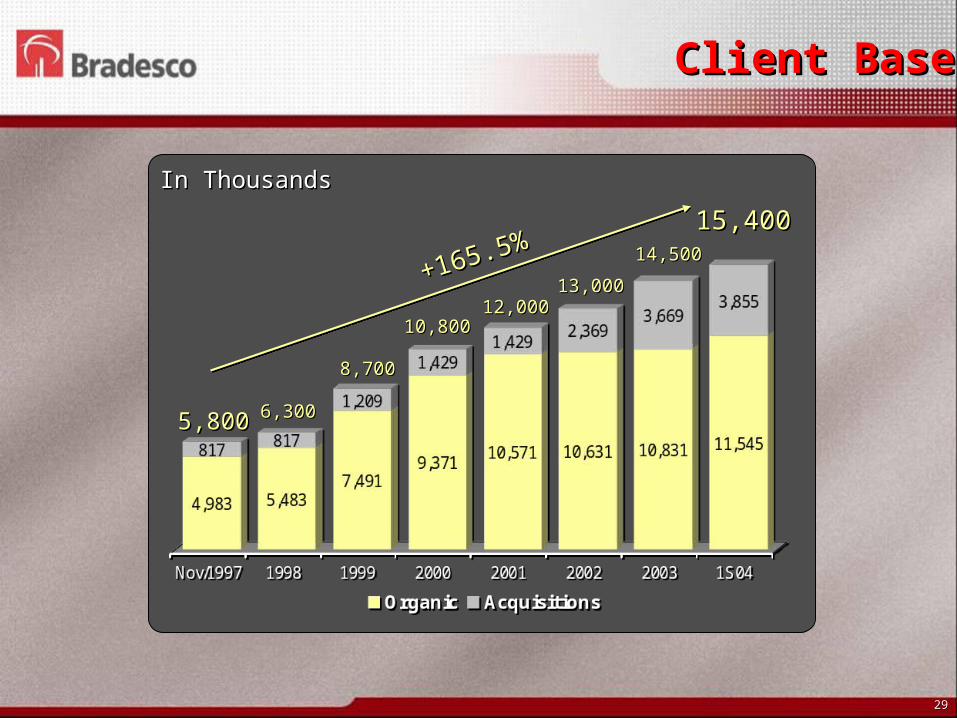
In ThousandsIn Thousands
5,8005,800 6,3006,300
8,7008,700
10,80010,80012,00012,000
13,00013,000
14,50014,500
15,40015,400
Client BaseClient Base
+165.5%+165.5%
3030
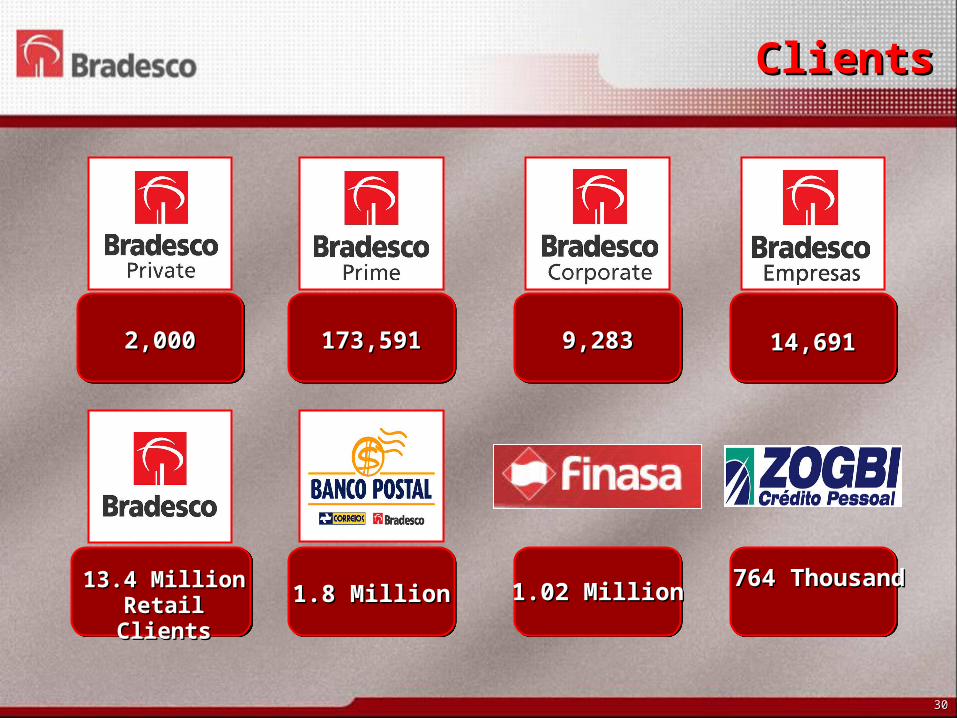
ClientsClients
2,0002,000 173,591173,591 9,2839,283 14,69114,691
13.4 Million 13.4 Million Retail ClientsRetail Clients 1.8 Million1.8 Million 1.02 Million1.02 Million 764 764
ThousandThousand

3131
Postal BankPostal Bank
Client Base Evolution (Estimated x Real)Client Base Evolution (Estimated x Real)
0.00.0
25.025.0
50.050.0
75.075.0
100.0100.0
.. 3 3 .. .. .. 11 11 .. .. .. .. .. 24 24 .. .. .. .. 33 33
Estimated PotentialEstimated Potential
RealReal
Time Time (months)(months)
2828
60.8%60.8%
99.9%99.9%
Branches with at least 2 year lifeBranches with at least 2 year life
1.8 Million Clients as of June 20041.8 Million Clients as of June 2004

3232
Postal BankPostal Bank
Net Revenue Evolution (Estimated x Real)Net Revenue Evolution (Estimated x Real)
25.025.0
50.050.0
75.075.0
100.0100.0
125.0125.0
Estimated PotentialEstimated PotentialRealReal
91.8 %91.8 %
50.8 %50.8 %
Time (Time (months)months)
0.00.0 .. 3 3 .. .. .. 11 11 .. .. .. .. .. 24 24 .. .. .. .. 33 33 2828Branches with at least 2 year lifeBranches with at least 2 year life
3333
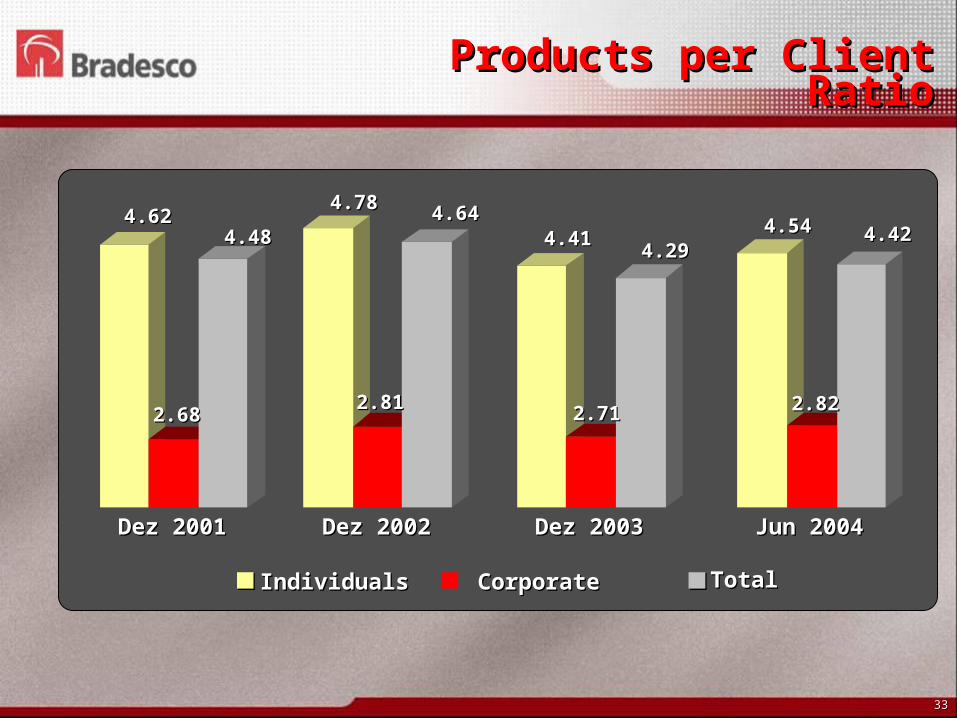
Products per Client Products per Client RatioRatio
4.624.62
2.682.68
4.484.48
4.784.78
2.812.81
4.644.644.414.41
2.712.71
4.294.294.544.54
2.822.82
4.424.42
Dez 2001Dez 2001 Dez 2002Dez 2002 Dez 2003Dez 2003 Jun 2004Jun 2004
IndividualsIndividuals TotalTotalCorporateCorporate

3434
Distribution Network Distribution Network (As of June 04) (As of June 04)
Regional Market Regional Market ShareShare
23.223.2NorthNorth
19.719.7
18.218.2
13.013.0
TotalTotal 17.717.7
19.819.8
NortheastNortheast
Center-westCenter-west
SoutheastSoutheast
SouthSouth
151 Branches151 Branches
494 Branches494 Branches
1,704 Branches1,704 Branches
448 Branches448 Branches
BranchesBranches2,8142,814RetailRetail
171171
33
TotalTotal 3,0543,054
6666PrimePrimeEmpresasEmpresas
CorporateCorporate
257 Branches257 Branches%%
3535
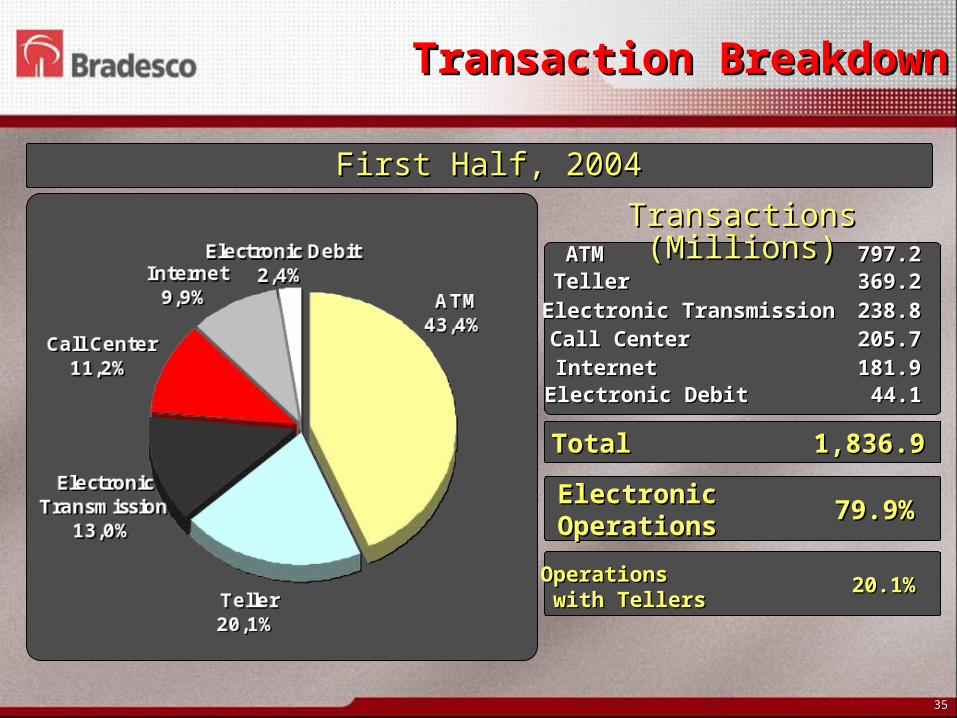
Transaction Transaction BreakdownBreakdown
Transactions Transactions (Millions)(Millions)ATMATM 797.2797.2
TellerTeller 369.2369.2
Call CenterCall Center 205.7205.7InternetInternet 181.9181.9Electronic DebitElectronic Debit 44.144.1
TotalTotal 1,836.91,836.9
Electronic TransmissionElectronic Transmission 238.8238.8
Electronic Electronic OperationsOperations
OperationsOperations with Tellerswith Tellers
79.9%79.9%
20.1%20.1%
First Half, 2004First Half, 2004

3636
Business CyclesBusiness Cycles
Home Broker
Trade Finance
Direct Lending
VGBL/PGBL
Capital Markets
Asset Management
Rural
Onlendings
Consortium
Life Insurance (Low Ticket)
Credit Card Financing
Mortgages
Custody and Brokerage
NewPotentialConstant Growth
Auto Financing
Insurance
Private Pension Plans
(Traditional)
Leasing
Savings Bonds
Accelerated Growth

3737
Consumer FinanceConsumer Finance
Focus on Client:Focus on Client: Customized Products to Customized Products to SegmentsSegments
Total Portfolio:Total Portfolio: R$ 14.3 BillionR$ 14.3 Billion
6.0
2.6
1.31.2
8.2
3.3
1.41.4
1S03 1S04
Auto Direct Lending Leasing Others
6.0
2.6
1.31.2
8.2
3.3
1.41.4
1S03 1S04
Auto Direct Lending Leasing Others
11.111.111.111.1
14.314.314.314.3R$ R$ BillionsBillions
+28.8%+28.8%
Direct Lending Direct Lending OrientedOriented
Auto Financing Auto Financing OrientedOriented
3838
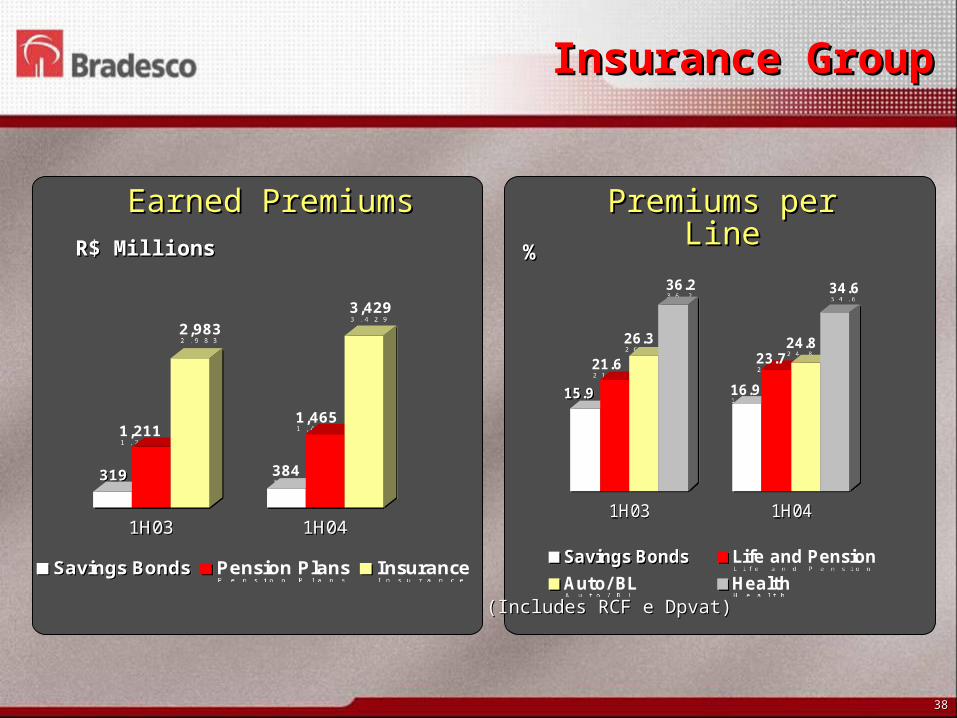
319
1,211
2,983
384
1,465
3,429
1H03 1H04
Savings Bonds Pension Plans Insurance
319
1,211
2,983
384
1,465
3,429
1H03 1H04
Savings Bonds Pension Plans Insurance
Insurance GroupInsurance Group
R$ MillionsR$ Millions
15.9
21.6
26.3
36.2
16.9
23.724.8
34.6
1H03 1H04
Savings Bonds Life and Pension
Auto/ BL Health
15.9
21.6
26.3
36.2
16.9
23.724.8
34.6
1H03 1H04
Savings Bonds Life and Pension
Auto/ BL Health(Includes RCF e Dpvat)(Includes RCF e Dpvat)
%%
Premiums per LinePremiums per LineEarned PremiumsEarned Premiums

3939
Bradesco’s ShareBradesco’s Share
Source: CVMSource: CVM
R$ MillionsR$ Millions
2,4282,428
1,0571,057653653
Block TradesBlock TradesDebenturesDebentures CPsCPs
As of June 2003As of June 2003
74% 68%
74%
MercadoMercadoBradesco’s ShareBradesco’s Share
Source: CVMSource: CVM
R$ MillionsR$ Millions
2,3662,366 2,1402,140
4141
Block TradesBlock TradesDebenturesDebentures CPsCPs
As of June 2004As of June 2004
1%
68%
43%
MarketMarket
20032003
R$ MillionsR$ Millions
Source: CETIPSource: CETIP
20042004
FIDC - Credit Asset Backed Securities FundsFIDC - Credit Asset Backed Securities Funds
Capital MarketsCapital Markets

4040
(2,492)
19,356
1H03 1H04
(2,492)
19,356
1H03 1H04
9,427
9,929
1Q04 2Q04
9,427
9,929
1Q04 2Q04
Bradesco ConsórciosBradesco Consórcios
3.0%3.0%
59.5%59.5%
37.5%37.5%
Trucks and TractorsTrucks and Tractors
Real EstateReal Estate
AutosAutos
Net Income (R$ Thousands)Net Income (R$ Thousands)
91,986 Consortium Quotas Sold (Accumulated)91,986 Consortium Quotas Sold (Accumulated)
Net Income (R$ Thousands)Net Income (R$ Thousands)
4141
BankBank
ResultsResults
ShareholdersShareholders
DiversificationDiversification
EfficiencyEfficiency
SegmentsSegments
CommunityCommunity
OpportunitiesOpportunities
4242
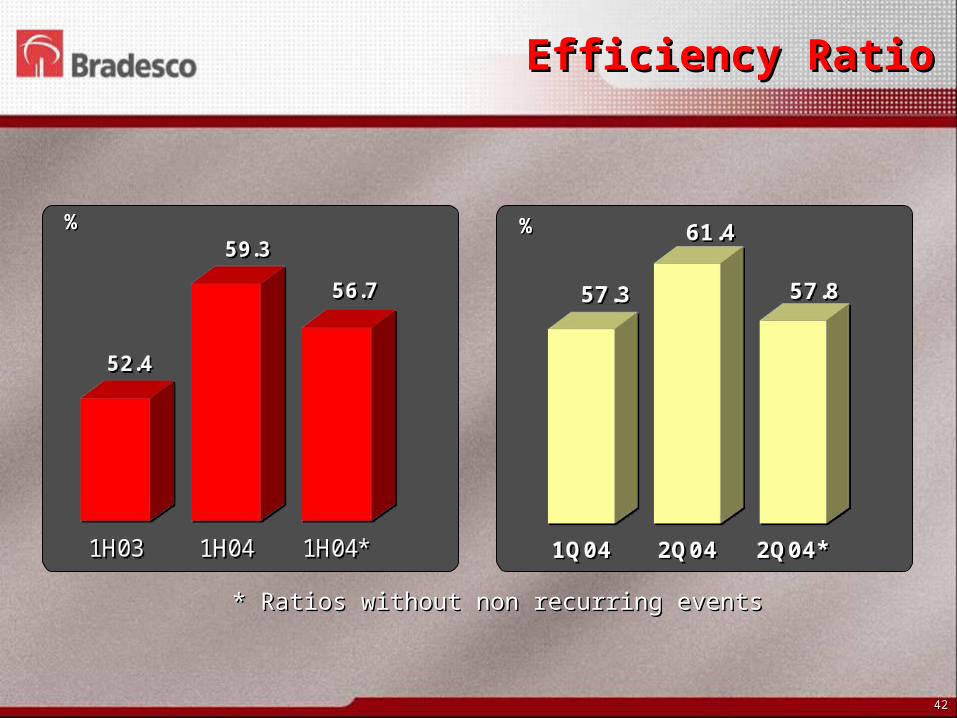
* Ratios without non recurring events* Ratios without non recurring events
Efficiency RatioEfficiency Ratio
%%%%

4343
Personnel ExpensesPersonnel Expenses
2,4112,411
Pers
on
nel Exp
en
ses
Pers
on
nel Exp
en
ses
11stst H
alf
2003
Half
2003
4040
Lab
or
Pro
vis
ion
s
Lab
or
Pro
vis
ion
s
In
su
ran
ce G
rou
p I
nsu
ran
ce G
rou
p
3535
Acq
uir
ed
Ban
ks
Acq
uir
ed
Ban
ks
5 M
on
ths (
BEM
+Z
og
bi)
5 M
on
ths (
BEM
+Z
og
bi)
133133
Acq
uir
ed
Ban
k
Acq
uir
ed
Ban
k
5 M
on
ths (
BB
V)
5 M
on
ths (
BB
V)
221221
Wag
e I
ncre
ase
Wag
e I
ncre
ase
2,6302,630
Su
bto
taS
ub
tota
ll
(219)(219)
Expense
s R
educt
ion
Expense
s R
educt
ion
-8.3%-8.3%R$ MillionsR$ Millions
2,2012,201
Pers
on
nel Exp
en
ses
Pers
on
nel Exp
en
ses
11stst H
alf
2004
Half
2004

4444
Administrative ExpensesAdministrative Expenses
2,2542,2542,5862,586
2,4242,424
(162)(162)126126A
cq
uir
ed
Ban
k
Acq
uir
ed
Ban
k
5 M
on
th (
BB
V)
5 M
on
th (
BB
V)
154154
Avera
ge E
xp
en
ses
Avera
ge E
xp
en
ses
Incre
ase
In
cre
ase
(
IGP
-M e
IP
CA
)(I
GP
-M e
IP
CA
)
Su
bto
taS
ub
tota
ll
Expense
s R
educt
ion
Expense
s R
educt
ion
-6.3%-6.3%
5252
Acq
uir
ed
Ban
ks
Acq
uir
ed
Ban
ks
5 M
on
ths (
BEM
+Z
og
bi)
5 M
on
ths (
BEM
+Z
og
bi)
R$ MillionsR$ MillionsA
dm
inis
trati
ve
Ad
min
istr
ati
ve
Exp
en
ses
Exp
en
ses
11stst H
alf
2003
Half
2003
Ad
min
istr
ati
ve
Ad
min
istr
ati
ve
Exp
en
ses
Exp
en
ses
11stst H
alf
2004
Half
2004
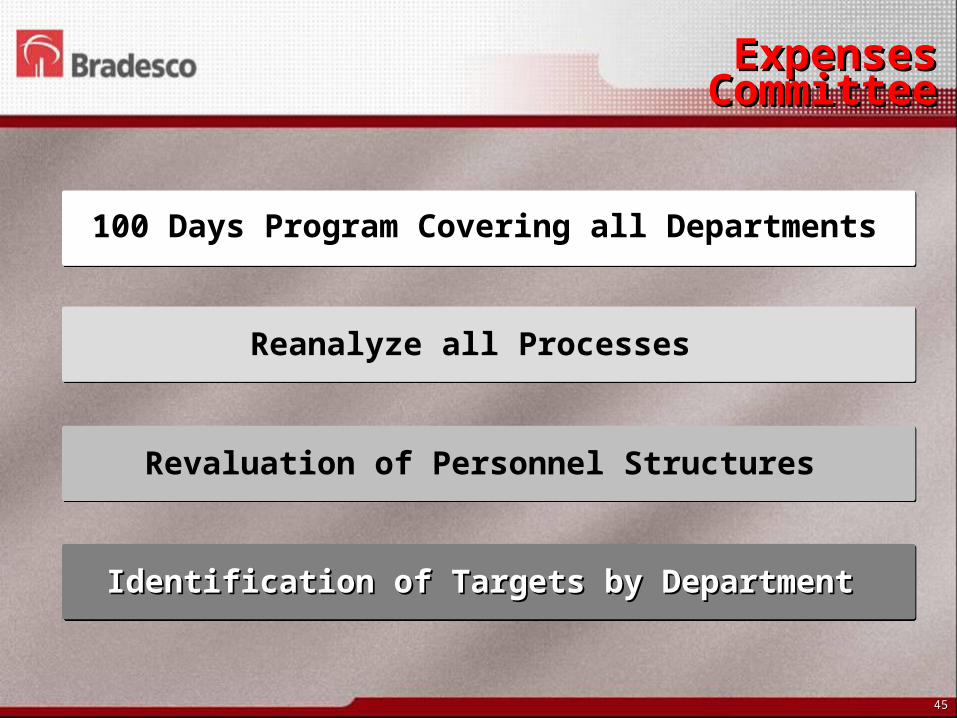
4545
Expenses Expenses CommitteeCommittee
Reanalyze all Processes
Revaluation of Personnel Structures
Identification of Targets by Department Identification of Targets by Department
100 Days Program Covering all Departments
4646
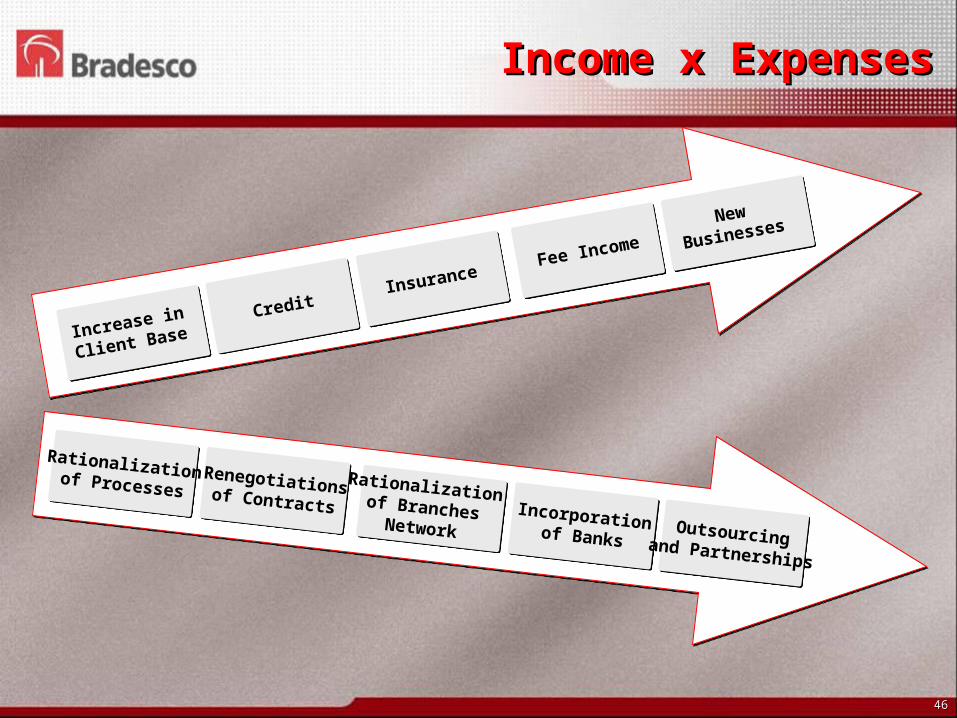
Income x ExpensesIncome x Expenses
Increase in
Client BaseCredit
InsuranceFee Income
New
Businesses
Rationalizationof ProcessesRenegotiationsof Contracts
Rationalizationof Branches NetworkIncorporationof Banks
Outsourcingand Partnerships
4747
BankBank
ResultsResults
ShareholdersShareholders
DiversificationDiversification
EfficiencyEfficiency
SegmentsSegments
CommunityCommunity
OpportunitiesOpportunities

4848
Client BaseClient Base(As of June 2004)(As of June 2004)
3 Platforms3 Platforms9,283 Companies9,283 Companies
171 Branches171 Branches173,591 Clients173,591 Clients
RetailRetail2,814 Branches2,814 Branches
13.4 Million of Clients13.4 Million of Clients
IndividualsIndividuals CompaniesCompanies
2 Structures- SP and RJ 2 Structures- SP and RJ 2,000 Clients 2,000 Clients
66 Branches66 Branches14,691 Companies14,691 Companies
5,013 Branches5,013 Branches1.8 Million of Clients1.8 Million of Clients
53 Branches53 Branches28,679 Sale Points28,679 Sale Points
1.02 Million of Clients1.02 Million of Clients
68 Branches68 Branches28,679 Sale Points28,679 Sale Points
764 Thousand Clients764 Thousand Clients

4949
Importance Importance to Clientto Client
LowLow HigHighh
LowLow
HighHighMutual ReciprocityMutual Reciprocity
TrustTrust
BenefitsBenefits
FacilitiesFacilities
AssertivetyAssertivety
Call CenterCall Center
ATM NetworkATM Network
Generic Mailing ListsGeneric Mailing Lists
Products / ServicesProducts / Services
Focus on ClientFocus on Client
CRMCRM
Finance Finance Institutions Institutions
DeliveryDelivery
5050
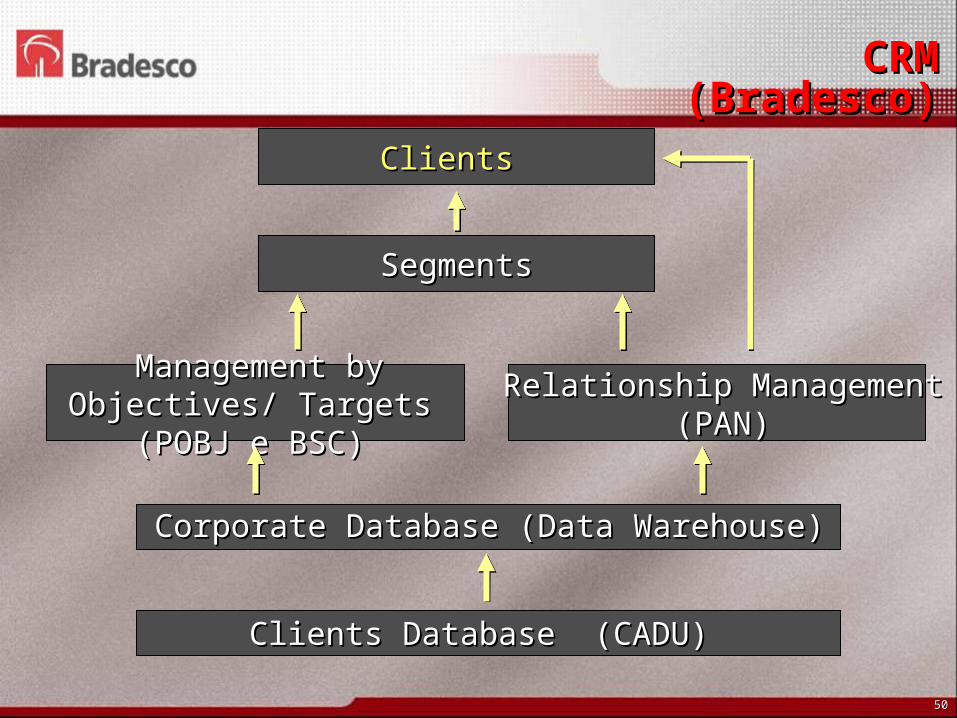
Clients Database (CADU) Clients Database (CADU)
Corporate Database (Data Warehouse)Corporate Database (Data Warehouse)
Relationship ManagementRelationship Management(PAN)(PAN)
Management by Management by Objectives/ Targets (POBJ e Objectives/ Targets (POBJ e
BSC)BSC)
Clients Clients
SegmentsSegments
CRM CRM (Bradesco)(Bradesco)

5151
Net RevenuesNet Revenues
Month of June 2004Month of June 2004
Retail 78.4Retail 78.4
Corporate 10.9Corporate 10.9
Middle 5.2Middle 5.2
Prime 3.1Prime 3.1
Private 0.4Private 0.4
Postal Bank 2.0Postal Bank 2.0
Month of June 2003Month of June 2003
R$ 789 MillionsR$ 789 Millions R$ 925 MillionsR$ 925 Millions
Middle 2.4Middle 2.4
Postal Bank 0.9Postal Bank 0.9Prime 0.7Prime 0.7
Private 0.4Private 0.4
Corporate 11.9Corporate 11.9
Retail 83.7Retail 83.7
%% %%
5252
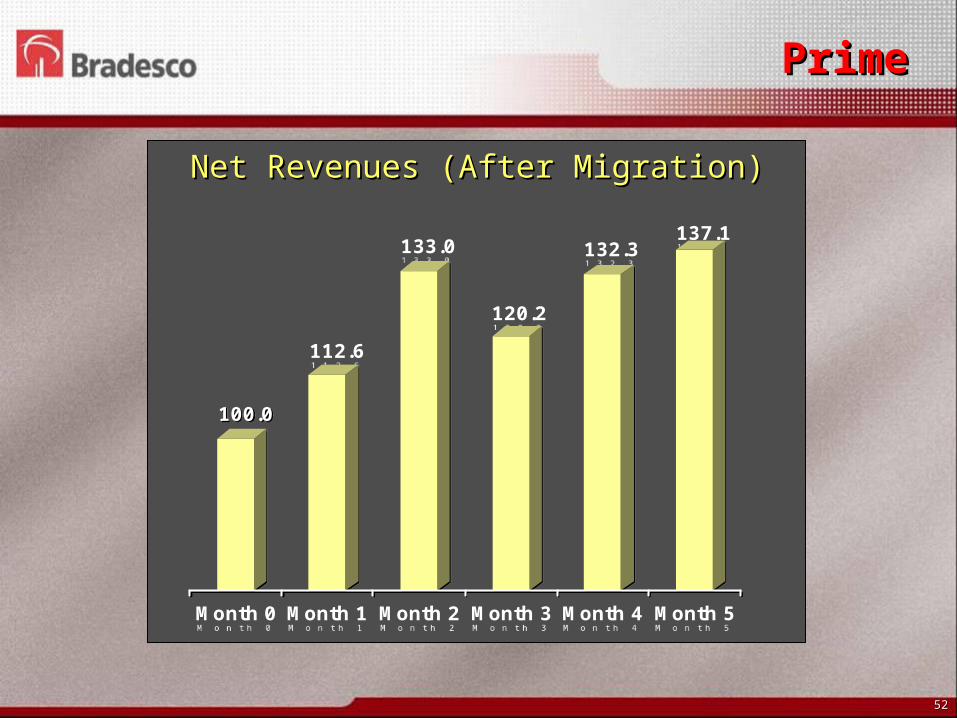
Net Revenues (After Migration)Net Revenues (After Migration)
100.0
112.6
133.0
120.2
132.3137.1
Month 0 Month 1 Month 2 Month 3 Month 4 Month 5
100.0
112.6
133.0
120.2
132.3137.1
Month 0 Month 1 Month 2 Month 3 Month 4 Month 5
Prime Prime

5353
Middle MarketMiddle Market
100.0
111.4108.3
111.1
116.2 118.1
Month 0 Month 1 Month 2 Month 3 Month 4 Month 5
100.0
111.4108.3
111.1
116.2 118.1
Month 0 Month 1 Month 2 Month 3 Month 4 Month 5
Net Revenues (After Migration)Net Revenues (After Migration)
5454
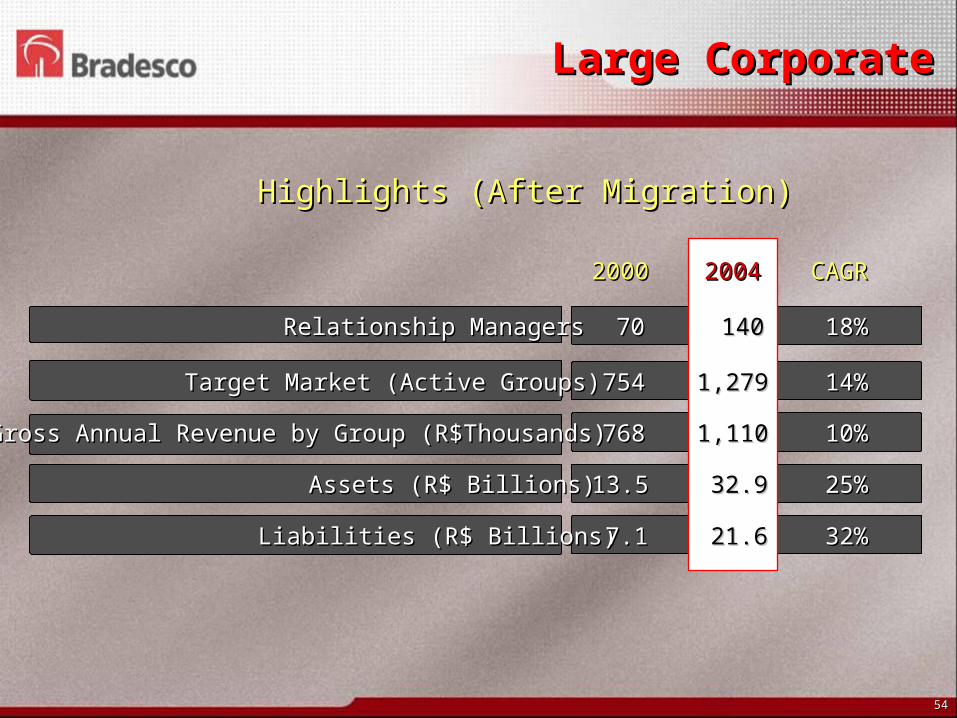
Large CorporateLarge Corporate
Highlights (After Migration)Highlights (After Migration)
20002000 CAGR CAGR
Relationship ManagersRelationship Managers 7070 18%18%
Target Market (Active Groups)Target Market (Active Groups) 754754 14%14%
Gross Annual Revenue by Group (R$Thousands)Gross Annual Revenue by Group (R$Thousands) 768768 10%10%
Assets (R$ Billions)Assets (R$ Billions) 13.513.5 25%25%
Liabilities (R$ Billions)Liabilities (R$ Billions) 7.17.1 32%32%
20042004
140140
1,2791,279
1,1101,110
32.932.9
21.621.6
5555
BankBank
ResultsResults
ShareholdersShareholders
DiversificationDiversification
EfficiencyEfficiency
SegmentsSegments
CommunityCommunity
OpportunitiesOpportunities
5656
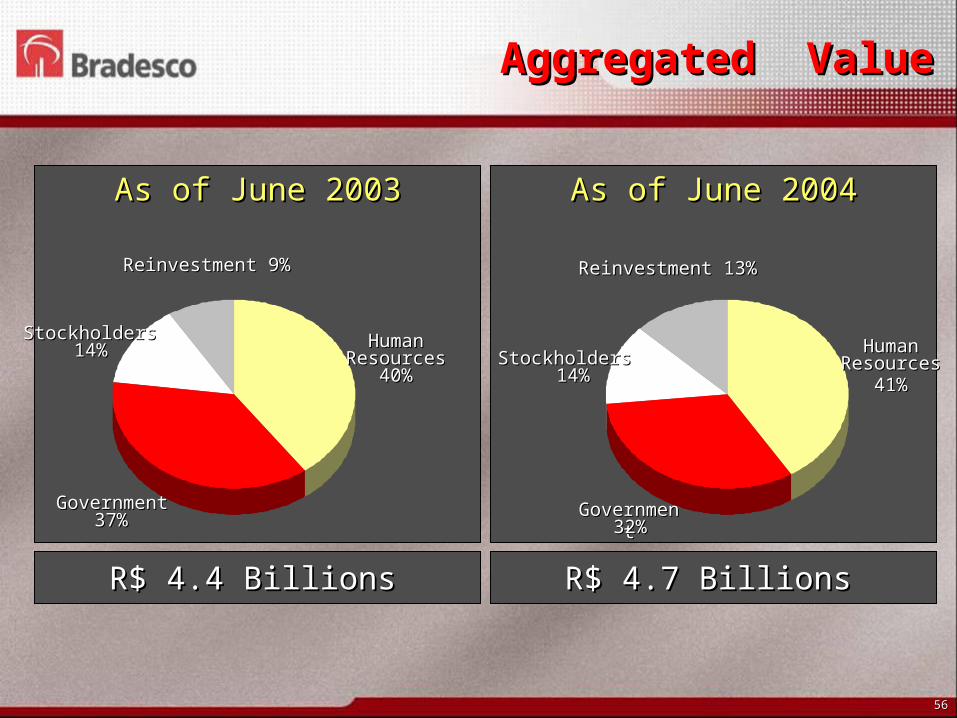
HumanHumanResourcesResources
40%40%
GovernmentGovernment37%37%
StockholdersStockholders14%14%
Reinvestment 9%Reinvestment 9%
As of June 2004As of June 2004As of June 2003As of June 2003
Aggregated ValueAggregated Value
R$ 4.4 BillionsR$ 4.4 Billions R$ 4.7 BillionsR$ 4.7 Billions
HumanHumanResourcesResources
41%41%
GovernmentGovernment32%32%
StockholdersStockholders14%14%
Reinvestment 13%Reinvestment 13%
5757
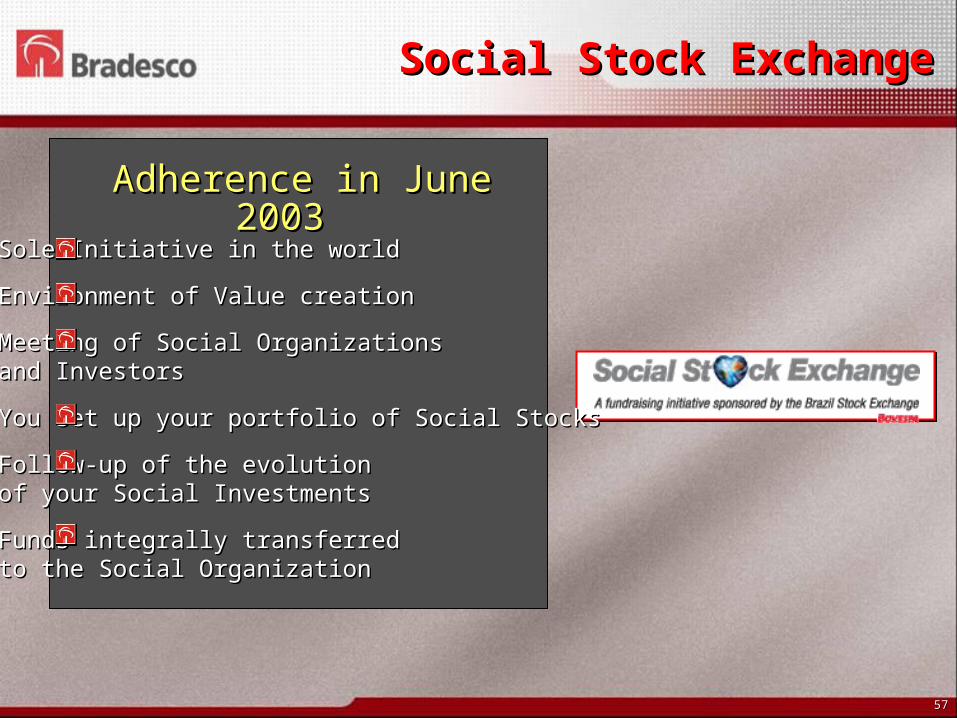
Social Stock ExchangeSocial Stock Exchange
Sole Initiative in the worldSole Initiative in the world
Environment of Value creation Environment of Value creation
Meeting of Social OrganizationsMeeting of Social Organizationsand Investorsand Investors
You set up your portfolio of Social StocksYou set up your portfolio of Social Stocks
Follow-up of the evolution Follow-up of the evolution of your Social Investmentsof your Social Investments
Funds integrally transferred Funds integrally transferred to the Social Organizationto the Social Organization
Adherence in June 2003 Adherence in June 2003

5858
Social CommitmentSocial Commitment
Micro-LendingMicro-LendingR$ 371.9R$ 371.9MillionMillion
Postal BankPostal Bank1.8 Million1.8 Million
ClientsClients
Art and CultureArt and CultureRestorationsRestorations
ConcertsConcertsBooksBooks
SportsSportsVolleyball and Volleyball and
Basketball Basketball

5959
2003’ Social Return2003’ Social Return
Postal BankPostal Bank
Art and CultureArt and Culture
81 Centers of Sporting Formation Basketball and Volleyball teams4,300 Girls Attended160 athletes and 13 competition teams R$ 8.5 Million contribution
SportsSports
AdditionallyAdditionally
More than 105 thousand students attended. R$ 138.3 Million Budget
Fundação BradescoFundação BradescoMore than 1 thousand Municipalities benefitedInclusion of 9 Million individuals into the Banking Market
Sponsorship of events R$ 15.1 Million contribution
R$14.6 Million contribution in:
Health and Sanitation Hunger Combat Food Security
6060
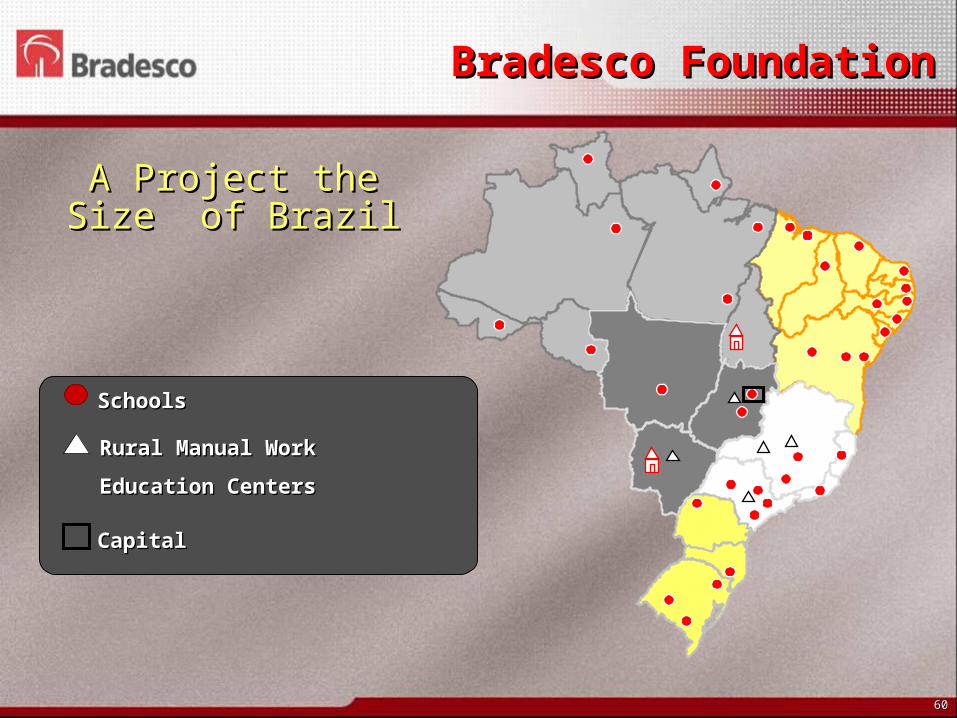
Bradesco FoundationBradesco Foundation
A Project the Size A Project the Size of Brazilof Brazil
Rural Manual WorkRural Manual Work
Education CentersEducation Centers
SchoolsSchools
CapitalCapital
6161
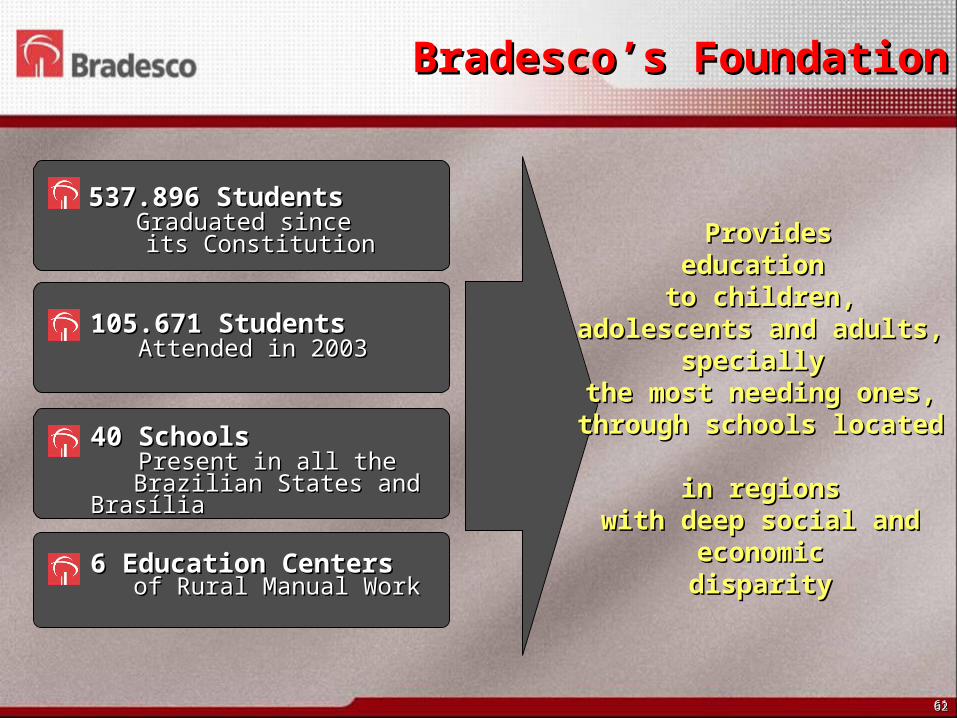
ProvidesProvideseducation education
to children, adolescents to children, adolescents and adults, specially and adults, specially
the most needing ones,the most needing ones,through schools located through schools located
in regionsin regionswith deep social and with deep social and
economiceconomicdisparitydisparity
105.671 Students105.671 Students Attended in 2003Attended in 2003
40 Schools40 Schools Present in all the Present in all the Brazilian States and Brasília Brazilian States and Brasília
537.896 Students537.896 Students Graduated since Graduated since its Constitution its Constitution
6262
6 Education Centers6 Education Centers of Rural Manual Work of Rural Manual Work
Bradesco’s FoundationBradesco’s Foundation
6262
BankBank
ResultsResults
ShareholdersShareholders
DiversificationDiversification
EfficiencyEfficiency
SegmentsSegments
CommunityCommunity
OpportunitiesOpportunities
6363
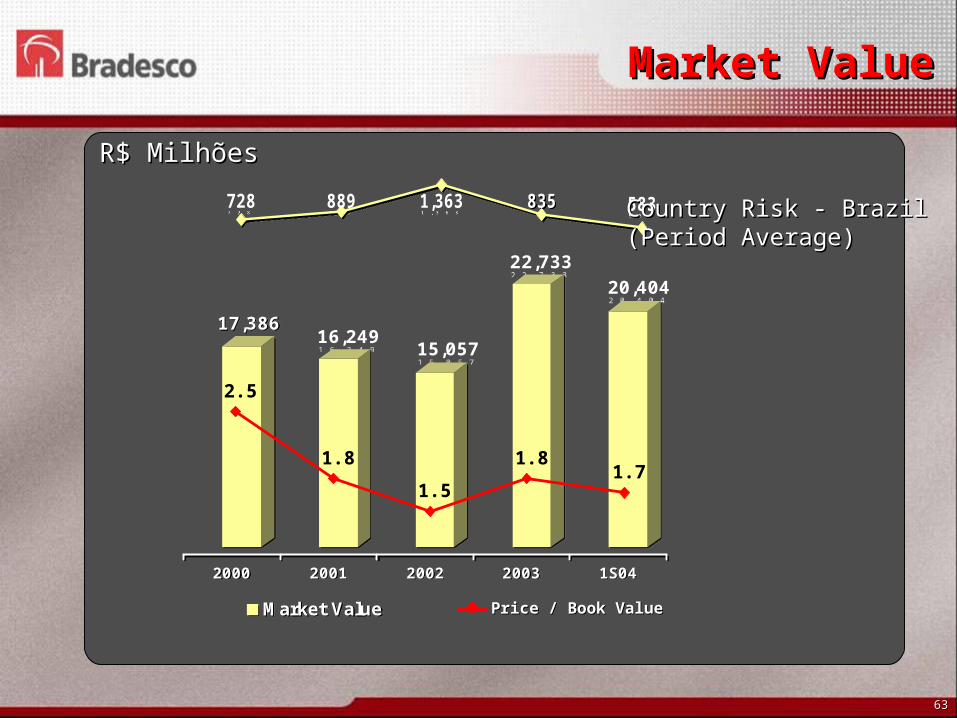
R$ MilhõesR$ Milhões
Market ValueMarket Value
17,38616,249
15,057
22,73320,404
2000 2001 2002 2003 1S04
Market Value
17,38616,249
15,057
22,73320,404
2000 2001 2002 2003 1S04
Market Value
835889 583728 1,363 835889 583728 1,363 Country Risk - BrazilCountry Risk - Brazil(Period Average)(Period Average)
1.81.81.7
2.5
1.5
Price / Book Value Price / Book Value
6464
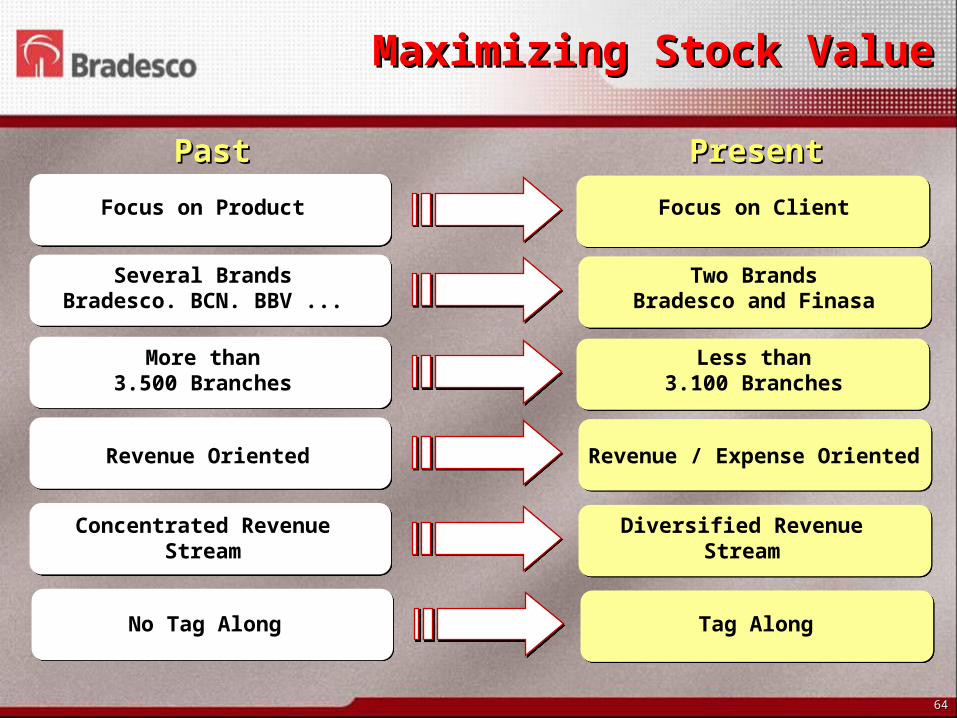
Maximizing Stock ValueMaximizing Stock Value
PastPast PresentPresent
Focus on Product
Several BrandsBradesco. BCN. BBV ...
More than3.500 Branches
Revenue Oriented
Concentrated Revenue Stream
Focus on Client
Two BrandsBradesco and Finasa
Revenue / Expense Oriented
Less than3.100 Branches
Diversified Revenue Stream
No Tag Along Tag Along

6565
A Great Investment OpportunityA Great Investment Opportunity