1 2008 6/18 yasuaki ushio hiroshima university the result of cavity compton experiment
TRANSCRIPT

1
2008 6/18
Yasuaki Ushio
Hiroshima University
The result of cavity compton experiment

2
Contents
• Set up at KEK – ATF
• Procedure of measurement
• Result of the experiment
• Summary
3
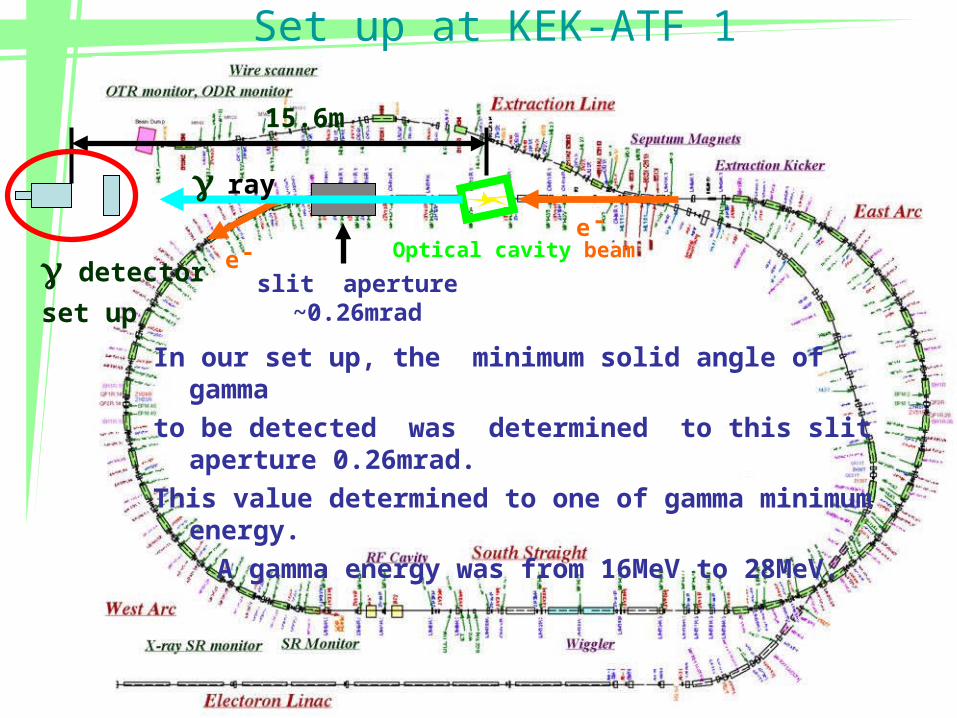
Set up at KEK-ATF 1
Optical cavity
slit aperture ~0.26mrad
e - e - beam
15.6m
detector
set up
ray
In our set up, the minimum solid angle of gamma
to be detected was determined to this slit aperture 0.26mrad.
This value determined to one of gamma minimum energy.
A gamma energy was from 16MeV to 28MeV.
4
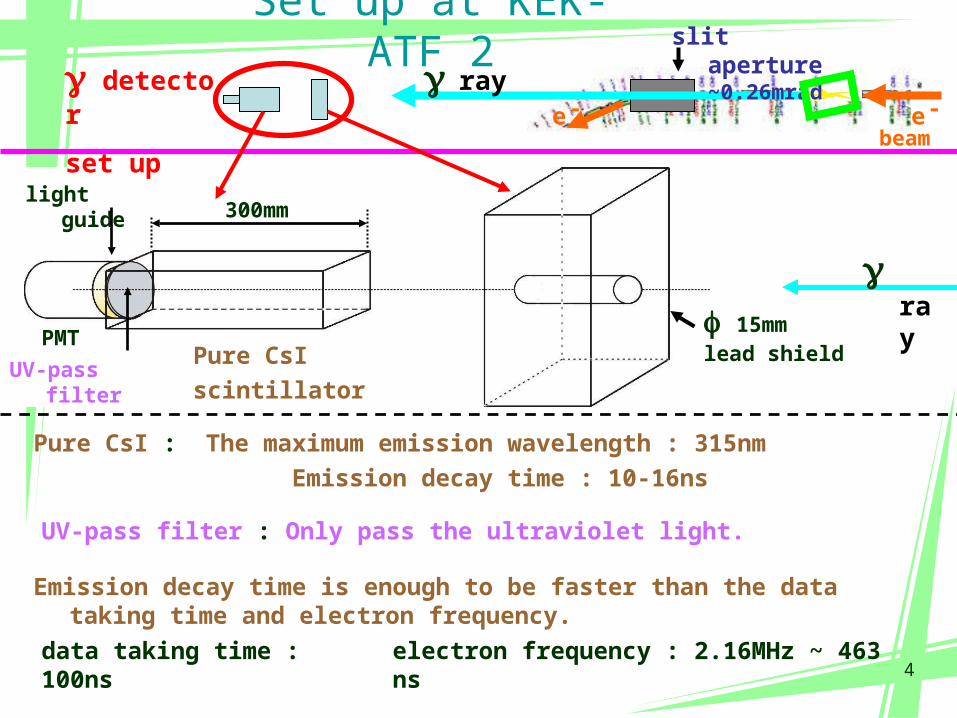
Set up at KEK-ATF 2
ray
Pure CsI scintillator
lead shield15mm
UV-pass filter
light guide
PMT
UV-pass filter : Only pass the ultraviolet light.
Pure CsI : The maximum emission wavelength : 315nm Emission decay time : 10-16ns
Emission decay time is enough to be faster than the data taking time and electron frequency.
electron frequency : 2.16MHz ~ 463 ns
data taking time : 100ns
300mm
slit aperture ~0.26mrad
e e - - detector
set up
ray
beam
5
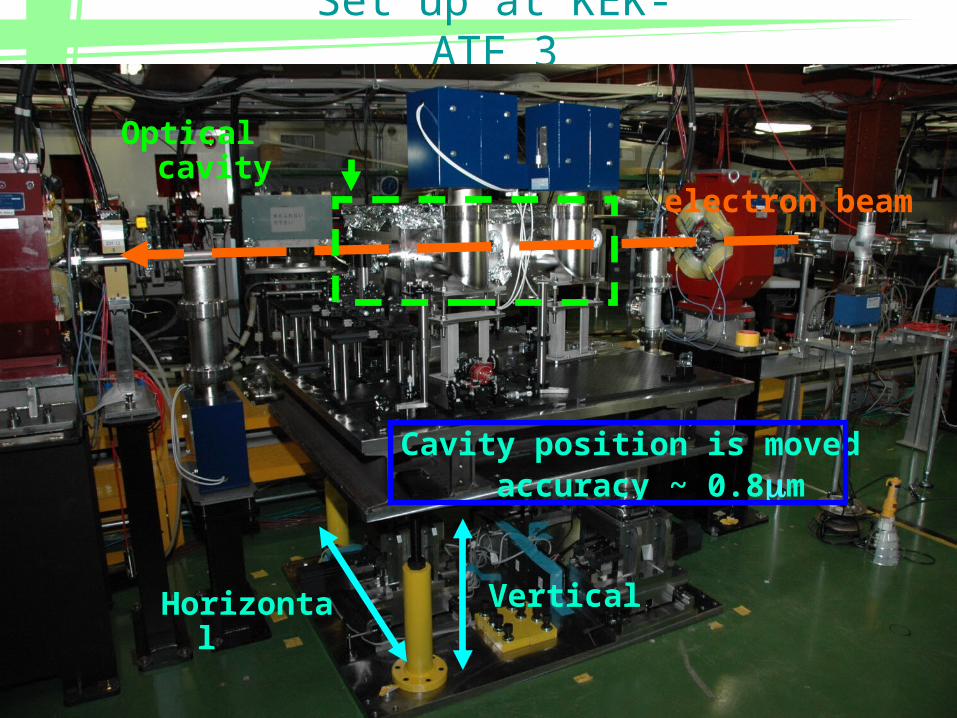
Set up at KEK-ATF 3
accuracy ~ 0.8m
electron beam
Horizontal
Vertical
Optical cavity
Cavity position is moved
6
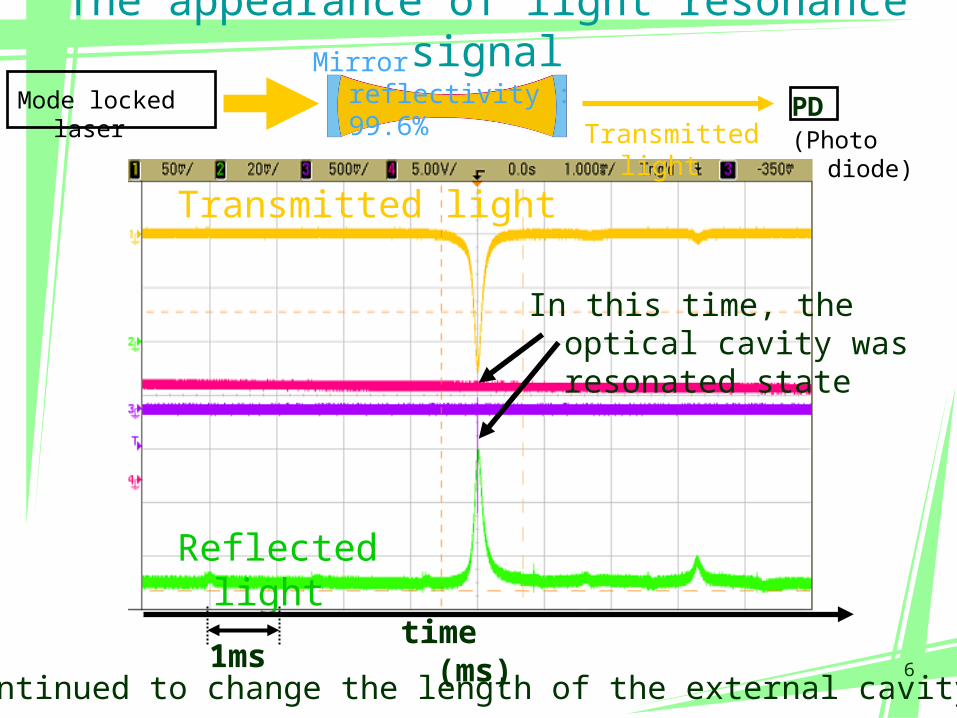
The appearance of light resonance signal
Reflected light
Transmitted light
In this time, the optical cavity was resonated state
Transmitted light
Mirror reflectivity : 99.6%
Mode locked laser
(Photo diode)
PD
time (ms)Continued to change the length of the external cavity.
1ms

7
DAQ Schematic
Continued to change the length of the external cavity.
Only picked up the data when the cavity was resonated.
2.16MHz
- e
cavity
Could pass Comparator
Gate was opened
for 100ns.
T = 463ns
PD

8
Procedure of measurement 1
① Vertical scan
Scanning to the laser vertical position and find the best position to observe gamma
Vertical scan
② Horizontal scan
Vertical was fixed to the best position.
Scanning to the Horizontal.
Moved accuracy ~ 0.8m
movable table
movable table
See from upper direction.At horizontal, cavity was leaned at 12 degree
Z
e-
e-
When Vertical scan,Moved the cavity to Z direction
Z

9
Procedure of measurement 2
We found the best collision point
③ Timing scan
Vertical and Horizontal were fixed to the best position.
And turned on the switch of phase locked loop .
After that scanning phase.
Timing scan
- e beam
420mm
T=2.8ns
pulsed laser
beame -

10
Gamma Energy distribution 1
In calculation, the peak energy of a gamma is about 28MeV.In our set up, the acceptance of detector was 0.26mrad.
One of gamma had 16~28 MeV energy.
Our set up detected a lot of gamma at one time.
So we estimated the number of gamma at the place of detector.
detected in experiment
15.6m
cavity
slitaperture 0.26mrad
ray
detector
11
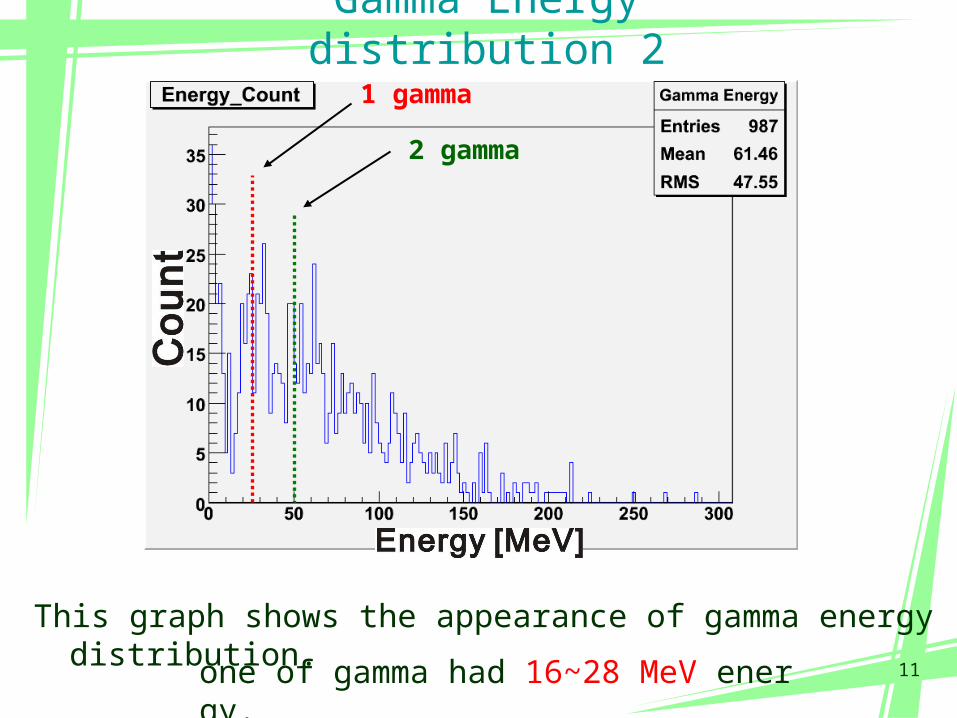
Gamma Energy distribution 2
This graph shows the appearance of gamma energy distribution.
one of gamma had 16~28 MeV energy.
1 gamma
2 gamma

12
The number of gamma
1 bunch : experiment ~3.3 simulated by CAIN ~ 4.5
20 bunches : experiment ~3.1 simulated by CAIN ~ 20
In the case of 1 bunch, the number of gamma seems to consist comparing our experiment data with estimate by CAIN.
However, the data of 20bunches were inconsistent.The reason of this,there was a possibility that not every electron bunches were collided.
We estimated the number of gamma to use a simulation software “CAIN”.
bunch distance : 2.8 ns
date bunch the number of electron transmitted power stack power estimate γ1/ pulse (included in one train) W W
2008/ 4/ 22 20 2.6E+10 (in 20 bunches) 1.55 388 3.12008/ 5/ 27 1 7.2E+9 (in 1 bunch) 1.09 272 3.27
Mirror reflectivity : 99.6%1 - 0.996
transmitted powerstack power =

13
Summary
・ The data of 1 bunch appears to be consistent with simulation data by CAIN.
・ We observed the number of gamma about 3.3 per collision.
・ The data of multi bunch mode was inconsistent.There was a possibility that not every electron bunches were collided.
・ The optical cavity length will be fixed at a condition of synchronization with electron cycle. And will be detected to the largest number of gamma in our set up.
Next Plan

14

15

16
Set up at KEK-ATF
1-R
Mode lock laser
Electron beamCSIγray
e beam
PD
Transmitted light was detected
16~28MeV
We could observehow stored it was.
420mm
Collision angle 12 degree
Mirror curvature : 210.5mm
λ:1064nm Output : 28nJ/pulse=10WDistance of per pulse : 2.8ns = electron bunch distance(Internal cavity length : 420mm)Pulse length : 7ps
Rate of reflection : 99.6%
πRF =
Finess By calculationF = 780σ = 30 μm
Mode lock laser
17
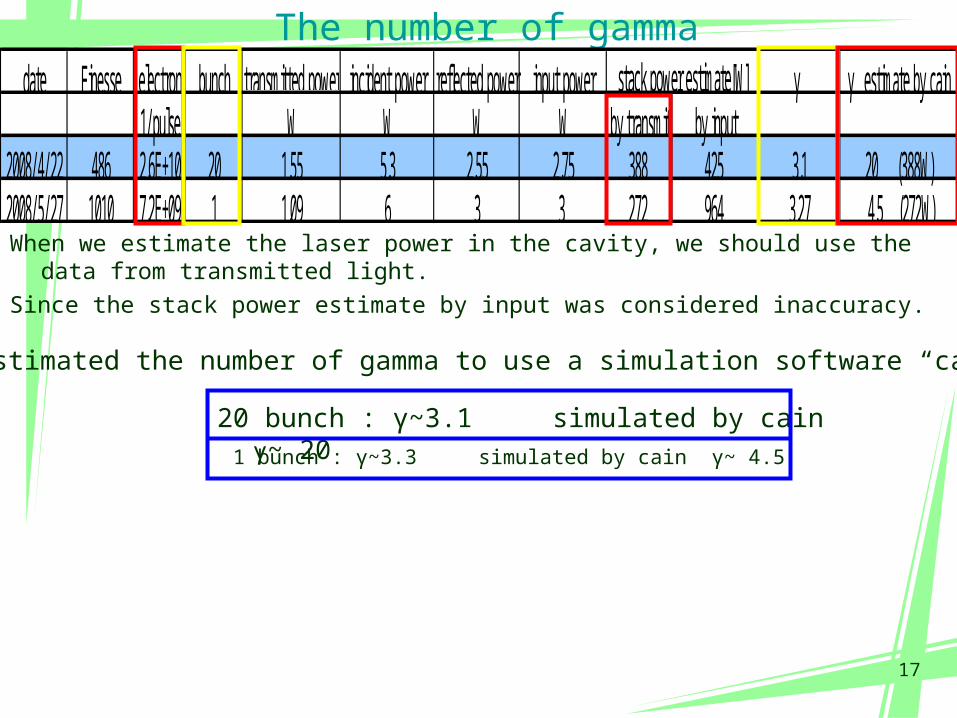
The number of gamma
When we estimate the laser power in the cavity, we should use the data from transmitted light.
Since the stack power estimate by input was considered inaccuracy.
1 bunch : γ~3.3 simulated by cain γ~ 4.5
date Finesse electron bunch transmitted power incident power reflected power input power γ γ estimate by cain1/ pulse W W W W by transmit by input
2008/ 4/ 22 486 2.6E+10 20 1.55 5.3 2.55 2.75 388 425 3.1 20 (388W)2008/ 5/ 27 1010 7.2E+09 1 1.09 6 3 3 272 964 3.27 4.5 (272W)
stack power estimate[W]
20 bunch : γ~3.1 simulated by cain γ~ 20
We estimated the number of gamma to use a simulation software “cain”.
18
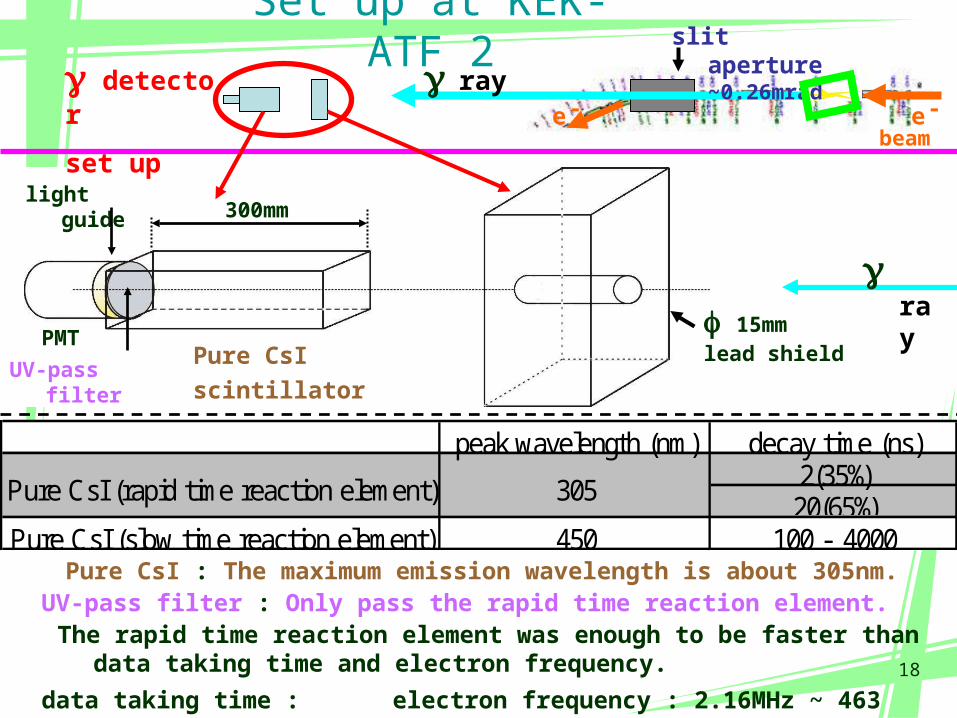
Set up at KEK-ATF 2
ray
Pure CsI scintillator
lead shield15mm
UV-pass filter
light guide
PMT
UV-pass filter : Only pass the rapid time reaction element.Pure CsI : The maximum emission wavelength is about 305nm.
The rapid time reaction element was enough to be faster than data taking time and electron frequency.
electron frequency : 2.16MHz ~ 463 ns
data taking time : 100ns
300mm
slit aperture ~0.26mrad
e e - - detector
set up
ray
beam
peak wavelength (nm) decay time (ns)2(35%)20(65%)
Pure CsI (slow time reaction element) 450 100 - 4000
305Pure CsI (rapid time reaction element)

レーザーと光学系
共振器長 420mm
圧電素子でミラーの光軸方向の位置を変化
衝突角 12 度
透過光強度を検出→ 共振のモニター
反射率99.6%

光学セットアップ