frontmatter.indd 1 27/11/13 4:52 pm - transportation.orgdownloads.transportation.org/tvf-1 for scoh...
TRANSCRIPT

Frontmatter.indd 1 27/11/13 4:52 PM

American Association of State Highway and Transportation Officials
444 North Capitol Street, NW, Suite 249
Washington, DC 20001
202-624-5800 phone/202-624-5806 fax
www.transportation.org
© 2013 by the American Association of State Highway and Transportation Officials. All rights reserved.
Duplication is a violation of applicable law.
Publication Code: TVF-1
ISBN: 978-1-56051-522-7
Frontmatter.indd 2 27/11/13 4:52 PM

iii
ACKNOWLEDGMENTS
AASHTO would like to thank the following panel members for their contribution to this publication. (Employer information were as of the time of their participation on the panel.)
y TCRP D-09 – John D. Wilkins, New Jersey Transit – Manjiri G. Akalkotkar, CEPT University – Philip J. Clark, New York State DOT – Dennis G. Dal Santo, Illinois DOT – Amy W. Datz, Florida DOT – Katharine M. Hunter-Zaworski, Oregon
State University – Peter C. Martin, Wilbur Smith Associates – Hak-Chul Shin, Jackson State University – Robert C. Schlicht, Federal Highway
Administration – Terrell Williams, Federal Transit
Administration – James T. McDonnell, AASHTO – Stephen Maher, Transportation Research
Board – David H. Clawson, AASHTO – Gwen Chisholm-Smith, Transportation
Research Board
y Practitioner Review Panel for the TCRP Project – Lloyd Smith, Metropolitan Transit
Authority of Harris County, Houston, Texas – John LaPlante, TYLin International – Sam Schwartz, Sam Schwartz Company – Ellen Bevington, Metro Transit, King
County, Washington – Lee Goodman, Consultant – Tom Callow, City of Phoenix – Gerard Sofian, New York City DOT – Joe Palladi, Georgia DOT – Koorosh Olyai, Dallas Area Rapid Transit – Michael Ronkin, Oregon DOT – Bill James, HNTB
– Maurice Palumbo, Golden Gate Bridge, Highway and Transportation District
– Rich Feder, Port Authority of Allegheny County
– Doug Lowe, Caltrans – Bill Menzies, Winnipeg – Kornel Musci, City of Ottawa
y NCHRP 20-7, Task 135 – James T. McDonnell , AASHTO – Howard P. Benn , Montgomery County
(MD) Transit – Carla L. Cefaratti , Ohio DOT – Philip J. Clark, Bergmann Associates – Edward R. Coven, Florida DOT – Elizabeth Hilton, Federal Highway
Administration – Robert C. Schlicht, Federal Highway
Administration – Sam Carnaggio, Metropolitan Washington
Airports Authority – Harvey Berlin, NCHRP
y NCHRP 20-7, Task 296 – Neil Bourdreau , Massachusetts DOT – Rick Bruce, Ohio DOT – Maurice Palumbo, Golden Gate Bridge
Highway and Transportation District – Brooke Struve, Federal Highway
Administration – Barton A. Thrasher, Virginia DOT – Stephen W. Warren , Connecticut Transit – Keith Platte, AASHTO
With special thanks to Richard Coakley, P.E., PTOE, Principal Transportation Engineer at CH2M Hill for his assistance in completing production of this publication.
Frontmatter.indd 3 27/11/13 4:52 PM

iv
AMERICAN ASSOCIATION OF STATE HIGHWAY AND TRANSPORTATION OFFICIALS
444 North Capitol Street, N.W. Suite 249Washington, D.C. 20001
Executive Committee 2013–2014
Officers:
President: Mike Hancock, Kentucky*
Vice President: John Cox, Wyoming*
Secretary-Treasurer: Carlos Braceras, Utah
Executive Director: Bud Wright, Washington, D.C.
Regional Representatives:
REGION I:
Chris Clement, New Hampshire
Shailen Bhatt, Delaware
REGION II:
Sherri LeBas, Louisiana
John Schroer, Tennessee
REGION III:
Paul Trombino, Iowa
Ann L. Schneider, Illinois
REGION IV:
John Halikowski, Arizona
Malcolm Dougherty, California
IMMEDIATE PAST PRESIDENT:
Michael P. Lewis, Rhode Island
*Elected at the 2013 Annual Meeting in Denver, Colorado
Frontmatter.indd 4 27/11/13 4:52 PM

v
Members
Alabama William F. Adams Rex Bush William C. KellyAlaska Mark Jerome Neidhold Robert A. CampbellArizona Dallas L. HammitArkansas Mike D. FugettCalifornia Terry L. Abbott Kevin E. HanleyColorado Richard ZamoraConnecticut Timothy Wilson William Britnell James H. NormanDelaware Mark C. Tudor Brian Thad McIlvaineDistrict of Columbia Muhammed KhalidFlorida Frank Timothy SullivanGeorgia Brent Story C. Andy Casey Russell R. McMurryHawaii Julius B. FrondaIdaho Loren Thomas Monica L. CriderIllinois Scott E. StittIndiana John E Wright Jeff ClantonIowa Michael J. Kennerly Deanna L. MaifieldIowa Christopher C. PooleKansas Rodney D. Lacy James O. BrewerKentucky Robert K. Caudill Jeff D. Jasper Bradley S. EldridgeLouisiana Nick Kalivoda III Chad Winchester
Members
Maine Bradford P. Foley Heath E. CowanMaryland Kirk G. McClelland Eric E. MarabelloMassachusetts Stanley W. WoodMichigan Bradley C. WieferichMinnesota Michael T. Ginnaty Jon M. ChigloMississippi John M. Reese Amy Mood Richard PittmanMissouri Eric Schroeter Kathy HarveyMontana Lesly Tribelhorn Paul FerryNebraska Ted Watson James J. KnottNevada Paul M. FrostNew Hampshire William J. OldenburgNew Jersey Richard G. JaffeNew Mexico Gabriela C. ApodacaNew York State Daniel D’Angelo Richard W. LeeNorth Carolina Debbie M. Barbour Art McMillan Jay A. BennettNorth Dakota Roger WeigelOhio Dirk Gross James D. YoungOklahoma Timothy A. TegelerOregon David Joe Polly Steven R. LindlandPennsylvania Barry SchochPuerto Rico José E. Santana-Pimente Luis SantosRhode Island Robert A Smith
SubCOMMITTEE ON DESIGNBarry Schoch, Pennsylvania, Chair
Richard Land, California, Vice ChairVacant, FHWA, Secretary
Greta Smith, AASHTO, Staff Liaison
Frontmatter.indd 5 27/11/13 4:52 PM

vi
South Carolina Mark Lester Mitchell D. Metts George R. Bedenbaugh, Jr.South Dakota Mike Behm Mark A. LeifermanTennessee Jeff C. Jones Carolyn A. Stonecipher Ali R. HangulTexas Mark MarekUtah Lisa J. Wilson Fred DoehringUtah George C. LukesVermont Kevin S. Marshia
Virginia Mohammad Mirshahi Barton A. Thrasher Robert H. CaryWashington State Pasco Bakotich Terry L. Berends Nancy BoydWest Virginia Gregory L. Bailey Jason C. FosterWisconsin Jerry H. ZoggWyoming Andrea Allen Sandra A. Pecenka Tony Laird
Associate Members
Alberta Transportation Moh LaliKorea Expressway Corporation Chan-Su C. ReemNew Jersey Turnpike Authority J. La WilliamsOntario Ministry of Transportation Joe BucikPort Authority of New York and New Jersey Scott D. MurrellSaskatchewan Ministry of Highways and Infrastructure Sukhy Kent
Members Members
Frontmatter.indd 6 27/11/13 4:52 PM

vii
2003 TASK FORCE ON PubLIC TRANSPORTATION FACILITIES DESIGN
y Michelle Martin, Maryland SHA
y Luisa Paiewonsky, Massachusetts Highway Department,
y Robert Schlicht, FHWA
y Stephen Bates, Virginia DOT
y Joseph P. Palladi, Georgia DOT
y Michael Christensen, Minnesota DOT
y Antonette C. Clark, Caltrans
y Carlos A. Lopez, Texas DOT
y Dave McCormick, Washington State DOT
y Myron Swisher, Colorado DOT
y Dennis Christiansen, Texas Transportation Institute
y Chuck Fuhs Parsons Brinckerhoff
y Jon Obenberger, FHWA
Frontmatter.indd 7 27/11/13 4:52 PM

viii
CONTENTS
CHAPTER 1 INTRODuCTION
1.1 PURPOSE AND SCOPE. . . . . . . . . . . . . . . . . . . . . . . . . . . . . . . . . . . . . . . . . . . . . . . . . . . . . . . . . . . . . . . .1-2
1.2 AUDIENCE . . . . . . . . . . . . . . . . . . . . . . . . . . . . . . . . . . . . . . . . . . . . . . . . . . . . . . . . . . . . . . . . . . . . . . . . .1-2
1.3 ORGANIZATION OF GUIDELINES . . . . . . . . . . . . . . . . . . . . . . . . . . . . . . . . . . . . . . . . . . . . . . . . . . . . . . .1-2
1.4 USING THE GUIDE . . . . . . . . . . . . . . . . . . . . . . . . . . . . . . . . . . . . . . . . . . . . . . . . . . . . . . . . . . . . . . . . . . .1-3
1.5 REFERENCES . . . . . . . . . . . . . . . . . . . . . . . . . . . . . . . . . . . . . . . . . . . . . . . . . . . . . . . . . . . . . . . . . . . . . . .1-3
CHAPTer 2 PLAnninG And deCiSiOn-MAkinG
2.1 REGIONAL AND CORRIDOR PLANNING PROCESSES . . . . . . . . . . . . . . . . . . . . . . . . . . . . . . . . . . . . . . . .2-2
2.2 INTEGRATING TRANSIT PROJECTS INTO ROADWAY PLANNING PROCESSES . . . . . . . . . . . . . . . . . . .2-13
2.3 SUMMARY . . . . . . . . . . . . . . . . . . . . . . . . . . . . . . . . . . . . . . . . . . . . . . . . . . . . . . . . . . . . . . . . . . . . . . . .2-15
2.4 REFERENCES . . . . . . . . . . . . . . . . . . . . . . . . . . . . . . . . . . . . . . . . . . . . . . . . . . . . . . . . . . . . . . . . . . . . . .2-16
CHAPTER 3 DESIGN PARAMETERS AND CONTROLS
3.1 TRANSIT VEHICLE CHARACTERISTICS AND CONTROLS . . . . . . . . . . . . . . . . . . . . . . . . . . . . . . . . . . . . .3-1
3.2 ROADWAY DESIGN CONTROLS AND CRITERIA . . . . . . . . . . . . . . . . . . . . . . . . . . . . . . . . . . . . . . . . . . .3-17
3.3 TRANSIT QUALITY OF SERVICE AND CAPACITY CONSIDERATIONS . . . . . . . . . . . . . . . . . . . . . . . . . . .3-23
3.4 TRANSIT OPERATIONS AND INFRASTRUCTURE . . . . . . . . . . . . . . . . . . . . . . . . . . . . . . . . . . . . . . . . . .3-31
3.5 REFERENCES . . . . . . . . . . . . . . . . . . . . . . . . . . . . . . . . . . . . . . . . . . . . . . . . . . . . . . . . . . . . . . . . . . . . . .3-33
CHAPTER 4 buS FACILITIES ON LIMITED ACCESS HIGHWAYS
4.1 GENERAL PLANNING AND DESIGN CONSIDERATIONS . . . . . . . . . . . . . . . . . . . . . . . . . . . . . . . . . . . . . .4-2
4.2 TREATMENTS . . . . . . . . . . . . . . . . . . . . . . . . . . . . . . . . . . . . . . . . . . . . . . . . . . . . . . . . . . . . . . . . . . . . . .4-5
4.3 OPERATIONAL REQUIREMENTS . . . . . . . . . . . . . . . . . . . . . . . . . . . . . . . . . . . . . . . . . . . . . . . . . . . . . . .4-41
4.4 PROTECTING FUTURE NEEDS . . . . . . . . . . . . . . . . . . . . . . . . . . . . . . . . . . . . . . . . . . . . . . . . . . . . . . . . .4-49
4.5 REFERENCES . . . . . . . . . . . . . . . . . . . . . . . . . . . . . . . . . . . . . . . . . . . . . . . . . . . . . . . . . . . . . . . . . . . . . .4-52
CHAPTER 5 GuIDELINES FOR buS FACILITIES ON STREETS AND ROADWAYS
5.1 GENERAL PLANNING AND DESIGN CONSIDERATIONS . . . . . . . . . . . . . . . . . . . . . . . . . . . . . . . . . . . . . .5-2
5.2 BUS STOP LOCATIONS AND DESIGN . . . . . . . . . . . . . . . . . . . . . . . . . . . . . . . . . . . . . . . . . . . . . . . . . . . .5-9
Frontmatter.indd 8 27/11/13 4:52 PM

ix
5.3 BUS OPERATION IN SHARED LANES (MIXED TRAFFIC) . . . . . . . . . . . . . . . . . . . . . . . . . . . . . . . . . . . . .5-31
5.4 PRIORITY FACILITIES—PLANNING AND DESIGN . . . . . . . . . . . . . . . . . . . . . . . . . . . . . . . . . . . . . . . . . .5-41
5.5 PRIORITY LANES . . . . . . . . . . . . . . . . . . . . . . . . . . . . . . . . . . . . . . . . . . . . . . . . . . . . . . . . . . . . . . . . . . .5-48
5.6 MEDIAN BUSWAYS AND STREETS . . . . . . . . . . . . . . . . . . . . . . . . . . . . . . . . . . . . . . . . . . . . . . . . . . . . .5-72
5.7 ENFORCEMENT . . . . . . . . . . . . . . . . . . . . . . . . . . . . . . . . . . . . . . . . . . . . . . . . . . . . . . . . . . . . . . . . . . . .5-80
5.8 ITS DESIGN DETAILS . . . . . . . . . . . . . . . . . . . . . . . . . . . . . . . . . . . . . . . . . . . . . . . . . . . . . . . . . . . . . . . .5-82
5.9 REFERENCES . . . . . . . . . . . . . . . . . . . . . . . . . . . . . . . . . . . . . . . . . . . . . . . . . . . . . . . . . . . . . . . . . . . . . .5-89
CHAPTER 6 LIGHT RAIL AND STREETCAR FACILITIES ON STREETS AND HIGHWAYS
6.1 HISTORICAL CONTEXT . . . . . . . . . . . . . . . . . . . . . . . . . . . . . . . . . . . . . . . . . . . . . . . . . . . . . . . . . . . . . . .6-1
6.2 GENERAL PLANNING AND DESIGN GUIDELINES . . . . . . . . . . . . . . . . . . . . . . . . . . . . . . . . . . . . . . . . . .6-4
6.3 GEOMETRIC DESIGN FEATURES . . . . . . . . . . . . . . . . . . . . . . . . . . . . . . . . . . . . . . . . . . . . . . . . . . . . . . .6-19
6.4 STOP AND STATION DESIGN . . . . . . . . . . . . . . . . . . . . . . . . . . . . . . . . . . . . . . . . . . . . . . . . . . . . . . . . . .6-27
6.5 TRAFFIC CONTROLS . . . . . . . . . . . . . . . . . . . . . . . . . . . . . . . . . . . . . . . . . . . . . . . . . . . . . . . . . . . . . . . .6-37
6.6 LRT/BUS LANE ENFORCEMENT . . . . . . . . . . . . . . . . . . . . . . . . . . . . . . . . . . . . . . . . . . . . . . . . . . . . . . .6-48
6.7 REFERENCES . . . . . . . . . . . . . . . . . . . . . . . . . . . . . . . . . . . . . . . . . . . . . . . . . . . . . . . . . . . . . . . . . . . . . .6-49
CHAPTER 7 PEDESTRIAN AND bICYCLE ACCESS
7.1 PEDESTRIAN ACCESS . . . . . . . . . . . . . . . . . . . . . . . . . . . . . . . . . . . . . . . . . . . . . . . . . . . . . . . . . . . . . . . .7-1
7.2 BICYCLE ACCESS . . . . . . . . . . . . . . . . . . . . . . . . . . . . . . . . . . . . . . . . . . . . . . . . . . . . . . . . . . . . . . . . . . .7-20
7.3 PASSENGER AMENITY/AESTHETIC CONSIDERATIONS . . . . . . . . . . . . . . . . . . . . . . . . . . . . . . . . . . . . .7-23
7.4 REFERENCES . . . . . . . . . . . . . . . . . . . . . . . . . . . . . . . . . . . . . . . . . . . . . . . . . . . . . . . . . . . . . . . . . . . . . .7-24
APPENDICES
A GLOSSARY ........................................................................................................ A-1
b bIbLIOGRAPHY ................................................................................................ B-1
C buS VEHICLE CHARACTERISTICS ..................................................................... C-1
C.1 DESIGN VEHICLE GUIDANCE . . . . . . . . . . . . . . . . . . . . . . . . . . . . . . . . . . . . . . . . . . . . . . . . . . . . . . . . . .C-1
C.2 MINIMUM TURNING PATHS OF DESIGN VEHICLES . . . . . . . . . . . . . . . . . . . . . . . . . . . . . . . . . . . . . . . .C-2
C.3 REFERENCES . . . . . . . . . . . . . . . . . . . . . . . . . . . . . . . . . . . . . . . . . . . . . . . . . . . . . . . . . . . . . . . . . . . . . .C-12
Frontmatter.indd 9 27/11/13 4:52 PM

x
D buSWAYS ......................................................................................................... d-1
D.1 DESIGN APPROACH . . . . . . . . . . . . . . . . . . . . . . . . . . . . . . . . . . . . . . . . . . . . . . . . . . . . . . . . . . . . . . . . D-1
D.2 BUSWAY GEOMETRY . . . . . . . . . . . . . . . . . . . . . . . . . . . . . . . . . . . . . . . . . . . . . . . . . . . . . . . . . . . . . . . D-5
D.3 BUSWAY DESIGN . . . . . . . . . . . . . . . . . . . . . . . . . . . . . . . . . . . . . . . . . . . . . . . . . . . . . . . . . . . . . . . . . D-16
D.4 ADDITIONAL FIGURES FOR BUSWAYS . . . . . . . . . . . . . . . . . . . . . . . . . . . . . . . . . . . . . . . . . . . . . . . . D-28
D.5 REFERENCES . . . . . . . . . . . . . . . . . . . . . . . . . . . . . . . . . . . . . . . . . . . . . . . . . . . . . . . . . . . . . . . . . . . . D-35
e Off-Line TrAnSiT fACiLiTieS ..........................................................................e-1
E.1 PLANNING AND DESIGN CONSIDERATIONS . . . . . . . . . . . . . . . . . . . . . . . . . . . . . . . . . . . . . . . . . . . . . .E-1
E.2 PARKING AND ACCESS DESIGN . . . . . . . . . . . . . . . . . . . . . . . . . . . . . . . . . . . . . . . . . . . . . . . . . . . . . . .E-15
E.3 BUS—PASSENGER INTERFACE DESIGN . . . . . . . . . . . . . . . . . . . . . . . . . . . . . . . . . . . . . . . . . . . . . . . . .E-30
E.4 COMMUNITY INTEGRATION . . . . . . . . . . . . . . . . . . . . . . . . . . . . . . . . . . . . . . . . . . . . . . . . . . . . . . . . .E-49
E.5 REFERENCES . . . . . . . . . . . . . . . . . . . . . . . . . . . . . . . . . . . . . . . . . . . . . . . . . . . . . . . . . . . . . . . . . . . . . .E-56
Frontmatter.indd 10 27/11/13 4:52 PM

xi
LIST OF FIGuRES
CHAPTer 2 PLAnninG And deCiSiOn-MAkinG
Figure 2-1. Planning and Project Development Process for New Start Projects . . . . . . . . . . . . . . . . . . . . .2-8
Figure 2-2. Transportation System Planning Process . . . . . . . . . . . . . . . . . . . . . . . . . . . . . . . . . . . . . . . . .2-10
Figure 2-3. Typical Corridor Planning and Project Development Process . . . . . . . . . . . . . . . . . . . . . . . . .2-11
Figure 2-4. Transit Inputs into Typical Roadway Planning and Development Process . . . . . . . . . . . . . . .2-14
CHAPTER 3 DESIGN PARAMETERS AND CONTROLS
Figure 3-1. Typical 12.2-m (40-ft) Urban Transit Bus . . . . . . . . . . . . . . . . . . . . . . . . . . . . . . . . . . . . . . . . . . .3-2
Figure 3-2. Intercity Bus . . . . . . . . . . . . . . . . . . . . . . . . . . . . . . . . . . . . . . . . . . . . . . . . . . . . . . . . . . . . . . . . .3-4
Figure 3-3. Double-Decker Bus . . . . . . . . . . . . . . . . . . . . . . . . . . . . . . . . . . . . . . . . . . . . . . . . . . . . . . . . . . . .3-4
Figure 3-4. Minimum Turning Path for a Typical Transit Design Vehicle . . . . . . . . . . . . . . . . . . . . . . . . . . .3-6
Figure 3-5. Example of Bicycle Rack on Standard Bus . . . . . . . . . . . . . . . . . . . . . . . . . . . . . . . . . . . . . . . . . .3-8
Figure 3-6. Minimum Turning Path for a Typical Bus with Bicycle Rack . . . . . . . . . . . . . . . . . . . . . . . . . . .3-9
Figure 3-7. Bus Underside Clearance Angles . . . . . . . . . . . . . . . . . . . . . . . . . . . . . . . . . . . . . . . . . . . . . . . .3-10
Figure 3-8. Mechanical (Raised Curb) Guideway, Essen, Germany . . . . . . . . . . . . . . . . . . . . . . . . . . . . . .3-10
Figure 3-9. Mechanical (Raised Curb) Guideway, Essen, Germany . . . . . . . . . . . . . . . . . . . . . . . . . . . . . .3-11
Figure 3-10. Optically Guided CIVIS Bus in Las Vegas, Nevada . . . . . . . . . . . . . . . . . . . . . . . . . . . . . . . . . .3-12
Figure 3-11. Modern Articulated LRV . . . . . . . . . . . . . . . . . . . . . . . . . . . . . . . . . . . . . . . . . . . . . . . . . . . . . .3-13
Figure 3-12. Dynamic Envelope for a Single LRT Track . . . . . . . . . . . . . . . . . . . . . . . . . . . . . . . . . . . . . . . .3-17
Figure 3-13. Turning Clearance Requirements for Streetcar and LRV . . . . . . . . . . . . . . . . . . . . . . . . . . . .3-18
Figure 3-14. Bus Lane on Freeway Shoulder . . . . . . . . . . . . . . . . . . . . . . . . . . . . . . . . . . . . . . . . . . . . . . . .3-22
Figure 3-15. Person Capacity Ranges of United States and Canadian Transit Modes . . . . . . . . . . . . . . .3-26
Figure 3-16. Typical Transit Speed and Capacity Ranges of United States and Canadian
Transit Modes . . . . . . . . . . . . . . . . . . . . . . . . . . . . . . . . . . . . . . . . . . . . . . . . . . . . . . . . . . . . . . . . . . . . . . . . .3-27
CHAPTER 4 buS FACILITIES ON LIMITED ACCESS HIGHWAYS
Figure 4-1. Typical Cross Sections for Concurrent-Flow Buffer Separated Lanes . . . . . . . . . . . . . . . . . . . .4-7
Figure 4-2. Typical Cross-Section for Concurrent Flow Right Side Lanes . . . . . . . . . . . . . . . . . . . . . . . . . . .4-8
Figure 4-3. Typical Cross Sections for Two-Way Barrier-Separated Lanes . . . . . . . . . . . . . . . . . . . . . . . . . .4-9
Frontmatter.indd 11 27/11/13 4:52 PM

xii
Figure 4-4. Typical Cross Sections for Reversible Lanes . . . . . . . . . . . . . . . . . . . . . . . . . . . . . . . . . . . . . . 4-10
Figure 4-5. Typical Cross Sections for Busway or HOV Facility in Separate Rights-of-Way . . . . . . . . . . . .4-11
Figure 4-6. Typical Cross Sections for Contraflow Lanes . . . . . . . . . . . . . . . . . . . . . . . . . . . . . . . . . . . . . . .4-12
Figure 4-7. Typical Layout for a Bus/HOV Bypass at a Metered Freeway Entrance Ramp . . . . . . . . . . . .4-13
Figure 4-8. Typical Layout for a Separate Bus/HOV Bypass on a Metered Freeway . . . . . . . . . . . . . . . . .4-13
Figure 4-9. Example of a Bus/HOV Drop Ramp . . . . . . . . . . . . . . . . . . . . . . . . . . . . . . . . . . . . . . . . . . . . . .4-14
Figure 4-10. Typical Layouts for Bus/HOV Lane Entrance . . . . . . . . . . . . . . . . . . . . . . . . . . . . . . . . . . . . . .4-15
Figure 4-11. Typical Layouts for Bus/HOV Lane Termination . . . . . . . . . . . . . . . . . . . . . . . . . . . . . . . . . . .4-15
Figure 4-12. Typical Layouts of Slip Ramps with Weave Lanes . . . . . . . . . . . . . . . . . . . . . . . . . . . . . . . . . .4-16
Figure 4-13. Bus Turnouts . . . . . . . . . . . . . . . . . . . . . . . . . . . . . . . . . . . . . . . . . . . . . . . . . . . . . . . . . . . . . . .4-18
Figure 4-14. Typical Pedestrian Overpasses on Major Highways . . . . . . . . . . . . . . . . . . . . . . . . . . . . . . 4-23
Figure 4-15. Example High-Speed Freeway On-Line Stations . . . . . . . . . . . . . . . . . . . . . . . . . . . . . . . . . . .4-25
Figure 4-16. Choosing a Station Type . . . . . . . . . . . . . . . . . . . . . . . . . . . . . . . . . . . . . . . . . . . . . . . . . . . . . .4-27
Figure 4-17. Example of Right-Side, On-Line Station Stop, I-110, Los Angeles, California . . . . . . . . . . . .4-28
Figure 4-18. Example of Right-Side, On-Line Stop, I-5, Seattle, Washington. . . . . . . . . . . . . . . . . . . . . . .4-29
Figure 4-19. Right-Side Bus Stops at Freeway Level . . . . . . . . . . . . . . . . . . . . . . . . . . . . . . . . . . . . . . . . . .4-30
Figure 4-20. Right-Side Bus Stops at Freeway Level—Diamond Interchange . . . . . . . . . . . . . . . . . . . . . .4-31
Figure 4-21. Sample of Right-Side Stops . . . . . . . . . . . . . . . . . . . . . . . . . . . . . . . . . . . . . . . . . . . . . . . . . . .4-32
Figure 4-22. Sample Median-Side Stop, Side Platform with Through Lane . . . . . . . . . . . . . . . . . . . . . . . .4-34
Figure 4-23. Sample Median-Side Stop, Side Platform with No Through Lane . . . . . . . . . . . . . . . . . . . . .4-35
Figure 4-24. On-Line Station on I-110, Los Angeles, California . . . . . . . . . . . . . . . . . . . . . . . . . . . . . . . . . . . . . 4-35
Figure 4-25. Pedestrian Access on On-Line Station on I-110, Los Angeles, California . . . . . . . . . . . . . . .4-36
Figure 4-26. Mountlake Terrace Station on I-5, Seattle, Washington . . . . . . . . . . . . . . . . . . . . . . . . . . . .4-36
Figure 4-27. Mountlake Terrace Station on I-5, Seattle, Washington . . . . . . . . . . . . . . . . . . . . . . . . . . . .4-37
Figure 4-28. Sample Median-Side Stop, Center Platform . . . . . . . . . . . . . . . . . . . . . . . . . . . . . . . . . . . . . .4-37
Figure 4-29. HOV Direct Access Ramp Serving Bus Transfers at an Intersection . . . . . . . . . . . . . . . . . . .4-38
Figure 4-30. Freeway Interchange Bus Stop Using a Driveway . . . . . . . . . . . . . . . . . . . . . . . . . . . . . . . . .4-40
Figure 4-31. Freeway Interchange Bus Stop Using a Driveway . . . . . . . . . . . . . . . . . . . . . . . . . . . . . . . . .4-41
Figure 4-32. Bus Stops at Street Level on Diamond Interchange . . . . . . . . . . . . . . . . . . . . . . . . . . . . . . . .4-42
Figure 4-33. Cross Sections of Enforcement Areas on Reversible Lanes . . . . . . . . . . . . . . . . . . . . . . . . . .4-45
Frontmatter.indd 12 27/11/13 4:52 PM

xiii
Figure 4-34. Cross Sections of Enforcement Areas on Concurrent-Flow Buffer-Separated Lanes . . . . . .4-46
Figure 4-35. Directional and Bi-Directional Enforcement Area Layout . . . . . . . . . . . . . . . . . . . . . . . . . . .4-47
Figure 4-36. Examples of Regulatory Signs Used with Bus/HOV Facilities . . . . . . . . . . . . . . . . . . . . . . . 4-48
Figure 4-37. Example of HOV Lane Pavement Marking . . . . . . . . . . . . . . . . . . . . . . . . . . . . . . . . . . . . . . .4-49
CHAPTER 5 GuIDELINES FOR buS FACILITIES ON STREETS AND ROADWAYS
Figure 5-1. Density Organized to Benefit from Transit . . . . . . . . . . . . . . . . . . . . . . . . . . . . . . . . . . . . . . . . .5-7
Figure 5-2. Density Organized to Benefit from Transit . . . . . . . . . . . . . . . . . . . . . . . . . . . . . . . . . . . . . . . . .5-8
Figure 5-3. Transit Route Access to Building . . . . . . . . . . . . . . . . . . . . . . . . . . . . . . . . . . . . . . . . . . . . . . . . .5-9
Figure 5-4. Transit Routes and Subdivision Development . . . . . . . . . . . . . . . . . . . . . . . . . . . . . . . . . . . . .5-10
Figure 5-5. Pedestrian Links to Bus Stops . . . . . . . . . . . . . . . . . . . . . . . . . . . . . . . . . . . . . . . . . . . . . . . . . .5-12
Figure 5-6. Typical Bus Stop Zone Dimensions . . . . . . . . . . . . . . . . . . . . . . . . . . . . . . . . . . . . . . . . . . . . . .5-16
Figure 5-7. Far-Side Bus Bulb . . . . . . . . . . . . . . . . . . . . . . . . . . . . . . . . . . . . . . . . . . . . . . . . . . . . . . . . . . . .5-17
Figure 5-8. Mid-Block Bus Bulb Created by Curb Extension . . . . . . . . . . . . . . . . . . . . . . . . . . . . . . . . . . . .5-17
Figure 5-9. Bus Bulb with Near-Side Stops . . . . . . . . . . . . . . . . . . . . . . . . . . . . . . . . . . . . . . . . . . . . . . . . . .5-19
Figure 5-10. Bus Bulb with Far-Side Stops . . . . . . . . . . . . . . . . . . . . . . . . . . . . . . . . . . . . . . . . . . . . . . . . . .5-20
Figure 5-11. Closed Bus Bay . . . . . . . . . . . . . . . . . . . . . . . . . . . . . . . . . . . . . . . . . . . . . . . . . . . . . . . . . . . . .5-21
Figure 5-12. Open Bus Bay . . . . . . . . . . . . . . . . . . . . . . . . . . . . . . . . . . . . . . . . . . . . . . . . . . . . . . . . . . . . . .5-22
Figure 5-13. Queue Jump Bus Bay . . . . . . . . . . . . . . . . . . . . . . . . . . . . . . . . . . . . . . . . . . . . . . . . . . . . . . . .5-23
Figure 5-14. Half Sawtooth Bus Bay . . . . . . . . . . . . . . . . . . . . . . . . . . . . . . . . . . . . . . . . . . . . . . . . . . . . . . .5-23
Figure 5-15. Typical Bus Bay Dimensions . . . . . . . . . . . . . . . . . . . . . . . . . . . . . . . . . . . . . . . . . . . . . . . . . . .5-24
Figure 5-16. Partially Open Bus Bay Dimensions . . . . . . . . . . . . . . . . . . . . . . . . . . . . . . . . . . . . . . . . . . . . .5-25
Figure 5-17. Typical Queue Jump Bus Bay . . . . . . . . . . . . . . . . . . . . . . . . . . . . . . . . . . . . . . . . . . . . . . . . . .5-26
Figure 5-18. Luggage Bay Bicycle Rack . . . . . . . . . . . . . . . . . . . . . . . . . . . . . . . . . . . . . . . . . . . . . . . . . . . . .5-33
Figure 5-19. Comparison of New Flyer D60 (Articulated Bus) AutoTurn™ Centerline
Path vs. Field Observations . . . . . . . . . . . . . . . . . . . . . . . . . . . . . . . . . . . . . . . . . . . . . . . . . . . . . . . . . . . . . .5-34
Figure 5-20. Left-Turn Street Controls . . . . . . . . . . . . . . . . . . . . . . . . . . . . . . . . . . . . . . . . . . . . . . . . . . . . .5-38
Figure 5-21. Queue Jump Signal . . . . . . . . . . . . . . . . . . . . . . . . . . . . . . . . . . . . . . . . . . . . . . . . . . . . . . . . . .5-40
Figure 5-22. Bus Queue Bypass . . . . . . . . . . . . . . . . . . . . . . . . . . . . . . . . . . . . . . . . . . . . . . . . . . . . . . . . . .5-41
Figure 5-23. Arterial Street Characteristics . . . . . . . . . . . . . . . . . . . . . . . . . . . . . . . . . . . . . . . . . . . . . . . . .5-42
Figure 5-24. Transit Priority Evaluation Process . . . . . . . . . . . . . . . . . . . . . . . . . . . . . . . . . . . . . . . . . . . . .5-44
Frontmatter.indd 13 27/11/13 4:52 PM

xiv
Figure 5-25. Typical Suburban Arterial with Bus Bay . . . . . . . . . . . . . . . . . . . . . . . . . . . . . . . . . . . . . . . . .5-45
Figure 5-26. Typical CBD Street with Bus Lane . . . . . . . . . . . . . . . . . . . . . . . . . . . . . . . . . . . . . . . . . . . . . .5-46
Figure 5-27. A Shoulder Lane Approaching a Signalized Intersection with a Right-Turn Lane . . . . . . . . .5-50
Figure 5-28. Right Curb Bus (HOV) Lane, Toronto . . . . . . . . . . . . . . . . . . . . . . . . . . . . . . . . . . . . . . . . . . . .5-51
Figure 5-29. Stopped Vehicle Obstructing Bus Lane, Toronto . . . . . . . . . . . . . . . . . . . . . . . . . . . . . . . . . .5-51
Figure 5-30. Normal Flow Curb Bus Lane Designs for Two-Way Streets . . . . . . . . . . . . . . . . . . . . . . . . . .5-52
Figure 5-31. Bus Lane, Ottawa . . . . . . . . . . . . . . . . . . . . . . . . . . . . . . . . . . . . . . . . . . . . . . . . . . . . . . . . . . .5-54
Figure 5-32. Dual Bus Lane Madison Avenue, New York City . . . . . . . . . . . . . . . . . . . . . . . . . . . . . . . . . . .5-55
Figure 5-33. Contraflow Bus Lane Options . . . . . . . . . . . . . . . . . . . . . . . . . . . . . . . . . . . . . . . . . . . . . . . . .5-56
Figure 5-34. Spring Street Contraflow Lane (Los Angeles) . . . . . . . . . . . . . . . . . . . . . . . . . . . . . . . . . . . . .5-58
Figure 5-35. Signing and pavement markings for Contraflow Bus Lane on Spring Street,
Los Angeles . . . . . . . . . . . . . . . . . . . . . . . . . . . . . . . . . . . . . . . . . . . . . . . . . . . . . . . . . . . . . . . . . . . . . . . . . . .5-59
Figure 5-36. Photo of Animated Eyes on a Pedestrian Signal Display . . . . . . . . . . . . . . . . . . . . . . . . . . . .5-60
Figure 5-37. Median Contraflow HOV Lane, Honolulu, Hawaii . . . . . . . . . . . . . . . . . . . . . . . . . . . . . . . . .5-61
Figure 5-38. Exclusive Transit Lane in Median . . . . . . . . . . . . . . . . . . . . . . . . . . . . . . . . . . . . . . . . . . . . . . .5-61
Figure 5-39. Contraflow Bus Lane Design . . . . . . . . . . . . . . . . . . . . . . . . . . . . . . . . . . . . . . . . . . . . . . . . . .5-62
Figure 5-40. Median Concurrent Flow (Left-Side) Bus Lane, Paris, France . . . . . . . . . . . . . . . . . . . . . . . .5-63
Figure 5-41. Curbside Preferential Lane Signs . . . . . . . . . . . . . . . . . . . . . . . . . . . . . . . . . . . . . . . . . . . . . . .5-64
Figure 5-42. Overhead Preferential Lane Signs . . . . . . . . . . . . . . . . . . . . . . . . . . . . . . . . . . . . . . . . . . . . . .5-65
Figure 5-43. Intersection Lane Control Signs . . . . . . . . . . . . . . . . . . . . . . . . . . . . . . . . . . . . . . . . . . . . . . . .5-65
Figure 5-44. Typical Lane Word Marking Layout . . . . . . . . . . . . . . . . . . . . . . . . . . . . . . . . . . . . . . . . . . . . .5-66
Figure 5-45. Bus Lane Pavement Marking—Australia . . . . . . . . . . . . . . . . . . . . . . . . . . . . . . . . . . . . . . . . .5-66
Figure 5-46. Bus Lane Pavement Marking— New York City . . . . . . . . . . . . . . . . . . . . . . . . . . . . . . . . . . . .5-67
Figure 5-47. Typical Markings for Preferential Lanes . . . . . . . . . . . . . . . . . . . . . . . . . . . . . . . . . . . . . . . . .5-68
Figure 5-48. Red Curb Line for Bus Lane, New York . . . . . . . . . . . . . . . . . . . . . . . . . . . . . . . . . . . . . . . . . .5-69
Figure 5-49. Examples of Bus-Only Turn Lanes . . . . . . . . . . . . . . . . . . . . . . . . . . . . . . . . . . . . . . . . . . . . . .5-70
Figure 5-50. Advance Signal and Stop Bar for Bus Left Turns from Right-Lane Bus Stop . . . . . . . . . . . . .5-72
Figure 5-51. Median Busway, Vancouver . . . . . . . . . . . . . . . . . . . . . . . . . . . . . . . . . . . . . . . . . . . . . . . . . . .5-73
Figure 5-52. Median Arterial Busway Design for a Wide Roadway . . . . . . . . . . . . . . . . . . . . . . . . . . . . . .5-77
Figure 5-53. Typical Median Arterial Busway Design with Left Turns . . . . . . . . . . . . . . . . . . . . . . . . . . . .5-77
Figure 5-54. Typical Median Arterial Busway Design Without Left Turns . . . . . . . . . . . . . . . . . . . . . . . . .5-78
Frontmatter.indd 14 27/11/13 4:52 PM
xv
Figure 5-55. Typical Bus Street Designs . . . . . . . . . . . . . . . . . . . . . . . . . . . . . . . . . . . . . . . . . . . . . . . . . . . .5-78
Figure 5-56. Conceptual Arrangement of Right-Side Station for All-Day, Left Bus Lane . . . . . . . . . . . . . .5-79
Figure 5-57. Real-Time Passenger Information . . . . . . . . . . . . . . . . . . . . . . . . . . . . . . . . . . . . . . . . . . . . . .5-87
CHAPTER 6 LIGHT RAIL AND STREETCAR FACILITIES ON STREETS AND HIGHWAYS
Figure 6-1. Street Running Interurban, Indiana (1937) . . . . . . . . . . . . . . . . . . . . . . . . . . . . . . . . . . . . . . . . .6-2
Figure 6-2. Side Running Streetcar, Indiana (1930s) . . . . . . . . . . . . . . . . . . . . . . . . . . . . . . . . . . . . . . . . . . .6-2
Figure 6-3. Street Loading 63rd Street, Chicago, Illinois (1951) . . . . . . . . . . . . . . . . . . . . . . . . . . . . . . . . . .6-3
Figure 6-4. Safety Island, Irving Park Road, Chicago, Illinois (1944) . . . . . . . . . . . . . . . . . . . . . . . . . . . . . . .6-3
Figure 6-5. Portion of LRT Map Illustrating Split Track Pair, San Jose, California . . . . . . . . . . . . . . . . . . . .6-8
Figure 6-6. Streetcar in Mixed-Flow Conditions, Portland, Oregon . . . . . . . . . . . . . . . . . . . . . . . . . . . . . . .6-9
Figure 6-7. Streetcar in Median Lane of a Boulevard, New Orleans, Louisiana . . . . . . . . . . . . . . . . . . . .6-10
Figure 6-8. LRT Downtown Mall, Houston, Texas . . . . . . . . . . . . . . . . . . . . . . . . . . . . . . . . . . . . . . . . . . . .6-11
Figure 6-9. LRT Arterial Operations in Separate Channel, Baltimore, Maryland. . . . . . . . . . . . . . . . . . . .6-11
Figure 6-10. Muni Metro Twin Peaks Tunnel Portal, San Francisco, California . . . . . . . . . . . . . . . . . . . . .6-12
Figure 6-11. San Diego Trolley Green Line Over State Route 163 . . . . . . . . . . . . . . . . . . . . . . . . . . . . . . .6-13
Figure 6-12. LRT within Freeway Right-of-Way, San Francisco, California . . . . . . . . . . . . . . . . . . . . . . . . .6-13
Figure 6-13. Passenger Information Display . . . . . . . . . . . . . . . . . . . . . . . . . . . . . . . . . . . . . . . . . . . . . . . .6-15
Figure 6-14. Transit Signal . . . . . . . . . . . . . . . . . . . . . . . . . . . . . . . . . . . . . . . . . . . . . . . . . . . . . . . . . . . . . . .6-18
Figure 6-15. Station Design and Roadway Travel Lanes Adapted to Available Right-of-Way . . . . . . . . . .6-25
Figure 6-16. Example of Raised Traffic Delineation . . . . . . . . . . . . . . . . . . . . . . . . . . . . . . . . . . . . . . . . . . .6-26
Figure 6-17. Example of Landscaped Median Around LRT Tracks . . . . . . . . . . . . . . . . . . . . . . . . . . . . . . .6-26
Figure 6-18. Typical Platform Cross-Sections for Light Rail Stations . . . . . . . . . . . . . . . . . . . . . . . . . . . . .6-29
Figure 6-19. Mini-High Platforms . . . . . . . . . . . . . . . . . . . . . . . . . . . . . . . . . . . . . . . . . . . . . . . . . . . . . . . . .6-31
Figure 6-20. Exclusive LRT Median Station Within a Roadway (High-Platform Station) . . . . . . . . . . . . . .6-32
Figure 6-21. Exclusive LRT Side Station Within a Roadway (High-Platform Station) . . . . . . . . . . . . . . . . .6-33
Figure 6-22. Typical LRT Station Configurations . . . . . . . . . . . . . . . . . . . . . . . . . . . . . . . . . . . . . . . . . . . . .6-34
Figure 6-23. Sidewalk Platform Station for LRT in Mixed Traffic . . . . . . . . . . . . . . . . . . . . . . . . . . . . . . . . .6-35
Figure 6-24. Center Platform Station in Median for LRT in Mixed Traffic . . . . . . . . . . . . . . . . . . . . . . . . .6-35
Figure 6-25. Platform Station in Median for LRT on Exclusive Right-of-Way . . . . . . . . . . . . . . . . . . . . . . .6-36
Frontmatter.indd 15 27/11/13 4:52 PM

xvi
Figure 6-26. Far-Side Split Platforms in Median for LRT in Exclusive (Minimum) Right-of-Way . . . . . . .6-36
Figure 6-27. Mid-Block Side Platform Station in Median for LRT in Exclusive Right-of-Way . . . . . . . . . .6-37
Figure 6-28. Mid-Block Side Platform Station in Median for LRT in Exclusive Right-of-Way . . . . . . . . . .6-39
Figure 6-29. Example of LRT Signals . . . . . . . . . . . . . . . . . . . . . . . . . . . . . . . . . . . . . . . . . . . . . . . . . . . . . . .6-40
Figure 6-30. Example of Intersection Design for Median-Running LRT . . . . . . . . . . . . . . . . . . . . . . . . . . .6-41
Figure 6-31. Example of Intersection Design for Side-Running LRT . . . . . . . . . . . . . . . . . . . . . . . . . . . . . .6-43
Figure 6-32. LRT Regulatory Signs . . . . . . . . . . . . . . . . . . . . . . . . . . . . . . . . . . . . . . . . . . . . . . . . . . . . . . . . .6-44
Figure 6-33. Warning Signs and LRT Station Signs . . . . . . . . . . . . . . . . . . . . . . . . . . . . . . . . . . . . . . . . . . . .6-45
Figure 6-34. LRT Transit Vehicle Dynamic Envelope . . . . . . . . . . . . . . . . . . . . . . . . . . . . . . . . . . . . . . . . . .6-46
Figure 6-35. Example of LRT Vehicle Dynamic Envelope Pavement Markings . . . . . . . . . . . . . . . . . . . . .6-47
CHAPTER 7 PEDESTRIAN AND bICYCLE ACCESS
Figure 7-1. Shortcuts to Access Transit . . . . . . . . . . . . . . . . . . . . . . . . . . . . . . . . . . . . . . . . . . . . . . . . . . . . .7-6
Figure 7-2. Pedestrian Crossing That Matches Desire Lines . . . . . . . . . . . . . . . . . . . . . . . . . . . . . . . . . . . . .7-7
Figure 7-3. Sidewalk That Ends Abruptly . . . . . . . . . . . . . . . . . . . . . . . . . . . . . . . . . . . . . . . . . . . . . . . . . . . .7-8
Figure 7-4. Sidewalk Design to Avoid Obstructions . . . . . . . . . . . . . . . . . . . . . . . . . . . . . . . . . . . . . . . . . . . .7-8
Figure 7-5. Sidewalk Design to Avoid . . . . . . . . . . . . . . . . . . . . . . . . . . . . . . . . . . . . . . . . . . . . . . . . . . . . . .7-11
Figure 7-6. Schematic of Accessible Design . . . . . . . . . . . . . . . . . . . . . . . . . . . . . . . . . . . . . . . . . . . . . . . . .7-11
Figure 7-7. Example of Street Narrowing . . . . . . . . . . . . . . . . . . . . . . . . . . . . . . . . . . . . . . . . . . . . . . . . . . .7-13
Figure 7-8. Curb Extension . . . . . . . . . . . . . . . . . . . . . . . . . . . . . . . . . . . . . . . . . . . . . . . . . . . . . . . . . . . . . .7-13
Figure 7-9. Corner Radii and Crossing Distance . . . . . . . . . . . . . . . . . . . . . . . . . . . . . . . . . . . . . . . . . . . . . .7-14
Figure 7-10. Textured Pavement Locating Bus Stops to Discourage Crossing Streets at
Undesirable Locations . . . . . . . . . . . . . . . . . . . . . . . . . . . . . . . . . . . . . . . . . . . . . . . . . . . . . . . . . . . . . . . . . .7-15
Figure 7-11. Example Where Street Crossing Is an Extension of Railroad Crossing . . . . . . . . . . . . . . . . .7-15
Figure 7-12. A Combination of a Screen Wall and Evergreen Landscaping Provide Parking
Lot Screening . . . . . . . . . . . . . . . . . . . . . . . . . . . . . . . . . . . . . . . . . . . . . . . . . . . . . . . . . . . . . . . . . . . . . . . . .7-17
Figure 7-13. Example of Roadway with Buffering . . . . . . . . . . . . . . . . . . . . . . . . . . . . . . . . . . . . . . . . . . . .7-19
Figure 7-14. Example of Utility Pole as Pedestrian Obstacle . . . . . . . . . . . . . . . . . . . . . . . . . . . . . . . . . . .7-20
Figure 7-15. Bike Rack Dimensions and Spacing . . . . . . . . . . . . . . . . . . . . . . . . . . . . . . . . . . . . . . . . . . . . .7-22
Figure 7-16. Attractive Station Area . . . . . . . . . . . . . . . . . . . . . . . . . . . . . . . . . . . . . . . . . . . . . . . . . . . . . . .7-23
Frontmatter.indd 16 27/11/13 4:52 PM

xvii
APPENDICES
C buS VEHICLE CHARACTERISTICS ..................................................................... C-1
Figure C-1. Vehicle Dimensions Reference Points . . . . . . . . . . . . . . . . . . . . . . . . . . . . . . . . . . . . . . . . . . . . .C-2
Figure C-2. Minimum Turning Path for a Passenger Car Design Vehicle . . . . . . . . . . . . . . . . . . . . . . . . . . .C-5
Figure C-3. Minimum Turning Path for a Single Unit Truck Design Vehicle . . . . . . . . . . . . . . . . . . . . . . . . .C-6
Figure C-4. Minimum Turning Path for a 12-M (40-Ft) Intercity Bus Design Vehicle . . . . . . . . . . . . . . . . .C-7
Figure C-5. Minimum Turning Path for a 14-M (45-Ft) Intercity Bus Design Vehicle . . . . . . . . . . . . . . . . .C-8
Figure C-6. Minimum Turning Path for a City Transit Bus Design Vehicle . . . . . . . . . . . . . . . . . . . . . . . . . .C-9
Figure C-7. Minimum Turning Path for an Articulated Bus Design Vehicle . . . . . . . . . . . . . . . . . . . . . . . .C-10
D buSWAYS ......................................................................................................... d-1
Figure D-1. Examples of Busways . . . . . . . . . . . . . . . . . . . . . . . . . . . . . . . . . . . . . . . . . . . . . . . . . . . . . . . . . D-2
Figure D-2. Unguided Busway—Medium-Volume Station . . . . . . . . . . . . . . . . . . . . . . . . . . . . . . . . . . . . D-11
Figure D-3. Unguided Busway—High-Volume Station . . . . . . . . . . . . . . . . . . . . . . . . . . . . . . . . . . . . . . . D-12
Figure D-4. Guided Busway—High-Volume Station . . . . . . . . . . . . . . . . . . . . . . . . . . . . . . . . . . . . . . . . . D-13
Figure D-5. Unguided Busway—Closed Drainage—Retained/Open Cut . . . . . . . . . . . . . . . . . . . . . . . . . D-18
Figure D-6. Unguided Busway—Open Drainage—Shallow Fill . . . . . . . . . . . . . . . . . . . . . . . . . . . . . . . . . D-19
Figure D-7. Unguided Busway—Low-Volume Station . . . . . . . . . . . . . . . . . . . . . . . . . . . . . . . . . . . . . . . . D-20
Figure D-8. Guided Busway—Closed Drainage—Shallow Fill . . . . . . . . . . . . . . . . . . . . . . . . . . . . . . . . . . D-21
Figure D-9. Guided Busway—Closed Drainage—Retained Fill . . . . . . . . . . . . . . . . . . . . . . . . . . . . . . . . . D-21
Figure D-10. Guided Busway—Closed Drainage—Retained Fill . . . . . . . . . . . . . . . . . . . . . . . . . . . . . . . . D-22
Figure D-11. Ramp—Closed drainage—Cut and Fill Sections (Earth) . . . . . . . . . . . . . . . . . . . . . . . . . . . D-23
Figure D-12. Ramp—Open Drainage—Cut and Fill Sections (Earth) . . . . . . . . . . . . . . . . . . . . . . . . . . . . D-24
Figure D-13. Guided Busway Pedestrian Crossing . . . . . . . . . . . . . . . . . . . . . . . . . . . . . . . . . . . . . . . . . . . D-28
Figure D-14. Ramp Busway—Turning Lane Arrangements . . . . . . . . . . . . . . . . . . . . . . . . . . . . . . . . . . . . D-28
Figure D-15. Station Platform Clearances . . . . . . . . . . . . . . . . . . . . . . . . . . . . . . . . . . . . . . . . . . . . . . . . . D-29
Figure D-16. Typical Station Platform Layout . . . . . . . . . . . . . . . . . . . . . . . . . . . . . . . . . . . . . . . . . . . . . . . D-30
Figure D-17. Unguided Busway Bridge Cross-Section . . . . . . . . . . . . . . . . . . . . . . . . . . . . . . . . . . . . . . . . D-31
Figure D-18. Guided Busway Underground Structure Sections . . . . . . . . . . . . . . . . . . . . . . . . . . . . . . . . D-32
Figure D-19. Busway Construction Clearance . . . . . . . . . . . . . . . . . . . . . . . . . . . . . . . . . . . . . . . . . . . . . . D-33
Frontmatter.indd 17 27/11/13 4:52 PM

xviii
Figure D-20. Busway Overpass Clearances—Future LRT . . . . . . . . . . . . . . . . . . . . . . . . . . . . . . . . . . . . . D-33
Figure D-21. Busway Bridge Loadings—Future LRT . . . . . . . . . . . . . . . . . . . . . . . . . . . . . . . . . . . . . . . . . D-34
Figure D-22. Busway Bridge Deck Special Arrangements—Future LRT . . . . . . . . . . . . . . . . . . . . . . . . . . D-34
e Off-Line TrAnSiT fACiLiTieS ..........................................................................e-1
Figure E-1. Park-and-Ride Site-Level Study Process . . . . . . . . . . . . . . . . . . . . . . . . . . . . . . . . . . . . . . . . . . .E-4
Figure E-2. Park-and-Ride Lot . . . . . . . . . . . . . . . . . . . . . . . . . . . . . . . . . . . . . . . . . . . . . . . . . . . . . . . . . . . .E-10
Figure E-3. Combined Radial/Circumference Commute Pattern . . . . . . . . . . . . . . . . . . . . . . . . . . . . . . . .E-12
Figure E-4. Prototype Park-and-Ride Facilities . . . . . . . . . . . . . . . . . . . . . . . . . . . . . . . . . . . . . . . . . . . . . . .E-17
Figure E-5. Common Barriers to Pedestrians and Non-Motorized Access to Be Avoided or
Mitigated . . . . . . . . . . . . . . . . . . . . . . . . . . . . . . . . . . . . . . . . . . . . . . . . . . . . . . . . . . . . . . . . . . . . . . . . . . . .E-18
Figure E-6. Wheelchair Loading/Lift Requirements . . . . . . . . . . . . . . . . . . . . . . . . . . . . . . . . . . . . . . . . . .E-20
Figure E-7. Bicycle Accommodation . . . . . . . . . . . . . . . . . . . . . . . . . . . . . . . . . . . . . . . . . . . . . . . . . . . . . . .E-21
Figure E-8. Preferred Parking Stall Layout . . . . . . . . . . . . . . . . . . . . . . . . . . . . . . . . . . . . . . . . . . . . . . . . . .E-26
Figure E-9. Angled Versus 90-Degree Parking . . . . . . . . . . . . . . . . . . . . . . . . . . . . . . . . . . . . . . . . . . . . . . .E-27
Figure E-10. Examples of Stall Layout—Handicapped Parking . . . . . . . . . . . . . . . . . . . . . . . . . . . . . . . . . .E-29
Figure E-11. Bus Loading Area (Berth) Designs . . . . . . . . . . . . . . . . . . . . . . . . . . . . . . . . . . . . . . . . . . . . . .E-33
Figure E-12. Sawtooth Bus Bay Design . . . . . . . . . . . . . . . . . . . . . . . . . . . . . . . . . . . . . . . . . . . . . . . . . . . . .E-35
Figure E-13. Bus Loop Design . . . . . . . . . . . . . . . . . . . . . . . . . . . . . . . . . . . . . . . . . . . . . . . . . . . . . . . . . . . .E-36
Figure E-14. Bus Loop Application . . . . . . . . . . . . . . . . . . . . . . . . . . . . . . . . . . . . . . . . . . . . . . . . . . . . . . . .E-37
Figure E-15. Customer Service Booth . . . . . . . . . . . . . . . . . . . . . . . . . . . . . . . . . . . . . . . . . . . . . . . . . . . . . .E-44
Figure E-16. Mural on Shelter . . . . . . . . . . . . . . . . . . . . . . . . . . . . . . . . . . . . . . . . . . . . . . . . . . . . . . . . . . . .E-55
Figure E-17. Artwork on Canopy . . . . . . . . . . . . . . . . . . . . . . . . . . . . . . . . . . . . . . . . . . . . . . . . . . . . . . . . . .E-55
Figure E-18. Stylized Canopy . . . . . . . . . . . . . . . . . . . . . . . . . . . . . . . . . . . . . . . . . . . . . . . . . . . . . . . . . . . . .E-56
Frontmatter.indd 18 27/11/13 4:52 PM

xix
LIST OF TAbLES
CHAPTER 3 DESIGN PARAMETERS AND CONTROLS
Table 3-1. Standard Bus Design Characteristics . . . . . . . . . . . . . . . . . . . . . . . . . . . . . . . . . . . . . . . . . . . . . . .3-3
Table 3-2. Bus Performance Characteristics . . . . . . . . . . . . . . . . . . . . . . . . . . . . . . . . . . . . . . . . . . . . . . . . . .3-4
Table 3-3. Turning Radius for 12.2 m (40 ft.) Bus . . . . . . . . . . . . . . . . . . . . . . . . . . . . . . . . . . . . . . . . . . . . .3-7
Table 3-4. Minimum Travel Way Designs for 12.2-m (40-ft) Bus . . . . . . . . . . . . . . . . . . . . . . . . . . . . . . . . .3-7
Table 3-5. Summary of Vehicle Guidance Issues . . . . . . . . . . . . . . . . . . . . . . . . . . . . . . . . . . . . . . . . . . . . .3-13
Table 3-6. Selected Physical and Performance Characteristics for Streetcars and LRVs . . . . . . . . . . . . . .3-14
Table 3-7. Geometric and Right-of-Way Requirements for Light Rail Transit in Street or Center
Reservation. . . . . . . . . . . . . . . . . . . . . . . . . . . . . . . . . . . . . . . . . . . . . . . . . . . . . . . . . . . . . . . . . . . . . . . . . . .3-16
Table 3-8. Examples of Typical Design Speeds for Bus and HOV Facilities Along Freeways . . . . . . . . . . .3-19
Table 3-9. Stopping and Decision Sight Distances for Various Design Speeds . . . . . . . . . . . . . . . . . . . . .3-21
Table 3-10. Recommended Roadway Lane Widths for Transit on Tangent Section . . . . . . . . . . . . . . . . .3-21
Table 3-11. Quality of Service Framework . . . . . . . . . . . . . . . . . . . . . . . . . . . . . . . . . . . . . . . . . . . . . . . . . .3-23
Table 3-12. Fixed-Route Passenger Load Levels of Service (LOS) . . . . . . . . . . . . . . . . . . . . . . . . . . . . . . . .3-24
Table 3-13. Passenger Capacity Characteristics of Typical Transit Vehicles . . . . . . . . . . . . . . . . . . . . . . . .3-25
Table 3-14. Planning Level Bus Lane Service Volumes . . . . . . . . . . . . . . . . . . . . . . . . . . . . . . . . . . . . . . . .3-28
Table 3-15. Maximum Passenger Service Volumes for Planning Purposes . . . . . . . . . . . . . . . . . . . . . . . .3-28
Table 3-16. Estimated Maximum Capacity of On-Line Linear Bus Stops . . . . . . . . . . . . . . . . . . . . . . . . . .3-29
Table 3-17. Passenger Capacities per Train . . . . . . . . . . . . . . . . . . . . . . . . . . . . . . . . . . . . . . . . . . . . . . . . .3-31
CHAPTER 4 buS FACILITIES ON LIMITED ACCESS HIGHWAYS
Table 4-1. Types of Preferential Treatments for Buses on Limited Access Highways . . . . . . . . . . . . . . . . .4-3
Table 4-2. General Guidelines for Dedicated Lanes for Buses on Limited Access Highways . . . . . . . . . . .4-4
Table 4-3. General Guidelines for HOV Lanes on Limited Access Highways . . . . . . . . . . . . . . . . . . . . . . . .4-5
Table 4-4. OSHA Permissible Noise Exposures . . . . . . . . . . . . . . . . . . . . . . . . . . . . . . . . . . . . . . . . . . . . . .4-24
Table 4-5. Recommended Cross Section Dimensions . . . . . . . . . . . . . . . . . . . . . . . . . . . . . . . . . . . . . . . . .4-26
Table 4-6. Attributes of Platform Locations . . . . . . . . . . . . . . . . . . . . . . . . . . . . . . . . . . . . . . . . . . . . . . . . .4-27
Table 4-7. Advantages and Disadvantages of Platform Locations . . . . . . . . . . . . . . . . . . . . . . . . . . . . . . .4-28
Table 4-8. Enforcement Attributes Associated with Different Types of Bus/HOV Facilities . . . . . . . . . . .4-43
Frontmatter.indd 19 27/11/13 4:52 PM

xx
Table 4-9. Standard Edge Line and Lane Line Markings for Preferential Lanes . . . . . . . . . . . . . . . . . . . .4-50
Table 4-10. Width Required for Transit Lane Treatments . . . . . . . . . . . . . . . . . . . . . . . . . . . . . . . . . . . . . .4-51
Table 4-11. Width Required for Transit Stations . . . . . . . . . . . . . . . . . . . . . . . . . . . . . . . . . . . . . . . . . . . . .4-51
Table 4-12. Width Required for On-Line Stations . . . . . . . . . . . . . . . . . . . . . . . . . . . . . . . . . . . . . . . . . . . .4-51
CHAPTER 5 GuIDELINES FOR buS FACILITIES ON STREETS AND ROADWAYS
Table 5-1. Approximate Number of Berths Required—Five Percent Failure . . . . . . . . . . . . . . . . . . . . . . .5-13
Table 5-2. Comparative Analysis of Bus Stop Locations . . . . . . . . . . . . . . . . . . . . . . . . . . . . . . . . . . . . . . .5-15
Table 5-3. Sample Bus Bay Dimensions . . . . . . . . . . . . . . . . . . . . . . . . . . . . . . . . . . . . . . . . . . . . . . . . . . 5-24
Table 5-4. Advantages and Disadvantages of Various Bus Stop Treatments . . . . . . . . . . . . . . . . . . . . . . .5-26
Table 5-5. Levels of Service for Queuing Areas . . . . . . . . . . . . . . . . . . . . . . . . . . . . . . . . . . . . . . . . . . . . . .5-29
Table 5-6. Advantages and Disadvantages of Passenger Amenities at Bus Stop . . . . . . . . . . . . . . . . . . .5-30
Table 5-7. Recommended Corner Radii . . . . . . . . . . . . . . . . . . . . . . . . . . . . . . . . . . . . . . . . . . . . . . . . . . . .5-35
Table 5-8. Minimum Corner Radii to Avoid Encroachment on Opposing Traffic . . . . . . . . . . . . . . . . . . . .5-35
Table 5-9. Applications and Lane Width for Priority Lanes . . . . . . . . . . . . . . . . . . . . . . . . . . . . . . . . . . . . .5-49
Table 5-10. Intersection Design Issues for Bus Priority Lanes . . . . . . . . . . . . . . . . . . . . . . . . . . . . . . . . . .5-49
Table 5-11. Preferential Lane Longitudinal Markings . . . . . . . . . . . . . . . . . . . . . . . . . . . . . . . . . . . . . . . . .5-69
Table 5-12. Relative Effectiveness of Various Busway Separations . . . . . . . . . . . . . . . . . . . . . . . . . . . . . .5-74
Table 5-13. Transit Signal Priority Benefits. . . . . . . . . . . . . . . . . . . . . . . . . . . . . . . . . . . . . . . . . . . . . . . . . .5-84
CHAPTER 6 LIGHT RAIL AND STREETCAR FACILITIES ON STREETS AND HIGHWAYS
Table 6-1. LRT Alignment Classifications . . . . . . . . . . . . . . . . . . . . . . . . . . . . . . . . . . . . . . . . . . . . . . . . . . . .6-7
Table 6-2. Light Rail Transit Vehicles Design Parameters . . . . . . . . . . . . . . . . . . . . . . . . . . . . . . . . . . . . . .6-14
Table 6-3. Light Rail Alignment Options and Design Implications . . . . . . . . . . . . . . . . . . . . . . . . . . . . . . .6-20
CHAPTER 7 PEDESTRIAN AND bICYCLE ACCESS
Table 7-1. Methods to Improve the Walking Environment for Accessibility . . . . . . . . . . . . . . . . . . . . . . .7-2
Table 7-2. Methods to Improve the Walking Environment for Activity . . . . . . . . . . . . . . . . . . . . . . . . . . . .7-3
Table 7-3. Methods to Improve the Walking Environment with Amenities . . . . . . . . . . . . . . . . . . . . . . . .7-3
Table 7-4. Pedestrian Improvements Guide . . . . . . . . . . . . . . . . . . . . . . . . . . . . . . . . . . . . . . . . . . . . . . . . .7-4
Table 7-5. Passenger Amenities Advantages and Disadvantages . . . . . . . . . . . . . . . . . . . . . . . . . . . . . . . .7-24
Frontmatter.indd 20 27/11/13 4:52 PM

xxi
APPENDICES
C buS VEHICLE CHARACTERISTICS ..................................................................... C-1
Table C-1. Design Vehicle Characteristics—U.S. Customary . . . . . . . . . . . . . . . . . . . . . . . . . . . . . . . . . . . . .C-3
Table C-2. Design Vehicle Characteristics—Metric . . . . . . . . . . . . . . . . . . . . . . . . . . . . . . . . . . . . . . . . . . . .C-4
Table C-3. Minimum Turning Radii of Design Vehicles for Low Floor Characteristics . . . . . . . . . . . . . . . .C-11
Table C-4. Bus Vehicle Dimensions for High- and Low-Floor Design Vehicles–Metric . . . . . . . . . . . . . . .C-11
Table C-5. Bus Vehicle Dimensions for High- and Low-Floor Design Vehicles—U.S. Customary . . . . . . .C-12
D buSWAYS ......................................................................................................... d-1
Table D-1. Design Speeds . . . . . . . . . . . . . . . . . . . . . . . . . . . . . . . . . . . . . . . . . . . . . . . . . . . . . . . . . . . . . . . D-6
Table D-2. Stopping Sight Distances . . . . . . . . . . . . . . . . . . . . . . . . . . . . . . . . . . . . . . . . . . . . . . . . . . . . . . . D-7
Table D-3. Recommended Minimum Horizontal Curves . . . . . . . . . . . . . . . . . . . . . . . . . . . . . . . . . . . . . . . D-7
Table D-4. Bus Clearances . . . . . . . . . . . . . . . . . . . . . . . . . . . . . . . . . . . . . . . . . . . . . . . . . . . . . . . . . . . . . D-15
Table D-5. Busway Geometric Criteria Summary . . . . . . . . . . . . . . . . . . . . . . . . . . . . . . . . . . . . . . . . . . . D-17
Table D-6. Fixed Objects Requiring Protection on Unguided Busways . . . . . . . . . . . . . . . . . . . . . . . . . . D-25
Table D-7. Clear Zone Widths for Unguided Busways . . . . . . . . . . . . . . . . . . . . . . . . . . . . . . . . . . . . . . . . D-26
Table D-8. Barrier Requirements for Embankments on Unguided Busways . . . . . . . . . . . . . . . . . . . . . . D-26
e Off-Line TrAnSiT fACiLiTieS ..........................................................................e-1
Table E-1. Walking Distance Under Normal Conditions . . . . . . . . . . . . . . . . . . . . . . . . . . . . . . . . . . . . . . .E-18
Table E-2. Accessible Space Standards . . . . . . . . . . . . . . . . . . . . . . . . . . . . . . . . . . . . . . . . . . . . . . . . . . . . .E-28
Table E-3. Suggested Planning and Design Guidelines for Park-and-Ride Facilities . . . . . . . . . . . . . . . . .E-30
Frontmatter.indd 21 27/11/13 4:52 PM

Frontmatter.indd 22 27/11/13 4:52 PM

1-1
In This Chapter:
1.1 Purpose and Scope
1.2 Audience
1.3 Organization of Guidelines
1.4 Using the Guide
1.5 References
Public transportation is important to communities in contemporary America. It provides high passenger capacities in heavily-traveled corridors, and allows high employment concentrations in city centers. It permits compact urban developments that are pedestrian friendly, and helps reinforce urban design objectives. It provides mobility for people that are unable to drive or do not have access to motor vehicles. From an environmental perspective, it has lower emissions and energy consumption on a per-capita basis than personal motor vehicles.
Transit vehicles operate in a wide range of environments—both on-street and off-street. Commuter rail and rapid transit operate in exclusive rights-of-way that are frequently grade-separated from intersecting roadways. However, bus routes on public streets and highways and light rail or streetcar operations may share or intersect with the street environment.
Streets and highways often must accommodate transit vehicles as well as motor vehicles, bi-cyclists, and pedestrians. Transit provisions are best accomplished when incorporated into all phases of street planning, design, and operation. This is essential especially where agencies at the state, county, and municipal level are required to plan, design, or modify streets and high-ways to accommodate public transportation vehicles and facilities.
Planning and design guidelines, standards, and practices have evolved over the past decade. These include reports prepared by the American Association of State Highway and Transportation Officials (AASHTO), Transportation Research Board (TRB), and Institute of Transportation Engineers (ITE), and those prepared by individual planning and transit agencies. Most, however, encompass a specific mode, such as bus stops, rapid transit, and light rail transit (LRT) and are sometimes prepared in response to specific agency needs. Even so, there are few comprehensive publications that an agency can use for designing streets and highways that accommodate transit services and facilities. Thus, agencies often must develop their own standards. The absence of
1 Introduction
c01.indd 1 27/11/13 4:53 PM

1-2 Guide for Geometric Design of Transit Facilities on Highways and Streets
a single reference guide makes it difficult to communicate basic design standards to consultants when contracting out work, especially if the consultant is in a different state than the client. The practitioners’ need for a single, comprehensive resource that documents and builds upon past and present experience is the basis for this resource.
1.1 PurPose and sCoPe
This guide provides a single, comprehensive reference of current practice in the geometric design of tran-sit facilities on streets and highways. The facilities covered include:
y Local buses, express buses, and bus rapid transit operating in mixed traffic, bus lanes, and high-occupancy vehicle (HOV) lanes, and bus-only roads within street and freeway environments; and
y Streetcars and LRT running in mixed traffic and transit lanes, and within medians along arterial roadways.
These guidelines are based on a review of relevant AASHTO, TRB, and ITE documents, and of design reports provided by various transit agencies. They incorporate findings from targeted investigations con-ducted specifically to fill voids in the assembled information.
1.2 audIenCe
This guide is written for use by public agencies, practitioners, and developers who need to know basic in-formation about planning, locating, sizing, designing, and implementing transit facilities along roadways. The target audience includes:
y Policy makers;
y Highway planners, engineers, designers;
y Traffic/transportation engineers;
y Transit service planners;
y Urban planners;
y Site planners and engineers; and
y Land developers.
The guide provides clear and uniform guidance for the placement and design of facilities and amenities. Transit and highway agencies can adapt these guidelines to meet their specific needs. Practitioners can apply transit provisions to meet specific needs in their plans.
1.3 organIzaTIon of guIdelInes
Chapter 2 contains planning and decision-making guidelines associated with most transit facilities being developed.
c01.indd 2 27/11/13 4:53 PM

Chapter 1—Introduction 1-3
Chapter 3 presents bus design parameters and controls. It describes vehicle types and characteristics; geometric design controls; highway and transit capacity considerations and guidelines; and general transit infrastructure considerations.
Chapter 4 addresses bus transit facilities found in controlled-access highway settings (freeways).
Chapter 5 describes bus transit facilities along streets.
Chapter 6 contains guidelines for light rail and streetcar transit operations on streets and roadways.
Chapter 7 contains guidelines for pedestrian and bicycle access.
The appendices contain supporting information, such as information on detailed bus dimensions and turning paths, busways, off-line stations and facilities, and pedestrian and bicycle access. References are provided at the end of each chapter. A complete listing of references is found in the appendices along with a transit facility glossary.
1.4 usIng The guIde
Information about each type of facility or treatment is presented in one place to make the guide as user-friendly as possible. Each specific facility presentation provides general planning and design guidance, identifies implementation and operational issues, and provides case studies and examples. The appendices contain additional technical information for selected topics.
The report presents desirable guidelines, but in restrictive situations, minimum guidelines have been used successfully and may be necessary.
1.5 referenCes
1. American Association of State Highway and Transportation Officials. A Policy on Geometric Design of Highways and Streets (The Green Book). Washington, DC, 2011.
2. Fellows, R., et al. Geometric Design for Transit Facilities on Highways and Streets. NCHRP Project 20-7, Task 31. Parsons Brinkerhoff Quade & Douglas, Houston, 2002.
3. Transit Cooperative Research Program. TCRP Report 17: Integration of Light Rail Transit into City Streets. Transportation Research Board, National Research Council, Washington, DC, 1996.
4. Transit Cooperative Research Program. TCRP Report 100: Transit Capacity and Quality of Service Manual, Part 7. Transportation Research Board, National Research Council, Ch. 4, pp. 7–45, Washington, DC, 2003.
c01.indd 3 27/11/13 4:53 PM

c01.indd 4 27/11/13 4:53 PM

2-1
In This Chapter:
2.1 Regional and Corridor Planning Processes
2.2 Integrating Transit Projects into Roadway Planning Process
2.3 Summary
2.4 References
Transit facilities in public rights-of-way present a challenge for planning and decision-making. They must meet the functional requirements of the transit agency and its customers, but they are placed in a street or highway environment owned and regulated by a different agency with its own standards and a broader set of users and constituents. Roadway and transit agency staff must make decisions cooperatively to meet the functional requirements of transit while reflect-ing other requirements of the public right-of-way.
Decision-making occurs at all stages of transportation facility development. In most organiza-tions, decisions can be grouped into two types:
y Planning and programming decisions, which define what projects to include in the design and construction program and what functional characteristics these projects should include (discussed in this chapter); and
y Project decisions, which are made during the design and implementation process that estab-lish the physical design of a project (discussed in subsequent chapters).
This chapter provides information about the planning and programming (decision-making) pro-cess that may be necessary to determine functional requirements of projects and to obtain fund-ing or project approval. This chapter contains the following sections:
y Section 2.1 provides a brief introduction to federal planning requirements, system planning, and corridor planning processes.
y Section 2.2 discusses how roadway and transit planning and programming processes may be integrated to better achieve cooperative decision-making between transit and roadway agencies.
y Section 2.3 is a summary of key points of the chapter.
2 Planning and Decision-Making
c02.indd 1 27/11/13 8:58 PM

2-2 Guide for Geometric Design of Transit Facilities on Highways and Streets
For designers, this chapter provides background on the continuing, cooperative, and comprehensive plan-ning processes that result in the approval of projects for design, and useful information about the context within which decisions about transit facilities on highways and streets are made.
2.1 RegIonal and CoRRIdoR PlannIng PRoCesses
2.1.1 Federal Planning and decision-Making Requirements
Responsibility for Planning and decision-Making
Transportation planning and decision-making is conducted by several governmental levels (4).
y The U.S. Department of Transportation (U.S. DOT) oversees the transportation planning processes required for each state. The statewide planning process establishes a framework for making transpor-tation investment decisions throughout the state and is administered jointly by two U.S. DOT agencies: the Federal Highway Administration (FHWA) and the Federal Transit Administration (FTA). The federal government also supplies funding needed for transportation planning and project develop-ment. The U.S. DOT is managed along modal lines. For any specific transit project, either FHWA or FTA will usually act as lead agency if federal funding is anticipated. FHWA usually is the lead for highway and HOV projects and can also fund park-and-ride lots, especially if they will be built in freeway rights of way. FTA is usually the lead for high-capacity transit projects and transit facilities that are not in highway rights-of-way. Each agency has its own rules and procedures. It is important to involve the federal lead agency early in the development of a major project that is expected to involve federal funds.
y State departments of transportation (state DOTs) develop transportation plans and projects consistent with the transportation goals for the state. To accomplish this, the state DOT works with all the state’s transportation organizations and local governments. The state DOT is responsible for planning safe and efficient transportation between cities and towns in the state.
y Metropolitan Planning Organizations (MPO) represent areas with a population of 50,000 people or more. The mission of an MPO is to provide short- and long-term solutions to transportation and transportation-related concerns. Transportation policy for each metropolitan area is set by a policy board, which is comprised of locally elected officials and representatives of local agencies respon-sible for implementation of transportation projects. Often the MPO establishes a technical advisory committee (TAC) comprised of professional staff and technical experts from local transportation and planning agencies. The TAC typically meets regularly to review projects and programs and to make recommendations to be considered by the policy board. Other groups, such as non-profit organiza-tions, community organizations, or environmental organizations, can also influence the direction an MPO follows through a public involvement process.
y Local governments carry out many transportation planning and programming functions, such as scheduling improvements and maintenance for local streets and roads.
y Transit agencies are public and private organizations that provide transportation for the public. Public transportation includes buses, heavy rail, light rail, commuter rail, monorail, passenger ferryboats, trolleys, inclined railways, and people movers.
c02.indd 2 27/11/13 8:58 PM

Chapter 2—Planning and Decision-Making 2-3
Federal rules located at 23 Code of Federal Regulations (CFR) 450 and 500 and 49 CFR 613 outline the requirements for state DOTs, MPOs and public transportation operators to conduct a continuing, comprehensive, and coordinated transportation planning and programming process in each state and in metropolitan areas.
statewide Planning
Federal regulations rely on the statewide transportation planning process as the primary mechanism for cooperative transportation decision-making throughout each state. The federal regulation stipulates that each state DOT has responsibility for implementing a statewide multimodal transportation planning pro-cess that will promote consistency between transportation improvements and state and local planned growth and economic development patterns. Statewide planning must be coordinated with metropolitan planning, with statewide trade and economic development planning activities, and with related multi-state planning efforts. State DOTs are also responsible for considering and implementing projects, strate-gies, and services that support the economic vitality of non-metropolitan (rural) areas (3).
Statewide, Long-Range Transportation Plan
Each state is responsible for developing a 20-year statewide, long-range transportation plan in consulta-tion with MPOs and local and regional transportation agencies. The statewide long-range plan should describe a multimodal transportation system of roadways, public transit services, and bicycle/pedestrian facilities. The long-range plan addresses the following objectives:
y Support the economic vitality of the state.
y Increase the safety of the transportation system.
y Improve security for users of the transportation system.
y Increase the accessibility and mobility for people and freight.
y Protect and enhance the environment, promote energy conservation, and improve quality of life.
y Enhance the integration and connectivity of all modes of the transportation system.
y Promote efficient transportation system management and operation.
y Preserve the existing transportation system.
y Promote consistency between transportation improvements and planned growth and economic development.
The plan should address estimated transportation, socioeconomic, environmental, and financial impacts of the future transportation system. The statewide plan should include capital, operations and manage-ment strategies, investments, procedures, and other measures to ensure the preservation and most effi-cient use of the existing transportation system.
State Transportation Improvement Program
The statewide transportation planning process also requires preparation of a State Transportation Improvement Program (STIP). The STIP includes an annual list of projects programmed for funding from available federal funds and other revenue sources. It comprises projects from the statewide transportation
c02.indd 3 27/11/13 8:58 PM

2-4 Guide for Geometric Design of Transit Facilities on Highways and Streets
plans and programs as well as transportation improvement projects recommended by the MPOs and pub-lic transportation providers in the state. Federal policy emphasizes fiscal constraint and public involve-ment in the development of the STIP.
The STIP covers a four-year period and must be updated every four years (more frequently if the governor of the state requires more frequent updates) (4).
Metropolitan Transportation Planning
As noted, an MPO is a transportation policy-making organization comprised of representatives from local government and transportation authorities. An MPO is designated for any urbanized area with a popu-lation greater than 50,000. An MPO must ensure that existing and future expenditures for transporta-tion projects and programs are based on a continuing, cooperative, and comprehensive planning process. Federal funding for transportation projects and programs are channeled through the planning process (3).
Role of the MPO
In accordance with federal regulations, the MPO must conduct metropolitan transportation planning in cooperation with the state and with operators of publicly owned transit services. In air quality nonattain-ment or maintenance areas, the MPO is also responsible for coordinating transportation and air quality planning.
Transportation planning must be cooperative, because no single agency has responsibility for the con-struction, operation, or maintenance of the entire transportation system. For example, some roads that are part of the Interstate Highway System are subject to certain standards and are usually maintained by a state DOT. Others are county arterials or city streets designed, operated, and maintained by counties or local municipalities. Transit systems often are built, operated, and maintained by a separate entity. The MPO is responsible for seeking the participation of relevant agencies and stakeholders in the planning process. Most MPOs are not the actual implementing agencies for projects, but they must provide an over-all coordination role in planning and programming funds for projects and operations (8).
Metropolitan Planning Process
Transportation planning in metropolitan areas is a collaborative process, led by the MPO with participa-tion from other key stakeholders in the regional transportation system. Transportation planning activities include visioning, forecasting population/employment, identifying major growth corridors, projecting future land use, assessing needs, developing capital and operating strategies to move people and goods, and developing a financial plan. The required planning processes are designed to foster involvement by interested parties, such as the business community, community groups, environmental organizations, and the general public, through a proactive public participation process.
There are three key documents produced by the metropolitan planning process:
y The Unified Planning Work Program (UPWP) lists the transportation studies and tasks to be per-formed by MPO staff or a member agency. Because the UPWP reflects local priorities, its content differs from one metropolitan area to another. The UPWP contains several elements:
– The planning tasks and studies that will be conducted over a one- to two-year period;
– Federally funded studies as well as all relevant state and local planning activities conducted with-out federal funds;
c02.indd 4 27/11/13 8:58 PM

Chapter 2—Planning and Decision-Making 2-5
– Funding sources identified for each project;
– A schedule of activities; and
– The agency responsible for each task or study.
y The long-range transportation plan, often referred to as the Metropolitan Transportation Plan (MTP), defines the methods the region will use to invest in the transportation system. The plan must “include both long-range and short-range program strategies/actions that lead to the development of an inte-grated intermodal transportation system that facilitates the efficient movement of people and goods” (23 CFR 450C, Sec.450.322).
The MPO is responsible for developing the long-range transportation plan in cooperation with the state DOT and with public transportation coordinators and operators in the area. The metropolitan plan-ning area should include at least the urbanized area and the contiguous geographic areas expected to become urbanized within the 20-year forecast period covered by the long-range transportation plan. The MTP must be updated at least every five years (every four years in air quality non-attainment or maintenance areas).
As required by federal regulation, the MTP should include a discussion of potential environmen-tal mitigation activities. A financial plan is required with resources identified from both private and public resources. The MPO, transit operators, and the state DOT must work cooperatively to develop estimates of funds to support implementation of the MTP. Operations and management strategies are required that improve the performance of existing facilities while relieving vehicle congestion and improving safety.
y The Transportation Improvement Program (TIP) is a financially constrained, four-year program cov-ering the most immediate implementation priorities for transportation projects and strategies from the MTP. It is the region’s method of allocating its limited transportation resources among the various capital and operating needs of the area, based on a clear set of short-term transportation priorities. Federal requirements for the TIP include the following:
– Covers a minimum four-year period of investment;
– Is updated at least every four years;
– Is realistic in terms of available funding (known as a fiscally constrained TIP) and is not just a “wish list” of projects; and
– Is incorporated into the STIP.
If the region is a non-attainment or maintenance area, the TIP must also conform to the State Implementation Plan (SIP) for air quality (see further discussion below).
other Federal Planning Requirements
Transportation project designers often must provide information to meet federal requirements such as the National Environmental Policy Act (NEPA) or to qualify for federal funding under the FTA New Starts pro-gram. This section provides introductory level information about these processes. The most up-to-date infor-mation and guidance for these programs can be found at http://www.fta.dot.gov or http://www.fhwa.dot.gov.
c02.indd 5 27/11/13 8:58 PM

2-6 Guide for Geometric Design of Transit Facilities on Highways and Streets
National Environmental Policy Act (NEPA) (2, 9)
NEPA was approved in 1969, establishing requirements and procedures that affect any federal action, in-cluding development of major projects eligible for federal funding. NEPA requires that the environmental impacts of projects be disclosed and considered when project selection decisions are made. NEPA docu-ments often are structured as decision-making tools, but their purpose is to provide decision-makers with the impacts and consequences of different alternatives in a systematic manner to enable them to make better-informed decisions.
For large projects that are controversial or may have significant environmental impacts, NEPA may re-quire an Environmental Impact Statement (EIS), whereas for smaller or less controversial projects, a lower level of documentation may be needed. The federal lead agency, in cooperation with the sponsor-ing agency, decides the level of documentation required. If an EIS is required, multiple alternatives are developed and evaluated against a baseline alternative, usually a 20-year projection of future conditions if only projects with secured funding are completed (“No Action”), but it may include all projects in an adopted regional plan (such as the MTP). If an EIS is not required, a single alternative may be assessed, and documentation requirements are reduced.
A precise project footprint must be established to assess the impacts of a preferred alternative, so the NEPA analysis usually is conducted in tandem with preliminary engineering. A challenge to project managers is to limit the level of detail for EIS alternatives that will not be chosen to minimize unneces-sary design work. This is difficult when all options remain under serious consideration throughout the preparation of the EIS.
For transportation projects, NEPA requires that a broad range of impacts to the natural and human envi-ronments and the transportation system itself be assessed. NEPA establishes a hierarchy of responses to project impacts: they should be avoided where possible or minimized, and unavoidable impacts should be documented and mitigated to the extent reasonable. For information on environmental procedures, see the FHWA Environmental Guidebook at http://www.environment.fhwa.dot.gov/guidebook/index.asp.
Air Quality Conformity
The designation of a metropolitan area as an air quality nonattainment or maintenance area creates ad-ditional requirements for transportation planning. Most importantly, transportation plans, programs, and projects must conform to the state’s air quality plan, known as the State Implementation Plan (SIP).
Transportation conformity assures that transportation funds will be spent on projects that are consistent with air quality goals in areas that do not meet, or previously have not met, air quality standards for ozone, carbon monoxide, particulate matter, or nitrogen dioxide. Each state’s environmental protection agency must prepare a SIP that sets an emissions “budget” (or limit) for each pollutant, and for mobile, stationary, and area-wide sources.
It is advantageous for regional and local transportation agencies to work as closely as possible with the state’s environmental protection agency. Regions must project the emissions that will result from transportation projects in the TIP and certify that projected emissions levels are consistent with the SIP. Conformity may need to be certified at the project level in areas that do not meet, or previously have not met, standards for carbon monoxide or particulates. In those cases, “hot spot” analyses are required as part of the NEPA documentation process.
c02.indd 6 27/11/13 8:58 PM
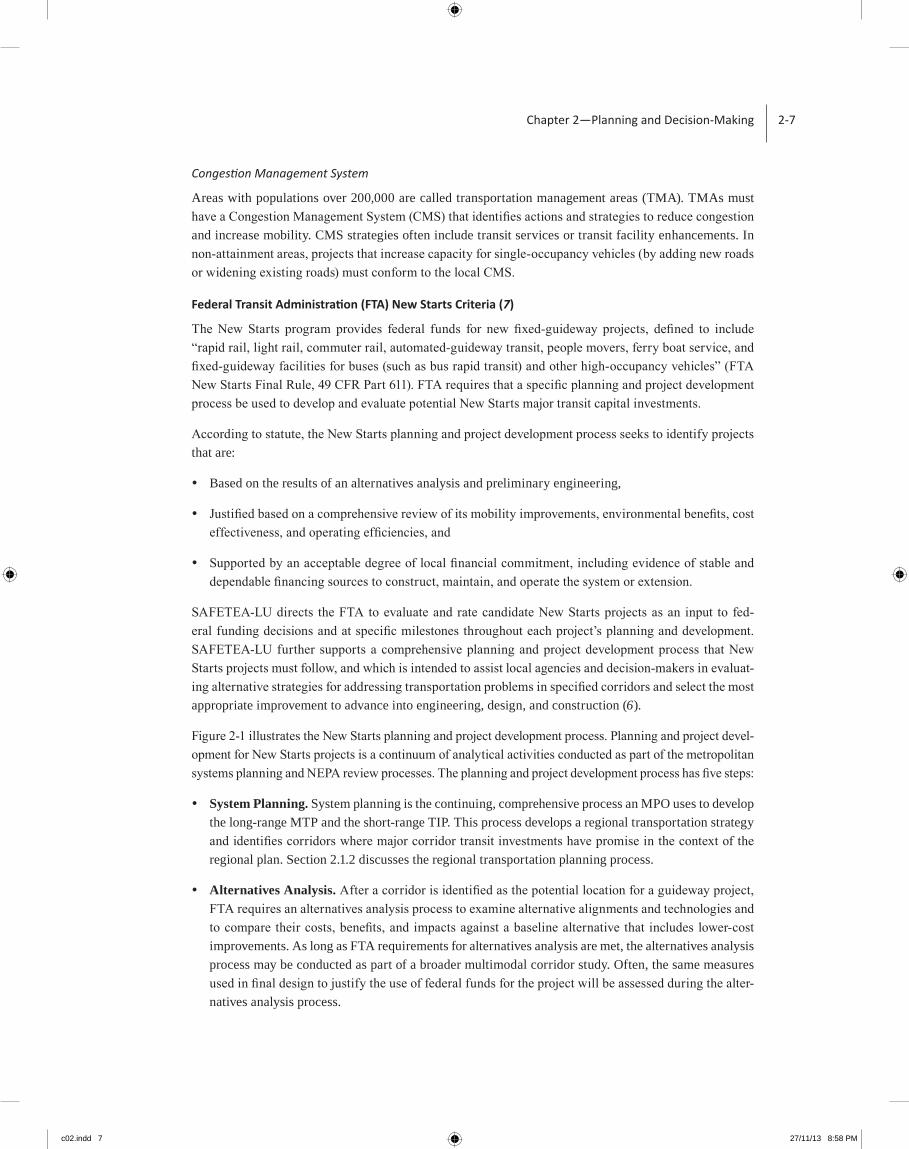
Chapter 2—Planning and Decision-Making 2-7
Congestion Management System
Areas with populations over 200,000 are called transportation management areas (TMA). TMAs must have a Congestion Management System (CMS) that identifies actions and strategies to reduce congestion and increase mobility. CMS strategies often include transit services or transit facility enhancements. In non-attainment areas, projects that increase capacity for single-occupancy vehicles (by adding new roads or widening existing roads) must conform to the local CMS.
Federal Transit Administration (FTA) New Starts Criteria (7)
The New Starts program provides federal funds for new fixed-guideway projects, defined to include “rapid rail, light rail, commuter rail, automated-guideway transit, people movers, ferry boat service, and fixed-guideway facilities for buses (such as bus rapid transit) and other high-occupancy vehicles” (FTA New Starts Final Rule, 49 CFR Part 611). FTA requires that a specific planning and project development process be used to develop and evaluate potential New Starts major transit capital investments.
According to statute, the New Starts planning and project development process seeks to identify projects that are:
y Based on the results of an alternatives analysis and preliminary engineering,
y Justified based on a comprehensive review of its mobility improvements, environmental benefits, cost effectiveness, and operating efficiencies, and
y Supported by an acceptable degree of local financial commitment, including evidence of stable and dependable financing sources to construct, maintain, and operate the system or extension.
SAFETEA-LU directs the FTA to evaluate and rate candidate New Starts projects as an input to fed-eral funding decisions and at specific milestones throughout each project’s planning and development. SAFETEA-LU further supports a comprehensive planning and project development process that New Starts projects must follow, and which is intended to assist local agencies and decision-makers in evaluat-ing alternative strategies for addressing transportation problems in specified corridors and select the most appropriate improvement to advance into engineering, design, and construction (6).
Figure 2-1 illustrates the New Starts planning and project development process. Planning and project devel-opment for New Starts projects is a continuum of analytical activities conducted as part of the metropolitan systems planning and NEPA review processes. The planning and project development process has five steps:
y System Planning. System planning is the continuing, comprehensive process an MPO uses to develop the long-range MTP and the short-range TIP. This process develops a regional transportation strategy and identifies corridors where major corridor transit investments have promise in the context of the regional plan. Section 2.1.2 discusses the regional transportation planning process.
y Alternatives Analysis. After a corridor is identified as the potential location for a guideway project, FTA requires an alternatives analysis process to examine alternative alignments and technologies and to compare their costs, benefits, and impacts against a baseline alternative that includes lower-cost improvements. As long as FTA requirements for alternatives analysis are met, the alternatives analysis process may be conducted as part of a broader multimodal corridor study. Often, the same measures used in final design to justify the use of federal funds for the project will be assessed during the alter-natives analysis process.
c02.indd 7 27/11/13 8:58 PM
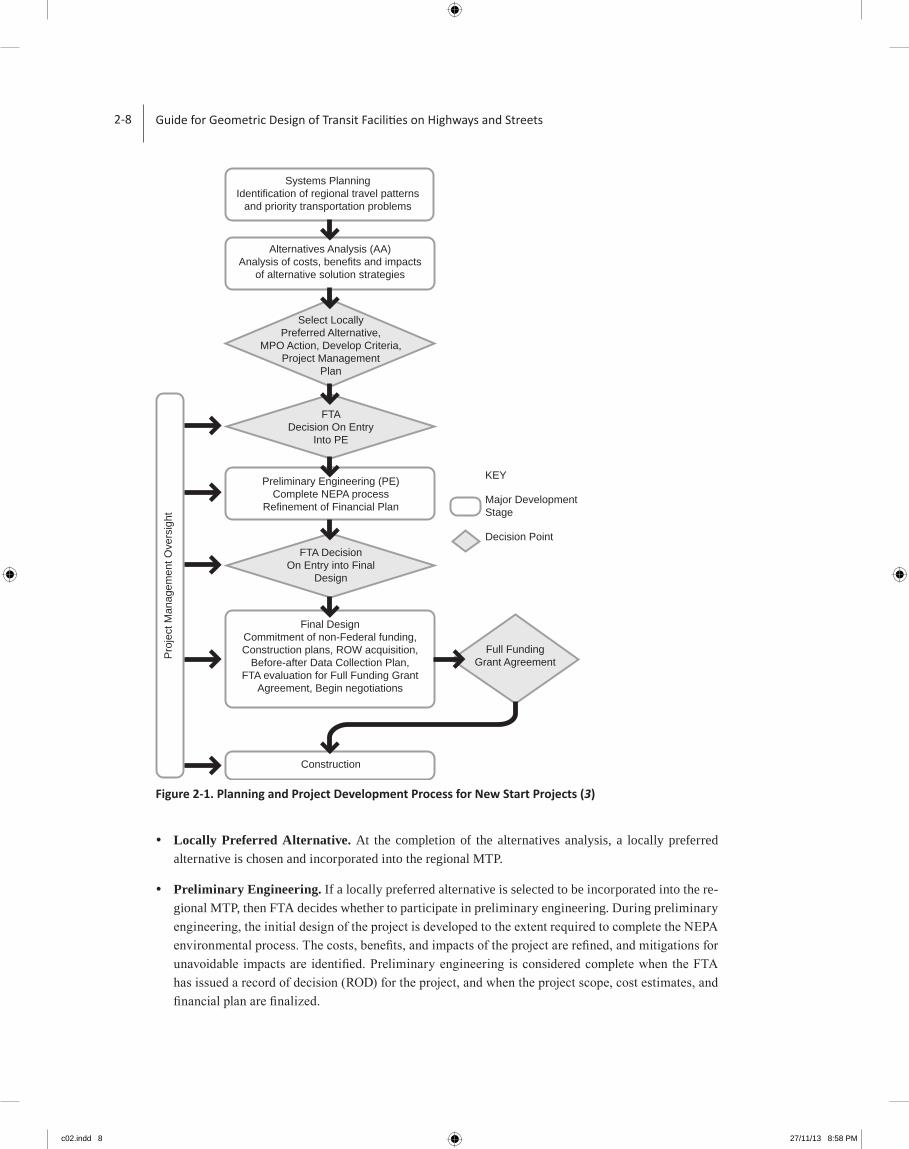
2-8 Guide for Geometric Design of Transit Facilities on Highways and Streets
y Locally Preferred Alternative. At the completion of the alternatives analysis, a locally preferred alternative is chosen and incorporated into the regional MTP.
y Preliminary Engineering. If a locally preferred alternative is selected to be incorporated into the re-gional MTP, then FTA decides whether to participate in preliminary engineering. During preliminary engineering, the initial design of the project is developed to the extent required to complete the NEPA environmental process. The costs, benefits, and impacts of the project are refined, and mitigations for unavoidable impacts are identified. Preliminary engineering is considered complete when the FTA has issued a record of decision (ROD) for the project, and when the project scope, cost estimates, and financial plan are finalized.
Systems Planning
Identification of regional travel patterns
and priority transportation problems
Alternatives Analysis (AA)
Analysis of costs, benefits and impacts
of alternative solution strategies
Preliminary Engineering (PE)
Complete NEPA process
Refinement of Financial Plan
FTA Decision
On Entry into Final
Design
Construction
Proje
ct M
anagem
ent O
versig
ht
Full Funding
Grant Agreement
KEY
Major Development
Stage
Decision Point
Final Design
Commitment of non-Federal funding,
Construction plans, ROW acquisition,
Before-after Data Collection Plan,
FTA evaluation for Full Funding Grant
Agreement, Begin negotiations
Select Locally
Preferred Alternative,
MPO Action, Develop Criteria,
Project Management
Plan
FTA
Decision On Entry
Into PE
Figure 2-1. Planning and Project Development Process for New Start Projects (3)
c02.indd 8 27/11/13 8:58 PM

Chapter 2—Planning and Decision-Making 2-9
y Final Design. When preliminary engineering is completed, FTA decides whether to participate in the final design. During the final design stage, the sponsoring agency can begin acquiring rights-of-way and relocating utilities as final construction plans, specifications, estimates, and bid documents are prepared. This is the point at which FTA and the project sponsor begin negotiations on the terms of a full-funding grant agreement (FFGA). Before an FFGA can be signed, the project sponsor must finalize the financial plan, refine the performance measures that were first reported during alternatives analysis, and prepare a plan to conduct a before-and-after study.
FTA published a Final Rule on Major Capital Investment Projects in 2000 that outlines the New Starts re-quirements. FTA has also issued guidance that provides additional detail on the project development and evaluation processes for fixed-guideway transit projects seeking New Starts funding. FTA will publish a new Rule for Major Capital Investment Projects in 2007 in response to changes specified in SAFETEA-LU to the methods, criteria, and procedures used to evaluate and rate projects proposed for funding under both the New Starts and Small Starts programs. SAFETEA-LU requires this guidance be updated at least every two years (9). For current FTA requirements for New Starts, see http://www.fta.dot.gov.
2.1.2 Regional Multimodal Transportation Planning and Decision-Making
In some regions, the MPO is responsible for all long-range transportation planning, and implementing agencies create short-range implementation plans. In other regions, the MPO is the regional coordina-tor, leaving project-level planning and development to implementing agencies. The intent of the federal planning process is to develop a comprehensive multimodal plan, but it is difficult to consider the system needs for all modes simultaneously. Often the planning for individual modes or subsystems is performed first by implementing agencies then combined into a regional plan by the MPO.
system Planning
System planning can help to ensure that the individual transportation projects will work together as planned when complete. They can help to identify priorities within improvements of a similar type. Not every tran-sit agency prepares long-range system plans, but a long-range plan can help ensure that capital facilities for other modes will be built to meet the operational needs of the planned transit service. For example, a system plan for transit use of HOV lanes can ensure that future transit service will be able to gain access to HOV lanes safely, and HOV access facilities can then be built into highway projects at locations where they will be most useful for transit. Park-and-ride studies can systematically examine park-and-ride demand and capacity needs, and resolve policy issues about where park-and-ride lots are most desirable and effective.
Figure 2-2 illustrates the transportation systems planning process for MPOs. The process involves coordi-nation by all participants to create a plan that all agencies and stakeholders can support. Note that land use policies and preferences drive the transportation planning process, since transportation systems should be designed to meet land use objectives.
Historically, The MPO acts as a coordinator to develop transportation policies and strategies that local governments, implementing agencies and stakeholders can support. The MPO combines projects pro-posed by others into alternative packages that represent a mix of policies, strategies, modal balance, spending levels, or other variables. The alternatives are evaluated, and a preferred transportation plan is selected. The regional planning process identifies corridors that require further study (see the following discussion of multimodal corridor planning). When those studies are completed, the results are incorpo-rated into the MTP.
c02.indd 9 27/11/13 8:58 PM

2-10 Guide for Geometric Design of Transit Facilities on Highways and Streets
The MTP, when adopted, becomes the region’s formal transportation plan, and all projects using federal funds must be consistent with its findings. The MTP describes the region’s preferred strategy to preserve transportation facilities and provide for mobility of people and goods in the context of other regional policies and priorities. It addresses the magnitude of transportation needs, the desired balance between roads and transit and between highways and arterials, specific projects and programs that comprise the preferred strategy, and the corridors that require further analysis to develop specific solutions.
Multimodal Corridor Planning
The object of multimodal corridor studies is to identify the best combination of actions that address the variety of travel needs present in the corridor. When the best solution is to a major corridor transportation
Figure 2-2. Transportation System Planning Process
c02.indd 10 27/11/13 8:58 PM
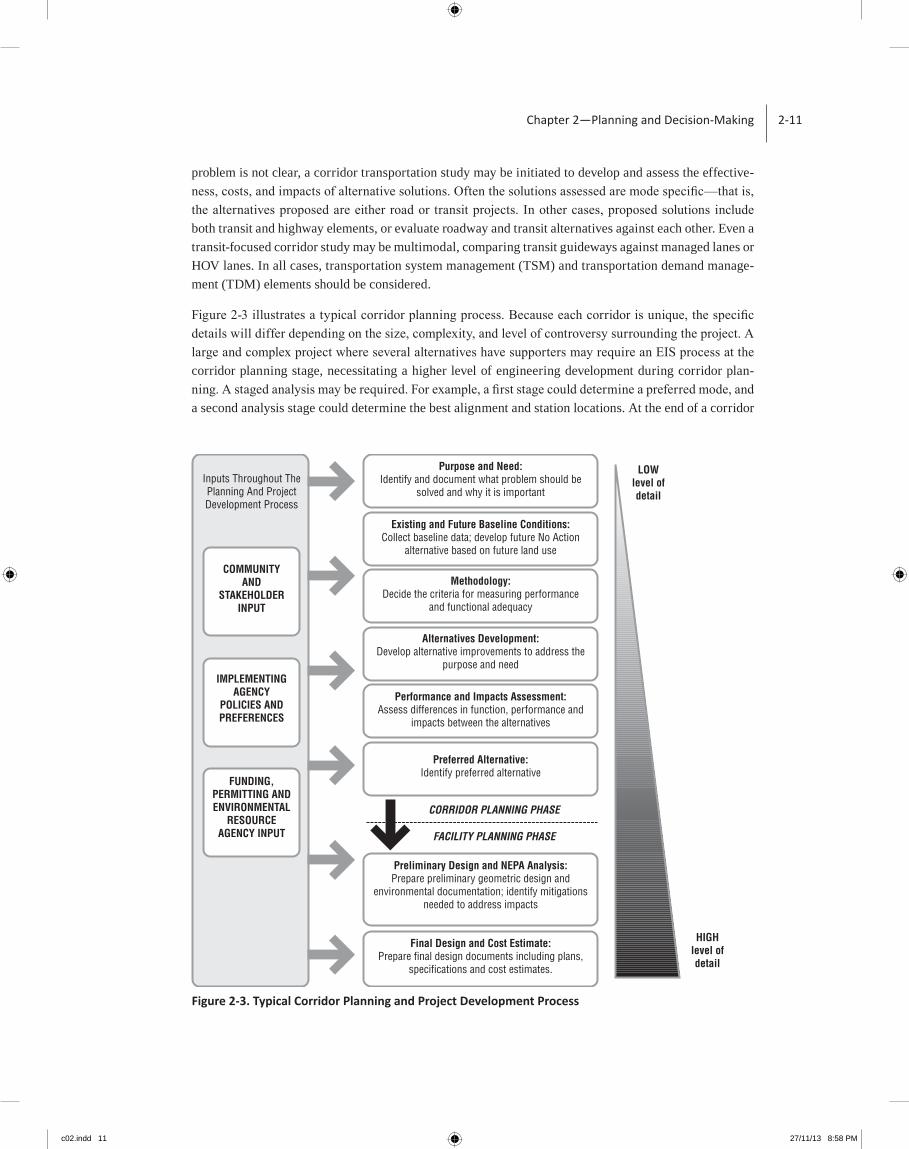
Chapter 2—Planning and Decision-Making 2-11
problem is not clear, a corridor transportation study may be initiated to develop and assess the effective-ness, costs, and impacts of alternative solutions. Often the solutions assessed are mode specific—that is, the alternatives proposed are either road or transit projects. In other cases, proposed solutions include both transit and highway elements, or evaluate roadway and transit alternatives against each other. Even a transit-focused corridor study may be multimodal, comparing transit guideways against managed lanes or HOV lanes. In all cases, transportation system management (TSM) and transportation demand manage-ment (TDM) elements should be considered.
Figure 2-3 illustrates a typical corridor planning process. Because each corridor is unique, the specific details will differ depending on the size, complexity, and level of controversy surrounding the project. A large and complex project where several alternatives have supporters may require an EIS process at the corridor planning stage, necessitating a higher level of engineering development during corridor plan-ning. A staged analysis may be required. For example, a first stage could determine a preferred mode, and a second analysis stage could determine the best alignment and station locations. At the end of a corridor
Purpose and Need:Identify and document what problem should be
solved and why it is important
COMMUNITYAND
STAKEHOLDERINPUT
LOWlevel ofdetail
HIGHlevel ofdetail
Inputs Throughout The Planning And Project Development Process
IMPLEMENTING AGENCY
POLICIES AND PREFERENCES
FUNDING, PERMITTING AND ENVIRONMENTAL
RESOURCE AGENCY INPUT
Existing and Future Baseline Conditions:Collect baseline data; develop future No Action
alternative based on future land use
Methodology:Decide the criteria for measuring performance
and functional adequacy
Alternatives Development:Develop alternative improvements to address the
purpose and need
Performance and Impacts Assessment:Assess differences in function, performance and
impacts between the alternatives
Preferred Alternative:Identify preferred alternative
Preliminary Design and NEPA Analysis:Prepare preliminary geometric design and
environmental documentation; identify mitigations needed to address impacts
Final Design and Cost Estimate:Prepare final design documents including plans,
specifications and cost estimates.
CORRIDOR PLANNING PHASE
FACILITY PLANNING PHASE
Figure 2-3. Typical Corridor Planning and Project development Process
c02.indd 11 27/11/13 8:58 PM

2-12 Guide for Geometric Design of Transit Facilities on Highways and Streets
study, a single project may emerge as the preferred alternative, or several projects may be initiated by dif-ferent agencies. No two corridor studies are exactly the same.
Multimodal corridor studies require the participation of all potentially affected implementing agencies and the MPO, at both the project management and decision-making levels. If the corridor study is part of an EIS process, then environmental resource agencies must also be engaged. At the initial stage of the study, the lead agency should develop a clear statement of purpose and need for the project, describing the problems in the corridor that the study will address, and the reason it is important to address them. The purpose and need statement provides a basis for defining the range of options that the study will address, the agencies and stakeholders that may be affected, and a plan for involving them in the project. These elements define the framework of the study, and the process and ground rules others will rely on to interact with the study effort.
The magnitude, complexity, and visibility of the study should influence the project management structure and the outreach effort. For most corridor projects, a steering committee is formed representing key af-fected agencies charged with making major decisions and resolving disputes that cannot be resolved at a staff level. A steering committee may include elected officials or senior agency managers, depending on the visibility of the project and the level of controversy surrounding the project. Most projects also form a TAC to oversee and evaluate the technical work performed.
There is no single approach to involving the public and key stakeholders that is best for every situation, and most public outreach programs employ a variety of techniques. Common techniques include forming a standing community advisory committee, attending meetings of existing community organizations, conducting public meetings, conducting public opinion research and focus groups, soliciting feedback through a web site, and interviewing opinion leaders.
As Figure 2-3 shows, corridor studies generally include the following steps:
y Purpose and Need. At the outset of a corridor study, it is important to clearly identify the problem the study is to address and the reason the study is being conducted. The statement of purpose and need should provide a grounding point that governs the scope of the project, the methodology, the decision-making process, and the involvement of other agencies.
y Existing and Future Baseline Conditions. Relevant data are collected to describe the conditions in the corridor, including information on transportation use, performance, and environmental factors likely to be assessed. Problems and needs should be identified. This step often involves calibrating and refining the regional transportation travel demand model to increase the level of detail within the study area, and to assemble geographic information systems data that will be used. The model is used to prepare a No Action forecast of future conditions, assuming that only funded projects will be com-pleted by the forecast horizon year. For most projects, the No Action alternative should be the baseline against which other proposed corridor investments will be compared. However, for FTA-sponsored al-ternatives analysis, the baseline alternative should include low-cost TSM enhancements to maximize transit use without a major corridor capital investment.
y Methodology. The methodology that will be used to measure performance and functional adequacy should be defined before analyzing alternatives. The methodology should define the criteria for evalu-ation and identify the key performance measures.
y Alternatives Development. Alternatives are defined to a level of detail sufficient to allow corridor options to be compared to one another. For corridor studies, design details rarely influence decisions
c02.indd 12 27/11/13 8:58 PM

Chapter 2—Planning and Decision-Making 2-13
at this point. More important are the modal elements, the number of lanes, the access points, special transit facilities, transit or HOV priority treatments, transit operating characteristics, alignment, sta-tion location and spacing, and other factors that will influence the relative performance, cost, and ac-cessibility for each travel mode at the corridor scale.
y Performance and Impacts Assessment. Using a travel demand model and other tools, a value is developed for each performance measure developed during the methodology step, and other materials are prepared that describe the impacts and effect of each proposed alternative. If the corridor study is part of an EIS process, then a greater level of design detail is needed to develop precise estimates of the impacts of each alternative. Costs, usage, and benefits of each option should be indicated.
y Preferred Alternative. After all alternatives have been measured and evaluated against the baseline and to each other, a preferred alternative may be chosen, or a smaller set of alternatives may be carried into a more detailed EIS process.
Different alternatives have substantially different functions. Transit will generally not have the same ef-fect at reducing delay as roadway expansion, given the amount of unmet demand for driving that is present in most congested urban areas. However, transit can have a significant effect on throughput in corridors that are congested or constrained, and transit is a prerequisite for high-density activity centers, such as major central business districts (CBDs), where space for traffic circulation and parking is constrained and parking costs are high. Transit alternatives may also be functionally different. A rail transit or bus rapid transit (BRT) line may allow local bus routes to be restructured and more destinations to be reached from each location along the line, as compared with express buses that provide fast service between two points. These differences are not always captured by composite measures of effectiveness, but they may be im-portant in assessing the differences and making decisions among alternatives.
Measures of effectiveness should be elements relevant to both roadway and transit users. In addition, the dif-ferences in function among alternatives should clarify the roles that roadway and transit elements play in each alternative, and how benefits and impacts are distributed between transportation users and communities.
2.2 InTegRaTIng TRansIT PRojeCTs InTo Roadway PlannIng PRoCesses
Transit-related projects occur in a roadway environment in one of three ways:
y The transit improvement is constructed by a state or local government.
y The improvement is made by the transit agency, with local government permits and approvals.
y A developer makes the improvement as a condition of development.
This section addresses the first circumstance when the transit improvement is incorporated into a local government project or a transit project is funded and implemented by the local government. The purpose of this section is to highlight opportunities for a transit agency to influence the elements of a project to benefit transit. The following section describes a typical roadway planning process. Actual planning and programming processes may differ among agencies.
Figure 2-4 illustrates how transit considerations can be integrated into roadway planning and program-ming efforts. The exhibit illustrates a typical roadway agency planning and programming process, and the basic life cycle of a roadway development project. Inputs from transit agencies that can influence
c02.indd 13 27/11/13 8:58 PM

2-14 Guide for Geometric Design of Transit Facilities on Highways and Streets
decisions at each stage of the process are shown to the left. The process illustrated is typical of a highway agency, but similar, less formal process steps also occur in local jurisdictions.
A project develops incrementally in the following steps.
y System Planning. The system plan begins with an inventory of places where a roadway is not fully ad-equate, and then proposes solutions to address each deficiency. Examples of deficiencies may include poor pavement conditions, roadways that do not meet geometric design standards, and locations with high accident rates, or traffic congestion and delay. This is the stage at which initial project ideas are formed and placed on a list. Although every agency may not have a formal system planning process, every agency should develop lists of projects that may be candidates for further development.
Transit agencies can have an influence on the project lists developed by roadway agencies in several ways. For example, transit agencies can provide:
– Data about places where transit service is regularly delayed;
– A list of places where transit facilities are needed;
Identify transit requirements to be addressed by the project
Identify transit projects that could be included in roadway funding
Identify transit improvement to address corridor issues
Identify transit opportunities and deficiencies on existing roadways
Transit Inputs to Roadway Processes
Identify transit elements to include in roadway projects
Roadway Project Stages
Systems PlanningIdentify deficiencies and conceptual
solutions
ProgrammingPrioritize projects and select program
to fit revenue stream
Environmental / Design:Design project, assess impacts,
estimate cost
Agreements:Document agreements on transit role in project funding and implementation
ScopingDevelop project definitions to
address deficiencies
Corridor PlanningDevelop and assess alternatives when
solution is not apparent
CORRIDOR PLANNING PHASE
FACILITY PLANNING PHASE
Figure 2-4. Transit Inputs into Typical Roadway Planning and development Process
c02.indd 14 27/11/13 8:58 PM

Chapter 2—Planning and Decision-Making 2-15
– A list of places where transit accidents are above average;
– A list of the types of places or geometric configurations where accidents occur;
– A list of places where pedestrian access facilities (sidewalks) are missing; and
– Proposed standards for transit performance or facilities.
y Scoping. This process develops a detailed description and cost estimate for projects that have a chance of being programmed. The level of detail developed during scoping varies greatly among agencies, but the project elements, schedule, and cost estimate developed become budget targets at the programming stage. It is important that they be achievable.
At the scoping stage, transit agencies can affect the specific elements included in the project definition. If transit elements are desired as part of a project, it will be easier to include them at the scoping stage than to try to add them after the project budget and scope have been set.
y Programming. As budget time nears, projects are prioritized and added to a proposed design and con-struction program, a process known as programming. After a program is funded through the budget process, projects progress to the design and construction stages and the focus moves from defining and prioritizing projects to delivering them.
Some roadway agencies will solicit transit-related projects as they develop the design and construction program. If the transit agency has funding to contribute to a desired project, then a partnership effort may be proposed. In some agencies, contributions from other agencies will increase a project’s score in the prioritization process.
A strong, ongoing communication between local roadway and transit agencies is essential to coordinate facility design for transit purposes. Good relationships are needed to coordinate the timing of transit inputs, and to promote receptiveness to making project and program changes because of those inputs.
2.3 suMMaRy
Planning and decision-making are important in all phases of transportation system development and design. The objectives are to provide facilities that reflect present and future needs; complement and re-inforce existing infrastructure; improve mobility and safety; support land development, economic growth and environmental objectives; are affordable and implementable; and are acceptable to the community. From a public transportation perspective, facilities and services should reduce travel times, improve reli-ability, attract new riders, and reduce operating costs. These objectives are best achieved through a plan-ning, decision-making, and project development process that objectively assesses demands, costs, and benefits.
The planning and decision-making process is a pragmatic one that reflects specific local circumstances, needs, resources, and precedents. It is usually performed at both the regional and corridor levels. At the regional or planning and programming level, an objective analysis of modal options is essential. Corridor or project planning and decision-making involve identifying alternatives and proposed alignments, de-veloping designs and operational plans, and assessing them in terms of workability, impacts, fatal flaws, and community acceptance.
c02.indd 15 27/11/13 8:58 PM

2-16 Guide for Geometric Design of Transit Facilities on Highways and Streets
Federal rules outline the requirements for state DOTs, MPOs, and public transportation operators to con-duct a continuing, comprehensive, and coordinated transportation planning and programming process in each state and in metropolitan areas. All relevant agencies should be involved in the decision-making process, and continuous participation is essential.
2.4 ReFeRenCes
1. Federal Highway Administration. A Summary of Highway Provisions in SAFETEA-LU, http://www.fhwa.dot.gov/safetealu/summary.htm.
2. Federal Highway Administration. Project Development: NEPA Implementation. http://www.environment.fhwa.dot.gov/projdev/pd2implement.asp.
3. Federal Highway Administration. SAFETEA-LU Fact Sheets on Highway Provisions: Statewide Planning. http://www.fhwa.dot.gov/safetealu/factsheets/statewide.htm.
4. Federal Highway Administration. The Government and Transportation Decision-Making. http://www.fhwa.dot.gov/planning/citizen/citizen4.htm.
5. Federal Highway Administration and Federal Transit Administration. The Metropolitan Transportation Planning Process: Key Issues. A Publication of the Transportation Planning Capacity Building Program. http://www.planning.dot.gov/documents/BriefingBook/BBook.htm.
6. Federal Transit Administration. Advancing Major Investments Through Planning and Project Development. http://www.fta.dot.gov/printer_friendly/planning_environment_2591.html.
7. Federal Transit Administration. Introduction to New Starts. http://www.fta.dot.gov/printer_friendly/planning_environment_2608.html.
8. Federal Transit Administration. Metropolitan and Statewide Planning Program Overview. http://www.fta.dot.gov/planning/metro/planning_environment_2887.html.
9. Federal Transit Administration. National Environmental Policy Act. http://www.fta.dot.gov/planning/environment/planning_environment_225.html.
c02.indd 16 27/11/13 8:58 PM

3-1
In This Chapter:
3.1 Transit Vehicle Characteristics and Controls
3.2 Roadway Design Controls and Criteria
3.3 Transit Quality of Service and Capacity Considerations
3.4 Transit Operations and Infrastructure
3.5 References
The physical and performance characteristics of buses and rail transit cars operating in the road-way environment, and the need to accommodate automobiles, trucks, bicyclists, and pedestri-ans provide the basis for establishing geometric design controls along streets and highways. Facilities for transit vehicles should be compatible with established roadway design standards. Capacities of both roadways and transit facilities should suit their expected usage.
This chapter provides basic vehicle characteristics and their implications on roadway design, summarizes basic roadway design requirements, and contains general capacity guidelines. The controls and guidelines apply to bus facilities operating on freeways, streets, and in separate rights-of-way. They also cover streetcar and light-rail operations within street rights-of-way. Additional technical information on transit vehicles and bus transit capacity computations is contained in Appendices C and D, respectively (15).
3.1 TransIT VehICle CharaCTerIsTICs and ConTrols
The design of transit facilities should reflect the dimensions and capabilities of the vehicles they serve. This section outlines general vehicle characteristics and their roadway design implica-tions. It covers vehicle dimensions, performance, and turning capabilities for standard transit buses, guided buses, and light rail transit, covering most in-roadway operating settings. These characteristics form the basis for establishing design requirements such as cross-section, clear-ance, curvature, and grade stop conditions along streets and freeways.
3.1.1 Standard Bus Vehicle Characteristics (4)
Many types of buses operate in urban transit service. Buses widely used are 12.2- and 13.7-m (40- and 45-ft); and 18.3-m (60-ft) articulated buses are often found in heavy-traveled corridors.
3 Design Parameters and Controls
c03.indd 1 27/11/13 4:55 PM

3-2 Guide for Geometric Design of Transit Facilities on Highways and Streets
Specialized BRT vehicles—such as the CIVIS Bus used in Las Vegas—operate in several cities. As a rule, roadway or guideway space for a large bus usually can accommodate a small bus.
Figure 3-1 shows a typical 12.2-m (40-ft) urban bus. Tables 3-1 and 3-2 show selected design and per-formance characteristics for typical 12.2- and 13.7-m (40- and 45-ft) regular buses, and 18.3-m (60-ft) articulated buses. Specific dimensions vary slightly among various bus models and manufacturers, there-fore dimensions and physical characteristics of the transit fleet should be verified with the bus operators. Facility designs should have the maximum operating flexibility and not use minimum design criteria. Appendix C provides examples of bus transit design vehicles. These exhibits illustrate the following roadway-related controls.
length and height
The standard single-unit urban transit bus is 12.2 or 13.7 m (40 or 45 ft) long, and the design articulated bus is 18.3 m (60 ft) long. Buses are generally 3.3 to 3.8 m (11 to 12.5 ft) high, including air conditioning on top. Accordingly, a minimum vertical design envelope of 4.0 m (13 ft) is suggested. This translates into a 4.4 m (14.5 ft) minimum vertical clearance, when allowance is made for pavement resurfacing. A higher clearance is needed for electric trolley buses where overhead catenaries and power pick-up must be accommodated.
An intercity bus, as used by various private carriers, is 13.7 m (45 ft) long, 2.6 m (8.5 ft) wide, and 3.5 m (11.5 ft) high (Figure 3-2). A 4.4-m (14.5-ft) vertical clearance will accommodate this vehicle.
A modern double-decker bus is 4.2 m (13.8 ft) high (Figure 3-3). Its width and length are similar to those of other standard transit buses.
Figure 3-1. Typical 12.2-m (40-ft) Urban Transit Bus
c03.indd 2 27/11/13 4:55 PM

Chapter 3—Design Parameters and Controls 3-3
Width
Most modern urban transit buses are 2.6 m (8.5 ft) wide. However, when outside mirrors are added on both sides, the bus envelope typically becomes 3.0 to 3.2 m (10 to 10.5 ft). Therefore, 3.6 m (12 ft) lanes are desirable, and 3.3 m (11 ft) is suggested as the desired minimum lane width. If the mirror-to-mirror
Table 3-1. Standard Bus Design Characteristics (3, 5, 9, 12)
regular Bus Articulated Bus
Item 12.1 m (40 ft) 13.7 m (45 ft) 18.3 m (60 ft)
Length 12.2 m (40 ft) 13.7 m (45.0 ft) 18.3 m (60.0 ft)
Width Without Mirrora 2.5–2.6 m (8.2–8.5 ft) a 2.6 m (8.5 ft)a 2.6 m (8.5ft)a
Height (to Top of Air Conditioning) for Design
3.0-3.5 m (9.9–11.5 ft)b 3.8 m (12.5 ft)b 3.3 m (11.0 ft)b
Overhang
Front 2.1 m (7.2 ft) 2.4 m (7.9 ft) 2.7–2.7 m (8.8–8.9 ft)
Rear 2.4 m (9.3 ft) 3.0 m (9.8 ft) 2.6–3.0 m (8.6–9.7 ft)
Wheel Base (Rear) 7.7 m (25.0 ft) 7.0 m (22.9 ft) 7.1–7.5 m (23.3–24.5 ft)
Driver’s Eye Height 2.1 m (7.0 ft)c 2.1 m (7.0 ft)c 2.1 m (7.0 ft)c
Weight
Curb Weight12.2–12.8 mt
(27,000–28,200 lbs)17.3 mt (38,150 lbs) 17.2 mt (38,000 lbs)
Gross Weight16.7–8.1 mt
(36,900–40,000 lbs)25.0 mt (55,200 lbs) 30.2 mt (66,600 lbs)
Ground to Floor Heightd 0.7 m (2.3 ft) typical0.4 m (1.2 ft) low floor
0.7 m (2.3 ft) typical0.4 m (1.2 ft) low floor
0.7 m (2.3 ft)
Passenger Capacity
Seats30–50, depending on
orientation for standees50 76
Standees (Crush load) 20 28 38
Turning Radius
Inside 7.5–9.1 m (24.5–30 ft) 7.5–9.1 m (24.5–30 ft) 8.3 m (27.3 ft)
Outside 12.8–14.3 m (42.0–47 ft) 12.8–14.3 m (42.0–47 ft) 12.1–12.8 m (39.8–42 ft)
Outside with Overhang 13.9–15.5 m (45.5–51 ft) 13.9–15.5 m (45.5–51 ft) 13.5 m (44.3 ft)
Doors—Number (typical) 2 2 2–3
Width of Each Door 0.7–1.6 m (2.3–5 ft) 0.8–1.6 m (2.5–5 ft) 0.8–1.6 m (2.5–5 ft)
Angles
Approach 10° 10° 10°
Breakover 10° 10° 10°
Departure 9.5° 9.5° 9.5°
Note: Exact dimensions may vary by bus manufacturer. Dimensions do not include bike racks on buses.a With mirror envelope dimensions become 3.0 to 3.2 m (10 to 10.5 ft).b Use 4.4 m (14.5 ft) as minimum governing design clearance.c Use 1.1 m (3.5 ft) for driver’s eye height for roadway design.d Low floor and platform design buses may represent a lower minimum requirement.
c03.indd 3 27/11/13 4:55 PM

3-4 Guide for Geometric Design of Transit Facilities on Highways and Streets
Table 3-2. Bus Performance Characteristics (2)
Maximum Attainable Speed
Acceleration km/h/sec. MPH/Sec.
0–10 5.36 3.33
10–30 3.57 2.22
30–50 1.53 0.95
Deceleration km/h/sec. mph/sec.
Normal 3.2–4.8 2–3
Maximum 9.7–19.3 6–12
Maximum Grade (Sustained-Roadway) 6% 6%
Maximum Grade (Short Upgrade) 10–12% 10–12%
Figure 3-2. Intercity Bus
Figure 3-3. Double-Decker Bus
c03.indd 4 27/11/13 4:55 PM

Chapter 3—Design Parameters and Controls 3-5
envelope can be essentially the same as that for 2.6-m (8.5-ft) buses, 3.0-m (10-ft) lanes could be used in locations where space is constrained.
eye height
An eye height of 1.1 m (3.5 ft) should be used in roadway design, although the driver’s eye-height on most buses approximates 2.2 m (7 ft). This allows a factor of safety for potential new equipment and for pos-sible use of bus lanes and busways by other design vehicles.
Transit Vehicle Maneuverability
Maneuverability is an important element in the roadway and at parking facilities. Maneuverability and access restrictions include:
y Turning radii and design of adequate curb returns;
y Acceleration capabilities of transit vehicles and maximum negotiable grades;
y Provision of adequate clear sight distances at intersections; and
y Design of driveways, raised pathways, and traffic-calming devices such as speed humps and speed tables.
Turning Radii and Design of Curb Returns
Figure 3-4 shows the minimum turning path for a typical 12.2-m (40-ft) bus when maximum exerted force is placed on the bus steering wheel. The outside turning radius is about 14 m (46 ft) and the in-side turning radius 7.6 m (25 ft). A 13.7-m (45-ft) bus would have a slightly longer inside and outside turning radius, depending on the manufacturer. The minimum outside turning radius of the front overhang of a bus is about 15.2 m (50 ft). A slightly larger minimum outside radius (e.g., 16.8 m [55 ft]) should be used for design purposes to allow smoother maneuvering if it is needed to accommodate intercity buses. As vehicles age, the turning radius changes, and different vehicles may exhibit slightly different turning radii. Appendix C has the characteristics and turnng paths of the AASHTO design vehicles used in transit operations from the AASHTO’s A Policy on Geometric Design of Highways and Streets (The Green Book). (3) Verifying the turning radius by coordinating with the affected bus manufacturers and operators is a good practice before designing transit facilities or planning for tran-sit services along the affected streets. Consulting the latest source documents from bus manufacturers is also recommended.
Table 3-3 is an illustrative example of the likely overhang associated with different radii in the street envi-ronment. At many urbanized street intersections, such turning radii are not possible; thus, a right-turning bus must encroach further into an intersection and occupy more than a single lane width for the intersect-ing street. As the radius expands, the overhang decreases.
Based on the turning maneuverability of a standard transit bus (AASHTO Green Book) the following edge-of-traveled-way designs in Table 3-4 are appropriate for 90-degree turns at intersections with 3.6-m (12-ft) lanes, assuming no parking lanes. To avoid encroachment with lane widths less than 3.6 m (12 ft), edge-of-traveled-way designs greater than the minimum radii shown in these tables will be required. Minimum designs may be required for locations with low turning speeds, low turning volumes, high pedestrian volumes, and high adjacent property values.
c03.indd 5 27/11/13 4:55 PM

3-6 Guide for Geometric Design of Transit Facilities on Highways and Streets
Figure 3-4. Minimum Turning Path for a Typical Transit Design Vehicle
c03.indd 6 27/11/13 4:55 PM

Chapter 3—Design Parameters and Controls 3-7
A bicycle rack on the front of a bus can affect minimum turning radii. Variations may exist in the impact of the turning radii based on specific rack designs and bus designs. Figure 3-6 is a template for a two-rack design, which is most typical. The impact of the rack may be contained within the minimum outside radius of 13.87 m (45.5 ft) noted in Figure 3-4, or may be as much as 0.3 m (1 ft) greater, depending on the specific bus and turning radius. Accounting for this added dimension is particularly critical on driveways, in bus transit centers and in neighborhoods with limited turning maneuverability.
Acceleration, Deceleration, and Maximum Negotiable Grades
Because of their increased mass, buses require greater distances to accelerate to required travel speeds and, likewise, greater distances to break and stop. Buses decelerate faster on an upgrade and accelerate more quickly on a downgrade. The design of ramps to freeways and arterials serving park-and-ride lots should incorporate appropriate allowances for the reduced acceleration and maneuverability characteris-tics of buses and to the extent possible, take advantage of opportunities to create ramps that are upgrades exiting and downgrades entering a freeway.
Normal bus acceleration rates of 3.2 km (2.0 mi) per hour per second, and normal deceleration of 2.4 km (1.5 mi) per hour per second, should be used. These rates reflect the performance capabilities of most urban transit buses, and they permit buses to accelerate to 48 km (30 mi) per hour in about 15 seconds.
Maximum deceleration in emergencies should not exceed 8.0 to 9.7 km (5 to 6 mi) per hour per second where there are standing passengers.
Sustained, short upgrades of up to 6 percent do not unduly interfere with bus operations, and, as noted in Table 3-2, short distance grades on ramps may be up to 10 percent. It is desirable to limit downgrades if sharp horizontal curvature and heavy truck and bus traffic are present. Electric trolley buses will tend to have greater hill-climbing ability.
Table 3-3. Turning Radius for 12.2 m (40 ft.) Bus (3)
Turning radiusVehicle overhang (Inside of Curve)
Vehicle overhang (Outside of Curve)
25 m (82 ft.) 2.1 m (6.8 ft) 2.8 m (9.3 ft)
30 m (100 ft.) 2.0 m (6.5 ft) 2.65 m (8.7 ft)
300 m (1,000 ft.) 1.8 m (5.8 ft) 2.0 m (6.5 ft)
Table 3-4. Minimum Travel Way Designs for 12.2-m (40-ft) Bus (3)
Curve Type Recommended Minimum Radius
Simple Curve 15 or 17 m (50 or 55 ft)
Simple Curve with Taper 12 m (40 ft.) with 1-m (2-ft) offset
3-Centered Compound Curve 36 m (120 ft.), 12 m ( 40 ft) with 1-m (2-ft) offset
Note: A minimum radius of 15 to 17 m (50 to 55 ft) is required to keep a bus from encroaching into an adjacent or opposing lane. In many urban/suburban areas, this type of radius is impractical because it lengthens pedestrian crossings and has significant right-of-way impacts. In many cases, some off tracking by buses is tolerable. In many urban areas, a 7.5- to 9-m (25- to 30-ft) radius is common. The presence of bike lanes and/or on street parking will increase the effective radius of a curve and serve to minimize off tracking.
c03.indd 7 27/11/13 4:55 PM

3-8 Guide for Geometric Design of Transit Facilities on Highways and Streets
Photo courtesy of Peter Martin and Sportworks NW, Inc.
Figure 3-5. Example of Bicycle Rack on Standard Bus
For a left-turn maneuver from a stop-controlled minor street or driveway, a time gap in traffic on a four-lane undivided major road of 10 seconds is sufficient for a standard bus to accelerate from a stop and complete a left turn without unduly interfering with traffic flow. The time gap acceptance does not vary with approach speed on an arterial. A 10-second time gap is equivalent to an Intersection Sight Distance (ISD) of 140 m (450 ft) on a 48 km/h (30 mph) design speed roadway.
A time gap sufficient for a standard bus to accelerate from a stop at a stop-controlled minor street or driveway and complete a left-turn without unduly interfering with traffic flow on an arterial might not be feasible at a given location. Minimum safe sight distances of roughly 61 m (200 ft) should be maintained, assuming a 48 km/h (30 mph) average travel speed on the intersecting arterial. This is the stopping sight distance for a vehicle traveling at 48 km/h (30 mph) with a 2.5-second reaction time and with a decel-eration rate of 3.4 m/s2 (11.2 ft./s2). At 48 km/h (30 mph), a 61-m (200-ft) clear sight standard allows for minimum vehicle gap of about 4.5 seconds.
Traversing Driveways, Raised Pedestrian Pathways, Railroad Crossing, and Traffic Calming Devices
Transit vehicles must be able to negotiate a vertical profile change at a driveway or traffic-calming device without dragging their undersides or front and rear bumpers. Figure 3-7 depicts three road clearance angles for a bus that should be considered in the design of transit facilities, railroad cross-ings, driveways, and streets with raised surfaces serving transit. Dimensions will vary for each angle for each bus manufacturer. For the vehicle-dimension data presented above, current bus designs have approach angles that range from 8.2 to 9.0 degrees, departure angles that range from 8.1 to 9.0 degrees, and breakover angles that range from 8.3 to 15.2 degrees. These data resulted from a sample of four bus manufacturers and 12 vehicle models. Low floor buses will be particularly critical to accommo-date, and as such, may justify their own guideway or limited routings where such conditions can be minimized.
Section 3.3 presents more detailed information addressing transit bus roadway design and general crite-ria. Appendix C provides additional bus design vehicle information.
c03.indd 8 27/11/13 4:55 PM

Chapter 3—Design Parameters and Controls 3-9
3.1.2 Guided Bus Guideway Characteristics
Creating a running way exclusively for transit buses can reduce right-of-way requirements, improve ser-vice reliability, and promote operational safety. In addition, passenger comfort may also be enhanced by smoother operating conditions.
There are three broad categories of guidance systems:
y mechanical
y optical
y grid system
47.0o
47.0o
R=12.2 m
(39.4 ft)
R=12.2 m
(39.4 ft)
R=13.4 m
(44.1 ft)
R=13.4 m
(44.1 ft)
R=13.7 m
(44.9 ft)
R=13.7 m
(44.9 ft)
7.3 m (24.4 ft) 7.3 m (24.4 ft)
2.1 m (7.0 ft)2.1 m (7.0 ft)
2.9 m (9.4 ft)2.9 m (9.4 ft)
2.6 m
(8.5 ft)
2.6 m
(8.5 ft)
0.5 m (1.6 ft)0.5 m (1.6 ft)
MAX TURNING RADIUS WITH BICYCLE RACK=13.7 m (44.9 ft)
MAX TURNING RADIUS WITHOUT RACK=13.4 m (44.1 ft)
TYPICAL 12.2 m (40 ft) BUS, LOW FLOOR, MAX STEERING ANGLE=14.3 m (47 ft)
0.25 m(0.8 ft)0.25 m(0.8 ft)
Source: Sportworks NW, Inc.
Figure 3-6. Minimum Turning Path for a Typical Bus with Bicycle Rack
c03.indd 9 27/11/13 4:55 PM

3-10 Guide for Geometric Design of Transit Facilities on Highways and Streets
Some mechanical guidance systems have been in use for many years. Optical and grid system guidance systems are under development and have been demonstrated. They may have wider use in the future.
Mechanical Guidance
A typical guideway is 2.6 m (8.5 ft) wide and consists of either a dedicated roadway or, as a minimum, two reinforced concrete running tracks. Each running track includes guidance curbs (Figure 3-8).
Because the path of the bus in the guideway is precisely defined, a concrete running surface, rather than asphalt, typically is required to withstand the pavement deformation that would otherwise occur along the wheelpath. The defined bus path may be the only surface that is paved, since this the only section of the
Notes: Approach Angle—an angle determined by the front overhang and the lowest clearance height under the front of the bus. Whether or not the vehicle is laden must be stipulated.
departure angle—an angle determined by the rear overhang and the lowest clearance height under the rear of the bus. Whether or not the vehicle is laden must be stipulated.
Breakover Angle—included angle determined by the wheelbase and clearance height under the vehicle that determines the ability of the vehicle to traverse a humped road surface. Whether or not the vehicle is laden must be stipulated.
Figure 3-7. Bus Underside Clearance Angles (15)
Figure 3-8. Mechanical (Raised Curb) Guideway, Essen, Germany
c03.indd 10 27/11/13 4:55 PM

Chapter 3—Design Parameters and Controls 3-11
guideway in contact with the bus tires. The central part of the guideway between the running tracks may be continuous or have a pervious surface with a drainage system underneath.
The buses are fitted with solid, rubber-tired guide wheels in front of the front wheels, mounted on solid forged arms linked directly to the steering mechanism of the bus (Figure 3-9). The arm connecting the guide-wheel to the steering mechanism of the bus is designed to break off if subject to greater force than it encounters during its normal curb guidance function, so as to prevent damage to the steering mechanism.
Special guideway transition sections are used for street and pedestrian crossings. The segregated guide-way can be differentiated from other lanes through other means such as raised islands at intersections between the running tracks to create a self-enforcing roadway. The chief disadvantage is its inability to be co-located within general-purpose traffic lanes as with many urban LRT and streetcar systems.
The difficulty of operating a raised-curb segregated system in an urban arterial setting prompted vehicle manufacturers, specifically in France, to investigate vehicle guidance systems that would be compatible with in-street operating conditions. Alternate guidance systems are now being demonstrated.
Optical Guidance
Optical guidance consists of a camera mounted on a bus that references markers such as stripes painted in the center of the lane. The camera is connected to a vision module that analyzes the image and sends information to a guidance module that also receives data from the steering system, gyroscopes, and odometer (Figure 3-10) to keep the bus correctly positioned. Refer to MUTCD Part 3 to avoid any con-flicts with pavement marking for motorist guidance. According to information from one manufacturer (Irisbus), the lateral guidance system is capable of keeping the bus within 12.7 cm (5 in.) of the desired lateral position in a forward speed of 50 km/h (30 mph). Docking accuracy at low speed is 35 mm (1.4 in.). Thus, the horizontal docking gap typically must be this same dimension.
Figure 3-9. Mechanical (Raised Curb) Guideway, Essen, Germany
c03.indd 11 27/11/13 4:55 PM

3-12 Guide for Geometric Design of Transit Facilities on Highways and Streets
Snow must be cleared from the affected lane for the optical guidance system to be operational in cold climates. Dust, sunlight, glare, and other obstacles may prevent this approach from being reliable.
Grid System-Magnetic Guidance
Magnetic guidance technology has been demonstrated in Europe. The system uses dead reckoning based on vehicle kinematics to navigate along a grid of predetermined points. Each point on the grid is associ-ated with an absolute location. The technology associated with the grid points can be magnetic markers embedded in the pavement, radio beacon transponders, or some other form of accurate local positioning sensor. Magnetic markets seem to be the currently preferred grid markers in demonstrations.
The infrastructure requirements for the vehicles are typically:
y Dedicated concrete lanes;
y Double lanes (one in each direction) 3.3 m (11 ft) wide;
y Magnetic markers every 1.2 m (4 ft) in the road surface;
y Interfaces with existing traffic control systems; and
y Adapted pavement height at stops.
Table 3-5 summarizes the characteristics of each guidance technology. Note that buses capable of oper-ating in guided mode can also be driven in regular service on non-guided lanes or roadways. Thus, the guided portion of a route may be separate from regular service, lending added flexibility to its application.
Figure 3-10. Optically Guided CIVIS Bus in Las Vegas, Nevada
c03.indd 12 27/11/13 4:55 PM

Chapter 3—Design Parameters and Controls 3-13
3.1.3 Typical Light Rail Transit Vehicle Characteristics
A growing number of cities operate LRT within city streets, and several cities operate heritage streetcars. Figure 3-11 shows a modern articulated light rail vehicle (LRV). Table 3-6 lists dimensions and perfor-mance characteristics for both types of vehicles. There is a wide range of vehicle types and sizes; there-fore, exact dimensions will vary among vehicles and manufacturers.
Typical Vehicle Dimensions and Performance
Key streetcar and LRV dimensions and performance characteristics include the following.
y Vehicle Length. Single-unit city streetcars range from about 13.4 to 15.5 m (44 to 51 ft) long. Articulated LRVs range from about 21.6 to 28.9 m (71 to 95 ft) long.
Table 3-5. Summary of Vehicle Guidance Issues
Guidance Type
Mechanical
OpticalGrid
(Magnetic)raised Track Central rail
Specialized Infrastructure
• Two reinforced concrete running tracks with guidance curbs
• Solid rubber-tired guide-wheels in front of the front wheels
• Curb guidance requires a separated guideway
• Single guidance rail in the center of the lane
• Hydraulic/ mechanical linkages on the bus to access the guide-rail
• Camera mounted outside of the bus
• Painted strips in the center of the lane
• On-board electronic guidance system that interprets the camera’s images
• Dedicated concrete lanes
• Magnetic markers in pavement
• Adaptive pavement height at stops
Lane Width* 2.6 m (8.5 ft) 2.6 m (8.5 ft) 2.6 m (8.5 ft) 3.0 m (10 ft)
Advantages
Most reliable system, does not rely on computerized technology
Can be installed on most roadways
Minimal infrastructure costs
More accurate than optical without need for an exclusive guideway
* With mirror envelope, dimensions become 3.0 to 3.2 m (10 to 10.5 ft).
Figure 3-11. Modern Articulated LRV
c03.indd 13 27/11/13 4:55 PM

3-14 Guide for Geometric Design of Transit Facilities on Highways and Streets
y Vehicle Width. The outside width of streetcars range from about 2.5 to 2.8 m (8.3 to 9.0 ft), not includ-ing side mirrors. LRVs range upward to about 3 m (10 ft), with a 2.7 m (8.8 ft) width typical. Outside mirrors extend the width by up to an additional 0.6 m (2 ft).
y Vehicle Height. Most rail cars are almost 3.3 m (11 ft) high between the top-of-rail, and the car ceiling. The height from top of rail to the roof, generally, is less than 3.6 m (12 ft). Catenaries and trolley wires typically are located about 5.5 m (18 ft) above the ground. The traditional floor height is about 0.85 m (2.8 ft) above the top of rail. Modern low-floor cars are about 0.36 m (14 in.) above the rail.
y Vehicle Weight. Single-unit streetcars weigh about 16 to 27 metric tons (18 to 30 tons). Articulated light rail vehicles typically weigh about 30 to 50 t (33 to 55 tons). These result in axle weights of up to 17 t (18 tons) per truck. Fully loaded cars weigh about 40 percent more.
y Acceleration. Most modern streetcars and LRT vehicles accelerate up to 4.8 km (3 mi) per hour per second. Maximum deceleration is up to 6.4 km (4 mi.) per hour per second. Some transit systems have retained fleets of Presidents Conference Committee (PCC) cars, which were developed in the 1930s. Today preservation efforts keep many in service. They accelerate up to 8 km (5 mi) per hour per sec-ond from a stop.
y Speed. Streetcars typically have top speeds of 64 to 80 km/h (40 to 50 mph), while light rail vehicles typically reach speeds of 88 to 105 km/h (55 to 65 mph), where they run on protected rights-of-way.
y Maximum Grade—Track. The maximum sustained grade for light rail and streetcars preferably is three percent and no more than six percent, but greater latitude often is afforded to streetcars for maximum grades of as much as nine percent in isolated situations. Four percent is possible, though not desirable, for
Table 3-6. Selected Physical and Performance Characteristics for Streetcars and LRVs (13, 14, 19)
Item
Streetcars (Regular Body)
light rail Vehicles (Articulated Body)b
Presidents Conference Committee (PCC) Modern Cara
Length 13.4–15.5 m (44–51 ft) 15.2–15.5 m (50–51 ft) 21.6–29.0 m (71–95 ft)
Distance Between Truck Centers
6.1–7.9 m (20-26 ft) 7.6 m (25 ft) 7.0–10.7 m (23–35 ft)
Width 2.5–2.7 m (8.3–9.0 ft) 2.6 m (8.5 ft) 2.5–3.0 m (8.3–10.0 ft)
Height from Top of Rail
3.1 m (10.2–10.3 ft) 3.3–3.7 m (10.8–12.0 ft) 3.3 m (10.8 ft)
Weight (tare) 16.3–18.1 t (18–20 tons) 26.3–27.2 t (29–30 tons) 29.9–49.9 t (33–55 tons)
Maximum Acceleration
7.7 km/h/s (4.8 mph/s) 4.8 km/h/s (3.0 mph/s) 3.5–4.8 km/h/s (2.2–3.0 mph/s)
Maximum Deceleration
7.7 km/h/s (4.8 mph/s) 4.8–6.4 km/h/s (3.0–4.0 mph/s)
4.8–6.4 km/h/s (3.0–4.0 mph/s)
Maximum Speed 64.3–72.4 km/h (40–45 mph)
80.4 km/h (50 mph) 88.5–104.6 km/h (55–65 mph)
a Includes Philadelphia SEPTA and Toronto Streetcars and are representative only. Exact physical and performance features will vary with each model car.
b Data from Boston and Baltimore LRT systems for representative use only. Exact physical and performance features will vary with each model car.
c03.indd 14 27/11/13 4:55 PM

Chapter 3—Design Parameters and Controls 3-15
long sustained grades. A maximum of about five percent is possible for short sustained grades from 150 m (500 ft) up to 300 m (1,000 ft) between VPIs for vertical curves. A maximum of six percent is permis-sible for short sustained grades of up to 150 m (500 ft) between VPIs on vertical curves.
y Maximum Grade—Station. The preferred maximum station longitudinal grade is about one percent, with a maximum cross slope of two percent or less. Tangent station platforms are preferred. Platforms should not be on a curve except for specific site conditions that make tangent platforms impossible. The controlling factor is the gap at the doors and compliance with the Americans with Disabilities Act (ADA) of 1991. The horizontal gap cannot exceed three percent.
Geometric and Street Design Implications
Table 3-7 outlines the geometric and street design implications of these physical and performance charac-teristics. Figure 3-12 illustrates the dynamic envelope for light rail and streetcars.
y Envelopes. Most rail cars operate on the standard railway gauge of 1.35 m (4 ft, 8½ in.). Streetcars in some systems, notably New Orleans and Philadelphia, use a slightly wider track gauge. The general two-track “envelope” on a tangent section is 6.7 to 7.3 m (22 to 24 ft). The distance between track cen-terlines should be 3.3 to 3.6 m (11 to 12 ft). However, where center support poles for overhead wires are provided, it should be increased to 4.2 m (13.5 ft). Side-platform stations should be at least 3.0 m (10 ft) wide to accommodate ADA requirements, although 4.2 m (13.5 ft.) is desirable where space permits. The minimum clear width of center platforms should be at least 4.6 m (15 ft), although in restrictive settings it could be reduced 3.0 to 3.7 m (10 to 12 ft).
y Vertical Clearance. A minimum vertical clearance of 4.1 m (14.5 ft) should be provided. However, a 5.5 to 5.6 m (18 to 18.5 ft) clearance is desirable to minimize changes in the overhead wire or catenary elevations.
y Grades. The maximum sustained grade for light rail and streetcars is preferably three percent and no more than six percent but greater latitude is often afforded to streetcars for maximum grades of as much as nine percent.
y Turning Radius. Streetcars traditionally have used a 10.7 m (35 ft) radius on the inside rail to negoti-ate street corners. Modern streetcars (as in Philadelphia and Toronto), require a minimum 11 m (36 ft) radius; however, a 15 m (50 ft) minimum radius is desirable.
A curve radius of 25 m (82 ft) is the minimum found on current LRT lines. A 30 m (100 ft) curve radius is the desirable minimum. Longer radii are preferable where conditions permit, especially in off-street settings.
The actual horizontal clearances will depend on the curve radius, the vehicle truck centers, and how far the end trucks are from the end of the car body. Often, the clearance to the outside of a curve will be gov-erned not by the actual car body but by the rear view mirrors.
The widening on the inside of curves depends on the distance between truck swivels, while the widening on the outside depends mainly on the overhang length. (See Figure 3-13.) More information is provided in Chapter 6.
Horizontal clearances should be adequate to accommodate the dynamic envelope of cars, and the front and rear body overhang around curves, including outside mirrors. The dynamic envelope reflects the
c03.indd 15 27/11/13 4:55 PM

3-16 Guide for Geometric Design of Transit Facilities on Highways and Streets
vertical, lateral and rotational car body motion, truck suspension movement, track skew, rail-to-wheel clearances, and permissible wheel and rail wear. This information is vehicle-specific.
Around curves, the maximum horizontal extensions from the inside and outside rails, with the upper body rolled four degrees, ranges from about 1.8 to 2.7 m (6 to 9 ft for a 28 m (92 ft) articulated car, depending upon the radius of curvature.
Table 3-7. Geometric and Right-of-Way Requirements for Light Rail Transit in Street or Center Reservation (6, 7, 18)
Item Measurements
Access Control
Number of Tracks (typical) 1 each direction (2)
Width (per track)
Gauge (inside spacing between rails)
Standard 1.35 m (4 ft– 8.5 in.)
Wide 1.6 m (5 ft– 4.5 in.)
Car Width (without side mirrors) 2.6–3.0 m (8.5–10 ft)
Lane Width (tangent envelope) 3.4–3.9 m (11–12 ft)
Overall Minimum Right-of-Way
ROW Reservation for Bi-Directional Tracks 6.7–7.3 m (22–24 ft)
Distance Between Center Lines of Tracks 3.4–3.7 m (11–12 ft)
Vertical Clearancea
Top of Rail to Bottom of Wire 4.1–5.6 m (14.5–18.5 ft)
Stationsb
Side Platform Width 3.0–4.2 m (10–13.5 ft)
Center Platform Width 4.6–7.6 m (15–25 ft)
Platform Lengthc 30.5–12.2 m (100–400 ft)
Platform Height
Low 25–35 cm (10–14 in.)
High 96–99 cm (36–39 in.)
Minimum Design Speedd 24–40 km/h (15–25 mph)
Minimum Curve Radiuse
Streetcars 11–15 m (36–50 ft)
Light Rail Vehicles 25–30 m (82–100 ft)
Grades—Trackf
Desirable Maximum 3%
Absolute Maximum (Short Sections) 6%a Higher value better, accommodates catenary and trolley wire.b Governed by ADA requirements.c Depends upon length of vehicles and number of cars—typical range is cited.d Usually governed by design speed for street.e Values represent actual and desirable minimums respectively.f Values in table and text reflect guidance from several operators including Muni and Los Angeles light rail systems.
c03.indd 16 27/11/13 4:55 PM

Chapter 3—Design Parameters and Controls 3-17
Superelevations should be avoided in intersections, because this design increases maintenance. Avoiding placement of switches in intersections is another recommendation to alleviate maintenance. Stray current problems can occur from some installations and requires careful consideration of how track, ties, and electrical systems are installed and maintained.
3.2 ROADWAy DESIGN CONTROLS AND CRITERIA
Public transport vehicles on streets and highways generally operate efficiently within the range of geo-metric values set forth in the AASHTO “Green Book” (3). However, designers should carefully consider the special requirements transit vehicles may need in roadway design. These include:
y The lane widths and shoulder widths needed for transit vehicles;
y The swept paths and horizontal clearance requirements, especially where making right turns as noted for buses, light rail, and streetcars in the prior sections of this chapter;
y Vertical clearances required for rail cars (including overhead wire) and for double-deck buses (where operating);
y The acceleration characteristics of transit vehicles;
THESE TWO DIMESIONSSHOW VEHICLE SIDEMOVEMENT DUE TOROLL SIDE PLAY ANDFISH TAIL ONLY
1.3 m(4.35 ft)
2.66 m(8.73 ft)
STATIC OUTLINE
ROOF CORNER1.56 m (5.14 ft)
1.43 m (4.71 ft)PLATFORM LEVEL
PLATFORM
1 m (39 inch)
CAR CLDISPLACED DUE TOSIDE PLAY AND FISH TAIL
76 mm (3 inch) ROLL CLSTATIC CL
TOP OF RAIL ELEVATION
Figure 3-12. Dynamic Envelope for a Single LRT Track
c03.indd 17 27/11/13 4:55 PM

3-18 Guide for Geometric Design of Transit Facilities on Highways and Streets
y The specific pavement requirements needed for transit lanes and stops (which tends to be site specific based on prevailing soils and subsurface conditions);
y Drainage treatments near bus and rail car stops;
y The load limits on bridges; and
y Signing, signals, and other traffic control devices.
3.2.1 Design Controls
The basic design controls include “design driver” and design speed.
design driver
The identification of a design driver influences several design elements for a transit-oriented facility. Design drivers typically are defined by their experience with the facility being considered. For example, professional bus drivers are usually more aware of potential conflicts on a roadway than other motor-ists. Roadways typically are designed for the unfamiliar driver, who has had no professional training. Exceptions to this approach may be made for busways, transit guideways, and some HOV lanes, where use is primarily restricted to buses or authorized vehicles.
L
TWO-AXLE VEHICLE - AXELS RIGID IN THE FRAME
FOUR-AXLE VEHICLE - AXELS RIGID IN EACH TRUCK;
TRUCKS SWIVEL UNDER THE BODY
SIX-AXLE ARTICULATED VEHICLE;
TRUCKS SWIVEL UNDER THE BODY
VEHICLE BODY
CLEARANCE LINES
TRUCK
CENTERPLATE
(TRUCK SWIVEL)
LO
LO
LT
LT
L
LO
LA
LA
LO
LT
L
LO
LA
LO
LT
LT
DIMENSIONS CRITICAL FOR
TRACK CURVATURE
DIMENSIONS CRITICAL FOR
TRACK CURVATURE
Figure 3-13. Turning Clearance Requirements for Streetcar and LRV
c03.indd 18 27/11/13 4:55 PM

Chapter 3—Design Parameters and Controls 3-19
design speed
Roadway and transit guideway alignment features depend upon the designated design speeds. These speeds typically are a function of facility type, location, land use, grade, topography, and anticipated operating speeds. Transit lanes along freeways should have the same design speed as those for the adja-cent general purpose lanes. However, there may be circumstances—as for contra-flow lanes—where the design speeds may be lower because of specific roadway geometry or other safety related limitations. The presence of on-line and off-line transit stations may also influence desired design speeds. Design speeds of 120 km/h (70 mph) are typically used for freeways, 50 to 90 km/h (30 to 50 mph) for arterial streets, and slower speeds for local streets.
The design speed for bus-only roadways (busways) on separate rights-of-way should be based on location, to-pography, adjacent land-uses, and whether or not there are intersections at-grade. Table 3-8 lists design speeds typically associated with various types of bus and HOV lanes. These speeds should be adjusted to reflect local conditions as needed. Lower design speeds generally should be applied to urban arterial and collector streets.
design Year
The design year for designing and evaluating transit and related highway improvements depends upon the type and scale of the project. Major improvements such as freeways, busways, and light-rail lines should have at least a 20-year design year horizon. Physical improvements such as roadway widening should have at least a 10-year horizon. Operational improvements—such as bus lanes, queue bypasses, or short transit-only connector roads—should have a 2-to-5-year horizon. Design year may depend on the funding source.
Design Volumes
Key highway design volumes should include:
y The average annual daily traffic (or average daily weekday traffic); and
y The a.m. and p.m. peak-hour volumes in each direction of travel.
Transit passenger and vehicle volumes should be analyzed on both daily and peak-hour bases. Both a.m. and p.m. peak-hour volumes by direction of travel should be obtained or estimated. Traffic volume and transit ridership estimates should be provided for both the base year (existing condition) and for the design year (future condition).
Table 3-8. Examples of Typical Design Speeds for Bus and HOV Facilities Along Freeways (17)
Type of BUS or HOV Lane
Typical design speed
Desirable Acceptable
Separate Right-of-Way
Bus Only 120 km/h (70 mph) 80 km/h (50 mph)
Bus and HOVs 100 km/h (60 mph) 60 km/h (40 mph)
Freeway HOV Lanes and Bus Lanes
Barrier Separated Lanes 120 km/h (70 mph) 80 km/h (50 mph)
Concurrent Flow Lanes 100 km/h (60 mph) 80 km/h (50 mph)
Contra-Flow Lanes 80 km/h (50 mph) 40 km/h (30 mph)
c03.indd 19 27/11/13 4:55 PM

3-20 Guide for Geometric Design of Transit Facilities on Highways and Streets
3.2.2 Accessible Design
Transit stops and stations shall be fully accessible in accordance with the provisions of the most current Americans with Disabilities Act (ADA) guidelines. Values provided are current as of the time of print-ing. ADA requirements govern the design of new and upgraded transit facilities to the extent feasible. Guidelines cover pathway width, space for wheelchairs, grades, treatment of obstructions, and placement and design of signs. Many state requirements may exceed federal standards, so practitioners should al-ways refer to state and local guidelines and ordinances.
y Changes in vertical elevation of 6.1 to 7.6 m (20 to 25 ft) may require elevators. For smaller changes in elevation, ramps are required to meet ADA needs.
y On some low-platform stations along LRT lines, mini “high-platform” stations and ramp systems can be provided.
y “High-platform” stations provide a 0.6 m (2 ft) tactile edge strip on the track-side of the platform.
y Wheelchairs must be accommodated at stops and stations. A 1.2 m (4 ft) pathway width enables a wheelchair and one person on foot to move simultaneously. A 2.4 m (8 ft) long by 1.5 m (5 ft) area is required for a bus (or LRT) pad. A clear area of at least 0.8 m (2.5 ft) by 1.5 m (5 ft) should be provided within bus shelters.
y Landscaping should not hang so low as to block accessibility or block visually impaired passengers. A minimum clearance height along walkways would be 2.1 m (6 ft 8 in).
y Curbs at intersection corners must provide wheelchair ramps. These normally are provided on the tangents nearest either side of the corner radius or in accordance with local ordinances.
y Certain bus transit stops, including sawtooth bays, require positive separation from pedestrian waiting or boarding areas.
The ADA requirements translate into more pedestrian space at stations, and in some cases a wider vehicle and roadway envelope. Additional information regarding ADA requirements and accessibility is listed on the ADA and ABA Accessibility website (www.access-board.gov). (1)
3.2.3 Roadway Alignment Geometry
Geometric factors should be considered in the design of transit facilities along freeways and arterial roadways. These include sight distance, lane and shoulder width, intersection turning radii, sidewalks, horizontal and vertical clearances, super-elevation, cross slopes, horizontal and vertical curvature, and gradient. Design recommendations, standards, and guidelines established by professional organizations including AASHTO, Institute of Transportation Engineers (ITE), individual state departments of trans-portation, and other agencies should be considered in developing these features for specific projects. Guidance for typical factors follows.
sight distance
Roadway facilities should provide adequate safe stopping sight distance for buses, vans, automobiles, and trucks having to make a stop. The automobile often is applied in determining this distance for various
c03.indd 20 27/11/13 4:55 PM

Chapter 3—Design Parameters and Controls 3-21
travel distances, and the driver’s eye height of 1.1 m (3.5 ft) is used. The stopping sight distance should be checked along the route, especially where barriers may restrict visibility.
Decision sight distance is the distance required for a driver to perceive an unexpected situation, arrive at a decision for a course of action, and execute that decision in a reasonable manner. Ideally, decision sight distance should be provided at (or ahead of) interchanges, intersections, lane drops, abrupt or major horizontal alignment changes, narrow bridges, and toll stations.
Table 3-9 provides values for safe stopping and decision signal distances for speeds ranging from 50 to 130 km/h (30 to 70 mph). The decision sight distance is about two to three times as long as the stopping sight distance.
Lane and Shoulder Widths
Lane widths should reflect the type of facility, travel speeds, and the presence of transit vehicles. Table 3-10 lists suggested guidelines for tangent (i.e., straight) sections of road. Transit buses generally can be accommodated in 3.3- to 3.6-m (11- to 12-ft) lanes. However, where the outside mirror-to-mirror envelope is less than 2.9- to 3.0-m (9.5- to 10-ft), 3.0-m (10-ft) lanes may be acceptable. Lane widths should be increased for curved roadway sections in accordance with AASHTO’s Policy on Geometric Design for Highways and Streets. (3)
Along city streets, curb lanes should be 0.15 to 0.3 m (0.5 to 1.0 ft) wider than other lanes wherever possible. If bicycle lanes are provided, they should be 1.5 to 2.1 m (5 to 7 ft) wide with 1.2 m (4 ft) as a minimum.
Table 3-9. Stopping and Decision Sight Distances for Various Design Speeds (3)
design speedStopping Sight
distance
Decision Sight Distance for Avoidance Maneuver (Speed, Path, Direction Changes)
Suburban Road Urban Road
50 km/h (30 mph) 65 m (200 ft) 170 m (535 ft) 195 m (620 ft)
70 km/h (40 mph) 105 m (305 ft) 235 m (715 ft) 275 m (825 ft)
90 km/h (50 mph) 160 m (425 ft) 315 m (890 ft) 360 m (1030 ft)
110 km/h (60 mph) 220 m (570 ft) 380 m (1125 ft) 430 m (1280 ft)
130 km/h (70 mph) 285 m (730 ft) 450 m (1275 ft) 510 m (1445 ft)
Table 3-10. Recommended Roadway Lane Widths for Transit on Tangent Section (3)
Type of Roadway Desirable Acceptable
Freeways/Expressways 3.6 m (12 ft) 3.3 m (11 ft)
Arterial Roads
Speeds over 65 km/h (45 mph) 3.6 m (12 ft) 3.3 m (11 ft)
Speeds under 65 km/h (45 mph) 3.3–3.6 m (11–12 ft) 3.0–3.3 m (10–11 ft)
Turning Lanes 3.3–3.6 m (11–12 ft) 3.0–3.3 m (10–11 ft)
Local Roads/Streets 3.3 m (11 ft) 3.3 m (11 ft)
Note: For roadways not designed for transit, refer to the AASHTO Policy on Geometric Design of Highways and Streets. (3)
c03.indd 21 27/11/13 4:55 PM

3-22 Guide for Geometric Design of Transit Facilities on Highways and Streets
On freeways, shoulders that allow travel by buses on a part-time basis or when congestion warrants should be at least 3.4 m (11 ft) wide. A 3.6-m (12-ft) width is desirable. Pavement should be able to support the sustained loads of buses traveling at moderate speeds. Figure 3-14 shows a bus operating on a freeway shoulder.
Intersection Turning Radii
Corner radius design at street and highway intersections should reflect a reasonable balance between vehicle and pedestrian requirements. Along highways, 12- to 15-m (40- to 50-ft) turning radii are used to accommodate large trucks, and three-center curves are sometimes used to improve vehicle tracking. However, in urban areas, radii are usually less than 9.1 m (30 ft), and 4.6- to 7.6-m (15- to 25-ft) radii are common.
Three basic guidelines should underlie developing turning radii for buses:
1. Buses should be able to make right (and left) turns from one street to another.
2. Ideally, buses should make turns without encroaching on the opposing direction of travel or pedestrian curb space on the inside radius.
3. Large turning radii should be avoided from a pedestrian conflict perspective.
All buses can turn right without encroaching on the opposing travel direction, whenever they turn from a lane adjacent to a parking lane (or shoulder/bike lane) into a receiving width of at least 6.1 m (20 ft) and curb radius of at least 7.6 to 9.2 m (25 to 30 ft). When a bus turns into a three-lane receiving width, the radius could be reduced to 4.6 m (15 ft).
When buses turn from one curb lane into another, a 13- to 15-m (45- to 50-ft) radius is required. This is impractical in most urban environments, since larger radii increase crossing distance, encourage higher speed turning movements, and increase setbacks of signal and lighting facilities, thus requiring more right-of-way. In such cases, the radius should be reduced to 7.6 m (25 ft) or less, but some encroachment on the opposing lanes accepted. The cross-street “stop” line should be set back to enable safe bus turns.
Figure 3-14. Bus Lane on Freeway Shoulder
c03.indd 22 27/11/13 4:55 PM

Chapter 3—Design Parameters and Controls 3-23
Stop bars in each lane may be staggered to accommodate the turning radius needed. To the extent practi-cal, bus routing patterns should minimize turns where two narrow roads intersect. (See Chapter 5.)
3.3 TRANSIT QUALITy OF SERVICE AND CAPACITy CONSIDERATIONS
Transit quality of service and capacity analyses are important in planning, designing, and assessing tran-sit facility requirements on streets and highways. They are useful in sizing new facilities, identifying needs for operational improvements, and quantifying the transit and traffic impacts of providing exclusive lanes for transit vehicles. Detailed computational procedures for highways and transit are outlined in the Highway and Transit Capacity and Quality of Service Manual (1, 3). Both manuals base their analyses on peak 15-minute flow rates. Both indicate that operating at maximum capacity results in delays and poor reliability. Key guidelines that are relevant to providing transit facilities and services on streets and highways follow.
Transit quality of service and capacity guidelines are more complex and somewhat less precise than high-way capacity, since they deal with the movement of both people and vehicles. Guidelines depend on the size and passenger capacity of transit vehicles, where and how often the vehicles run, and the passenger traffic concentrations along the route. They reflect the operating policies of transit agencies who normally specify service coverage, frequency, and allowable passenger loadings.
Quality of service guidelines contained in the sections that follow are important to all communities that provide transit service. The capacity guidelines, which are useful wherever transit runs and routes con-verge, are especially relevant in large cities.
Quality of Service Concepts
Quality of service is defined as “the overall measured or perceived performance of transit service from the passenger’s point of view. It reflects the kinds of decisions that a potential passenger makes in deciding whether to use transit or another mode” (1). The decision has two aspects: (1) assessing whether transit service is available; and (2) if so, comparing the comfort and convenience with that of competing modes.
Table 3-11 shows the overall framework for defining quality service ratings for each service measure for fixed-route and demand responsive service. Six levels—A to F—establish ratings for fixed-route services, and 8 levels—1 to 8—for demand-responsive services, reflect differences in service quality experienced by passengers. The measures can apply at a transit stop, along a route segment, or for the entire system.
Table 3-11. Quality of Service Framework (15)
Transit Stop Route Segment system
Fixed-Route Transit Service Measures
Availability Frequency Hours of service Service coverage
Comfort and Convenience Passenger load Reliability Fixed route transit vs. automobile travel time
Demand-Responsive Transit Service Measures
Availability Response time Span of service Service coverage
Comfort and Convenience On-time performance Trips not served Transit vs. automobile travel time
c03.indd 23 27/11/13 4:55 PM

3-24 Guide for Geometric Design of Transit Facilities on Highways and Streets
Capacity Concepts
The passenger capacity of a transit route or facility depends upon the number of vehicles that can be pro-cessed and the number of people per hour that can be served. It can be measured along the way, at stops or terminals, or at junctions near stations—the critical locations that normally govern capacity. The highest achievable minimum headway along a route governs the number of transit vehicles or units processed.
The passenger demand during the peak 15 minutes at the maximum load section typically establishes the service frequency for a given loading standard. Then, it is necessary to determine whether this service frequency can be processed at the busiest points of passenger boarding or interchange.
The many factors that influence capacity include right-of-way conditions, signal control systems, stop design, passenger boarding considerations, and street characteristics.
Transit vehicle capacity (units per hour) depends upon:
y Number of vehicles per unit (e.g., light rail cars per train);
y Minimum headway between individual trains or buses. This reflects upon the size of the unit, needed clearance times between successive units, dwell times at busiest stations or junctions, and train control systems;
y Number of bus berths or rail station track platforms; and
y Available “green time” in seconds per hour (3,600 seconds for grade separated transit, less for street running).
In many cases, the potential vehicle capacity of a transit route may not be achieved in actual operations, because of resource limitations or insufficient passenger demand. This will result in a service frequency that is below what is theoretically possible.
Transit passenger capacity (people per hour) depends upon vehicle size and seating configuration. The passenger spaces per vehicle include the number of seated passengers plus the net remaining area divided by the designated space per standing passenger.
Table 3-12 shows the levels of service for passenger comfort expressed in net space per standing passen-ger, and load factor (passengers per seat). The values apply to both buses and rail cars. However, because of the varying seating configurations, especially in rail cars, the load factor figures should be used with caution.
Table 3-12. Fixed-Route Passenger Load Levels of Service (LOS) (15)
losLoad Factor (p/seat)
Standing Passenger Area (m2/p [ft2/p]) Comments
A 0.00–0.50 >1.00 (>10.8) No passenger need sit next to another
B 0.51–0.75 0.76–1.00 (8.2–10.8) Passengers can choose where to sit
C 0.76–1.00 0.51–0.75 (5.5–8.1) All passengers can sit
D 1.01–1.25 0.36–0.50 (3.9–5.4) Comfortable standee load for design
E 1.26–1.50 0.20–0.35 (2.2–3.8) Maximum schedule load
F >1.50 <0.20 (<2.2) Crush load
c03.indd 24 27/11/13 4:55 PM

Chapter 3—Design Parameters and Controls 3-25
The “crush capacity” denotes the absolute maximum capacity that is possible, and is set at less than 0.2 m2 (2.2 ft2) per person. The minimum space to avoid passenger contact has been reported to range from 0.22 to 0.26 m2 (2.4 to 2.8 ft 2) per person. Most transit systems use “schedule design” capacities that are lower than the crush capacity. The New York City Transit Authority uses 0.28 m2 (3.0 ft 2) per standing passenger as a “schedule design” load for subway cars. Table 3-13 shows examples of actual passenger capacities.
Planning Guidelines
The following guidelines are important for both facility and transit service design. (9)
y Capacity increases with more green time per cycle for vehicle movement, more passengers per vehicle, and more vehicles per unit.
y Capacity increases as the number of berths or track platforms increases; however, doubling the num-ber of tracks or berths at a stop usually results in less than double the capacity.
y Capacities vary inversely with the minimum headway between trains and buses. The headways de-pend upon dwell times, variations in the dwell times and the required clearance times between succes-sive trains or buses. Capacities are reduced when dwell times at major stops are excessive.
Table 3-13. Passenger Capacity Characteristics of Typical Transit Vehicles (8)
Type of Vehicle
Typical Capacity*
remarkslength Width seats standees Total
Minibus—short haul
5.5–8.8 m (18-29 ft)
2–2.4 m (6.5–8.5 ft)
15–29 0–15 15–44
Transit bus (high floor)
9.1 m (30 ft)
2.4–2.6 m (8-8.5 ft.)
35 19–25 54–60
10.7 m (35 ft)
2.4–2.6 m (8–8.5 ft)
39 25–33 64–72
12.2 m (40 ft)
2.4–2.6 m (8-8.5 ft)
43 32–47 75–90 New Flyer Industries—C40 HF, 1995
Transit bus (low floor)
9.1 m (30 ft)
2.4–2.6 m (8-8.5 ft)
30 19–25 49–55
10.7 m (35 ft)
2.4–2.6 m (8-8.5 ft)
34 25–33 59–67
12.2 m (40 ft)
2.4–2.6 m (8-8.5 ft)
38 32–47 70–85 New Flyer Industries—C40 LF, 1995
Articulated transit bus
16.7 m (55 ft)
2.6 m (8.5 ft)
64–66 34–42 98–108 Chicago-a.m. General-MAN
18.3 m (60 ft)
2.6 m (8.5 ft)
65 32–47 97–112 New Flyer Industries—D60, 1993
Streetcar 14.2 m (46 ft)
2.6 m (8.5 ft)
59 40–80 99–139 P.C.C.
Light rail car train (high floor)
97.5 m (316 ft)
2.6 m (8.6 ft)
256 344–544 600–800 San Diego 3–4 car train (Siemens)
Light rail car train (low floor)
56 m (182 ft)
2.7 m (8.75 ft)
144 166–246 310–390 Portland 2-car train SD100 (Siemens)
* Accommodation of luggage or bicycles can limit capacity.
c03.indd 25 27/11/13 4:55 PM

3-26 Guide for Geometric Design of Transit Facilities on Highways and Streets
y The peak ridership demand in the maximum load section of a transit line should set the desired service frequency. This frequency should be accommodated at the busiest stops.
y A transit line that has a relatively uniform distribution of boarding passengers among stops usually has a higher capacity than a line with passenger boardings concentrated at a single stop.
y The maximum rate of passenger flow usually is constrained by such factors as acceptable levels of passenger comfort, the presence of other traffic sharing the right-of-way, and safety considerations.
y When trains operate at crush loads, the actual throughput in people per hour can be less than when vehicle loads are lighter. This is because more time is required at stops, and fewer vehicles can be processed.
y Operating at capacity tends to strain transit systems, resulting in vehicle bunching and passenger delays. Crush loads should be avoided. For example, when a bus berth operates up to 75 percent of its capacity, speeds are reduced by at least 15 percent due to bus-to-bus interference. When it operates at 100 percent of capacity, speeds are cut in half.
y Because capacity relates closely to system performance and service quality in terms of speed, comfort, and service reliability, a single number can be misleading.
y Volume-to-capacity comparisons should use peak 15-minute passenger flow rates.
y The reasonableness of capacities obtained by analytical methods must be cross-checked against actual operating experience.
Operating Experience
Figure 3-15 shows the peak-hour peak-direction transit capacity ranges reported in the United States and Canada. It also indicates the highest observed passenger volumes. The capacity ranges reflect differing
Light Rail: On-street Section
Commuter Rail: Owned ROW
Commuter Rail: Leased ROW
Bus: Shared HOV Lane, No Stops
Busway: Local/Express
Busway: All Stops
Bus: Dual Bus Lane, CBD
Bus: Bus Lane, CBD
Bus: Mixed Traffic, non-CBD
Bus: Mixed Traffic, CBD
10,000 15,000PERSONS PER HOUR PER DIRECTION
PERSONS PER HOUR CAPACITY RANGES OF U.S.AND CANADIAN TRANSIT MODES
25,0005,0000 20,000
Typical Capacity Range
Highest Observed in North America
Typical Capacity Range
Highest Observed in North America
Figure 3-15. Person Capacity Ranges of United States and Canadian Transit Modes (15)
c03.indd 26 27/11/13 4:55 PM

Chapter 3—Design Parameters and Controls 3-27
assumptions on the number of cars per train, critical dwell times, and passenger loading standards. The HOV lanes assume shared use by buses and car pools. The rail values represent the persons per track per hour.
Passenger capacities reflect the upper limit of crowding that North Americans are usually willing to ac-cept. Higher capacities are achieved in other parts of the world that accept higher levels of crowding.
Bus Transit Capacity
Observed peak-hour movements along freeways, busways, on city streets, and to or from terminals pro-vide general planning guidelines for estimating the capacity of similar facilities. They also provide a means of checking more detailed computations.
y The highest bus volumes in North America are found on the Lincoln Tunnel approach to the Port Authority of New York/New Jersey’s 210-berth Midtown Bus Terminal. Some 735 buses carrying 33,000 people per hour operate non-stop in exclusive bus lanes and bus-only ramps.
y Where bus stops or layovers are required, reported bus volumes are much lower. Exclusive busways with passing capabilities at stations as in Ottawa carry more than 10,000 people (200 buses) per hour in one direction. Dual bus lanes on city streets—in one direction—such as along Madison Avenue in New York City, and the 5th and 6th Avenue Transit Malls in Portland Oregon—also carry 200 buses per hour.
y A flow rate of 150 to 200 buses per hour is achieved on exclusive bus ways in downtown Ottawa, where 75 percent of the riders use passes and may enter the center door of articulated buses.
y Bus lanes on downtown streets generally carry 80 to 120 buses per hour where each stop has several loading areas per stop. These bus volumes correspond to about 5,000 to 7,500 passengers per hour, depending on passenger loads.
0
0
10
20
30
40
50
60
10,000 20,000 30,000
PERSON CAPACITY (PEAK DIRECTION PASSENGERS/HOUR)
AV
ER
AG
E T
RA
VE
L S
PE
ED
(m
ph)
40,000 50,000 60,000
Heavy Rail
Commuter Rail
Bu
sw
ay
LRT
(on street)
CBD Bus Lane
People Mover
Bus in Mixed Traffic
Bu
s O
n H
ov L
an
eLight Rail
(Exclusive Row)
Figure 3-16. Typical Transit Speed and Capacity Ranges of United States and Canadian Transit Modes (15)
c03.indd 27 27/11/13 4:55 PM

3-28 Guide for Geometric Design of Transit Facilities on Highways and Streets
Planning Values. Tables 3-14 and 3-15, respectively, show general bus capacity planning guidelines for downtown and arterial streets. Table 3-14 is expressed in buses per lane per hour, and Table 3-15 shows passenger capacities for various combinations of bus flows and passenger loads. The number of people that can be served at varying bus flow rates and passenger load factors in bus-only lanes are provided. The table provides a broad person-capacity planning guide; it assumes that key boarding points are suf-ficiently dispersed to achieve the cited loads.
Table 3-14. Planning Level Bus Lane Service Volumes (15)
Description Service Volume bus/lane/h Average bus/lane/h
Arterial Streets
Free Flow 25 or less 15
Stable Flow, Unconstrained 26 to 45 35
Stable Flow, Interference 46 to 75 60
Stable Flow, Some Platooning 76 to 105 90
Unstable Flow, Queuing 106 to 135 120
Forced Flow, Poor Operation Over 135 150
Downtown Streets
Free Flow 20 or Less 15
Stable Flow, Unconstrained 21 to 40 30
Stable Flow, Interference 41 to 60 50
Stable Flow, Some Platooning 61 to 80 70
Unstable Flow, Queuing 81 to 100 90
Forced Flow, Poor Operation Over 100 110
Table 3-15. Maximum Passenger Service Volumes for Planning Purposes (15)
Buses per Hour
Load Factor (Persons/Seat)
0.00–0.50 0.51–0.75 0.76–1.00 1.01–1.25 1.26–1.50
Arterial Streets
<25 535 805 1,075 1,340 1,610
26–45 965 1,450 1,935 2,415 2,900
46–75 1,610 2,415 3,225 4,030 4,835
76–105 2,255 3,385 4,515 5,640 6,770
106–135 2,900 4,350 5,805 7,255 8,705
Downtown Streets
<20 430 645 860 1,075 1,290
21–40 860 1,290 1,720 2,150 2,580
41–60 1,290 1,935 2,580 3,225 3,870
61–80 1,720 2,580 3,440 4,300 5,160
81–100 2,150 3,225 4,300 5,375 6,450
c03.indd 28 27/11/13 4:55 PM

Chapter 3—Design Parameters and Controls 3-29
Table 3-16 indicates the quality of bus flow for various ranges in peak bus volumes. Where stops are lightly patronized, the service volumes for each flow condition could be increased about 25 percent. The table indicates maximum person-flow rates of almost 6,500 people per hour per lane on downtown streets and 8,700 people per lane per hour on arterial streets. Corresponding maximum values for seated loads are 4,300 and 5,800 people, respectively. Exclusive use of 18.3 m (60 ft) articulated buses would increase these capacities by at least one-third.
The passenger volumes assume a uniform flow during the peak hour. Passenger flows typically peak dur-ing a 15- to 20-minute period. In this case, appropriate peak hour factors should be used to reduce these values to design levels, or alternatively recognize that the passengers per seat would be about 15 to 20 percent greater during the peak-of-the-peak.
Bus Stops. Appendix D describes detailed methods for estimating the capacity of bus stops. Capacities depend upon:
y The green-per-cycle (g/c) available for movement;
y Dwell time spent at stops;
y Expected variation in this dwell time;
y The likelihood of failure;
y Clearance interval between buses, and
y The number of available loading positions per stop.
Table 3-16 summarizes the estimated maximum capacities of linear (on-street) bus stops for various dwell times, green/cycle (g/c) ratios, and number of berths per hour. The computations assure a 10-second clearance time between buses and a 25 percent probability of queues (i.e., failure). They may be used to estimate the number of berths needed for given service frequencies. Thus, two berths should be provided for a 60-second dwell time and a service frequency of 30 buses per hour, representing a g/c ratio of 0.3 and a 25 percent berth failure.
Bus Terminals. The throughput per berth in bus terminals depends upon operating practices. Time is needed to discharge and receive passengers, to relieve drivers, and to enable buses to depart according to
Table 3-16. Estimated Maximum Capacity of On-Line Linear Bus Stops (15)
Dwell Time(s)
Number of On-Line Linear Loading Areas
1 2 3 4 5
g/c*0.50
g/c1.00
g/c0.50
g/c1.00
g/c0.50
g/c1.00
g/c0.50
g/c1.00
g/c0.50
g/c1.00
30 48 69 84 120 118 169 128 182 133 189
60 27 38 48 66 68 93 74 101 76 104
90 19 26 34 46 48 64 52 69 54 72
120 15 20 26 35 37 49 40 53 41 55
* Green-per-cycle ratio.
c03.indd 29 27/11/13 4:55 PM

3-30 Guide for Geometric Design of Transit Facilities on Highways and Streets
schedule. It is also desirable to limit the number of bus routes that operate from each berth to minimize passenger confusion.
Current operating experience suggests a maximum capacity of about eight to ten buses per berth per hour for commuter bus terminals. Designing for six buses per berth per hour is desirable wherever possible.
light rail Transit Capacity
Streetcar operation historically achieved a throughput of more than 125 cars per track in many North American cities. Chicago and Pittsburgh, for example, operated up to 150 cars per track per hour. Often, however, these flows were not processed through traffic signals, motor vehicle travel was light, and queues were common.
Today, the Toronto Transit Commission schedules single and articulated streetcars at a peak 15-minute rate of more than 60 cars per hour on Queen Street East, where several car lines share a four-block stretch. These high volumes result in low speeds, irregular running, and potential passenger confusion at car stops.
Light rail lines have been reported to carry 20,000 people in Europe. Most light rail lines in North America carry fewer than 15,000 people per hour. Boston’s four-track Green Line subway and San Francisco’s Market Street Muni-subway achieve passenger flows of about 10,000 to 14,000 persons per hour. However, most systems have peak-hour peak-direction flows of fewer than 5,000 passengers per hour. Light rail lines, except for streetcar operations in Philadelphia and Toronto, usually operate 30 or fewer trains per track per hour.
LRT train length is usually limited to a maximum of three cars where trains operate on city streets. This is because longer trains usually cannot operate without blocking adjacent cross streets when they traverse short blocks. Trains cannot clear at-grade intersections rapidly, and they require long platform lengths at stations.
Minimum headways for light-rail systems depend on train length, platform and car design (high floor ver-sus low), fare collection methods (prepayment versus pay on train), wheelchair accessibility provisions, and headway controls (manual versus block signals). Under manual operations, 80 to 100 single-unit cars per track per hour could be accommodated.
When trains run under block signal controls, 120-second headways are achievable. Headways actually could be somewhat under two minutes, since the trains are shorter than those used by conventional rail rapid transit lines. However, most North American light rail systems are signaled for a minimum headway of 3 to 3½ minutes.
The maximum throughput for LRT lines running in street median reservations, or transit-only lanes could theoretically be one train per traffic signal cycle. However, to minimize possible blocking cross streets due to long dwell times or irregular arrivals, a lesser throughput is desired. Therefore, the desired capacity limit is one LRT unit every other cycle for street running portions with close block spacings. The equations for bus-stop capacity (Appendix D) can be used for LRT, by using clearance times of 20 to 25 seconds.
Passenger capacities are commonly based on 150 people per car for schedule design purposes and up to 200 people per car for crush-load conditions. Table 3-17 shows the resulting passenger capacities per train.
c03.indd 30 27/11/13 4:55 PM

Chapter 3—Design Parameters and Controls 3-31
At 30 trains per hour, schedule-design capacities range from 9,000 to 18,000 passengers per direction per hour.
3.4 TRANSIT OPERATIONS AND INFRASTRUCTURE
Transit facility design along streets and highways is influenced by transit operating policies, traffic engineering treatments, passenger security needs, and ADA requirements.
3.4.1 Transit Operations
Where and how frequently transit vehicles run, how often they stop, and how fares are collected influence both system performance and transit facility design.
Route Structure
The route structures of bus, streetcar, and light rail lines (as well as rapid transit lines) are largely a func-tion of history, geography, land development, and street patterns. The number, location, and density of the urban residential populations, as well as locations of employment concentrations in the CBD and outlying activity centers, also influence the types and locations of public transportation services.
LRT, BRT, and express/limited stop bus services operate mainly in larger urban areas, while local bus service operates in most cities. Route structures include the following.
y Grid street systems usually have grid bus route patterns, often with many points of transfer between intersecting lines. Routes are generally dispersed with one (or two) services per street in common.
y Radial (or irregular) street patterns commonly converge near central areas with a corresponding con-vergence of bus routes.
y Express corridors (served by rapid transit, LRT lines, BRT services, and express bus routes) typically radiate from the city center on or near major roadway corridors. Express services on separate transit guideways or major freeways are served by intersecting or feeder local bus routes, and may require intermodal transfer stations, or park-and-ride facilities.
y Simple, dispersed routing patterns limit the number of bus services on a single street and, in turn, the size of stations/stops. Multiple routes on a single street may require larger stations, and may incur bus-bunching. However, corridors may have enough passenger and bus volumes to support transit lanes, transit streets, and in some cases, off-street transit service.
Fare Collection
Fare collection policies influence passenger service times and dwell times at stops. Sometimes they trans-late into additional berthing requirements.
Table 3-17. Passenger Capacities per Train
2-Car Train 3-Car Train 4-Car Train
Schedule Design 300 450 600
Crush 400 600 800
c03.indd 31 27/11/13 4:55 PM

3-32 Guide for Geometric Design of Transit Facilities on Highways and Streets
Flash passes, swipe cards, and off-vehicle fare collection make it possible to board vehicles at several doors, thereby reducing dwell times and improving stop (station) throughput. They also enable buses and LRVs to be designed with multiple door channels. A ratio of one door channel per 3 m (10 ft) of length is desirable. Off-vehicle fare collection, however, requires space for fare vending equipment at stops and stations.
3.4.2 Intelligent Transportation Systems
ITS is useful in monitoring the schedule reliability (on-time performance) of transit vehicles. ITS also provides a means of connecting passenger information on vehicles and at stop/stations, (includ-ing next vehicle arrival) time. ITS also can be used in conjunction with traffic signal control systems to give transit vehicles priority at intersections and queue bypasses (e.g., to advance or extend the green time).
3.4.3 Traffic Controls and Enforcement
Traffic controls and enforcement are essential complements to geometric design of running ways, station/stops, and intersections. When transit vehicles operate in mixed traffic, actions that improve overall traffic flow will also improve transit speed, safety and reliability.
y All-day or peak period on-street parking prohibitions along transit routes are often desirable to reduce curbside interferences, to increase capacity, and to reduce delays.
y All-day or part-time prohibitions of left and right turns along transit routes at busy intersections will reduce delays to both transit vehicles and general traffic.
y Traffic signal controls, coordination, and sequences should reflect transit, as general traffic and pe-destrian needs. The goal should be to minimize the overall person-delay along a transit route. Cycle lengths should be as short as possible, and green times along transit routes should be as long as pos-sible. Special transit actuated phases should be provided to minimize conflicts when transit vehicles turn, or transition to and from protected running ways. Special transit signal displays are desirable for median arterial transitways and for transit queue-jump lanes.
y Effective enforcement of traffic controls and regulations is essential along streets and roadways. This calls for close cooperation among transit, traffic, and police agencies.
3.4.4 Security
Effective security on transit vehicles and at stops/stations is essential, particularly in an era of increased scrutiny in protecting transportation infrastructure against terrorism. On-vehicle security should be achieved through two-way radio communication between bus or train crews, and transit operations cen-ters. Security at stations and major stops—both manned and unmanned—should be achieved by closed circuit television monitoring, provision of call boxes, good visibility and lighting, police surveillance, and effective designs. Both the actual security and the passengers’ perceptions of security are important for a viable service or operation.
c03.indd 32 27/11/13 4:55 PM

Chapter 3—Design Parameters and Controls 3-33
y Adequate levels of illumination should be provided at passenger waiting areas, and along walkways and passageways. Solar power lighting will ensure operation even during power failures.
y Facility designs should provide “defensible space.” There should be clear lines of sight, and blind cor-ners should be avoided.
y Trash receptacles, which could potentially hide a bomb, should be placed in open areas away from congregating passengers.
y Emergency telephones or response buttons should be placed where they are noticeable and accessible to all users.
y Public address systems and closed circuit television should be provided at major stations.
y A program of police monitoring should be established.
3.5 REFERENCES
1. Access Advisory Committee. U.S. Architectural and Transportation Barriers Compliance Board. http://www.access-board.gov/prowac.
2. Alameda-Contra Costa County Transit District. Transit Feasibility Standards Manual. Oakland, California, March 1983.
3. American Association of State Highway and Transportation Officials. A Policy on Geometric Design of Highways and Streets. 6th ed. (The Green Book), Washington, DC, 2011.
4. Federal Highway Administration. Manual on Uniform Traffic Control Devices for Streets and Highways. 2009 Edition. Washington, DC, 2009.
5. Fuhs, C. High Occupancy Vehicle Facilities, Current Planning, Operations and Design Practice. Parsons, Brinckerhoff, Quade and Douglas, New York, New York, October 1990.
6. Grava, S. Urban Transportation Systems. Choices for Communities. New York, New York: McGraw-Hill, 2003.
7. Institute of Transportation Engineers. Adapted from Chapter 13, Larwin, T. “Urban Transit” in Transportation Planning Handbook., Washington, DC, 1999.
8. Larwin, T. “Urban Transit” in Transportation Planning Handbook 3rd Edition. Institute of Transportation Engineers, Washington, DC, 2009.
9. Levinson, H. S., C. L. Adams, and W. F. Hoey. NCHRP 155: Bus Use of Highways—Planning and Design Guidelines. National Cooperative Highway Research Program, Transportation Research Board, National Research Council, Washington, DC, 1975.
10. Levinson, H. S. The New Transit Capacity and Quality of Service Manual. Transportation Research News. No. 232, May–June 2004, Transportation Research Board, Washington, DC.
11. Los Angeles Metropolitan Transit Authority. Metro Rapid Bus, Los Angeles, 2003.
c03.indd 33 27/11/13 4:55 PM

3-34 Guide for Geometric Design of Transit Facilities on Highways and Streets
12. Metropolitan Transit Authority of Harris County. Design Criteria for METRO Park and Ride and Transit Center Facilities. Houston, Texas, 2000.
13. Schuman J. Status of North American Light Rail Systems—1995 Update. Proc., Transportation Research Board, National Research Council, 7th National Conference on Light Rail Transit, Baltimore, Maryland, November 12–15, 1995.
14. Southeastern Pennsylvania Transportation Authority, Depot Division. Your New LRT Car., 1980.
15. Transit Cooperative Research Program. TCRP Report 100: Transit Capacity and Quality of Service Manual, Part 7. Transportation Research Board, National Research Council, Chapter 4, pp. 7–45, Washington, DC, 2003.
16. Transportation Research Board. Highway Capacity Manual, Special Report 209. National Research Council, Washington, DC, 1989.
17. Transportation Research Board. HOV Systems Manual. National Cooperative Highway Research Program Report No. 414. Washington, DC, February, 1998.
18. Transportation Research Board. This Is Light Rail Transit. National Research Council, Washington, DC, 2000.
19. Vuchic, V. R. Urban Public Transportation Systems and Technology. Prentice Hall Inc., Englewood Cliffs, New Jersey, 1981.
c03.indd 34 27/11/13 4:55 PM