1 3 march 2009 2009 economic outlook government economist
TRANSCRIPT

13 March 2009
2009 Economic outlookGovernment Economist

2
Global setting

3
Global financial turmoil mutated into global synchronised downturn

4
Job losses posing a severe drag on US consumption
-12
-8
-4
0
4
8
12
16
1/93 1/94 1/95 1/96 1/97 1/98 1/99 1/00 1/01 1/02 1/03 1/04 1/05 1/06 1/07 1/08 1/09-3
-2
-1
0
1
2
3
4
Retail Sales(LHS)
Employment(RHS)
Year-on-year growth rate (%) Year-on-year growth rate (%)
Jan09-2.5-9.7

5
US imports falling even faster, which impact severely on Asia’s exports
-20
-15
-10
-5
0
5
10
15
20
25
30
1/96 1/97 1/98 1/99 1/00 1/01 1/02 1/03 1/04 1/05 1/06 1/07 1/08
US's importsdemand
in real terms
Year-on-year growth rate (%)
US's importsfrom Asia in
nominal terms
Dec-9.8
-10.4

6
EU’s demand cut back sharply amid recession mode
-35
-30
-25
-20
-15
-10
-5
0
5
10
15
20
25
30
35
01 02 03 04 05 06 07 08-6
-4
-2
0
2
4
6
EU's import demandin real terms (LHS)
EU's GDPannualised q-t-q rate of
change in real terms(RHS)
Year-on-yeargrowth rate (%)
Quarter-to-quarter growth rate (%)
Dec08-4.6%
Q408-5.8%
-45
-40
-35
-30
-25
-20
-15
-10
-5
0
5
10
15
20
1/97 1/98 1/99 1/00 1/01 1/02 1/03 1/04 1/05 1/06 1/07 1/08 1/09
Feb09-39.8%
EU'sSentiment
Index
Year-on-year growth rate (%)

7
Similar situation in Japan
-50
-40
-30
-20
-10
0
10
20
30
40
50
95 96 97 98 99 00 01 02 03 04 05 06 07 08-5
-4
-3
-2
-1
0
1
2
3
4
5
Q408 Real GDPGrowth: -4.6%
Index
Q408 Tankan:-16
Japan GDP vs Tankan Survey
Japan GDP RealGrowth (RHS)
Japan TANKANLarge enterpriese (LHS)
%
-14
-12
-10
-8
-6
-4
-2
0
2
4
6
8
10
12
14
1/01 1/02 1/03 1/04 1/05 1/06 1/07 1/08 1/09
Jan09:-10%
Japan Import Demand
Year-on-year growth rate in real terms (%)
8
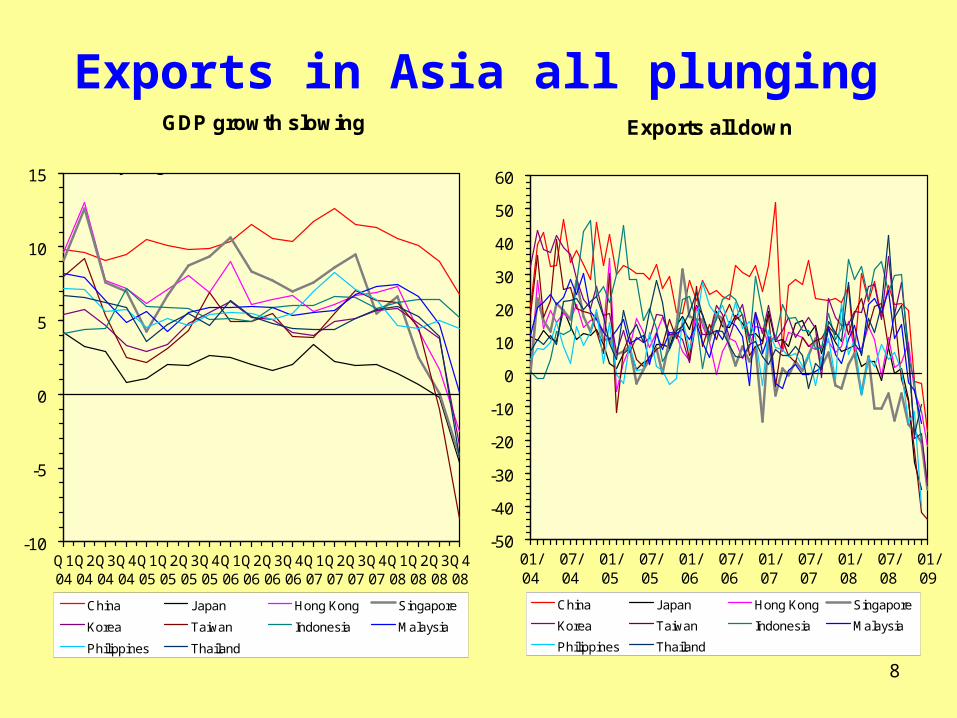
Exports in Asia all plunging GDP growth slowing
-10
-5
0
5
10
15
Q104
Q204
Q304
Q404
Q105
Q205
Q305
Q405
Q106
Q206
Q306
Q406
Q107
Q207
Q307
Q407
Q108
Q208
Q308
Q408
China Japan Hong Kong Singapore
Korea Taiwan Indonesia Malaysia
Philippines Thailand
Year-on-year growth rate (%)
Exports all down
-50
-40
-30
-20
-10
0
10
20
30
40
50
60
01/04
07/04
01/05
07/05
01/06
07/06
01/07
07/07
01/08
07/08
01/09
China Japan Hong Kong Singapore
Korea Taiwan Indonesia Malaysia
Philippines Thailand
Year-on-year growth rate (%)
9
HK’s economic outlook in 2009
• Global economy mired in recession; many Asian economies bound to be significantly hit
• HK economy expected to contract by 2 - 3%, under the drag from shrinking external demand and dented sentiment
• Timing of global recovery remains uncertain

10
Downside risks
• Deeper and more protracted global recession
• Negative feedback loop between economic downturn,
credit crunch and financial market stress
• Concerns about the aftermaths of various aggressive
policy measures
• Disorderly unwinding of the global trade imbalances
• Rising protectionism
11
HK’s sound fundamentals will help us withstand the crisis better than many others
• Banks prudent in lending: high CAR
• Spending within our means: current account
surplus
• HK is a net creditor to rest of the world: strong
IIP
• Fiscal prudence
• 3rd most competitive economy in the world
12
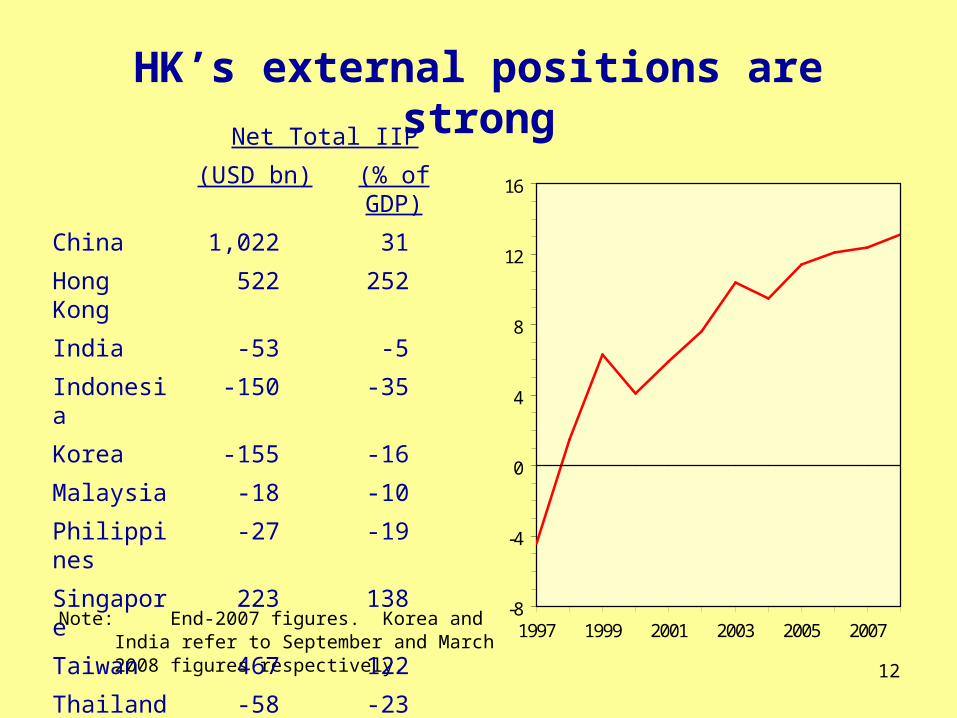
HK’s external positions are strong
Note: End-2007 figures. Korea and India refer to September and March 2008 figures respectively.
Net Total IIP
(USD bn) (% of GDP)
China 1,022 31
Hong Kong 522 252
India -53 -5
Indonesia -150 -35
Korea -155 -16
Malaysia -18 -10
Philippines -27 -19
Singapore 223 138
Taiwan 467 122
Thailand -58 -23-8
-4
0
4
8
12
16
1997 1999 2001 2003 2005 2007
13.1%Current account balanceas % of GDP
Percent
2008Q1-Q3

13
2009/10 Budget

14
Short term measures to tackle the global crisis
2009/10 Budget is a further package following a series of measures already implemented last year
$57 bn total of measures (3.5% of GDP)
100% deposit guarantee
$100 bn loan guarantee scheme for all enterprises except listed companies
Efforts to create jobs announced earlier
15
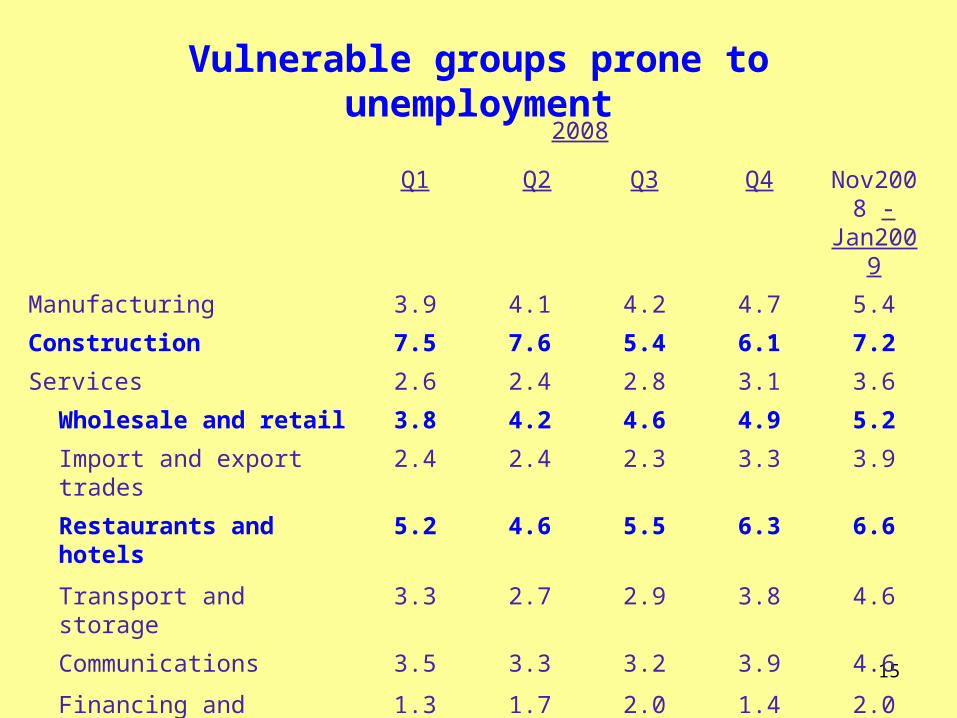
Vulnerable groups prone to unemployment
2008
Nov2008 -
Jan2009
Q1 Q2 Q3 Q4
Manufacturing 3.9 4.1 4.2 4.7 5.4
Construction 7.5 7.6 5.4 6.1 7.2
Services 2.6 2.4 2.8 3.1 3.6
Wholesale and retail 3.8 4.2 4.6 4.9 5.2
Import and export trades 2.4 2.4 2.3 3.3 3.9
Restaurants and hotels 5.2 4.6 5.5 6.3 6.6
Transport and storage 3.3 2.7 2.9 3.8 4.6
Communications 3.5 3.3 3.2 3.9 4.6
Financing and insurance 1.3 1.7 2.0 1.4 2.0
Real estate and business services
2.5 2.2 2.6 2.7 3.4
Overall 3.4 3.3 3.4 4.1 4.6

16
2009/10 Budget : focused efforts to help
the most vulnerable
Construction, esp decoration and maintenance
Youth unemployment and new graduates
Middle aged and disabled

17
In macro sense, 09/10 Budget is expansionary
Spending increase:
Recurrent spending : up $11.7 bn
Capital works expenditure: up $16.3 bn
Revenue concessions : $8.4 bn
Budget deficit : $39.9 bn (2.4% of GDP)

18
Further integration with the vibrant Mainland
economy and positioning ourselves strategically in
the PRD
Move towards higher value-added and knowledge-
based activities:
Strengthen HK as an international financial centre:
Green economy
Promote Innovation & Technology
Promote Creativity
Invest in infrastructure
Upgrade human capital
Looking beyond the financial crisis

19
Upgrading human capital is key to future success
15
17
19
21
23
25
27
29
31
33
1997 1998 1999 2000 2001 2002 2003 2004 2005 2006 2007 2008
31.2%
Share of tertiary educational attainmentin labour force
(% share)
20
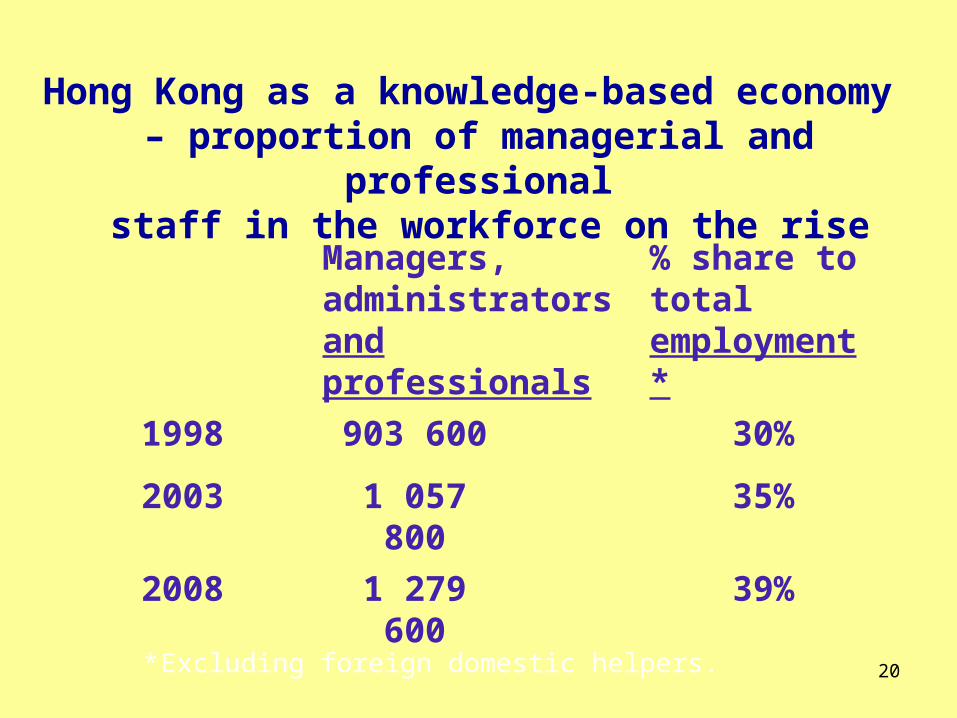
Managers, administrators and professionals
% share to total employment*
1998 903 600 30%
2003 1 057 800 35%
2008 1 279 600 39%
* Excluding foreign domestic helpers.
Hong Kong as a knowledge-based economy – proportion of managerial and professional
staff in the workforce on the rise

21
Hong Kong’s productivity growth
0.0
0.5
1.0
1.5
2.0
2.5
3.0
3.5
4.03.7%
Average annual rate of change (%)
2.9%
1.2%
1997-2000 2005-20082001-2004

223 March 2009
Thank you
23
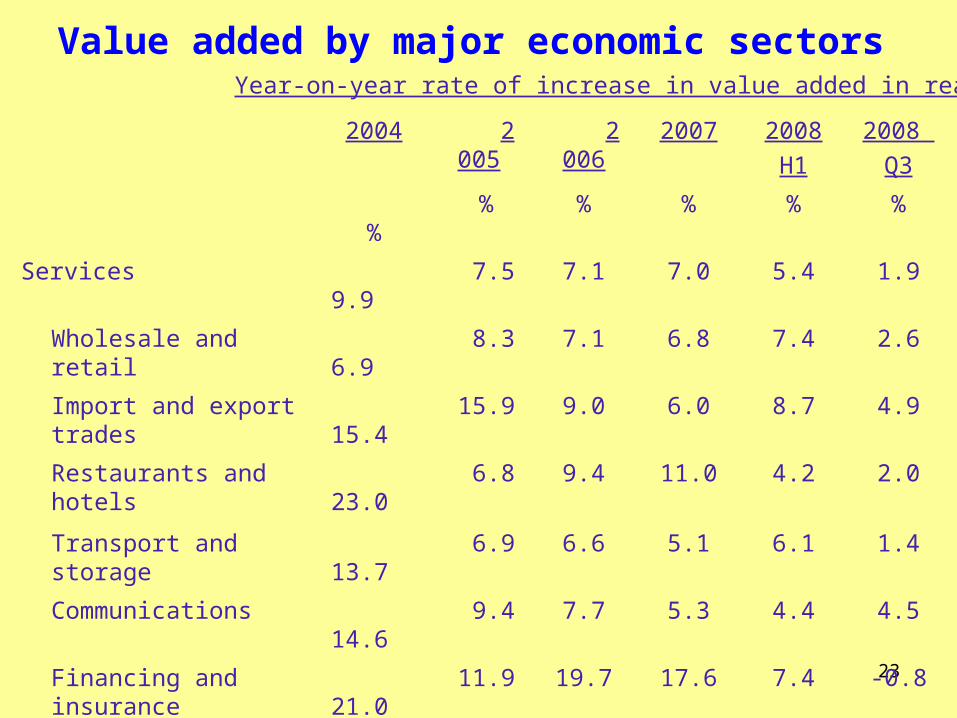
Value added by major economic sectors
2004 2005 2006 2007 2008
H1
2008
Q3
% % % % % %
Services 9.9
7.5 7.1 7.0 5.4 1.9
Wholesale and retail6.9
8.3 7.1 6.8 7.4 2.6
Import and export trades 15.4
15.9 9.0 6.0 8.7 4.9
Restaurants and hotels23.0
6.8 9.4 11.0 4.2 2.0
Transport and storage13.7
6.9 6.6 5.1 6.1 1.4
Communications14.6
9.4 7.7 5.3 4.4 4.5
Financing and insurance21.0
11.9 19.7 17.6 7.4 -0.8
Real estate and business services 2.6
4.2 1.9 6.4 5.6 -0.2
Community, social and personal services 2.6
-0.1 1.3 1.7 1.1 1.6
Year-on-year rate of increase in value added in real terms
24
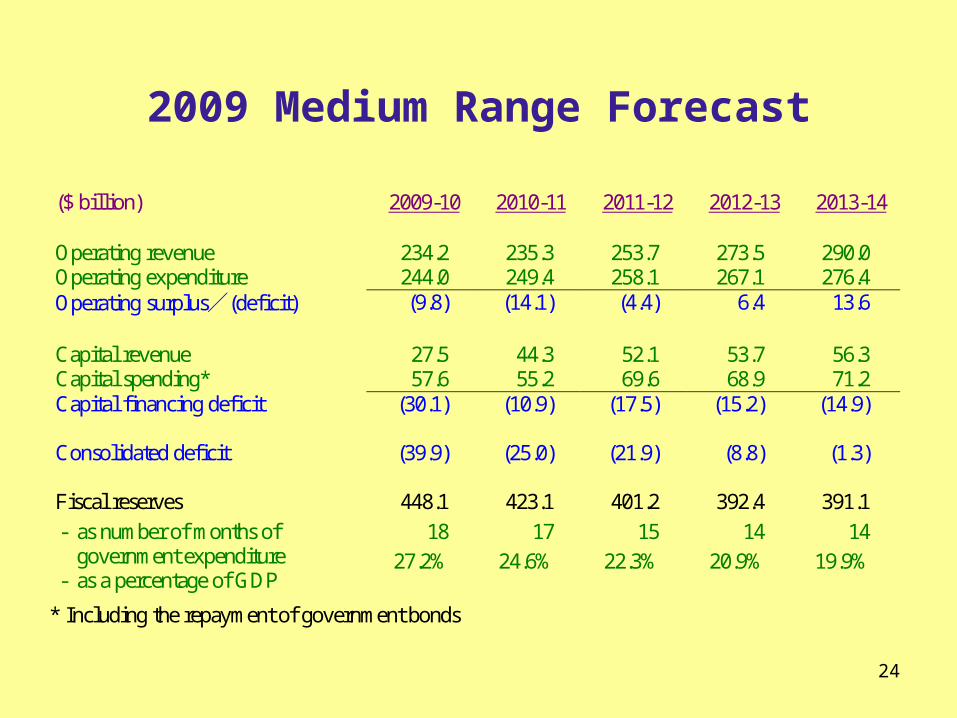
2009 Medium Range Forecast
($ billion) 2009-10 2010-11 2011-12 2012-13 2013-14
Operating revenue 234.2 235.3 253.7 273.5 290.0 Operating expenditure 244.0 249.4 258.1 267.1 276.4 Operating surplus/(deficit)
(9.8) (14.1) (4.4) 6.4 13.6
Capital revenue 27.5 44.3 52.1 53.7 56.3 Capital spending* 57.6 55.2 69.6 68.9 71.2 Capital financing deficit
(30.1) (10.9) (17.5) (15.2) (14.9)
Consolidated deficit
(39.9)
(25.0)
(21.9)
(8.8)
(1.3)
Fiscal reserves
- as number of months of government expenditure
- as a percentage of GDP
448.1
18
27.2%
423.1
17
24.6%
401.2
15
22.3%
392.4
14
20.9%
391.1
14
19.9%
* Including the repayment of government bonds