1 3q06 results november, 2006. 2 1.3q06 results. 2.stock performance. contents
TRANSCRIPT

1
3Q06 Results
November, 2006

2
1. 3Q06 Results.
2. Stock Performance.
Contents
3
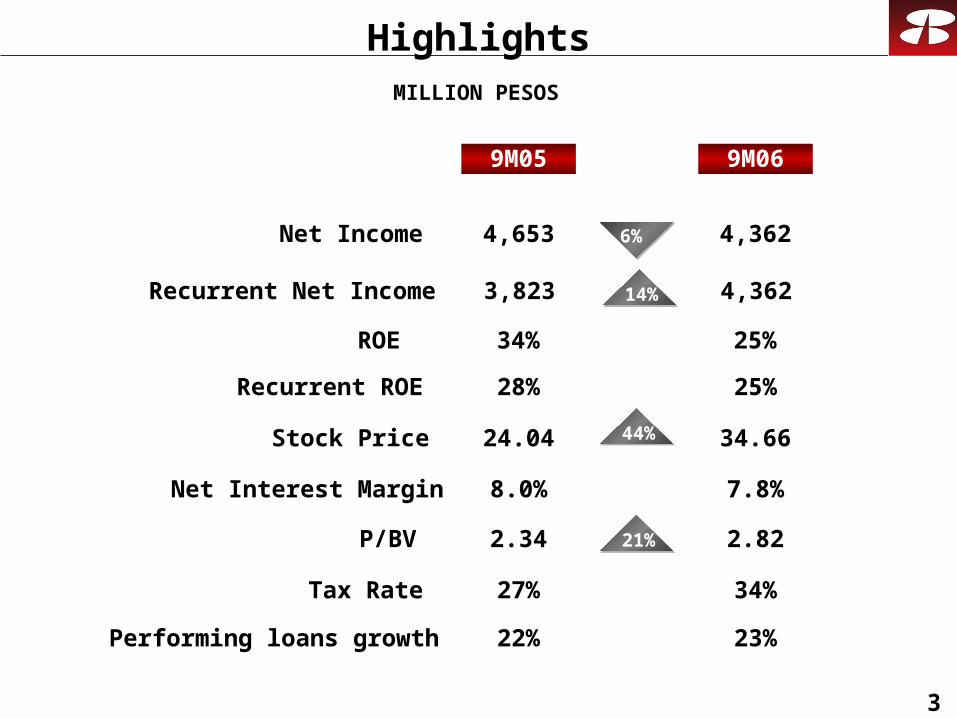
HighlightsMILLION PESOS
Performing loans growth
Net Income
Recurrent ROE
Stock Price
P/BV
Net Interest Margin
Tax Rate
Recurrent Net Income
ROE
22% 23%
9M069M05
4,653
28%
6%
24.04
2.34
8.0%
44%
21% 2.82
7.8%
25%
4,362
34.66
27% 34%
3,823 4,36214%
34% 25%

4
Profit Evolution
Millions of pesos
787
3Q04 3Q05
1,509
3Q06
1,373
CAGR 38%

5
ROE and ROA
3Q05
3% 3%
3Q06
ROE
25%
3Q06
27%
3Q05
ROA

6
Margen Financiero vs CETES
Porcentajes
CETES
Margen
70%
114%
CETE promedio:
9M05: 9.4%
9M06: 7.3%
6.3
7.1
8.1
9.0
9.7 9.5
8.6
7.6
4.4
5.1
6.2
7.3
8.5 8.3 8.5
7.57.0
7.7
7.1
8.0
2T04 3T04 4T04 1T05 2T05 3T05 4T05 1T06 2T06 3T06

7
Non Interest Expense
MILLION PESOS
EFFICIENCY RATIO
Non Interest ExpenseMore Business volume 109Solida employees 270Investment program 130 509
9M05
8,512
9M06
9,0216%
57%
9M05
55%
9M06
Inertial54%
76%
9M04

8
Core Deposits
BILLION PESOS
Demand
Time
Total
Mix
Demand
Time
Deposits 3Q04 3Q063Q05
79
46
125
63%
37%
100%
67
40
107
63%
37%
100%
65
39
104
62%
38%
100%
17%3%
18%
16%
4%
3%

9
BILLION PESOS
Performing Loan Portfolio
Commercial
Corporate
Government
Total
Consumer
3Q05 2Q06 3Q06Variation
3Q05 2Q06 3Q06
105125 129
QoQ YoY
23%3%
23%3%
(7%)(2%)
23%3%
33%6%
46
22
13
129
48
45
22
13
125
45
38
18
14
105
36

10
Performing Consumer Loan Portfolio
BILLION PESOS
Consumer
Car loans
Credit Card
Payroll loans
Mortgage
3Q05 2Q06 3Q06
3Q05 2Q06 3Q06
3645 48
VariationQoQ YoY
3%0%
44%8%
53%7%
33%6%
36%7%
6
8
5
48
29
6
8
4
45
27
6
6
3
36
21

11
LOAN ORIGINATIONBillion Pesos
Consumer Loans
MORTGAGE AUTO PAYROLL ANDPERSONAL
9M05 9M06 9M05 9M06 9M05 9M06
4.9
8.4
3.63.9
3.1
4.3
71% 8% 39%

12
Asset Quality
BILLION PESOS
Past Due Loans
Loan Loss Reserves
RESERVECOVERAGE
PAST DUE LOANRATIO
Total Loan Portfolio
3Q05 2Q06 3Q06
1.9
3.2
109
2.0
3.5
128
2.1
3.5
132
172%165%174%
3Q05 2Q06 3Q06
1.6%1.8%
1.6%
3Q05 2Q06 3Q06

13
Capitalization Ratio
Tier 1
Tier 2
TOTAL
Percentage Tier 1
3Q04 3Q05 3Q06
15.0%
3.2%
18.3%
82%
11.4%
3.8%
15.3%
75%
12.6%
2.3%
14.9%
84%

14
Million Pesos
Recovery Bank
Net Income
ASSETS UNDER MANAGEMENT
9M04
508
9M05
675
9M06
524
45 3617
2225
49
3Q03 3Q04 3Q05
Banorte
IPAB
6761 66
5
55
3Q06
60
Billion Pesos

15
New Products

16
Ya Bájale
50
9M05 9M06
THOUSANDS OF CLIENTSNumber
BALANCEMillIons of Pesos
33
51%
1,565
3Q05 3Q06
971
61%

17
Banorte Fácil
602
9M05 9M06
1,648
3Q05 3Q06
31889%
830 99%
THOUSANDS OF CLIENTSNumber
BALANCEMillIons of Pesos

18
Enlace Express
48
9M05 9M06
189
3Q05 3Q06
28
71%
9599%
THOUSANDS OF CLIENTSNumber
BALANCEMillIons of Pesos
Daily transactions in branches: 12,900
Amount paid daily: US $5.1 million
Amount per transaction: US $393

19
Mujer Banorte
112
9M05 9M06
2,399
3Q05 3Q06
46
143%
1,22296%
THOUSANDS OF CLIENTSNumber
BALANCEMillIons of Pesos

20
Créditos ProNegocio
33
9M05 9M06
545
3Q05 3Q06
10 230% 240127%
THOUSANDS OF CLIENTSNumber
BALANCEMillIons of Pesos

21
Recent Events

22
Recent Events
Merger of Banco del Centro (Bancen) and Banco Mercantil del Norte.
Placement of USD $600 million in non-convertible subordinated debt in two tranches
(October 13th):
USD 200 million of 15 Non Call 10 Tier 1 notes with a 6.862% yield.
USD 400 million of 10 Non Call 5 Tier II notes with a 6.135% yield.
Launching of the first 30-year fixed rate mortgage in the Mexican market, with a
minimum down payment of 5% and a fixed rate of 11.90%.
Opening of a back up computer center.
Payment of a Cash Dividend of $0.375 pesos per share (October 24th).
23
2. Stock Performance
24
80
90
100
110
120
130
140
150
160
De
c-0
5
Ja
n-0
6
Fe
b-0
6
Ma
r-0
6
Ap
r-0
6
Ma
y-0
6
Ju
n-0
6
Ju
l-0
6
Au
g-0
6
Se
p-0
6
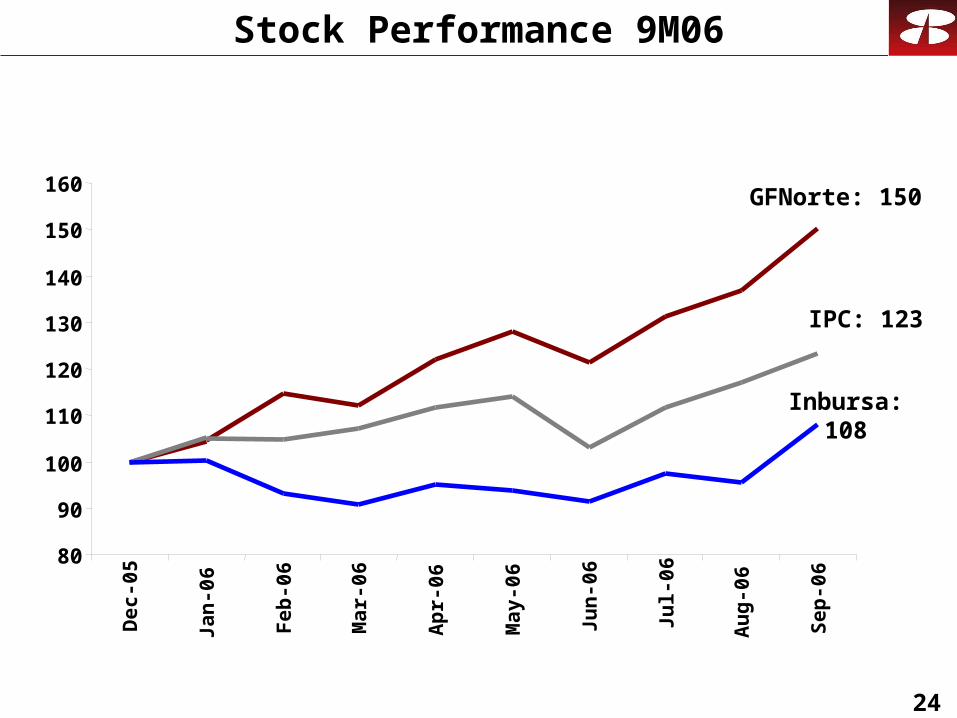
Stock Performance 9M06
IPC: 123
GFNorte: 150
Inbursa: 108

25
Stock’s Daily Turnover
Million dollars
9M03 9M04
2.2
5.2
9M05
7.3
9M06
13.2
CAGR 82%
26
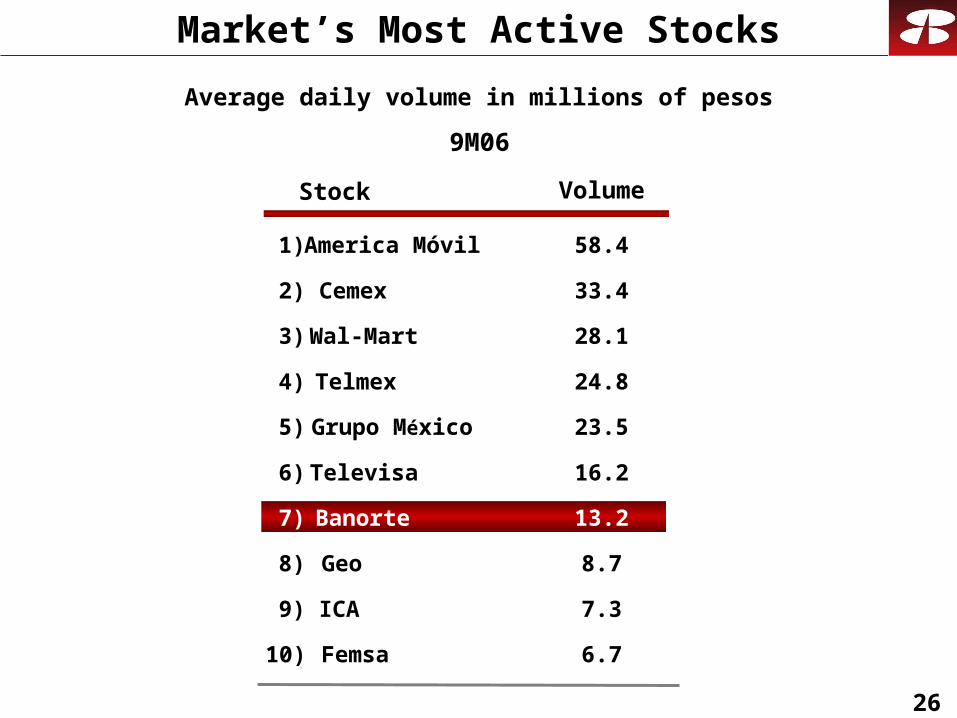
Market’s Most Active Stocks
Average daily volume in millions of pesos
9M06
Stock Volume
1) America Móvil 58.4
2) Cemex 33.4
3) Wal-Mart 28.1
4) Telmex 24.8
5) Grupo México 23.5
6) Televisa 16.2
7) Banorte 13.2
8) Geo 8.7
9) ICA 7.3
10) Femsa 6.7

27
Market Capitalization
Million dollars
6,364
3Q06
2,393
1,517
3Q03 3Q04
4,505
3Q05
CAGR 61%

28