1 a top-down approach to dynamically tune i/o for hpc ...€¦ · a top-down approach to...
TRANSCRIPT

A Top-Down Approach to Dynamically Tune I/O for HPC Virtualization
Ben Eckart1, Ferrol Aderholdt1, Juho
Yoo1, Xubin
He1,
and Stephen L. Scott2
1
Tennessee Technological University1
Oak Ridge National Laboratory2

Why HPC & VirtualizationVirtualization in HPC provides exciting possibilities:
-
Build the system according to application.-
Right weight kernels
-
Light weight kernels
-
Resilience via live migration.-
VM system migration
-
Migrate application
-
Dynamic job consolidation.-
Work load characterization
-
Interleave application work according to resources
2
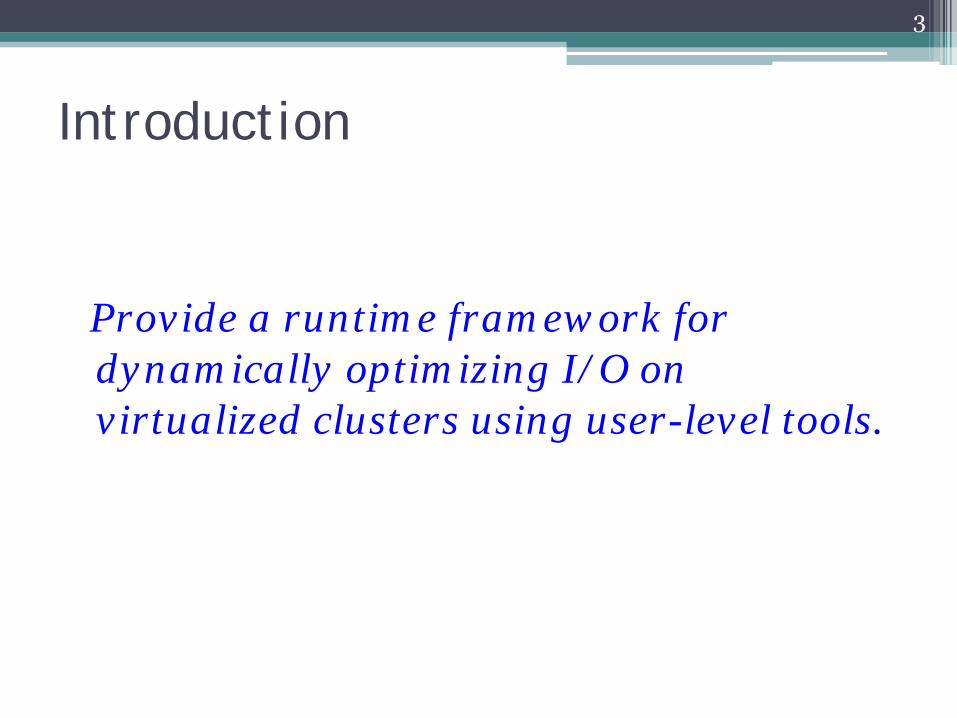
Introduction
Provide a runtime framework for dynamically optimizing I/O on virtualized clusters using user-level tools.
3
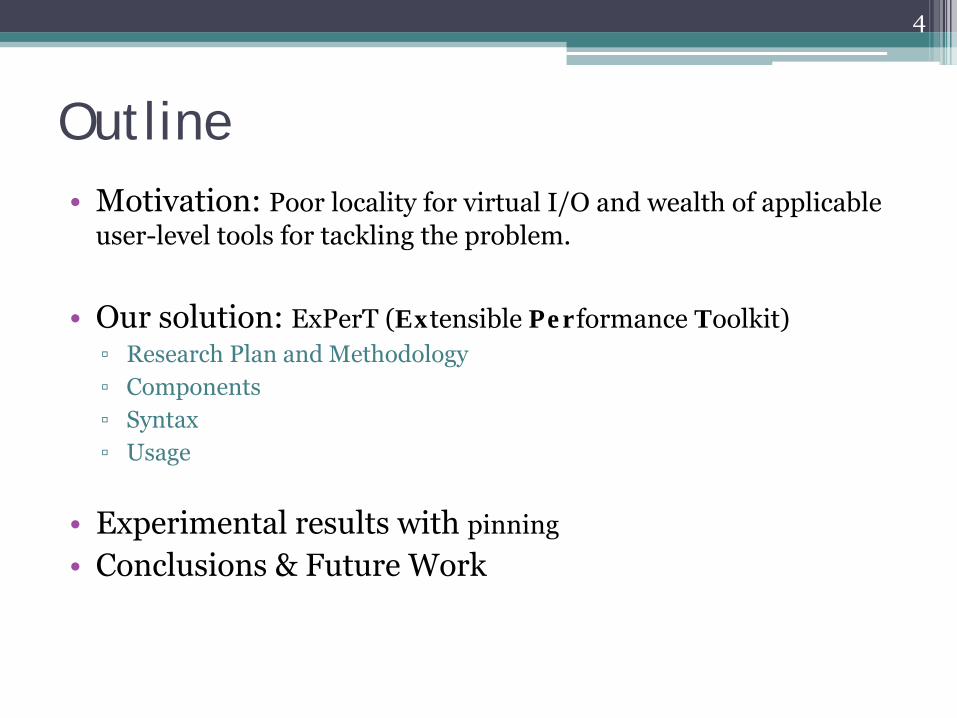
Outline•
Motivation: Poor locality for virtual I/O and wealth of applicable user-level tools for tackling the problem.
•
Our solution: ExPerT
(Extensible Performance Toolkit)▫
Research Plan and Methodology▫
Components▫
Syntax▫
Usage
•
Experimental results with pinning
•
Conclusions & Future Work
4

The Current state of the Art•
New technologies have decreased the overhead of virtualization.▫
According to recent studies, virtualization only provides roughly 2-4% overhead in compute-
bound scenarios.•
Intel and AMD have also provided hardware support to help boost performance at the CPU.
•
Virtualization platforms have been rapidly maturing and have gained acceptance in the IT and home sectors.
5

Motivation•
More work needs to be done that focuses on improving I/O performance within Virtual Machines.▫
Additionally, most work has focused on network I/O and not disk I/O.
•
This presents a problem in I/O bound applications in a High Performance Computing (HPC) environment where thousands of virtual machines (VMs) could be running on a limited number of compute nodes creating an I/O bottleneck.
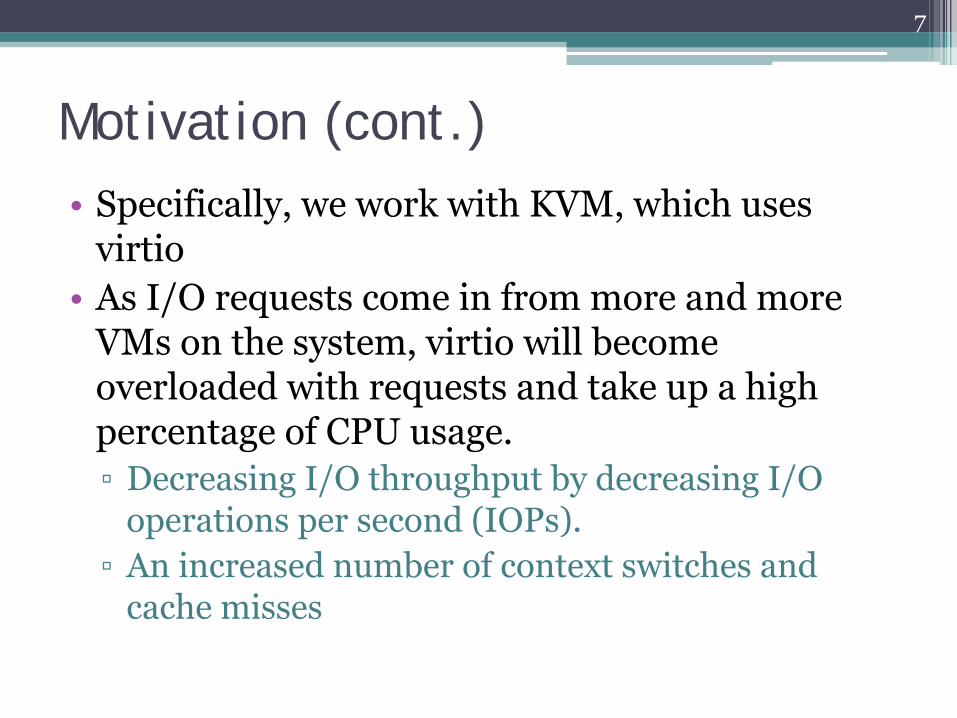
Motivation (cont.)•
Specifically, we work with KVM, which uses virtio
•
As I/O requests come in from more and more VMs
on the system, virtio
will become
overloaded with requests and take up a high percentage of CPU usage.▫
Decreasing I/O throughput by decreasing I/O operations per second (IOPs).
▫
An increased number of context switches and cache misses
7

Motivation (cont.)•
Virtualization causes large increases in cache misses
•
Order of magnitudes difference
8
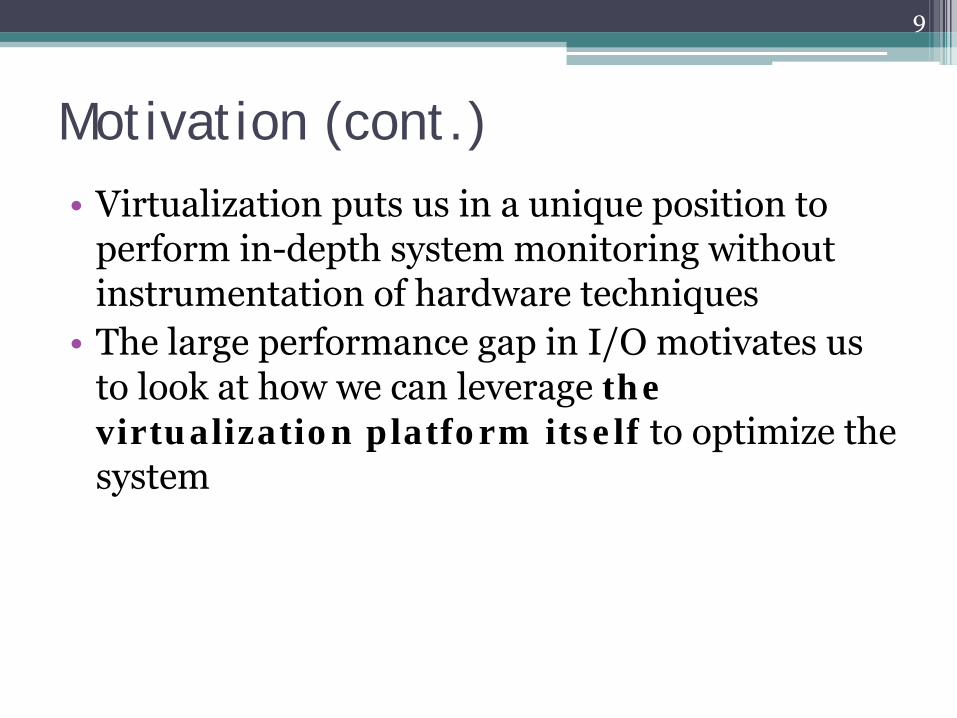
Motivation (cont.)•
Virtualization puts us in a unique position to perform in-depth system monitoring without instrumentation of hardware techniques
•
The large performance gap in I/O motivates us to look at how we can leverage the virtualization platform itself to optimize the system
9

Our Solution•
To alleviate the I/O bottleneck, we propose a testing and tuning framework with a combination of commonly found user-level tools in order to achieve greater performance.▫
The Extensible Performance Toolkit (ExPerT) is used in this work as it supports such a framework.
•
The methods under study are primarily the use of pinning
and prioritization. We focus on
pinning in this talk.
10
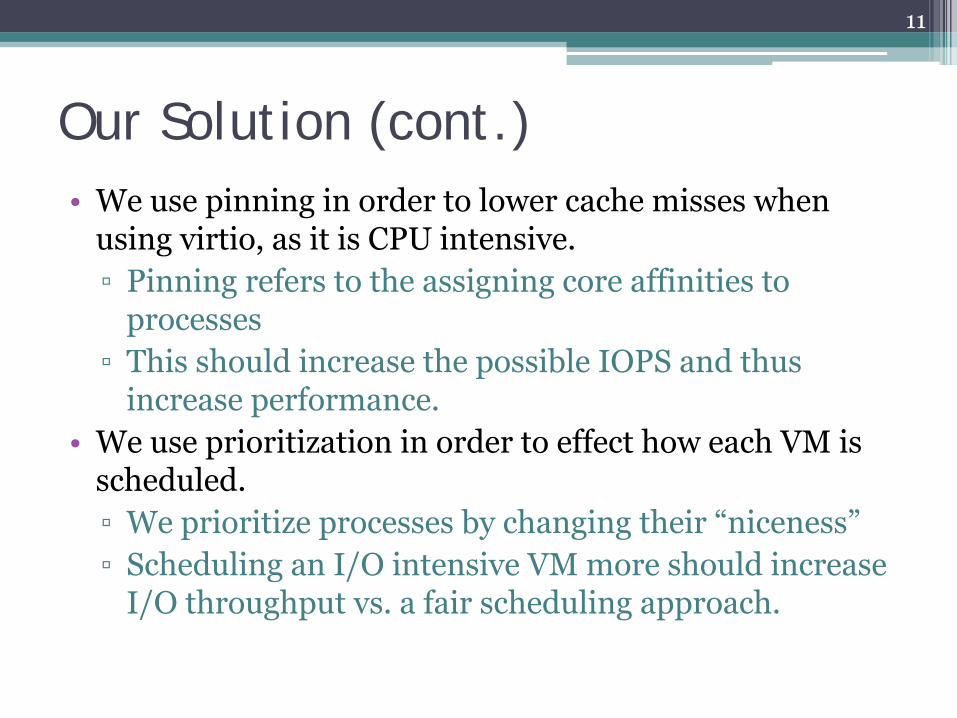
Our Solution (cont.)•
We use pinning in order to lower cache misses when using virtio, as it is CPU intensive.▫
Pinning refers to the assigning core affinities to processes
▫
This should increase the possible IOPS and thus increase performance.
•
We use prioritization in order to effect how each VM is scheduled.▫
We prioritize processes by changing their “niceness”
▫
Scheduling an I/O intensive VM more should increase I/O throughput vs. a fair scheduling approach.
11
Our Solution (cont.)•
We use pinning in order to lower cache misses when using virtio, as it is CPU intensive.▫
Pinning refers to the assigning core affinities to processes
▫
This should increase the possible IOPS and thus increase performance.
•
We use prioritization in order to effect how each VM is scheduled.▫
We prioritize processes by changing their “niceness”
▫
Scheduling an I/O intensive VM more should increase I/O throughput vs. a fair scheduling approach.
12
What is novel here?• Design of the runtime toolkit
• Methods of auto-tuning via user level
tools versus others that require kernel
level mods

Research Methodology •
We wish to look at the Kernel-based Virtual Machine (KVM) as it is more readily available to researchers since it is integrated in the main-line Linux kernel.▫
Simply loading a module loads the hypervisor.
▫
VMs
are deployed as processes•
User-level tools are used to both speedup development of this approach and to allow for the ease of reproducibility by other researchers.
13
ExPerT•
Distributed testing framework with a database backend, visualization, and test suite creation tools for virtual systems.
•
Updates its database in real-time.•
Closely integrates with Oprofile, vmstat, and the sysstat
suite of tools.
•
Uses a distributed object model.•
Support for automatic tuning and optimization.
14
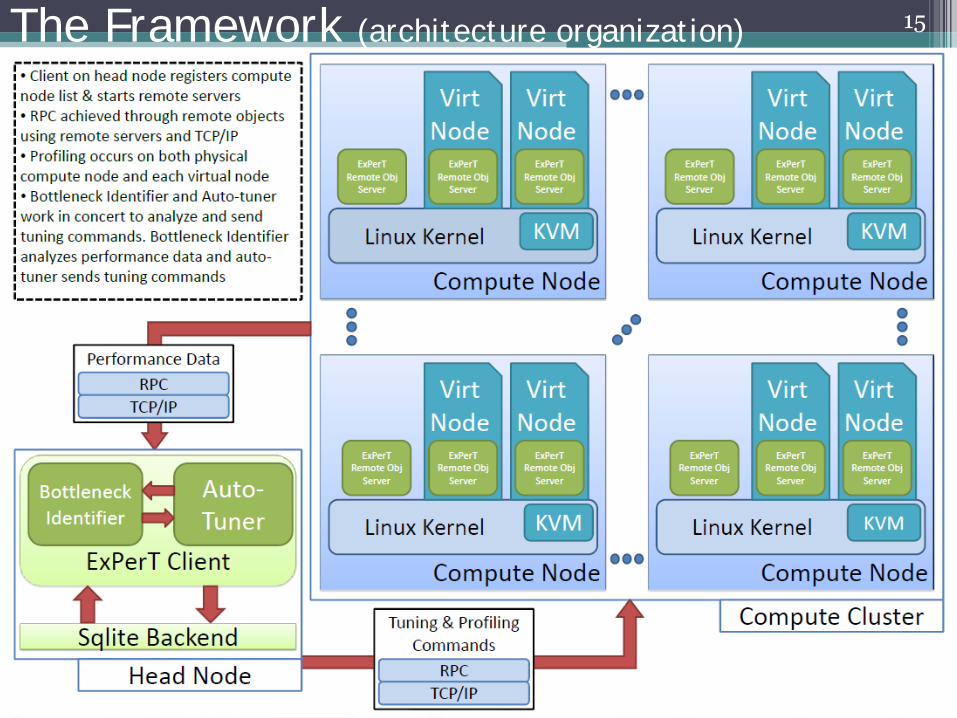
15The Framework (architecture organization)
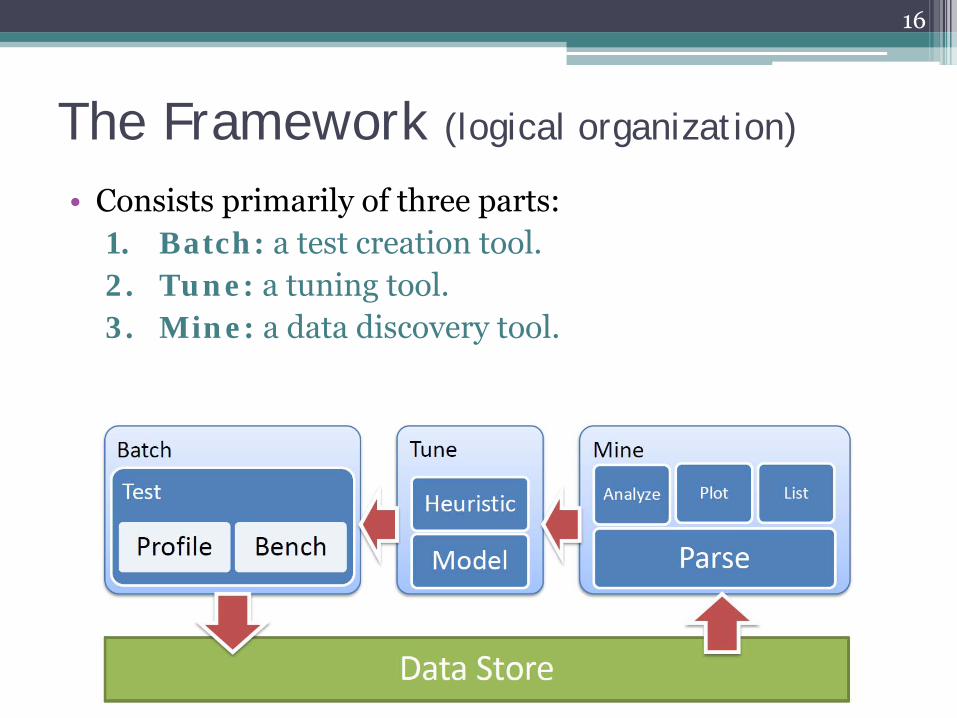
The Framework (logical organization)
•
Consists primarily of three parts:1. Batch: a test creation tool.2. Tune: a tuning tool.3. Mine: a data discovery tool.
16
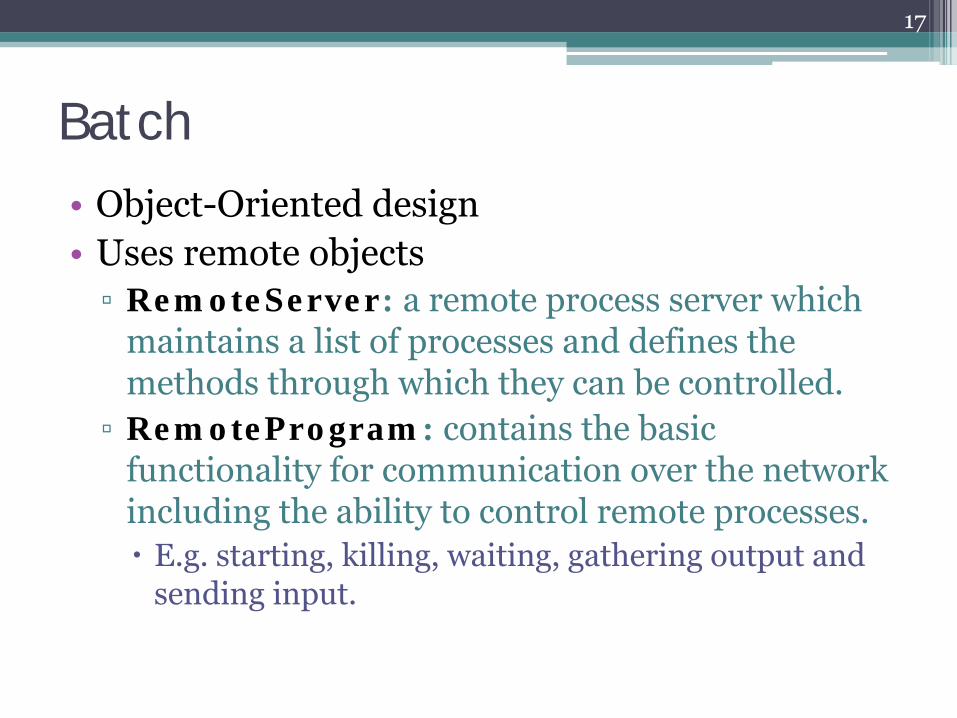
Batch•
Object-Oriented design
•
Uses remote objects▫
RemoteServer: a remote process server which maintains a list of processes and defines the methods through which they can be controlled.
▫
RemoteProgram: contains the basic functionality for communication over the network including the ability to control remote processes.
E.g. starting, killing, waiting, gathering output and sending input.
17

Mine•
Utilizes the results collected from the batch phase.▫
All results during the batch phase are not parsed and instead mine accomplishes this task.
•
Allows for the visualization of the results.▫
Through an interactive wizard
▫
Or through a declarative syntax similar to the configuration syntax
18

Mine (cont’d)•
Why does mine do the parsing and not batch?▫
Flexibility: our parser may change, losing or gaining attributes. Lazy parsing does not lock in past tests.
▫
Efficiency during: since we delay parsing, we save computation during the data collection process.
▫
Efficiency after: we can selectively parse out data as we need it (parse on demand).
▫
Lossless accounting: we can always look at raw output if we need it since parsing for attributes will necessarily remove data.
19

The Data Store•
A wrapper for sqlite
and is essential for making
the data coming into the database a standard format.
•
The general schema of the database consists of three tables:▫
A high-level batch table that lists saved batch results and short descriptions.
▫
A table that lists individual processes and their unique id within a batch.
▫
A table that lists raw process output, per line, for a uniquely identified process.
20

Syntax•
Listing various test cases for the system under study, we identified the commonality of the testing procedure between these different types of tests
•
From this, we derived a declarative syntax for quickly defining groups of tests.
21

Syntax (cont’d)•
Five general constructs are defined in our syntax:▫
A sequential command structure.
▫
A parallel command structure.▫
A process location mechanism.
▫
A method to define process synchronization.▫
A method for test aggregation across differing parameters
22
Syntax (cont’d)•
Each configuration file (set of batches) contains:▫
A section describing the cluster topology
▫
Sections declaring a set of related tests (batch)▫
Intra-sectional information includes:
Process handlesSpecial modifiers
Regular Expression handles.Range handles.Parallel and Sequential Identifiers.
A special “test” handle▫
Optional Comments
23
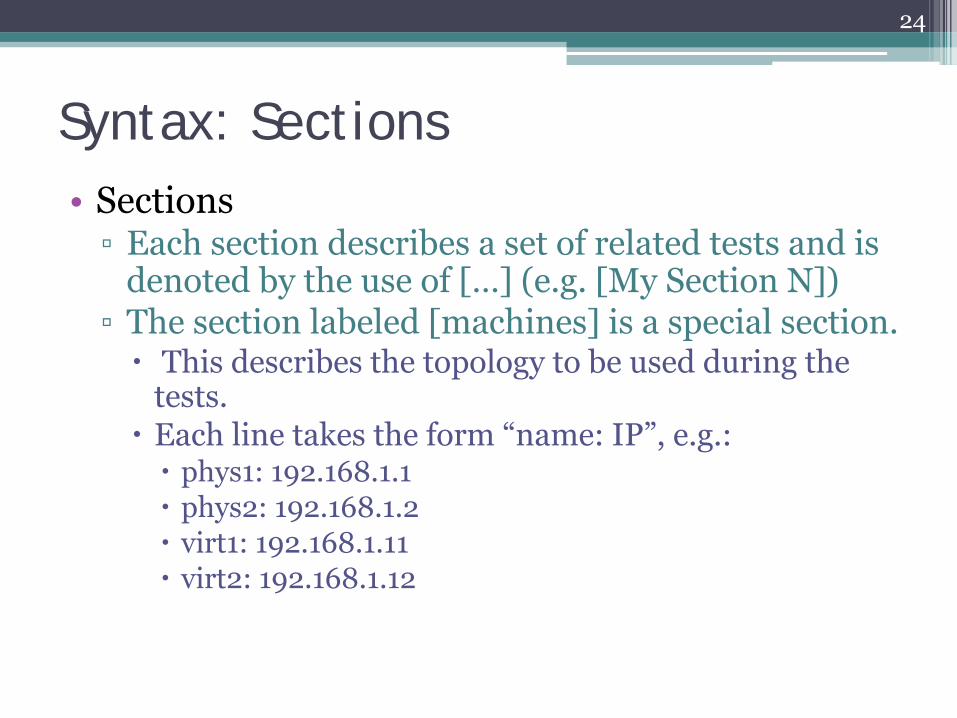
Syntax: Sections•
Sections▫
Each section describes a set of related tests and is denoted by the use of […] (e.g. [My Section N])
▫
The section labeled [machines] is a special section.This describes the topology to be used during the tests.Each line takes the form “name: IP”, e.g.:
phys1: 192.168.1.1phys2: 192.168.1.2virt1: 192.168.1.11virt2: 192.168.1.12
24

Syntax: Intra-sectional Information•
Need to describe “where”
and “what”
to do
•
The “where”
is given by the @ symbol in the form of “test@location(s)”▫
location is the handle or a regular expression matching the handles for the machine names in the machines section.
•
The first parameter is the “what”
parameter given from a handle declaration, giving the test to be run.
•
The test handle will specify the test to be run from the test declaration.
25

Syntax: Special modifiers•
Regular Expression Handles▫
If we wish to command all virtual machines v1,v2,v3,v4 to perform a task we could specify them by v* or v[1234] or v[1-4].
•
Range handle▫
range: start stop step (inclusive). ▫
When a range is needed, one can simply supply %d (printf
syntax) and it will automatically fill
in the batch with the range of values.
•
Parallel and Sequential Identifiers▫
The double bar || specifies parallel jobs (job1||job2||job3)▫
A space denotes sequential processes from left to right (job1 job2 job3)
•
Test handle▫
This key, value pair, (job@location) must exist once in each section or no test will occur.
•
Comments▫
Comments are string preceded by the symbols # or ;
26

Syntax: Example 1 – iterating across a parameter value•
We first define our topology with the [machines] section
•
We then define our first batch [Test 1: …
]
•
We employ four tags: start, range, prog, prof, test (range, test are special tags as discussed before)
•
The test line runs “start”
and
then “prog”
in parallel with
“prof”
at the designated
locations (via regex) over the set iterations defined in the range tag
27
[machines]# these names are arbitrary,# but should be named for easy grouping# via regular expressionsphys1: 192.168.1.1phys2: 192.168.1.2virt1: 192.168.1.11virt2: 192.168.1.12virt3: 192.168.1.21virt4: 192.168.1.22
[Test 1: running myApp 20 times, varying k]# sample progName: name argsstart: echo "starting test..."# run from 0 to 100 (inclusive), incr 5range: 0 100 5# run myApp with k parameter set to eachprog: myApp -k %dprof: myProfiler --init # profiling apptest: start@phys prog@virt||prof@phys
[Test 2: ... ]...

Syntax: Example 2 – scaling over multiple nodes•
We define our topology as before
•
We then define our batch [test of node scaling]
•
We define the application and profiler with the “myProg”
and “myProf”
tags
•
We run them in parallel utilizing the regex
syntax for
the location parameter•
The test will start out on one node (virt[1-1]) and end on virt[1-4]), performing a scaling test
28
[machines]# these names are arbitrary,# but should be named for easy grouping# via regular expressionsphys1: 192.168.1.1virt1: 192.168.1.11virt2: 192.168.1.12virt3: 192.168.1.21virt4: 192.168.1.22
[test of node scaling]range: 1 4 1 # scale up to 4 nodesmyProg: myApp2myProf: myProfiler --inittest: myProg@virt[1-%d]||myProf@phys1
Data Parsing•
The on-the-fly
data parsing is done from three
common steps:▫
A regular expression formulation of the desired output format.
▫
A label map corresponding to the regular expression group list.
▫
A type map corresponding to the data types to be found by the regular expression.
29
Data Parsing (cont’d)•
We can logically break up the flow
of the syntax into
a 5-tuple, (b, t, g, p, l). ▫
b is the batch ID, specifying which batch test we are performing.
▫
t is the test ID, specifying the particular test inside the batch.
▫
g is the group ID, specifying the sequential placement of a process in a test.
▫
p is the process ID.
▫
l is a line identifier
for individual process output.
•
Thus, our schema is a 5-dimensional (staggered) array
30

Data Parsing: Schema Example
31
start@phys prog@virt||prof@phys
Group 0 Group 1
Test k for k = 0 .. N
Batch 0
Process 0 to p -1 Process p to p + v - 1 Process p + v to 2p + v - 1
Assume: k is range parameter from 0 .. N, “p”
is # of physical nodes, “v”
is # of virtual nodes
Data Parsing: Putting it all together
•
Given a common results schema and known parsing expressions, we can▫
Graph results
▫
Calculate common statistical measures across multiple tests (max, min, avg, var, stddev)
▫
Use results within the Tune module for dynamic optimization
(e.g. if context switches jump more than 200% over a specified time quantum, apply policy X to process)
32
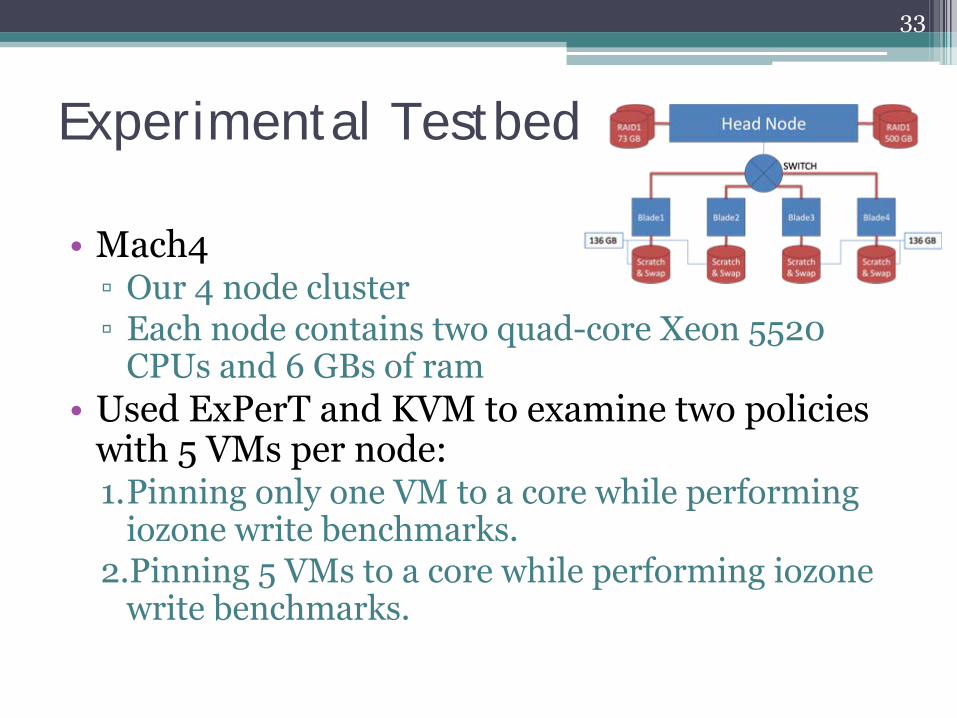
Experimental Testbed
•
Mach4▫
Our 4 node cluster
▫
Each node contains two quad-core Xeon 5520 CPUs and 6 GBs
of ram
•
Used ExPerT
and KVM to examine two policies with 5 VMs
per node:
1.Pinning only one VM to a core while performing iozone
write benchmarks.
2.Pinning 5 VMs
to a core while performing iozone write benchmarks.
33

Workflow•
A general workflow
consists of the following steps:
▫
Start virtual machines, and start the RemoteProcess
server on every node, physical and virtual (this may be a startup script).
▫
Create a configuration file specifying the batch test(s) to be run, the identification and tuning policies, and the machine map.
▫
Run Batch from the head node with the configuration file specified.
▫
(Optional) Run any of the post-mortem tools (Mine) for further analysis
34
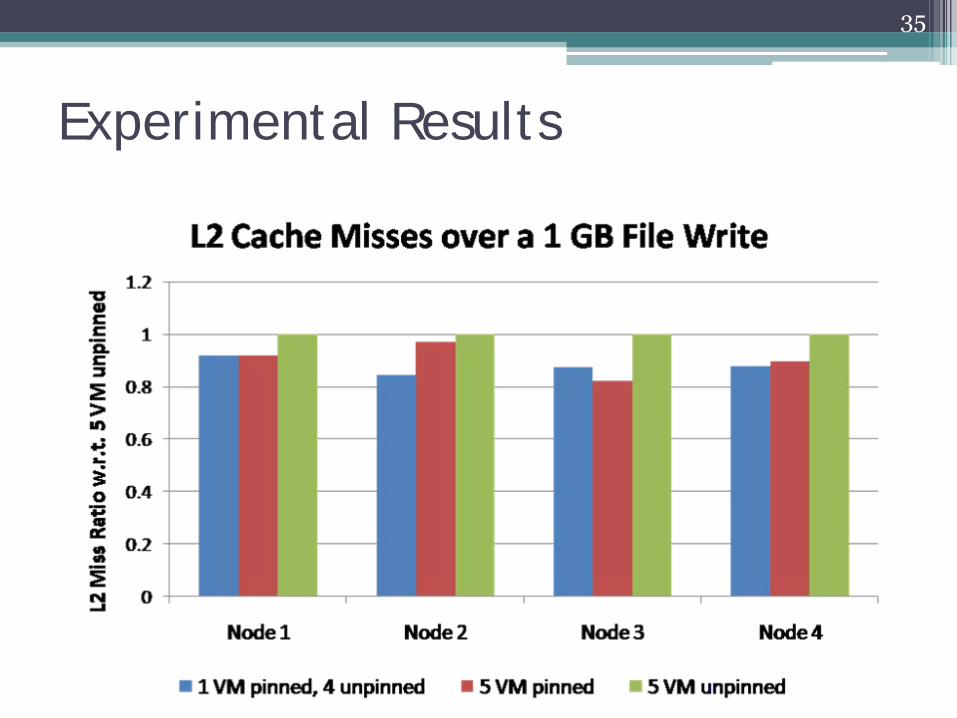
Experimental Results
35

Experimental Results
36
Pinning 1 VM seemed to be the more stable choice reducing L2 cache misses by around 15%.

Experimental Results
37
Pinning all 5 VMs seemed to give good results as well but it reduces L2 cache misses by up to 20% on one node.

Conclusions •
There are ways to alleviate the I/O bottleneck by using simple user-level tools.
•
In comparison to related work, we consider the use of such a toolset as “performance for free”
since we do not compromise portability by modifying the kernel, locking one into a particular platform, etc.
•
Through the pinning of VMs
it is possible to decrease L2 cache misses by up to 20%.
38
Future Work•
We wish to move to a more automated approach of self-optimization (using user-defined policies)
•
We would like to look towards using more lightweight protocols than TCP/IP for our remote objects usage for increased scalability.
•
We would like to investigate other methods of dynamically changing the properties of virtual machines to modify their performance.
39
Acknowledgments•
This work is sponsored by U.S. NSF under Grant No. CCF-0937850
40