1 abraham lincoln es, indianapolis # of students804 gradesk-5 % free / reduced57% % minority32%...
TRANSCRIPT

1
Abraham Lincoln ES, Indianapolis
# of Students 804
Grades K-5
% Free / Reduced 57%
% Minority 32%
Locale Large City
STRATEGIES
1. Math Computation
2. Reading Comprehension
3. Attendance
4. Character Builders
5. Parent Involvement
Performance Improvement
66.0 4.9
1

2
Attica Elementary School, Attica
# of Students 514
Grades K-6
% Free / Reduced 39%
% Minority 2%
Locale Small Town
STRATEGIES
1. Big Block Literacy
2. Attendance for Success
3. Safe & Disciplined Learning Enviornment
Performance Improvement
77.0 3.4
2

3
Break-o-Day Elementary, New Whiteland
# of Students 477
Grades 1-4
% Free / Reduced 45%
% Minority 11%
Locale Rural
STRATEGIES
1. Schoolwide Remediation
2. Parent Workshops
3. Bully Policy
4. Attendance Referral Policy
5. Personalized Learning SoftwarePerformance Improvement
81.8 1.4
3

4
Carlisle ES & Jr. High School, Carlisle
# of Students 310
Grades PK – 8
% Free / Reduced 47%
% Minority 3%
Locale Urban Fringe
STRATEGIES
1. Math Instruction
2. Science Instruction
3. Cooperative Learning
4. Parent Involvement
5. Technology Integration
6. Character EducationPerformance Improvement
70.2 2.6
4

5
Center for Inquiry, Indianapolis
# of Students n/a
Grades K-8
% Free / Reduced 66%
% Minority 66%
Locale Large City
STRATEGIES
InSAI
Planning
Year
Performance Improvement
79.7 3.7
5

6
Chandler Elementary School, Chandler
# of Students 636
Grades K-6
% Free / Reduced 42%
% Minority 4%
Locale Urban Fringe
STRATEGIES
1. After School Computers
2. Goal Setting for Life
3. KEYS (Reading Comp)
4. Standards for Mastery
5. TEAMS
Performance Improvement
82.3 1.1
6

7
Clinton Young Elem School, Indianapolis
# of Students 719
Grades K-5
% Free / Reduced 75%
% Minority 41%
Locale Large City
STRATEGIES
InSAI
Planning
Year
Performance Improvement
79.7 3.7
7

8
Cold Spring School, Indianapolis
# of Students 314
Grades K-8
% Free / Reduced 86%
% Minority 95%
Locale Large City
STRATEGIES
InSAI
Planning
Year
Performance Improvement
55.8 9.3
8

9
Creekside Elementary School, Franklin
# of Students 653
Grades K-5
% Free / Reduced 33%
% Minority 8%
Locale Rural
STRATEGIES
1. Learning Skills
2. Extra Help
3. Safety Squad
Performance Improvement
90.2 1.5
9

10
Edgar H. Evans Academy, Indianapolis
# of Students 192
Grades K-6
% Free / Reduced 87%
% Minority 92%
Locale Large City
STRATEGIES
InSAI
Planning
Year
Performance Improvement
55.9 6.0
10

11
Ernie Pyle School 90, Indianapolis
# of Students 345
Grades K-6
% Free / Reduced 86%
% Minority 81%
Locale Large City
STRATEGIES
InSAI
Planning
Year
Performance Improvement
62.2 16.4
11

12
Floro Torrence School 83, Indianapolis
# of Students 393
Grades K-6
% Free / Reduced 83%
% Minority 95%
Locale Large City
STRATEGIES
InSAI
Planning
Year
Performance Improvement
57.1 6.0
12

13
Francis W. Parker School 56, Indianapolis
# of Students 344
Grades K-8
% Free / Reduced 88%
% Minority 90%
Locale Large City
STRATEGIES
InSAI
Planning
Year
Performance Improvement
78.9 2.0
13

14
Fremont Middle School, Fremont
# of Students 401
Grades 5-8
% Free / Reduced 31%
% Minority 2%
Locale Rural
STRATEGIES
1. Differentiated Instruction
2. Consistent Behavior Plan
3. Safety Procedures
4. Parent Involvement
Performance Improvement
76.2 2.2
14
15
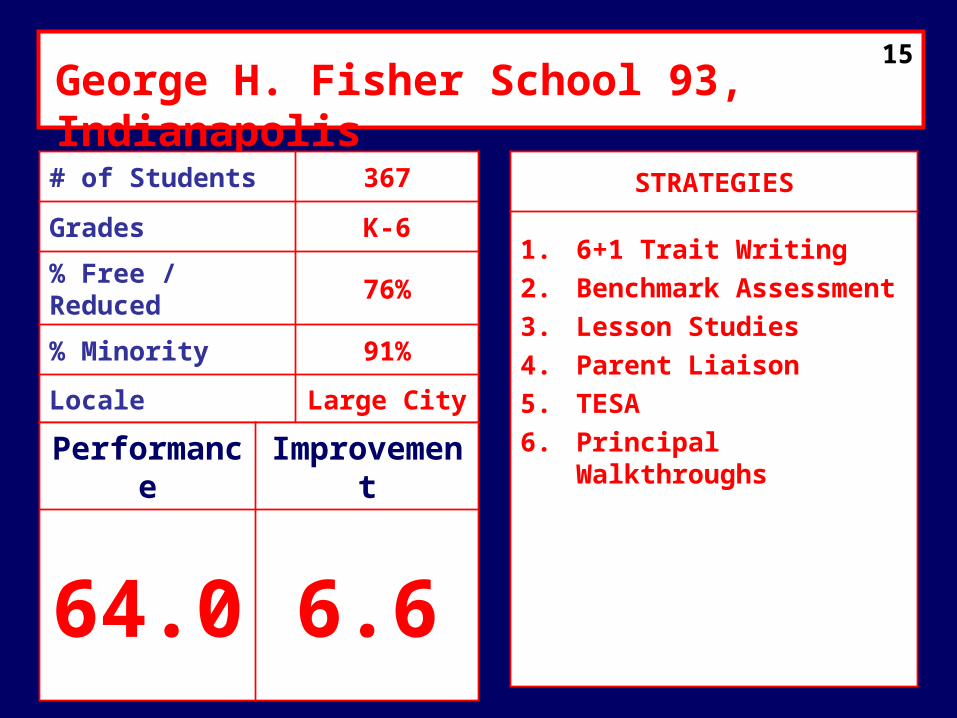
George H. Fisher School 93, Indianapolis
# of Students 367
Grades K-6
% Free / Reduced 76%
% Minority 91%
Locale Large City
STRATEGIES
1. 6+1 Trait Writing
2. Benchmark Assessment
3. Lesson Studies
4. Parent Liaison
5. TESA
6. Principal WalkthroughsPerformance Improvement
64.0 6.6
15

16
Grandview Elem School, Connersville
# of Students 359
Grades PK-6
% Free / Reduced 60%
% Minority 5%
Locale Small Town
STRATEGIES
InSAI
Planning
Year
Performance Improvement
77.5 5.6
16

17
Harriet B. Stowe Sch 64, Indianapolis
# of Students 325
Grades PK-6
% Free / Reduced 94%
% Minority 75%
Locale Large City
STRATEGIES
1. 6+1 Trait Writing
2. Benchmark Assessment
3. Lesson Studies
4. Parent Liaison
5. Principal Walkthroughs
6. Calendar Math
7. Common Planning Time
8. Critical Vocabulary
9. Fluency Program
10. Increase Social Services
11. Open Response Question
12. Power Writing
Performance Improvement
45.0 15.6
17

18
Hauser Jr-Sr High School, Hope
# of Students 548
Grades 7-12
% Free / Reduced 32%
% Minority 3%
Locale Rural
STRATEGIES
1. Extra Instruction
2. Mental Models
3. Mentor / SAP Program
4. Reading Initiative
Performance Improvement
73.8 3.0
18

19
Hazel H. Hendricks Sch 37, Indianapolis
# of Students 305
Grades K-6
% Free / Reduced 83%
% Minority 94%
Locale Large City
STRATEGIES
InSAI
Planning
Year
Performance Improvement
63.4 9.7
19

20
James A. Garfield Sch 37, Indianapolis
# of Students 804
Grades K-5
% Free / Reduced 95%
% Minority 32%
Locale Large City
STRATEGIES
InSAI
Planning
Year
Performance Improvement
71.0 3.6
20

21
Lanesville Elementary School, Lanesville
# of Students 327
Grades K-6
% Free / Reduced 18%
% Minority 6%
Locale Rural
STRATEGIES
1. Align Curriculum with State Standards
2. Standards Based Reporting
3. Lesson Design
4. Behavior ManagementPerformance Improvement
81.4 2.0
21

22
Lanesville Jr-Sr High School, Lanesville
# of Students 320
Grades 7-12
% Free / Reduced 13%
% Minority 4%
Locale Rural
STRATEGIES
1. Differentiated Instruction
2. Student-led Conferences
3. Bullying Prevention
4. Teacher Advisor Program
Performance Improvement
76.3 6.7
22

23
Laville Elementary School, Laville
# of Students 694
Grades K-6
% Free / Reduced 31%
% Minority 8%
Locale Rural
STRATEGIES
1. English Curriculum Alignment
2. Adopt-a-Student
Performance Improvement
81.0 5.9
23

24
Lew Wallace School 107, Indianapolis
# of Students 482
Grades K-6
% Free / Reduced 87%
% Minority 93%
Locale Large City
STRATEGIES
1. 6+1 Trait Writing
2. Benchmark Assessment
3. Lesson Studies
4. Parent Liaison
5. TESA
6. Principal Walkthrough
7. Early Childhood Prep.Performance Improvement
66.8 6.8
24

25
Lincoln Middle School, Logansport
# of Students 573
Grades 6-8
% Free / Reduced 44%
% Minority 24$
Locale Small Town
STRATEGIES
1. Frequent Assessment
2. Extra Help
3. Eng as New Language
4. Multi-Age Classroom
Performance Improvement
69.1 3.3
25

26
Lincoln Sr. High School, Cambridge City
# of Students 366
Grades 9-12
% Free / Reduced 29%
% Minority 1%
Locale Rural
STRATEGIES
1. English Curriculum Map
2. Writing Across Curric.
3. Learning Structure Instr.
4. Homeroom Help
5. Applied Skills Questions
6. Mentoring Program
7. Faculty Mentoring and Guidance
Performance Improvement
77.8 5.7
26

27
Louis B. Russell Jr. Sch 48, Indianapolis
# of Students 375
Grades PK-6
% Free / Reduced 92%
% Minority 94%
Locale Large City
STRATEGIES
InSAI
Planning
Year
Performance Improvement
66.3 10.9
27

28
New Harmony Elem & HS, New Harmony
# of Students 206
Grades PK-12
% Free / Reduced 33%
% Minority 2%
Locale Rural
STRATEGIES
1. Frequent Assessment
2. Student-led Conference
Performance Improvement
70.8 6.2
28

29
North Daviess Jr-Sr HS, Elnora
# of Students 492
Grades 7-12
% Free / Reduced 36%
% Minority 1%
Locale Rural
STRATEGIES
1. Getting Real
(student engagement)
2. Homework
a. Monitoring
b. Consequences
c. Parent notification
3. Teacher web-blogPerformance Improvement
77.1 2.0
29

30
Northview Middle School, Indianapolis
# of Students 783
Grades 6-8
% Free / Reduced 54%
% Minority 68%
Locale Large City
STRATEGIES
InSAIPlanning
Year
Performance Improvement
72.6 2.3
30

31
Orleans Jr-Sr High School, Orleans
# of Students 393
Grades 7-12
% Free / Reduced 35%
% Minority 2%
Locale Rural
STRATEGIES
1. Incentive Program
2. Peer Tutoring
3. Additional Career Major
(natural resources)
4. Activity Based Learning
5. Peer Tutoring
6. Parent InvolvementPerformance Improvement
73.8 2.1
31

32
Otwell Elementary School, Otwell
# of Students 209
Grades PK-5
% Free / Reduced 34%
% Minority 3%
Locale Rural
STRATEGIES
1. Curriculum alignment
2. Frequent assessment
3. Extra time / extra help
Performance Improvement
84.0 1.2
32

33
Pacers Academy, Indianapolis
# of Students 41
Grades 6-8
% Free / Reduced 73%
% Minority 71%
Locale Large City
STRATEGIES
InSAI
Planning
Year
Performance Improvement
26.0 6.6
33

34
Petersburg Elementary Sch., Petersburg
# of Students 464
Grades PK-5
% Free / Reduced 37%
% Minority 2%
Locale Small Town
STRATEGIES
1. Curriculum Alignment
2. Benchmark Tests
3. Transitional First Grade
4. Distance Learning
5. Group Guidance
6. Monthly Writing Prompts
7. Parent CommunicationPerformance Improvement
80.4 4.6
34

35
Pike Central High School, Petersburg
# of Students 670
Grades 9-12
% Free / Reduced 29%
% Minority 1%
Locale Rural
STRATEGIES
1. Curriculum alignment
2. Specialized Concentration in ISTEP Competencies
3. Tutoring in Core Subject Areas (with transportation)
4. Effective Writing
5. Personal Ed. Plan (PEP)
6. Distance Learning
7. Community Alliance Refining Education
Performance Improvement
76.5 6.9
35

36
Pike Central Middle School, Petersburg
# of Students 477
Grades 6-8
% Free / Reduced 36%
% Minority 2%
Locale Rural
STRATEGIES
1. Quarterly Assessments
2. After School Tutoring
3. Student Attendance
Performance Improvement
71.4 3.2
36

37
Ralph Waldo Emerson 58, Indianapolis
# of Students 287
Grades K-6
% Free / Reduced 87%
% Minority 58%
Locale Large City
STRATEGIES
1. 6+1 Trait Writing Model
2. Benchmark Assessment
3. Lesson Studies
4. Parent Involvement
5. Principal Walkthrough
Performance Improvement
74.5 6.5
37
38
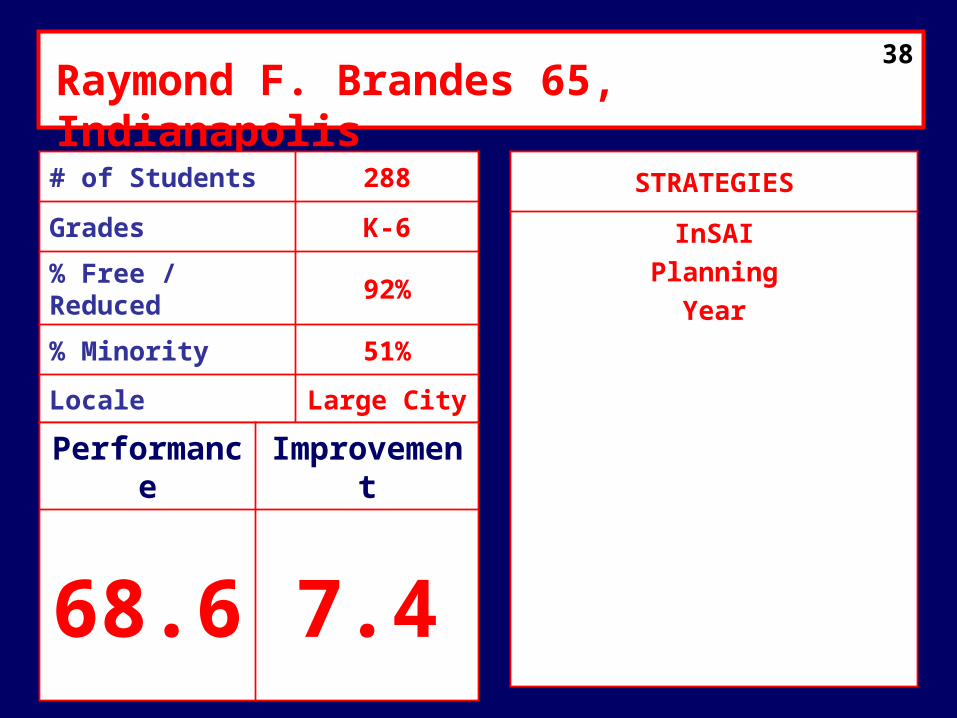
Raymond F. Brandes 65, Indianapolis
# of Students 288
Grades K-6
% Free / Reduced 92%
% Minority 51%
Locale Large City
STRATEGIES
InSAI
Planning
Year
Performance Improvement
68.6 7.4
38

39
Riverside School 44, Indianapolis
# of Students 386
Grades PK-6
% Free / Reduced 94%
% Minority 78%
Locale Large City
STRATEGIES
1. 6+1 Writing Trait Model
2. Benchmark Assessments
3. Lesson Studies
4. Parent Involvement
5. Principal Walkthroughs
6. District Attendance Policy
7. Rules / Discipline Policy
8. Math Problem Solving
9. Use Computers / Internet
10. Career Day
Performance Improvement
59.5 5.5
39

40
Rousseau McClellan Sch 91, Indianapolis
# of Students 453
Grades K-8
% Free / Reduced 61%
% Minority 69%
Locale Large City
STRATEGIES
InSAI
Planning
Year
Performance Improvement
81.1 9.4
40

41
Rushville Elementary School, Rushville
# of Students 780
Grades PK-6
% Free / Reduced 46%
% Minority 6%
Locale Small Town
STRATEGIES
1. Schoolwide Focus on Standards
2. Early Bird Study Time
3. Four Blocks – First Grade
4. Building Blocks
Performance Improvement
72.1 3.4
41

42
Sawmill Woods ES, New Whiteland
# of Students 490
Grades K-1
% Free / Reduced 37%
% Minority 10%
Locale Urban Fringe
STRATEGIES
1. Diagnostic Testing in the Classroom
2. Remediation / Enrichment for Students
3. Faculty Sharing of Best Practices
4. Summer Skills Packet
5. Building Parent Involvement
Performance Improvement
81.8 1.4
42

43
Shortridge Middle School, Indianapolis
# of Students 786
Grades 7-8
% Free / Reduced 80%
% Minority 89%
Locale Large City
STRATEGIES
InSAI
Planning
Year
Performance Improvement
60.5 4.8
43

44
South Whitley Elem Sch, South Whitley
# of Students 474
Grades PK-5
% Free / Reduced 25%
% Minority 2%
Locale Rural
STRATEGIES
1. Differentiated Instruction
2. Tutoring Program
Performance Improvement
81.6 2.8
44

45
Taylor Intermediate School, Kokomo
# of Students 248
Grades 4-5
% Free / Reduced 40%
% Minority 16%
Locale Rural
STRATEGIES
1. After School Homework
2. Friday School Program
3. Focus on Math Facts
4. Reinforce Reading Comp
5. Summer Packets
6. Mentoring Program
7. Personal & Class Goals
8. Parent Involvement
Performance Improvement
76.7 4.6
45

46
Tell City Junior High School, Tell City
# of Students 373
Grades 6-8
% Free / Reduced 35%
% Minority 2%
Locale Small Town
STRATEGIES
1. Student Success Process – Remediation
2. Remediation Software
3. Schoolwide Writing
4. Schoolwide Essay Contest
5. Accelerated Reading / Reading Renaissance
6. Reading Across the Curriculum
7. Gender Specific Classes
8. Teacher Mentoring / Buddy Program
Performance Improvement
77.9 2.7
46

47
Theodore Potter Sch 74, Indianapolis
# of Students 337
Grades K-6
% Free / Reduced 85%
% Minority 73%
Locale Large City
STRATEGIES
InSAI
Planning
Year
Performance Improvement
67.0 10.1
47

48
Timothy Johnson Academy, Fort Wayne
# of Students 224
Grades K-8
% Free / Reduced 92%
% Minority 98%
Locale Mid City
STRATEGIES
1. Behavior Management
2. Clear Definition of Indiana State Standards
3. Technology in the Classroom
Performance Improvement
26.2 7.0
48

49
Union Elementary School, Modoc
# of Students 254
Grades K-6
% Free / Reduced 50%
% Minority 1%
Locale Rural
STRATEGIES
1. Extra Help During Recess
2. Extended Day Kindergarten
3. Hands On Lessons
4. Study Guides / Review Activities
Performance Improvement
74.2 2.2
49

50
Washington Irving Sch 14, Indianapolis
# of Students 643
Grades PK-6
% Free / Reduced 92%
% Minority 78%
Locale Large City
STRATEGIES
InSAI
Planning
Year
Performance Improvement
66.8 4.4
50

51
Webb Elementary School, Franklin
# of Students 405
Grades K-5
% Free / Reduced 37%
% Minority 7%
Locale Urban Fringe
STRATEGIES
1. Seven Keys to Reading Comprehension
2. Power Writing
3. Experience Corps / Tutoring
Performance Improvement
79.5 6.1
51

52
West Side Jr. High School, East Chicago
# of Students 497
Grades 7-8
% Free / Reduced 92%
% Minority 97%
Locale Urban Fringe
STRATEGIES
1. After School Tutoring in Math
2. After School Tutoring in Writing
3. After School Book Club
4. Perfect Attendance IncentivesPerformance Improvement
58.0 6.1
52

53
Whiteland Elementary School, Whiteland
# of Students 572
Grades 2-4
% Free / Reduced 33%
% Minority 8%
Locale Urban Fringe
STRATEGIES
1. After School Tutoring
2. Differentiated Instruction
3. Summer Packet with Parent Information
4. Community Circles (Team Building Discussions)
5. Using Technology for Instruction
Performance Improvement
80.2 1.0
53

54
William Tell Elementary School, Tell City
# of Students 718
Grades PK-5
% Free / Reduced 45%
% Minority 5%
Locale Rural
STRATEGIES
1. Science Alignment with Standards
2. Science & Literature Interdisciplinary Initiative
3. 6+1 Traits Writing Model
4. Accelerated Math – extend to 1st Grade
5. Student Success Process (assessment and remediation)
Performance Improvement
74.2 2.9
54

55
Winchester Village ES, Indianapolis
# of Students 538
Grades K-5
% Free / Reduced 78%
% Minority 41$
Locale Large City
STRATEGIES
InSAI
Planning
Year
Performance Improvement
69.1 7.6
55

56
Woodlawn Elementary School, Monticello
# of Students 247
Grades K-5
% Free / Reduced 56%
% Minority 19%
Locale Small Town
STRATEGIES
InSAI
Planning
Year
Performance Improvement
74.0 3.2
56