1 august-september/2002. 2 agenda abamec bradesco 2001 historical performance main events...
TRANSCRIPT

1
August-September/2002August-September/2002
2
AgendaAgenda
ABAMEC Bradesco 2001ABAMEC Bradesco 2001
Historical PerformanceHistorical Performance
Main Events Main Events
Competitive AdvantagesCompetitive Advantages
ManagementManagement CharacteristicsCharacteristics
PerspectivesPerspectives

3
Creating Value to our ShareholdersCreating Value to our Shareholders
R$ 849 million of Interest on Own Capital / Dividends related to 2001 fiscal year (41% of adjusted Net Income)
Acquisitions - Mercantil de São Paulo, BEA and Cidade, Ford’s Loan Portfolio, Deutsche Asset Management, and Postal Bank
Transparency - 2001 Atlantic Rating Award(Retail Bank Category)
320 Meetings and Conferences Organized by the IR Area
NYSE - Listing on November 21st, 2001 (BBD)
Integration of Back-Offices
4
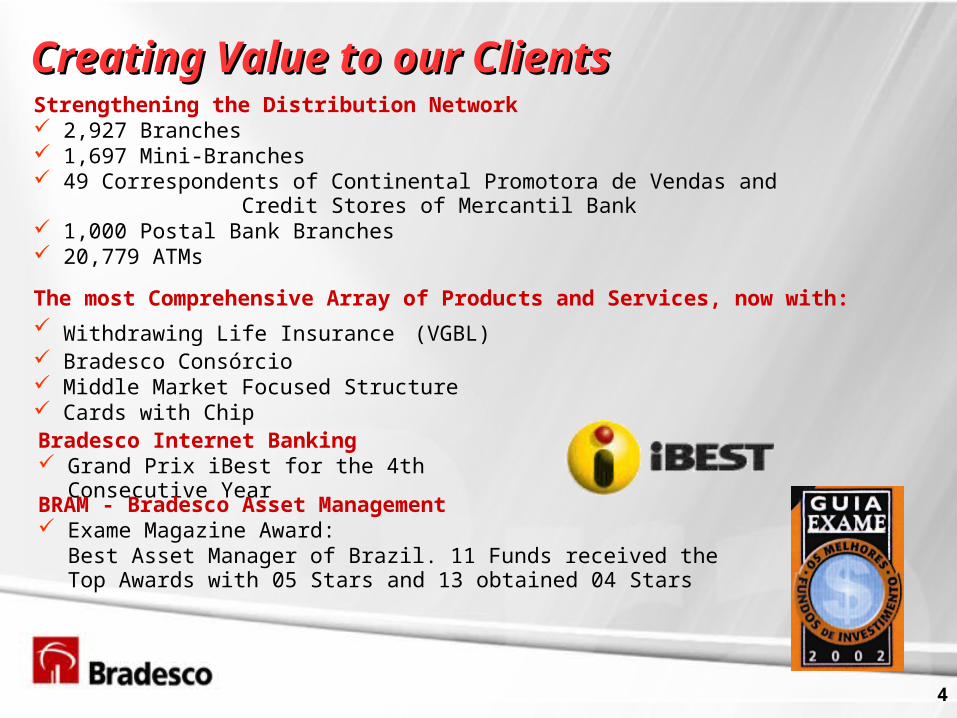
CreatCreatinging Value to our Value to our ClientsClientsStrengthening the Distribution Network 2,927 Branches 1,697 Mini-Branches 49 Correspondents of Continental Promotora de Vendas and
Credit Stores of Mercantil Bank 1,000 Postal Bank Branches 20,779 ATMs
The most Comprehensive Array of Products and Services, now with: Withdrawing Life Insurance (VGBL) Bradesco Consórcio Middle Market Focused Structure Cards with ChipBradesco Internet Banking Grand Prix iBest for the 4th Consecutive Year
BRAM - Bradesco Asset Management Exame Magazine Award:
Best Asset Manager of Brazil. 11 Funds received the Top Awards with 05 Stars and 13 obtained 04 Stars

5
Creating Value to our EmployeesCreating Value to our Employees
In 2000, We were Elected one of the 100 Best Companies to Work for in Brazil by Exame Exame MagazineMagazine.
2001, We were Elected Again.
2002, We were Elected Once More.
In 2001, Bradesco spent R$ 3.4 billion in Salaries, Benefits and Training.

6
CreatCreatinging Value to the Society Value to the Society
R$ 112.1 millionR$ 112.1 million Invested in 2001
R$ 119.8 millionR$ 119.8 million Forecasted for 2002
455 thousand455 thousand Undergraduate Students were qualified by Bradesco Foundation during the past 45 years
103 thousand103 thousand Students admitted in 2001, of which 90% are members of the community
7
AgendaAgenda
ABAMEC Bradesco 2001ABAMEC Bradesco 2001
Historical Historical Performance Performance
Main Events Main Events
Competitive AdvantagesCompetitive Advantages
ManagementManagement Characteristics Characteristics
PerspectivesPerspectives

8
Total AssetsTotal Assets
Historical PerformanceHistorical Performance
RR$ Billions$ Billions
CAGR = 16.3%
124.5124.5
101.8101.8
84.084.0
76.976.968.068.0
5050
6060
7070
8080
9090
100100
110110
120120
130130
1H 981H 98 1H 991H 99 1H 001H 00 1H 011H 01 1H 021H 02

9
Securities PortfolioSecurities Portfolio
37.937.935.535.5
29.729.7
23.223.2
14.014.0
30.4%34.9%
35.3%30.2%
20.6%
10
20
30
40
50
1H 98 1H 99 1H 00 1H 01 1H 02
10
20
30
40
50
Securities Portfolio % of Total Assets
Historical PerformanceHistorical Performance
RR$ Billions$ Billions
10
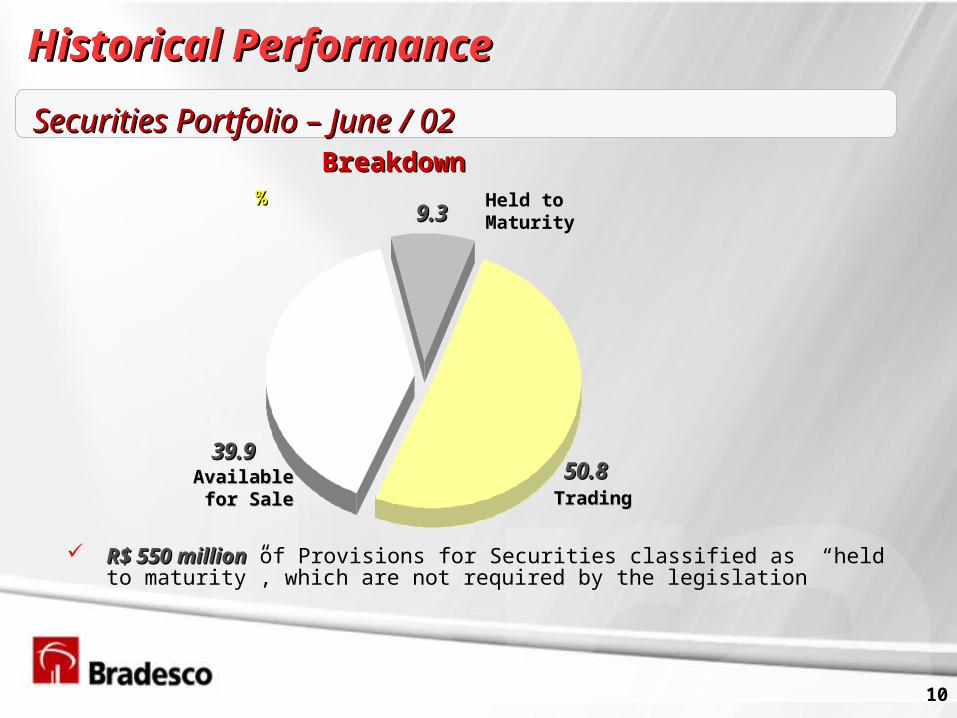
R$ 550 millionR$ 550 million of Provisions for Securities classified as “held to maturity”, which are not required by the legislation
Securities Portfolio – June / 02Securities Portfolio – June / 02
50.850.8
9.39.3
39.939.9
Held to Maturity
TradingTradingAvailableAvailable
for Salefor Sale
BreakdownBreakdown%%
Historical PerformanceHistorical Performance

11
(*) Includes Investments on Quotes of Mutual Funds
36.336.3
26.926.9
33.533.531 to 180 days31 to 180 days
More than 360 daysMore than 360 days
1 to 30 days1 to 30 days
Maturity (*)Maturity (*)
3.33.3181 to 360 days181 to 360 days
%%
Securities Portfolio – June / 02Securities Portfolio – June / 02
Historical PerformanceHistorical Performance

12
Loan Portfolio *Loan Portfolio *
* Excludes Sureties and Guaranties (R$ 3.4 billion as of June / 02)
52.652.6
43.843.8
30.630.6
26.226.225.025.0
43.0%
36.4%34.1%
36.7% 42.2%
20
30
40
50
60
1H 98 1H 99 1H 00 1H 01 1H 0220
30
40
50
Loan Portfolio % of Total Assets
R$ BillionsR$ Billions
Historical PerformanceHistorical Performance
13
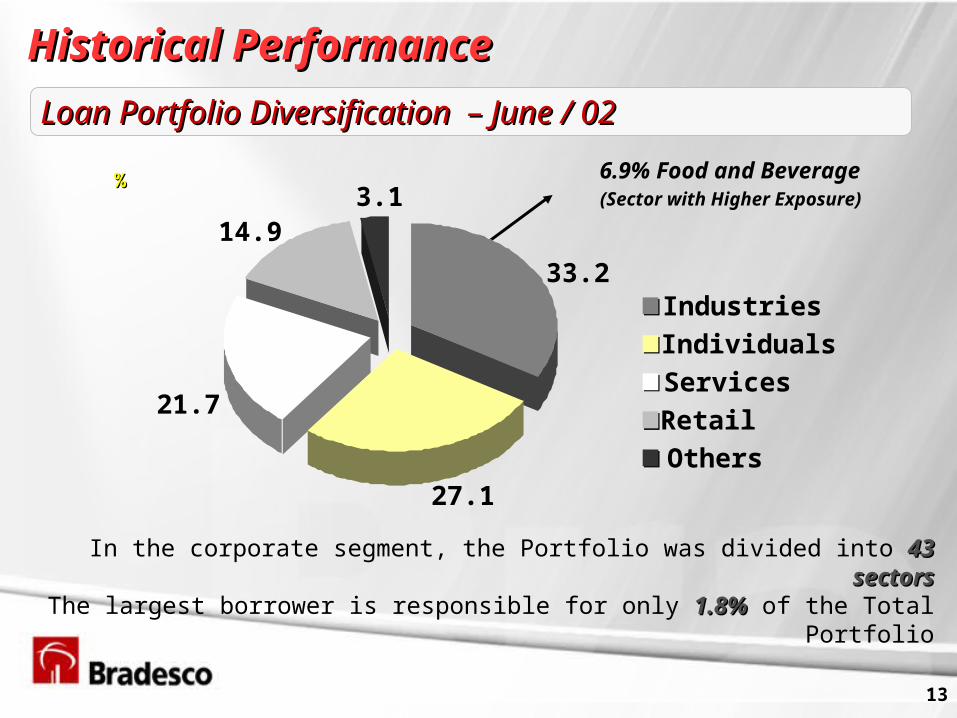
Loan Portfolio Diversification – June / 02Loan Portfolio Diversification – June / 02
In the corporate segment, the Portfolio was divided into 43 sectors43 sectorsThe largest borrower is responsible for only 1.8%1.8% of the Total Portfolio
6.9% Food and Beverage (Sector with Higher Exposure)
33.2
3.114.9
21.7
27.1
IndustriesIndividualsServicesRetailOthers
% %
Historical PerformanceHistorical Performance

14
Total Provisions cover 114.3%114.3% of Past Due and Falling Due Loans over 60 days
The Excess of Provisions for Loans amounts R$ 289 millionR$ 289 million
Asset QualityAsset Quality
9.9
90.1
9.3
90.7
8.9
91.1
1H 00 1H 01 1H 02
D - H
AA - C
%%
Historical PerformanceHistorical Performance
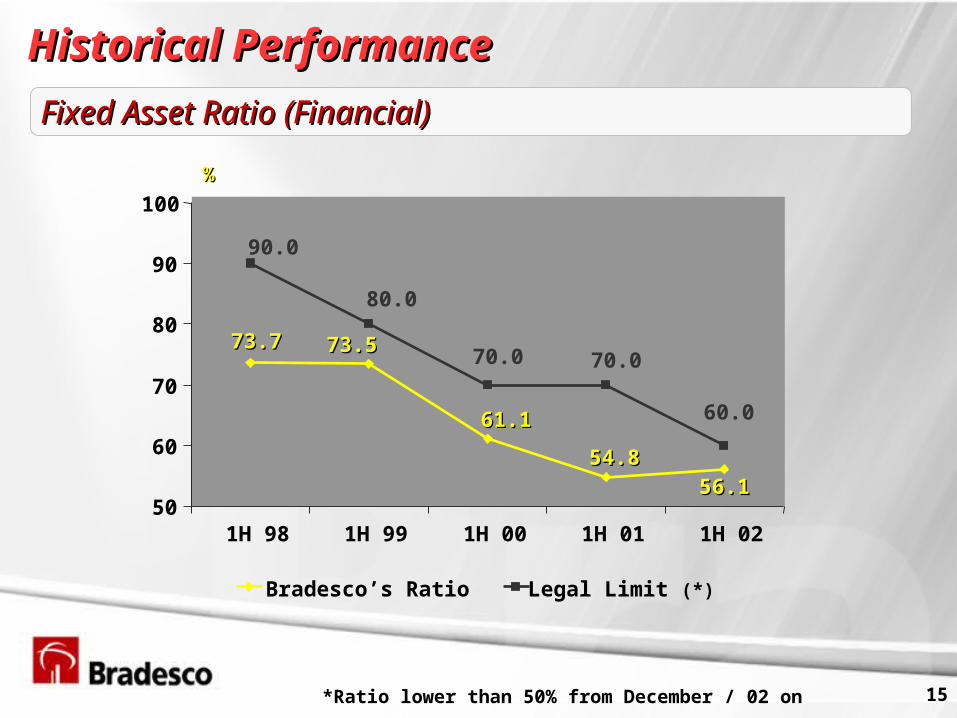
15*Ratio lower than 50% from December / 02 on
Fixed Asset Ratio (Financial)Fixed Asset Ratio (Financial)
56.156.154.854.8
61.161.1
73.573.573.773.770.0 70.0
60.0
80.0
90.0
50
60
70
80
90
100
1H 98 1H 99 1H 00 1H 01 1H 02
Bradesco’s Ratio Legal Limit (*)
%%
Historical PerformanceHistorical Performance

16
DepositsDeposits
50.850.8
36.936.933.633.634.134.1
26.926.9
6.6 7.1 10. 05.75.0
18.918.917.517.517.117.117.317.314.814.8
0
10
20
30
40
50
60
1H 98 1H 99 1H 00 1H 01 1H 02
Total Demand Savings Accounts
R$ BillionsR$ Billions
CAGR = 17.2%
Historical PerformanceHistorical Performance

17
On the 2nd Quarter 2002, Deposits increased by R$ 4.9 billionR$ 4.9 billion, of which R$ 3.5 billionR$ 3.5 billion migrated from Asset Management
Breakdown of Deposits – June / 02Breakdown of Deposits – June / 02
42.8
0.3
37.2
19.7
Time
Savings Accounts
Demand
Interbank
%%
Historical PerformanceHistorical Performance
18
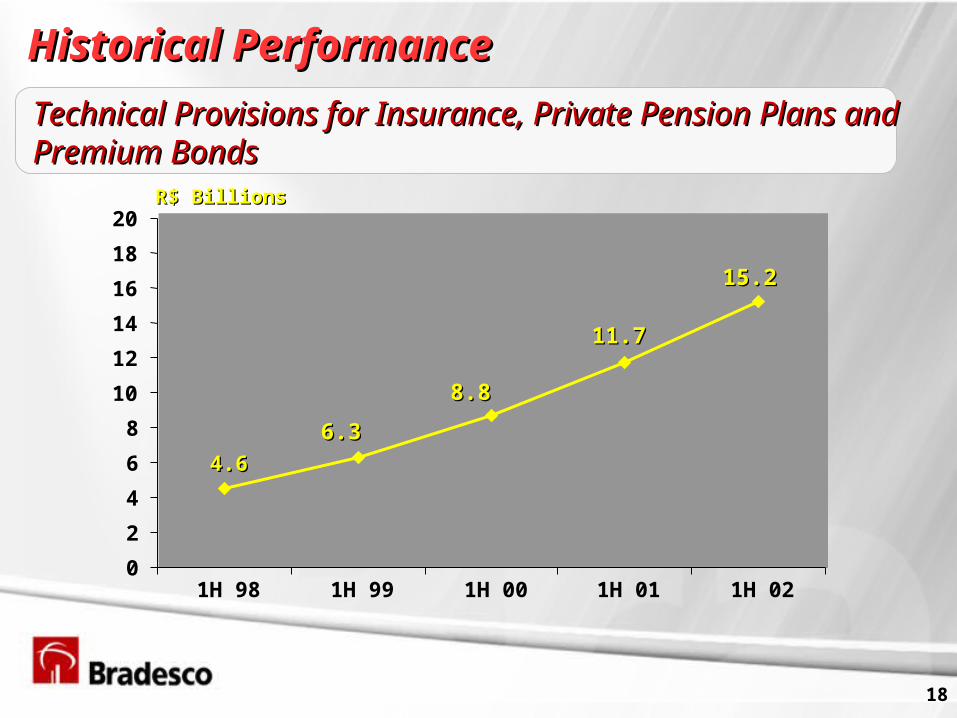
Technical Provisions for Insurance, Private Pension Technical Provisions for Insurance, Private Pension Plans and Premium BondsPlans and Premium Bonds
15.215.2
11.711.7
8.88.8
6.36.34.64.6
0
2
4
6
8
10
12
14
16
18
20
1H 98 1H 99 1H 00 1H 01 1H 02
R$ BillionsR$ Billions
Historical PerformanceHistorical Performance

19
Stockholders’ EquityStockholders’ Equity
R$ BillionsR$ Billions
10.110.19.19.1
7.07.06.86.86.16.1
0
5
10
15
1H 98 1H 99 1H 00 1H 01 1H 02
Historical PerformanceHistorical Performance

20
17.117.116.516.5
14.114.113.413.4
14.7*14.7*
10
11
12
13
14
15
16
17
18
1S 98 1S 99 1S 00 1S 01 1S 02
*Tier I: 12.2% Tier II: 2.5%
BIS Ratio (Financial)BIS Ratio (Financial)
%%
Legal Limit (Brazil)Legal Limit (Brazil)
Historical PerformanceHistorical Performance

21
Recurring Net IncomeRecurring Net Income
904904
1,0421,042
606606
461461431431
200
400
600
800
1,000
1,200
1H 98 1H 99 1H 00 1H 01 1H 02
R$ MillionsR$ Millions
Historical Historical Performance Performance

22
Recurring ROE (Annualized)Recurring ROE (Annualized)
%%
18.718.7
24.124.1
19.019.0
14.014.014.614.6
10
15
20
25
30
1H 98 1H 99 1H 00 1H 01 1H 02
Historical PerformanceHistorical Performance

23
Recurring ROA (Annualized)Recurring ROA (Annualized)
%%
1.51.5
2.12.1
1.41.4
1.21.21.31.3
1.0
1.5
2.0
2.5
1H 98 1H 99 1H 00 1H 01 1H 02
Historical PerformanceHistorical Performance

24
Operating Expenses / Average AssetsOperating Expenses / Average Assets
4.04.0
3.33.3
3.63.63.53.5
3.23.2
2.0
2.5
3.0
3.5
4.0
4.5
5.0
1H 98 1H 99 1H 00 1H 01 1H 02
%%
Historical PerformanceHistorical Performance

25
Efficiency Ratio (Recurring)Efficiency Ratio (Recurring)
56.656.6
53.553.5
58.558.5
55.655.6 55.355.3
50
52
54
56
58
60
1H 98 1H 99 1H 00 1H 01 1H 02
%%
Historical PerformanceHistorical Performance

26
Insurance GroupInsurance Group
95.495.4
99.499.4100.7100.7
106.7106.7
89.389.3
96.995.9
91.9
98.2
91.9
86
90
94
98
102
106
110
1S 98 1S 99 1S 00 1S 01 1S 02
Combined Ratio - International
Extended Combined Ratio
%%
Historical PerformanceHistorical Performance

27
Insurance, Private Pension PlansInsurance, Private Pension Plans,, and Premium Bondsand Premium Bonds
1H 011H 01 1H 02 1H 02
Auto/RCF
Health
Life and Private Pension Plans
Premium Bonds
R$ 724 million
R$ 989 million
R$ 1.50 billion
R$ 485 millionR$ 1.29billion
+10.8%
+15.3%
+28.0%
ChangeChange
Result R$ 324 million +6.5%
VGBL (Launched on March / 02): 47,767participants and sales of R$ 476 million
Provisions:
R$ 802 million
R$ 1.14 billion
R$ 1.92 billion
R$ 422 millionR$ 1.37 billion
R$ 345 million
-13.0%+6.2%
28
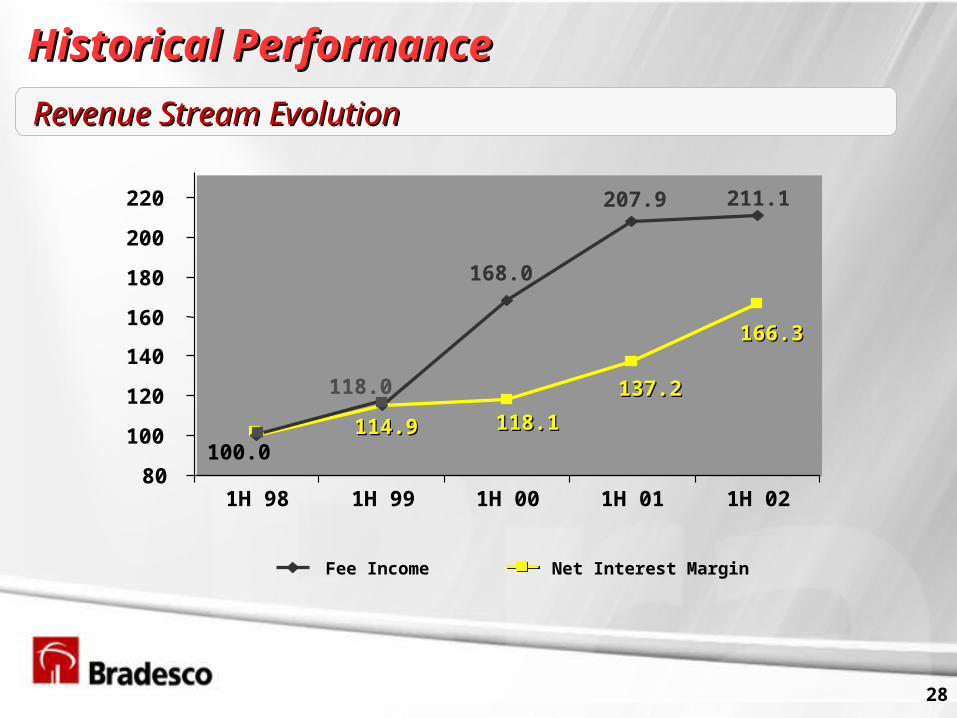
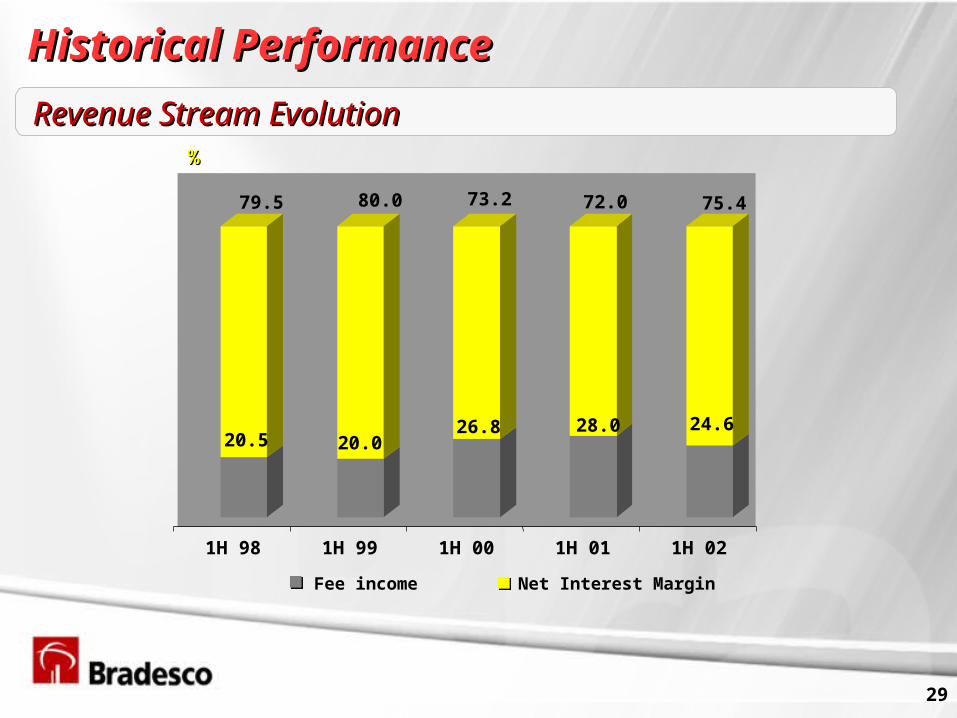
Revenue Stream EvolutionRevenue Stream Evolution
211.1207.9
168.0
114.9114.9 118.1118.1
137.2137.2
166.3166.3
118.0
80
100
120
140
160
180
200
220
1H 98 1H 99 1H 00 1H 01 1H 02
100.0
Fee Income Net Interest Margin
Historical PerformanceHistorical Performance
29
Historical PerformanceHistorical Performance
20.5
79.5
20.0
80.0
26.8
73.2
28.0
72.0
24.6
75.4
1H 98 1H 99 1H 00 1H 01 1H 02
Fee income Net Interest Margin
Revenue Stream EvolutionRevenue Stream Evolution%%

30
Cash GenerationCash Generation
3.63.63.53.5
2.82.8
3.63.6
2.22.2
0
1
2
3
4
5
1H 98 1H 99 1H 00 1H 01 1H 02
R$ BillionsR$ Billions
Historical PerformanceHistorical Performance
31
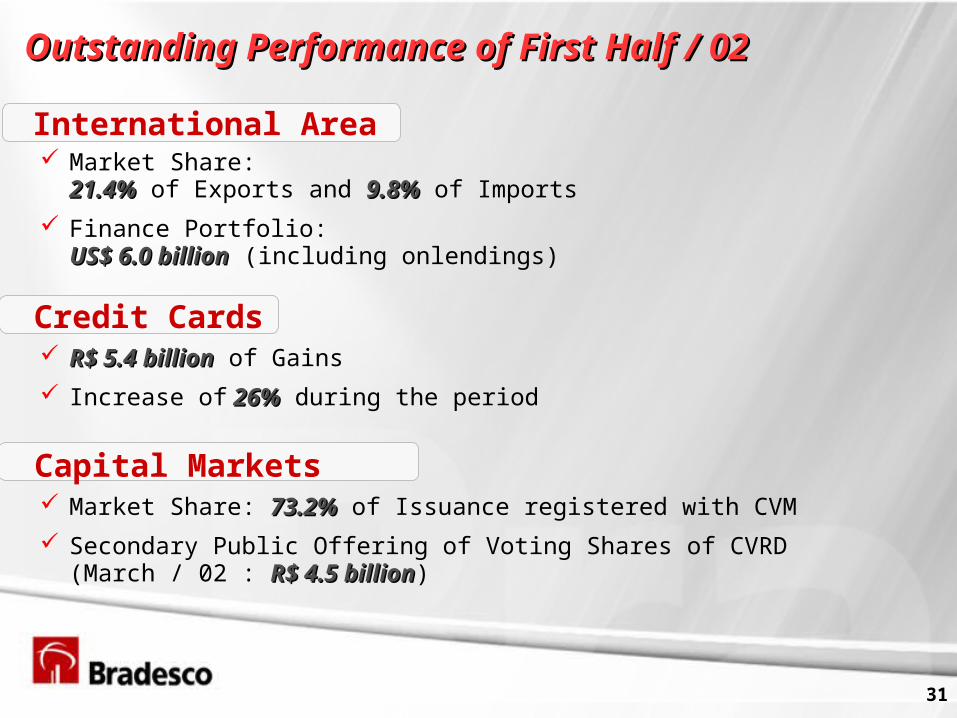
Outstanding Performance of First Half / 02Outstanding Performance of First Half / 02
International Area Market Share:
21.4%21.4% of Exports and 9.8%9.8% of Imports
Finance Portfolio: US$ 6.0 billionUS$ 6.0 billion (including onlendings)
Credit Cards R$ 5.4 billionR$ 5.4 billion of Gains
Increase of 26% 26% during the period
Capital Markets Market Share: 73.2%73.2% of Issuance registered with CVM
Secondary Public Offering of Voting Shares of CVRD (March / 02 : R$ 4.5 billionR$ 4.5 billion)

32
AgendaAgenda
ABAMEC Bradesco 2001ABAMEC Bradesco 2001
Historical PerformanceHistorical Performance
Main Events Main Events
Competitive AdvantagesCompetitive Advantages
ManagementManagement Characteristics Characteristics
PerspectivesPerspectives

33
34
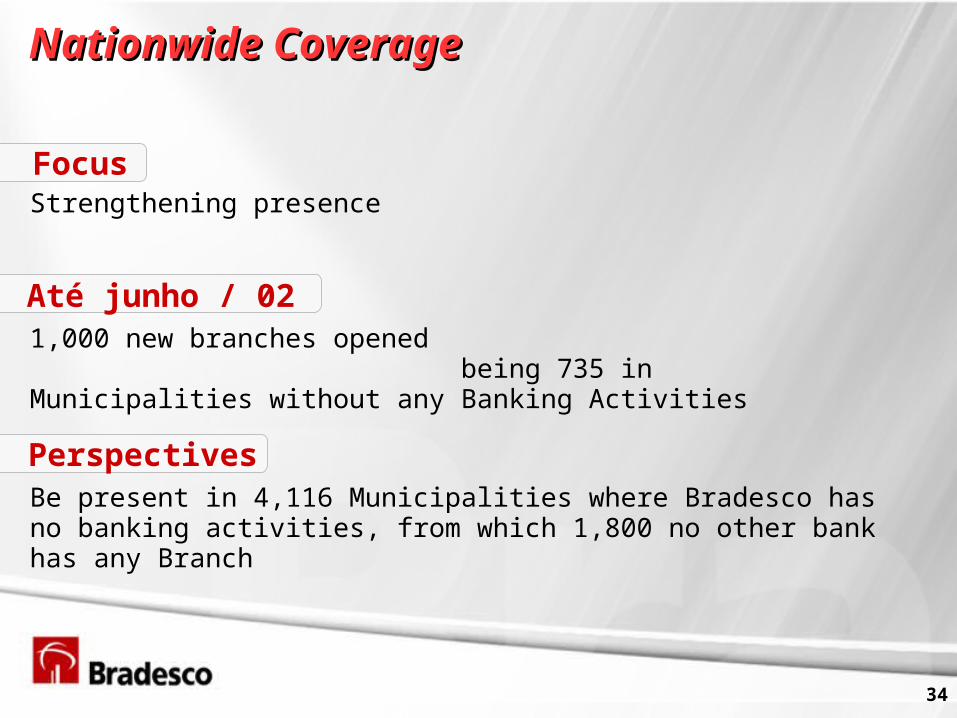
Nationwide CoverageNationwide Coverage
FocusStrengthening presence
Até junho / 021,000 new branches opened being 735 in Municipalities without any Banking Activities
PerspectivesBe present in 4,116 Municipalities where Bradesco has no banking activities, from which 1,800 no other bank has any Branch

35
Bradesco
36
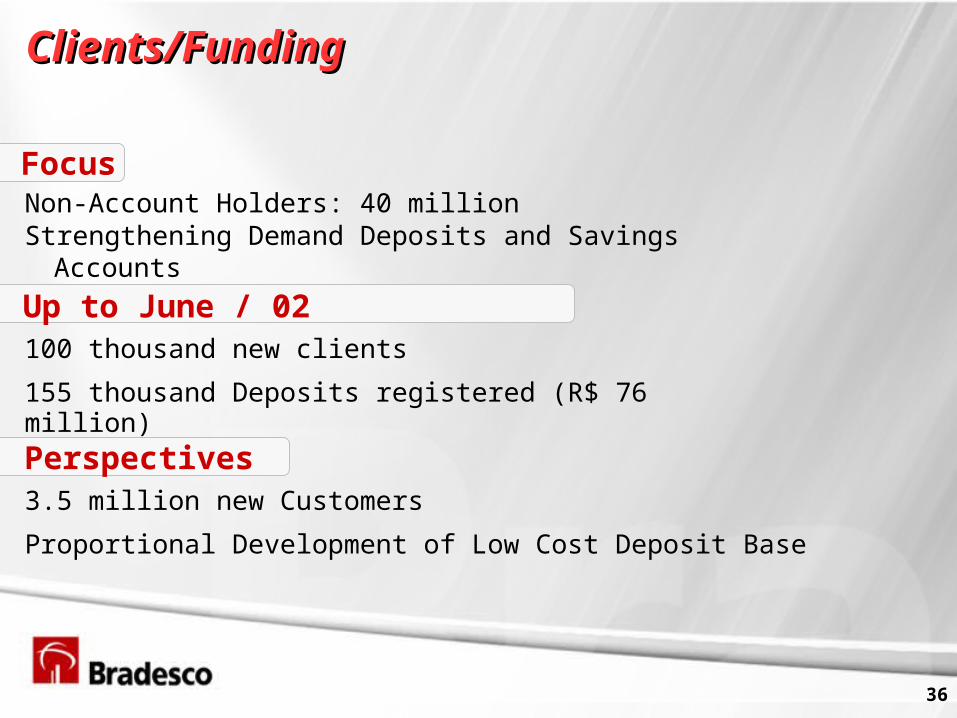
Clients/FundingClients/Funding
FocusNon-Account Holders: 40 millionStrengthening Demand Deposits and Savings Accounts
Up to June / 02100 thousand new clients
155 thousand Deposits registered (R$ 76 million)
Perspectives3.5 million new Customers
Proportional Development of Low Cost Deposit Base

37
EfficiencyEfficiency
FocusTo reduce the cost of a new Bradesco Branch, representing at least R$ 150 thousand for a Instore Branch
Up to / 02Initial Cost for Opening 5,299 Branches stood at R$ 200 million
Perspectives2,000 Branches on the 2nd Half
Targeting of High Net Worth Individuals in Regions that are not explored by Banks
Finding Prospect Regions / Potential Markets
Fostering the Local Economy
Other Benefits

38

39
Banco Mercantil de São PauloBanco Mercantil de São PauloFocusAcquisition of differentiated Client Base and the FINASA brandSynergy GainsStrengthening presence in the Automobile Financing Industry
Up to June / 02The Evolution of Client Base in June (725 thousand 87% Individuals)17 Departments and Areas have already been IntegratedLoan Portfolio reaches R$ 1.1 Billion
PerspectivesStrengthening the utilization of the brand FINASA and the sales of products, particularly the Insurance Related ones
Increase in Scale
Increase in Market Share

40
41
AgendaAgenda
ABAMEC Bradesco 2001ABAMEC Bradesco 2001
Historical PerformanceHistorical Performance
Main Events Main Events
Competitive AdvantagesCompetitive Advantages
Management CharacteristicsManagement Characteristics
PerspectivesPerspectives

42
Program of Goals
Sales Sales ManagementManagement
ClientsClients
Loyalty&
Retention
The points are
accounted just in
case of
Excellence of
Customer
Satisfaction
BusinessesBusinesses ResultsResults Customer Customer SatisfactionSatisfaction
Funding
Cards
Insurance
Life &Private
Pension Plans
Annuities
Efficiency Ratio
Revenue Growth
Loans Recoveries
Balanced Performance Index
23 goals23 goals have to be followed by the 22 Regional Directors 22 Regional Directors and their related Branches
GDAD:GDAD: A System of Evaluation and Planning the Budget of Bradesco

43
Where, How Much and How the Bank Gains
ABC System MethodologyABC System Methodology(Activity-Based Costing)(Activity-Based Costing)
Identifies and Clusters Activities Related to the Processes
Allocates Costs to the Activities Accordingto Demanded Resources
Turning Departments into Results Centers
Costs Costs ManagementManagement

44
Risk Risk ManagementManagementCredit Risk
Credit Granting
BranchesCredit
Department
Daily Credit
Committee
ExecutiveCredit
Committee
Credit Score
Up to R$ 6 million
Between R$ 6 and 20 million
Over R$ 20 million
45
Market Risk
The VaR (Value at Risk) boundaries are specified by the Management and their compliance are checked on a daily basis by an area which is independent of the Securities Portfolio Management
The Methodology used to estimate the VaR has a Confidence Level of 97.5%97.5%
The volatilities and correlations of the models are validated on a daily basis by using the backtesting methodology. They are estimated through a statistics basis
The Gap Analysis is performed on a daily basis
Risk Risk ManagementManagement

46
Risks inherent to the activities that support businesses related to data processing and communication, transmission, and registration of data electronically
Business Disruption Systems Fail Errors Omissions Frauds External Events
Auditing Committee composed by members of the Management and the Board
Operating Risk
Risk Risk ManagementManagement

47
Controls the Mismatches of Maturity of Assets and Liabilities
A Group of Controlling Tools Permanently Evaluates the Positions Accepted
Liquidity Risk
Risk Risk ManagementManagement

48
R$ Millions
Adjusted Stockholders’ Equity
Total Risk Weighted Assets
Weighted Assets
Weighted Compensation Accounts
BIS RatioBIS Ratio
11,594
79,143
76,540
2,603
14.65%14.65%
Capital Risk
Financial Consolidated
Risk Risk ManagementManagement

49
AgendaAgenda
ABAMEC Bradesco 2001ABAMEC Bradesco 2001
Historical PerformanceHistorical Performance
Main Events Main Events
Competitive AdvantagesCompetitive Advantages
Management CharacteristicsManagement Characteristics
PerspectivesPerspectives

50
Competitive AdvantagesCompetitive Advantages
Retail BankRetail Bank
Service BankService Bank
High Net Worth High Net Worth BankBank
Private BankPrivate Bank
(Bradesco Private)(Bradesco Private)
Corporate BankCorporate Bank(Bradesco Corporate(Bradesco Corporate)) ClientsClients
Distribution NetworkDistribution Network
TechnologyTechnology
Middle Market BankMiddle Market Bank(Bradesco Empresas)(Bradesco Empresas)

51
Professional Management, which Possesses a Vast Experience, in addition to Entrepreneurial Spirit
The Most Extensive portfolio, Providing Individuals and Companies with Insurance, Private Pension Plans, and Annuities
Solid Financial Structure, in addition to a Leadership Positioning in the Main Insurance and Banking Segments
Bradesco is a Bradesco is a Financial Conglomerate withFinancial Conglomerate with::

52
Bradesco Seguros has more than over 67 years of Experience
Bradesco, BCN, and Mercantil Distribution Network
8.5 million Insurance Customers
Approximately 23,000 Independent Brokers
Works as a Bankinsurance Works as a Bankinsurance Conglomerate...Conglomerate...

53
The Most Extensive Array of The Most Extensive Array of Services...Services...
R$ 102.5 billion
R$ 41.5 billion
R$ 75 billion
R$ 42 billion
R$ 56.9 billion
Collections:
Balance of Collections:
Payments of Suppliers:
Payment of Taxes:
Custody Services:

54
State of the Art State of the Art Technology…Technology…
108.7108.7
245.8245.8
398.8398.8354.9354.9
234.6234.6
80
160
240
320
400
480
1H 98 1H 99 1H 00 1H 01 1H 02
R$ MillionsR$ Millions
InvestmentsInvestments

55
Telebanco
Bradesco.com
Through Alternative Channels Through Alternative Channels
4.3 million Heavy Users 121.8 million TransactionsR$ 4.7 billion Operations
ShopCreditShopCredit180 thousand TransactionsR$ 51 million Operations
BradescoNetBradescoNetEmpresaEmpresa
598 thousand Transactions24,196 Clients that Operates ActivelyR$ 1.1 billion Operations
ShopFácilShopFácil6.8 million TransactionsR$ 521 million Operations
InternetInternetBankingBanking
142 thousand Transactions498 thousand SubscribersR$ 674 million Operations
ShopInvestShopInvest
114.6 million Calls2.4 million UsersR$ 2.0 billion Transactions

56
ElectronicTransmission
11.5 Branches17.7
Direct Debit1.6
Call Center (Telebanco)11.3
Internet Banking
8.5
ATMs49.5
June / 02%%
Millions of Transactions
ATMs 756.5Branches 269.9
Call Center (Telebanco) 172.8Internet Banking 129.5Direct Debit 24.2
TotalTotal 1,528.31,528.3
Electronic Transmission 175.5
Through Alternative Channels Through Alternative Channels

57
AgendaAgenda
ABAMEC Bradesco 2001ABAMEC Bradesco 2001
Historical PeriodHistorical Period
Main Events Main Events
Competitive AdvantagesCompetitive Advantages
Management CharacteristicsManagement Characteristics
PerspectivesPerspectives

58
PerspectivesPerspectives
MinimizeMinimizeCostsCosts
Maximize Maximize SalesSales
ABC Methodology
Efficiency Ratio: 50%
Integration ofBack Offices
Asset Quality
Alternative Channels
Cross Selling
Customer Satisfaction
Continuous Improvement of the Portfolio of Products / Services
Postal Bank:Non-Account Holders
Segmentation
Organic Growth x AcquisitionsOrganic Growth x AcquisitionsBankasuranceBankasurance

59
ContactsContacts
XX - 11 - 3684-9229 3684-9302 3684-2086 3684-9231
Email Email ::
Investor Relations AreaInvestor Relations Area
www.bradesco.com.br
Phones:Phones:
This presentation contains forward-looking statements. Such statements are not This presentation contains forward-looking statements. Such statements are not statements of historical fact, and reflect the beliefs and expectations of the statements of historical fact, and reflect the beliefs and expectations of the Company's management. The words "anticipates", "believes", "estimates", Company's management. The words "anticipates", "believes", "estimates",
"expects", "forecasts", "intends", "plans", "predicts", "projects", "targets" and "expects", "forecasts", "intends", "plans", "predicts", "projects", "targets" and similar words are intended to identify these statements, which necessarily involve similar words are intended to identify these statements, which necessarily involve
known and unknown risks and uncertainties. Known risks and uncertainties known and unknown risks and uncertainties. Known risks and uncertainties include, but are not limited to, the impact of competitive services and pricing, include, but are not limited to, the impact of competitive services and pricing,
market acceptance of services, service transitions by the Company and its market acceptance of services, service transitions by the Company and its competitors, regulatory approval, currency fluctuations, changes in service mix competitors, regulatory approval, currency fluctuations, changes in service mix offered, and other risks described in the Company's registration statement and offered, and other risks described in the Company's registration statement and other Securities and Exchange Commission filings. Forward-looking statements other Securities and Exchange Commission filings. Forward-looking statements
speak only as of the date they are made, and Banco Bradesco does not undertake speak only as of the date they are made, and Banco Bradesco does not undertake any obligation to update them in light of new information or future developments.any obligation to update them in light of new information or future developments.

60