1 business analytics. business intelligence (bi) is a broad category of applications, technologies,...
TRANSCRIPT
1
Business Analytics

• Business intelligence (BI) is a broad category of applications, technologies, and processes for:
• gathering,
• storing,
• accessing, and
• analyzing data
• to help business users make better decisions.
Business Intelligence

Things Are Getting More Complex
• Organizations are finding business value in capturing, storing, and analyzing new kinds of data, such as social media, machine sensing, and clickstream.
• Many companies are performing new kinds of analytics (sentiment analysis), to better and more quickly understand and respond to what customers are saying about them and their products.
• The cloud, and appliances are being used as data stores
• Advanced analytics are growing in popularity and importance

What is Big Data?• Information from multiple internal and external sources:
• Transactions• Social media• Enterprise content• Sensors• Mobile devices
• Companies leverage data to adapt products and services to: • Meet customer needs• Optimize operations• Optimize infrastructure• Find new sources of revenue• Can reveal more patterns and anomalies
• IBM estimates that by 2015 4.4 million jobs will be created globally to support big data• 1.9 million of these jobs will be in the United States

Types of Data

• When collecting or gathering data we collect data from individuals cases on particular variables.
• A variable is a unit of data collection whose value can vary.
• Variables can be defined into types according to the level of mathematical scaling that can be carried out on the data.
• There are four types of data or levels of measurement:
1. Nominal 2. Ordinal
3. Interval 4. Ratio

• Nominal or categorical data is data that comprises of categories that cannot be rank ordered – each category is just different.
• The categories available cannot be placed in any order and no judgement can be made about the relative size or distance from one category to another.
• What does this mean? No mathematical operations can be performed on the data relative to each other.
•Therefore, nominal data reflect qualitative differences rather than quantitative ones.
Nominal data

Examples:
Nominal data
What is your gender? (please tick)
Male
Female
Did you enjoy the film? (please tick)
Yes
No

•Systems for measuring nominal data must ensure that each category is mutually exclusive and the system of measurement needs to be exhaustive.
• Variables that have only two responses i.e. Yes or No, are known as dichotomies.
Nominal data

• Ordinal data is data that comprises of categories that can be rank ordered.
• Similarly with nominal data the distance between each category cannot be calculated but the categories can be ranked above or below each other.
• What does this mean? Can make statistical judgements and perform limited maths.
Ordinal data

Example:
Ordinal data
How satisfied are you with the level of service you have received? (please tick)
Very satisfied
Somewhat satisfied
Neutral
Somewhat dissatisfied
Very dissatisfied

• Both interval and ratio data are examples of scale data.
• Scale data:
• data is in numeric format ($50, $100, $150)
• data that can be measured on a continuous scale
• the distance between each can be observed and as a result measured
• the data can be placed in rank order.
Interval and ratio data

• Interval data measured on a continuous scale and has no true zero point.
• Examples:
• Time – moves along a continuous measure or seconds, minutes and so on and is without a zero point of time.
• Temperature – moves along a continuous measure of degrees and is without a true zero.
Interval data

• Ratio data measured on a continuous scale and does have a true zero point.
• Examples:
• Age
• Weight
• Height
Ratio data

Types of Analytics

Descriptive Analytics
What has occurred? Descriptive analytics, such as data visualization, is important in helping users interpret the output from predictive and predictive analytics.
• Descriptive analytics, such as reporting/OLAP, dashboards, and data visualization, have been widely used for some time.
• They are the core of traditional BI.
Predictive Analytics
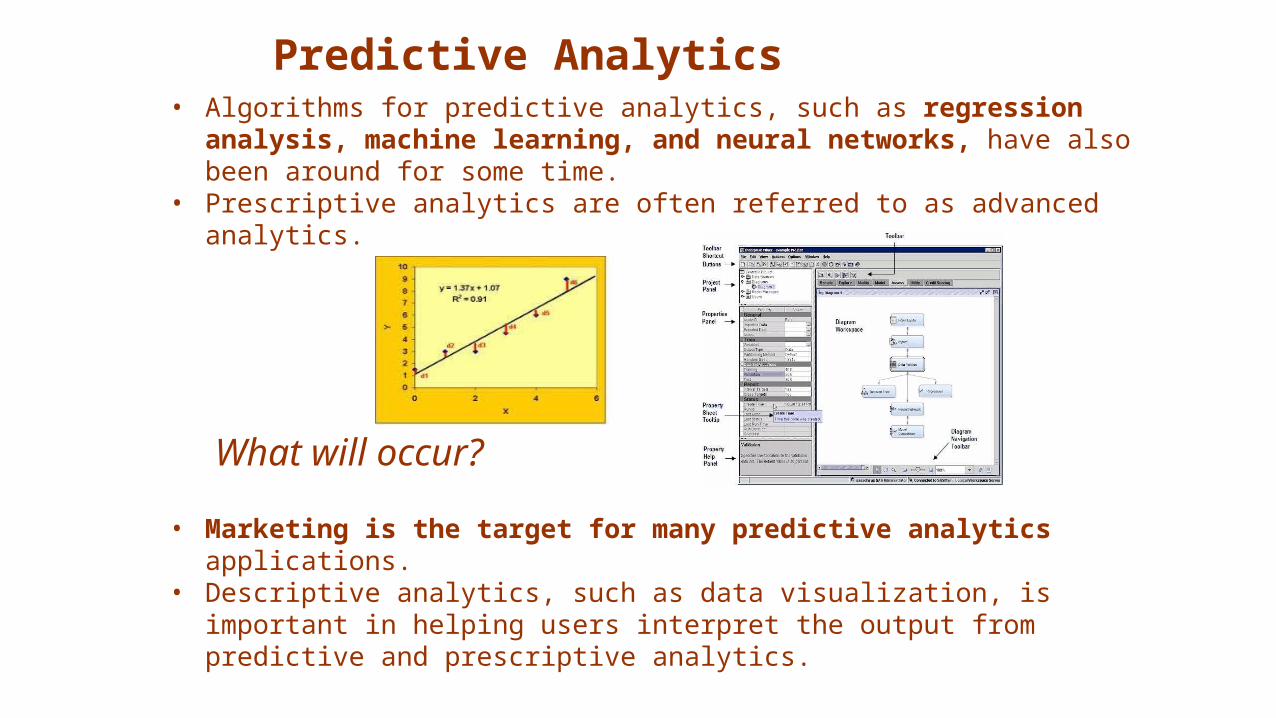
What will occur?
• Marketing is the target for many predictive analytics applications. • Descriptive analytics, such as data visualization, is important in helping
users interpret the output from predictive and prescriptive analytics.
• Algorithms for predictive analytics, such as regression analysis, machine learning, and neural networks, have also been around for some time.
• Prescriptive analytics are often referred to as advanced analytics.
Prescriptive Analytics
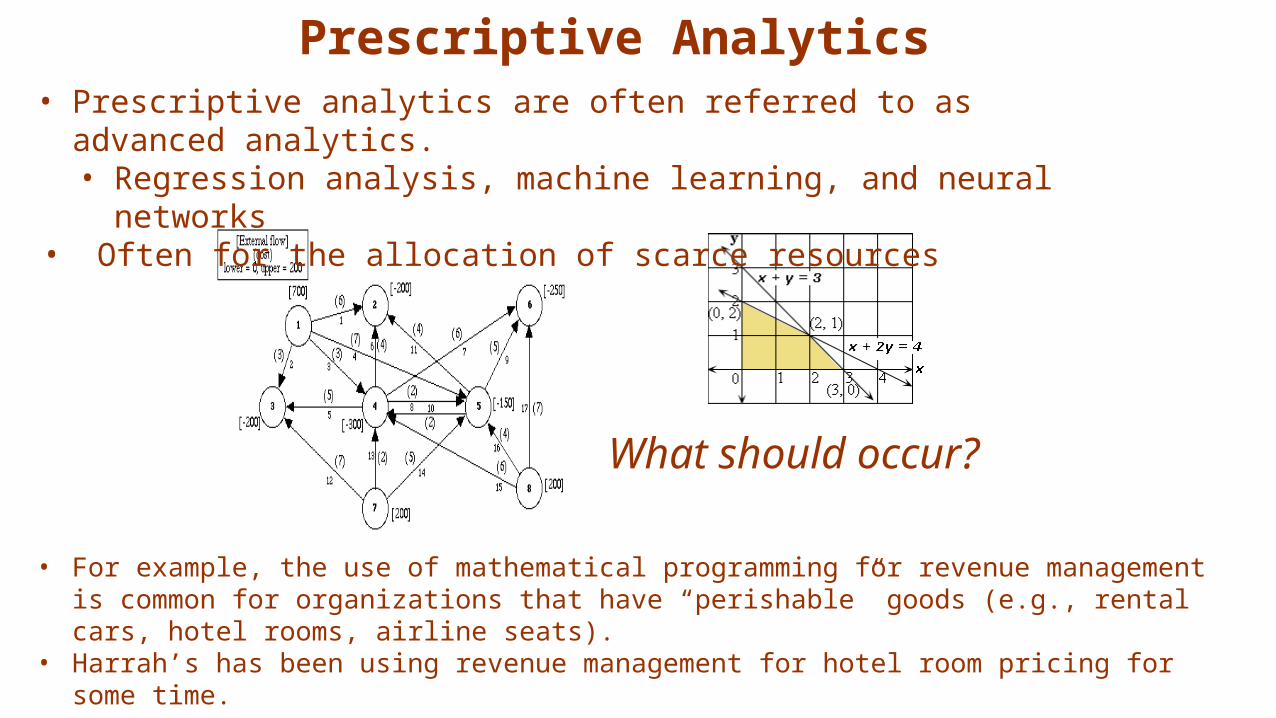
What should occur?
• For example, the use of mathematical programming for revenue management is common for organizations that have “perishable” goods (e.g., rental cars, hotel rooms, airline seats).
• Harrah’s has been using revenue management for hotel room pricing for some time.
• Prescriptive analytics are often referred to as advanced analytics.• Regression analysis, machine learning, and neural networks
• Often for the allocation of scarce resources

Organizational Transformation
• Brought about by opportunity or necessity• The firm adopts a new business model
enabled by analytics• Analytics are a competitive requirement

For BI-based organizations, the use of BI/analytics
is a requirement for successfully competing in the marketplace.

2013 Academic Research
• A 2011 IBM/MIT Sloan Management Review research study found that top performing companies in their industry are much more likely to use analytics rather than intuition across the widest range of possible decisions.
• A 2011 TDWI report on Big Data Analytics found that 85% of respondents indicated that their firms would be using advanced analytics within three years

Conditions that Lead to Analytics-based Organizations
• The nature of the industry• Seizing an opportunity• Responding to a problem

Complex Systems
• Tackle complex problems and provide individualized solutions• Products and services are organized around the needs of individual
customers• Dollar value of interactions with each customer is high• There is considerable interaction with each customer• Examples: IBM, World Bank, Halliburton

Volume Operations• Serves high-volume markets through standardized products and services• Each customer interaction has a low dollar value• Customer interactions are generally conducted through technology
rather than person-to-person• Are likely to be analytics-based• Examples: Amazon.com, eBay, Hertz

The Nature of the Industry: Online Retailers
BI Applications• Analysis of clickstream data • Customer profitability analysis• Customer segmentation analysis• Product recommendations• Campaign management• Pricing• Forecasting• Dashboards

The Nature of the Industry
• Online retailers like Amazon.com and Overstock.com are high volume operations who rely on analytics to compete.
• When you enter their sites a cookie is placed on your PC and all clicks are recorded.
• Based on your clicks and any search terms, recommendation engines decide what products to display.
• After you purchase an item, they have additional information that is used in marketing campaigns.
• Customer segmentation analysis is used in deciding what promotions to send you.
• How profitable you are influences how the customer care center treats you.
• A pricing team helps set prices and decides what prices are needed to clear out merchandise.
• Forecasting models are used to decide how many items to order for inventory.
• Dashboards monitor all aspects of organizational performance

Knowledge Requirements for Advanced Analytics
Business Domain
ModelingData
• Choosing the right data to include in models is important. • Predictive analytics should not be searching for a diamond in a coal mine.
• You will get too many spurious findings. • Important to have some thoughts as to what variables might be related. • Domain knowledge is necessary to understand how they can be used. • Consider the story of the relationship between beer and diapers in the market basket of
young males in convenience stores. • You still have to decide (or experiment to discover) whether it is better to put them
together or spread them across the store (in the hope that other things will be bought while walking the isles).
Video

Visualization

Visualization: A Definition • Visualize: to form a mental model or mental image of something • Visualization is a human cognitive activity, not something that a computer does

• Refers to the innovative use of images and interactive technology to explore large, high- density datasets
• Help users see patterns and relationships that would be difficult to see in text lists
• Rich graphs, charts
• Dashboards
• Maps
• Increasingly is being used to identify insights into both structured and unstructured data for such areas as
• operational efficiencies• profitability• strategic planning
Video Tableau
Visualization

Acquisition of Insight
• Many people and institutions possess data that may ‘hide’ fundamental relations
• Realtors
• Bankers
• Air Traffic Controller
• Fraud investigators
• Engineers
• They want to be able to view some graphical representation of that data, maybe interact with it, and then be able to say…….ahha!
Example: Fraud Detection • The Serious Fraud Office (SFO) suspected mortgage fraud
• The SFO provided 12 filing cabinets of data
• After 12 person years a suspect was identified• The suspect was arrested, tried and convicted

• The data was supplied in electronic form
• A visualization tool (Netmap) was used to examine the data
• After 4 person weeks the same suspect was identified
• A master criminal behind the fraud was also identified
Example: Fraud Detection continued

Is Information Visualization Useful?
Drugs and Chips
Texas Instruments
Manufactures microprocessors on silicon wafers that are routed through 400 steps in many weeks. This process is monitored, gathering 140,000 pieces of information about each wafer. Somewhere in that heap of data can be warnings about things going wrong. Detect a bug early before bad chips are made. TI uses visualization tools to aid in this detection
Eli Lilly
Has 1500 scientists using an advanced information visualization tool (Spotfire) for decision making. “With its ability to represent multiple sources of information and interactively change your view, it’s helpful for homing in on specific molecules and deciding whether we should be doing further testing on them”
Sheldon Ort of Eli Lilly, speaking to Fortune

The cholera epidemic, London 1845
Dr. John Snow, medical officer for London, investigated the cholera epidemic of 1845 in Soho. He noted that the deaths, indicated by points, tended to occur near the Broad Street pump. Closure of the pump coincided with a reduction in cholera.

Challenger Disaster• On 28th January 1986 the space shuttle Challenger exploded, and seven
astronauts died, because two rubber O-Rings leaked. • The previous day, engineers who designed the rocket opposed the launch,
concerned that the O-Rings would not seal at the forecast temperature (25 to 29oF).
• After much discussion, the decision was taken to go ahead. • Cause of the accident:
• An inability to assess the link between cool temperature and O-Ring damage on earlier flights.
• Many charts poorly presented

Examples
Introduction to Information Visualization - Fall 2012
Geo data mapping
Demo

Examples
Introduction to Information Visualization - Fall 2012
• Treemap
• Demo

Examples
Introduction to Information Visualization - Fall 2012
Population
“Trendalyzer”
Demo

• Video on the use of visualization to extract knowledge from data.
40

• What management, organization, and technology factors were behind the Cincinnati Zoo losing opportunities to increase revenue?
• Why was replacing legacy point-of-sale systems and implementing a data warehouse essential to an information system solution?
• How did the Cincinnati Zoo benefit from business intelligence? How did it enhance operational performance and decision making? What role was played by predictive analytics?
• Visit the IBM Cognos Web site and describe the business intelligence tools that would be the most useful for the Cincinnati Zoo.
Analytics Help the Cincinnati Zoo Know Its Customers