1 c2 maturity model experimental validation statistical analyses of elicit experimentation data dr....
TRANSCRIPT

1
C2 Maturity Model Experimental Validation
Statistical Analyses of ELICIT Experimentation Data
Dr. David S. Alberts

2
Agenda
• Background
• Available Data
• Analysis Plan
• Results of Analyses
• Conclusions

3
Background
• SAS-065 has developed a C2 Maturity Model for NATO Network Enabled Capability
• SAS-065 is engaged in a variety of activities to “validate” this model– Case studies: Analysis of historical complex endeavors to
establish construct validity– Analysis of Experimentation Data to test a set of maturity model
hypotheses
• ELICIT is an experimentation platform that instruments the actions of a group of participants engaged in a situational awareness problem
• ELICIT experiments have explored differences between “edge” and “hierarchical” organizations

4
ELICIT Scenario
• The goal of each set of participants is to build situational awareness and identify the who, what, when, and where of a pending attack– Participants can share factoids directly with each other or post factoids to
websites
– Participants build awareness by gathering and analyzing factoids and interacting with one another
– No one is given sufficient information to solve their assigned problem without receiving information from others
• The receiving, sharing, and posting of factoids and the nature of the interactions between and among participants can be constrained
• C2 approach for this series of experiments were designated prior to the start of the run asHierarchy or Edge
Hierarchy
Edge

5
Hypotheses
• “Hierarchical” organizations as instantiated in ELICIT experiments correspond to De-Conflicted C2 in the NATO C2 Maturity Model
• “Edge” organizations as instantiated in ELICIT experiments correspond to a higher level of maturity in the NATO C2 Maturity Model
• Hypotheses: – Edge organizations exhibit the behaviors associated with
Coordinated and Collaborative levels of C2 Maturity
– Hierarchical organizations exhibit the behaviors associated with the De-conflicted level of C2 Maturity
– Edge organizations exhibit higher levels of effectiveness and efficiency than Hierarchical organizations

6
ELICIT Data Set
• Includes data from 37 ELICIT experimentation trials
• Venues– Boston Univ. (2 runs)
– NPS (16 runs)
– Portugal (6 runs)
– USMA (3 runs)
– Singapore (10 runs)
• Organization Types – 18 Edge
– 19 Hierarchy

7
Agenda
• Background
• Available Data
• Analysis Plan
• Results of Analyses
• Conclusions

8
Variables of Interest
Info Sharing &Collaborative
Behaviors
SharedInformation
Quality of Information
Shared Awareness
Quality of Awareness
SharedUnderstanding
Quality of Understanding
TaskPerformance
TaskDifficulty
Measures of Merit
NetworkCharacteristics& Performance
Individual& Team
Characteristics
Culture
Allocation of Decision Rights
Quality of Information
Sources
Patterns of Interaction
Distribution of Information
C2 Maturity Level
Partially Controllable
Controllable
Legend

9
Dependent Variables
• MOE = Quality of Awareness and Shared Awareness– Correctness (Authorized Correct IDs)
– Timeliness (Person-Minutes with Correct IDs)
– Accuracy rate (Correct IDs/Total IDs)
• Efficiency, Given Effectiveness– Productivity (Correct IDs/Total Actions; Correct IDs/Person-
Minutes Available)
– Speed (Time of Earliest Correct ID)
• Agility– Effectiveness over problem difficulty

10
C2 Approach Independent Variables
• Hierarchy v. Edge– We expect Hierarchy to map to De-conflicted and Edge to map to
a more mature level
– Each run will be mapped to a point in the C2 Approach Space based on observed behaviors
• Rules of Interaction– Website access
– Sharing permissions
• Initial Distribution of Factoids – Invariant in existing runs

11
C2 Approach Intervening Variables
• Patterns of Interaction – Characteristic path length
– Clustering coefficient
– Connectedness
• Distribution of Information– The average number of unique facts to which each participant has
access as a function of time
12
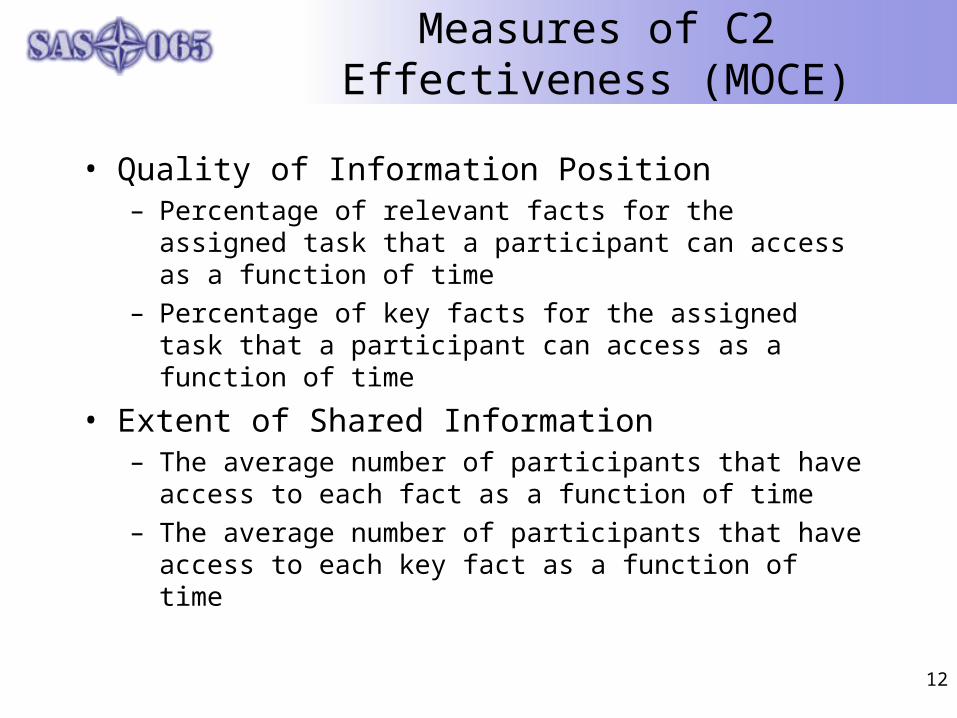
Measures of C2 Effectiveness (MOCE)
• Quality of Information Position– Percentage of relevant facts for the assigned task that a participant
can access as a function of time
– Percentage of key facts for the assigned task that a participant can access as a function of time
• Extent of Shared Information– The average number of participants that have access to each fact as
a function of time
– The average number of participants that have access to each key fact as a function of time
13
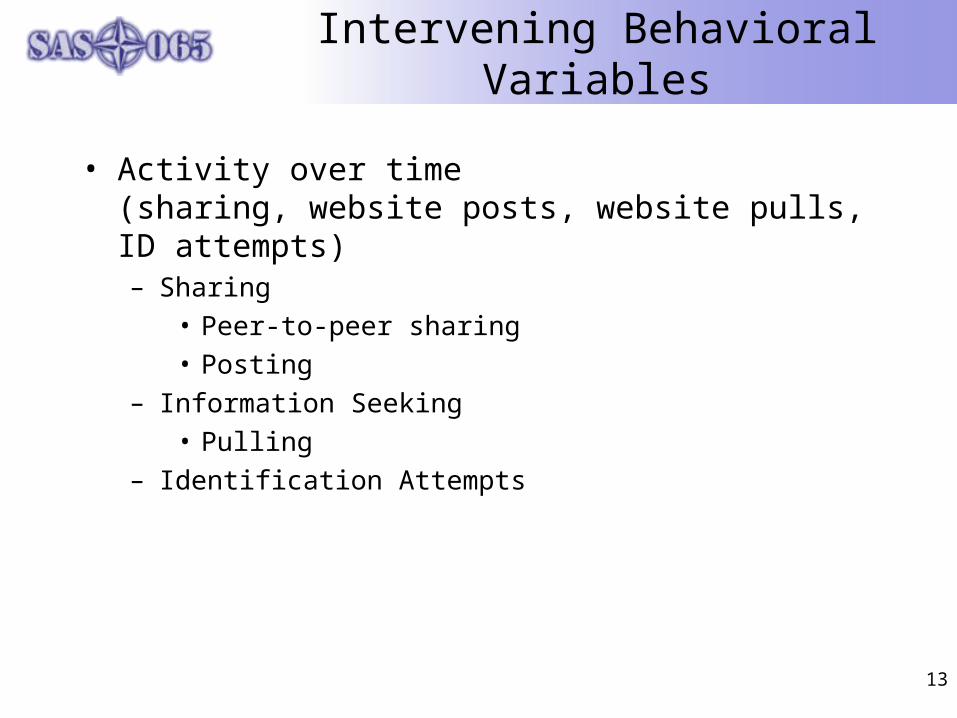
Intervening Behavioral Variables
• Activity over time (sharing, website posts, website pulls, ID attempts)– Sharing
• Peer-to-peer sharing
• Posting
– Information Seeking
• Pulling
– Identification Attempts
14
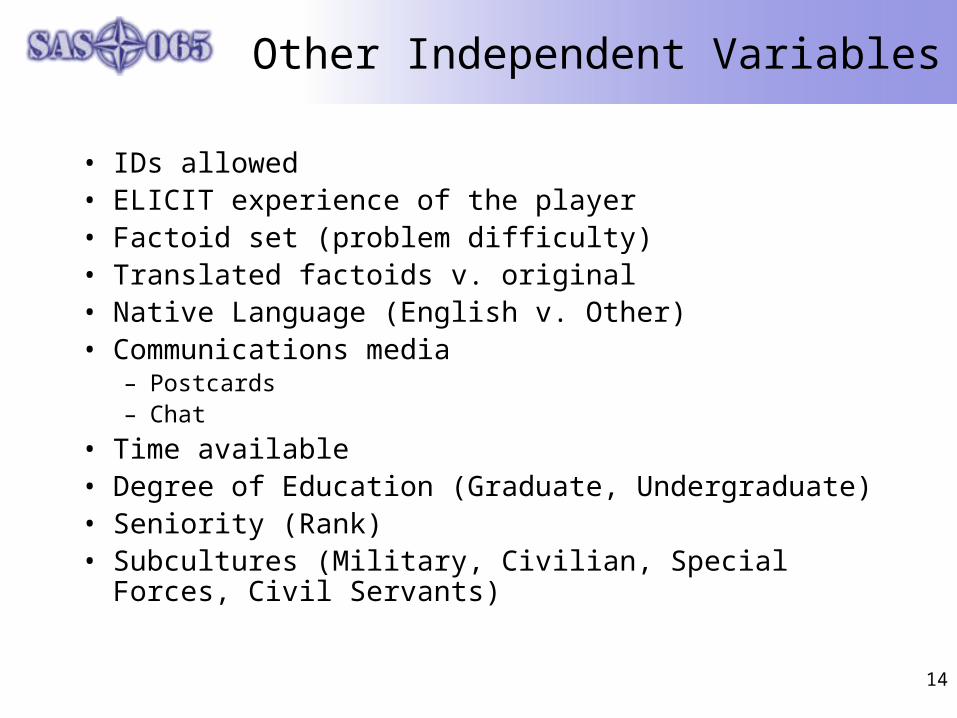
Other Independent Variables
• IDs allowed• ELICIT experience of the player• Factoid set (problem difficulty)• Translated factoids v. original• Native Language (English v. Other)• Communications media
– Postcards– Chat
• Time available• Degree of Education (Graduate, Undergraduate)• Seniority (Rank)• Subcultures (Military, Civilian, Special Forces, Civil
Servants)

15
Agenda
• Background
• Available Data
• Analysis Plan
• Results of Analyses
• Conclusions

16
Dependent Variables
• MOE = Quality of Awareness and Shared Awareness– Correctness (Authorized Correct IDs)
– Timeliness (Person-Minutes with Correct IDs)
– Accuracy rate (Correct IDs/Total IDs)
• Efficiency, Given Effectiveness– Productivity (Correct IDs/Total Actions; Correct IDs/Person-
Minutes Available)
– Speed (Time of Earliest Correct ID)
• Agility– Effectiveness over problem difficulty

17
MOE: CorrectnessFraction of Participants with Correct IDs
1
3
5
Cou
nt
-0.1 0 0.1 0.3 0.4 0.5 0.6 0.7 0.9 1
100.0%
99.5%
97.5%
90.0%
75.0%
50.0%
25.0%
10.0%
2.5%
0.5%
0.0%
maximum
quartile
median
quartile
minimum
0.94118
0.94118
0.94118
0.88824
0.52941
0.35294
0.00000
0.00000
0.00000
0.00000
0.00000
Quantiles
Mean
Std Dev
Std Err Mean
upper 95% Mean
lower 95% Mean
N
0.3464052
0.3233808
0.0762216
0.5072187
0.1855917
18
Moments
Fraction of Participants with Correct ID
Distributions Structure=Edge
2
6
10
Cou
nt
-0.1 0 0.1 0.3 0.4 0.5 0.6 0.7 0.9 1
100.0%
99.5%
97.5%
90.0%
75.0%
50.0%
25.0%
10.0%
2.5%
0.5%
0.0%
maximum
quartile
median
quartile
minimum
0.64706
0.64706
0.64706
0.47059
0.23529
0.05882
0.00000
0.00000
0.00000
0.00000
0.00000
Quantiles
Mean
Std Dev
Std Err Mean
upper 95% Mean
lower 95% Mean
N
0.1331269
0.1909547
0.043808
0.2251642
0.0410897
19
Moments
Fraction of Participants with Correct ID
Distributions Structure=Hierarchy Hierarchy
Edge

18
MOE: CorrectnessFraction of Participants with Correct IDs
Edge Better Than HierarchySignificant at 0.95 level
-0.1
0
0.1
0.2
0.3
0.4
0.5
0.6
0.7
0.8
0.9
1
Fra
ctio
n of
Par
ticip
ants
with
Cor
rect
ID
Edge Hierarchy
Structure
Hierarchy-Edge
Assuming unequal variances
Difference
Std Err Dif
Upper CL Dif
Lower CL Dif
Confidence
-0.21328
0.08791
-0.03298
-0.39358
0.95
t Ratio
DF
Prob > |t|
Prob > t
Prob < t
-2.42599
27.2754
0.0221*
0.9889
0.0111 * -0.2 -0.1 0.0 0.1 0.2 0.3
t Test
Oneway Analysis of Fraction of Participants with Correct ID By Structure

19
MOE: CorrectnessFraction of Participants with Authorized Correct IDs
Note: Half credit given for partially correct answers in authorized areas
1
2
Cou
nt
0 0.1 0.2 0.3 0.4 0.5 0.6 0.7 0.8 0.9 1
100.0%
99.5%
97.5%
90.0%
75.0%
50.0%
25.0%
10.0%
2.5%
0.5%
0.0%
maximum
quartile
median
quartile
minimum
0.95588
0.95588
0.95588
0.94118
0.76471
0.55882
0.44853
0.16176
0.13971
0.13971
0.13971
Quantiles
Mean
Std Dev
Std Err Mean
upper 95% Mean
lower 95% Mean
N
0.5901703
0.2531976
0.0580875
0.7122076
0.468133
19
Moments
Fraction of Total Participants with Authorized Correct IDs
Distributions Structure=Edge
1
3
5
7
Cou
nt
0 0.1 0.2 0.3 0.4 0.5 0.6 0.7 0.8 0.9 1
100.0%
99.5%
97.5%
90.0%
75.0%
50.0%
25.0%
10.0%
2.5%
0.5%
0.0%
maximum
quartile
median
quartile
minimum
0.26471
0.26471
0.26471
0.24485
0.19853
0.12132
0.08640
0.04191
0.02206
0.02206
0.02206
Quantiles
Mean
Std Dev
Std Err Mean
upper 95% Mean
lower 95% Mean
N
0.1388889
0.0716849
0.0168963
0.1745369
0.1032408
18
Moments
Fraction of Total Participants with Authorized Correct IDs
Distributions Structure=Hierarchy Hierarchy
Edge

20
MOE: CorrectnessFraction of Authorized Participants with Correct ID
0
0.1
0.2
0.3
0.4
0.5
0.6
0.7
0.8
0.9
1F
ract
ion
of T
otal
Par
ticip
ants
with
Aut
horiz
ed C
orre
ct ID
s
Edge Hierarchy
Structure
Hierarchy-Edge
Assuming unequal variances
Difference
Std Err Dif
Upper CL Dif
Lower CL Dif
Confidence
-0.45128
0.06049
-0.32548
-0.57708
0.95
t Ratio
DF
Prob > |t|
Prob > t
Prob < t
-7.45982
21.01549
<.0001*
1.0000
<.0001* -0.5 -0.3 -0.1 0.1 0.3 0.5
t Test
Oneway Analysis of Fraction of Total Participants with Authorized Correct IDs By Structure
Edge Better Than Hierarchy
Significant at 0.95 level|t-Ratio| = 7.46

21
Measuring Timeliness:Person-Minutes with Correct ID
• In the ELICIT scenario, operational value is associated both with the number of participants achieving the correct answer, as well as when they achieved it
• Person minutes with correct ID captures the proportion of possible situational understanding achieved by trial participants over the time of the trial– For each minute, each participant’s level of understanding is assessed
by the score assigned to his/her most recent identification attempt– This value is summed over the duration of the trial to arrive at the
person-minutes correct for each participant– Person-minutes correct for the trial is calculated by summing over all
participants– A ratio of the person minutes correct for the trial to the total person
minutes available in the trial adjusts for varying trial lengths

22
MOE: TimelinessFraction of Person-Minutes Correct
1
3
5
7
Cou
nt
0 0.1 0.2 0.3 0.4
100.0%
99.5%
97.5%
90.0%
75.0%
50.0%
25.0%
10.0%
2.5%
0.5%
0.0%
maximum
quartile
median
quartile
minimum
0.41224
0.41224
0.41224
0.39878
0.19575
0.09355
0.00000
0.00000
0.00000
0.00000
0.00000
Quantiles
Mean
Std Dev
Std Err Mean
upper 95% Mean
lower 95% Mean
N
0.1282984
0.1436907
0.0338682
0.1997541
0.0568427
18
Moments
Person-Minutes Correct/ Person-Minutes Available
Distributions Structure=Edge
5
10
Cou
nt
0 0.1 0.2 0.3 0.4
100.0%
99.5%
97.5%
90.0%
75.0%
50.0%
25.0%
10.0%
2.5%
0.5%
0.0%
maximum
quartile
median
quartile
minimum
0.24009
0.24009
0.24009
0.06631
0.04838
0.00205
0.00000
0.00000
0.00000
0.00000
0.00000
Quantiles
Mean
Std Dev
Std Err Mean
upper 95% Mean
lower 95% Mean
N
0.0310971
0.0563214
0.012921
0.0582431
0.0039511
19
Moments
Person-Minutes Correct/ Person-Minutes Available
Distributions Structure=Hierarchy Hierarchy
Edge

23
Edge Better Than HierarchySignificant at 0.95 level
MOE: TimelinessFraction of Person-Minutes Correct
0
0.1
0.2
0.3
0.4P
erso
n-M
inut
es C
orre
ct/
Per
son-
Min
utes
Ava
ilabl
e
Edge Hierarchy
Structure
Hierarchy-Edge
Assuming unequal variances
Difference
Std Err Dif
Upper CL Dif
Lower CL Dif
Confidence
-0.09720
0.03625
-0.02200
-0.17240
0.95
t Ratio
DF
Prob > |t|
Prob > t
Prob < t
-2.68147
21.8712
0.0137*
0.9932
0.0068* -0.10 -0.05 0.00 0.05 0.10
t Test
Oneway Analysis of Person-Minutes Correct/ Person-Minutes Available By Structure

24
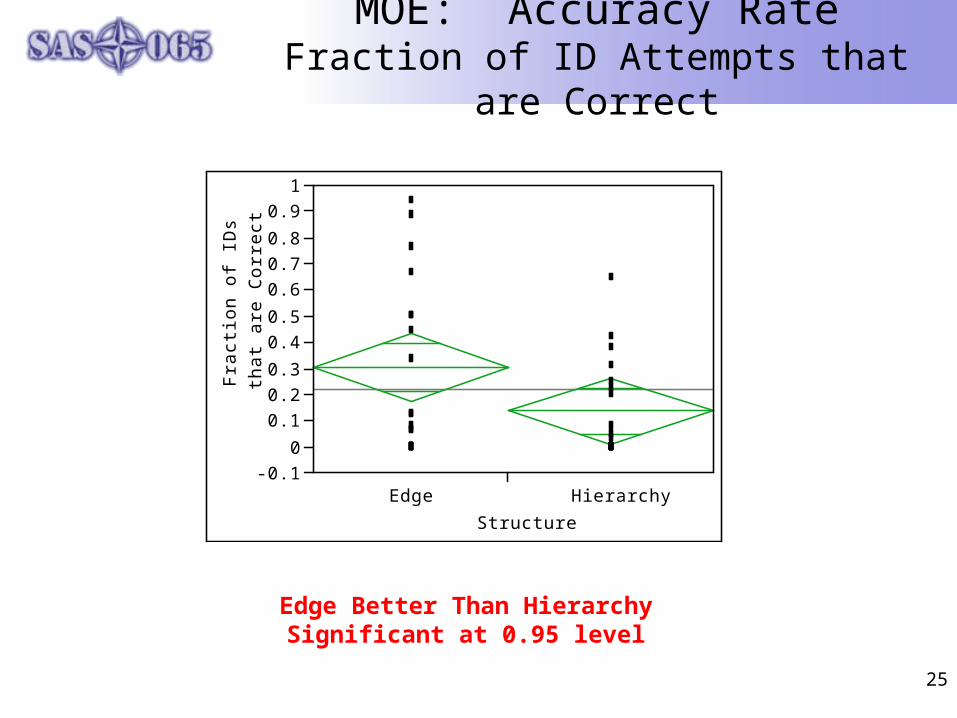
MOE: Accuracy RateFraction of ID Attempts that are Correct
1
3
5
7
Cou
nt
-0.1 0 0.1 0.3 0.4 0.5 0.6 0.7 0.9 1
100.0%
99.5%
97.5%
90.0%
75.0%
50.0%
25.0%
10.0%
2.5%
0.5%
0.0%
maximum
quartile
median
quartile
minimum
0.94118
0.94118
0.94118
0.88824
0.54167
0.12334
0.00000
0.00000
0.00000
0.00000
0.00000
Quantiles
Mean
Std Dev
Std Err Mean
upper 95% Mean
lower 95% Mean
N
0.3042396
0.3325204
0.0783758
0.4695981
0.1388811
18
Moments
Fraction of IDs that are Correct
Distributions Structure=Edge
2
6
10
Cou
nt
-0.1 0 0.1 0.3 0.4 0.5 0.6 0.7 0.9 1
100.0%
99.5%
97.5%
90.0%
75.0%
50.0%
25.0%
10.0%
2.5%
0.5%
0.0%
maximum
quartile
median
quartile
minimum
0.64706
0.64706
0.64706
0.42105
0.25000
0.02632
0.00000
0.00000
0.00000
0.00000
0.00000
Quantiles
Mean
Std Dev
Std Err Mean
upper 95% Mean
lower 95% Mean
N
0.1353537
0.1891115
0.0433852
0.2265025
0.0442048
19
Moments
Fraction of IDs that are Correct
Distributions Structure=Hierarchy Hierarchy
Edge
25
MOE: Accuracy RateFraction of ID Attempts that are Correct
Edge Better Than HierarchySignificant at 0.95 level
-0.1
0
0.1
0.2
0.3
0.4
0.5
0.6
0.7
0.8
0.9
1
Fra
ctio
n of
IDs
that
are
Cor
rect
Edge Hierarchy
Structure
Hierarchy-Edge
Assuming unequal variances
Difference
Std Err Dif
Upper CL Dif
Lower CL Dif
Confidence
-0.16889
0.08958
0.01503
-0.35281
0.95
t Ratio
DF
Prob > |t|
Prob > t
Prob < t
-1.88525
26.65115
0.0703
0.9648
0.0352* -0.2 -0.1 0.0 0.1 0.2 0.3
t Test
Oneway Analysis of Fraction of IDs that are Correct By Structure

26
Efficiency: Productivity (Actions)Correct ID / Total Actions
2
6
10
Cou
nt
-0.005 0 0.005 0.01 0.015 0.02 0.025 0.03
100.0%
99.5%
97.5%
90.0%
75.0%
50.0%
25.0%
10.0%
2.5%
0.5%
0.0%
maximum
quartile
median
quartile
minimum
0.02722
0.02722
0.02722
0.02335
0.00611
0.00327
0.00000
0.00000
0.00000
0.00000
0.00000
Quantiles
Mean
Std Dev
Std Err Mean
upper 95% Mean
lower 95% Mean
N
0.0052312
0.0077099
0.0018173
0.0090652
0.0013971
18
Moments
Correct IDs/Total Actions
Distributions Structure=Edge
5
10
15
Cou
nt
-0.005 0 0.005 0.01 0.015 0.02 0.025 0.03
100.0%
99.5%
97.5%
90.0%
75.0%
50.0%
25.0%
10.0%
2.5%
0.5%
0.0%
maximum
quartile
median
quartile
minimum
0.01583
0.01583
0.01583
0.00873
0.00347
0.00054
0.00000
0.00000
0.00000
0.00000
0.00000
Quantiles
Mean
Std Dev
Std Err Mean
upper 95% Mean
lower 95% Mean
N
0.002364
0.0040134
0.0009207
0.0042984
0.0004296
19
Moments
Correct IDs/Total Actions
Distributions Structure=Hierarchy Hierarchy
Edge

27
Efficiency: Productivity (Actions)Correct ID / Total Actions
Difference not Significant at 0.95 level|t-Ratio| = 1.41
-0.005
0
0.005
0.01
0.015
0.02
0.025
0.03
Cor
rect
IDs/
Tota
l Act
ions
Edge Hierarchy
Structure
Hierarchy-Edge
Assuming unequal variances
Difference
Std Err Dif
Upper CL Dif
Lower CL Dif
Confidence
-0.00287
0.00204
0.00133
-0.00706
0.95
t Ratio
DF
Prob > |t|
Prob > t
Prob < t
-1.4074
25.27534
0.1715
0.9143
0.0857 -0.008 -0.004 0.000 0.004 0.008
t Test
Oneway Analysis of Correct IDs/Total Actions By Structure

28
Efficiency: Productivity (Person-Minutes)Correct IDs / Person-Minutes Available
1
3
5
Cou
nt
0 0.005 0.01 0.015 0.02
100.0%
99.5%
97.5%
90.0%
75.0%
50.0%
25.0%
10.0%
2.5%
0.5%
0.0%
maximum
quartile
median
quartile
minimum
0.02176
0.02176
0.02176
0.01749
0.00979
0.00525
0.00000
0.00000
0.00000
0.00000
0.00000
Quantiles
Mean
Std Dev
Std Err Mean
upper 95% Mean
lower 95% Mean
N
0.0064197
0.0064876
0.0015292
0.0096459
0.0031935
18
Moments
Correct IDs/Person-Minutes Available
Distributions Structure=Edge
5
10
Cou
nt
0 0.005 0.01 0.015 0.02
100.0%
99.5%
97.5%
90.0%
75.0%
50.0%
25.0%
10.0%
2.5%
0.5%
0.0%
maximum
quartile
median
quartile
minimum
0.00976
0.00976
0.00976
0.00744
0.00550
0.00123
0.00000
0.00000
0.00000
0.00000
0.00000
Quantiles
Mean
Std Dev
Std Err Mean
upper 95% Mean
lower 95% Mean
N
0.002384
0.0031207
0.0007159
0.0038881
0.0008799
19
Moments
Correct IDs/Person-Minutes Available
Distributions Structure=Hierarchy Hierarchy
Edge

29
Efficiency: Productivity (Person-Minutes)Correct IDs / Person-Minutes Available
Edge Better Than HierarchySignificant at 0.95 level
0
0.005
0.01
0.015
0.02C
orre
ct ID
s/P
erso
n-
Min
utes
Ava
ilabl
e
Edge Hierarchy
Structure
Hierarchy-Edge
Assuming unequal variances
Difference
Std Err Dif
Upper CL Dif
Lower CL Dif
Confidence
-0.00404
0.00169
-0.00055
-0.00752
0.95
t Ratio
DF
Prob > |t|
Prob > t
Prob < t
-2.3902
24.17268
0.0250*
0.9875
0.0125* -0.006 -0.003 0.000 0.003 0.006
t Test
Oneway Analysis of Correct IDs/Person-Minutes Available By Structure

30
Efficiency: SpeedTime of Earliest Correct ID
1
3
5
Cou
nt
0 20 40 60 80 100 120 140
100.0%
99.5%
97.5%
90.0%
75.0%
50.0%
25.0%
10.0%
2.5%
0.5%
0.0%
maximum
quartile
median
quartile
minimum
120.00
120.00
120.00
120.00
120.00
27.09
14.13
12.46
7.75
7.75
7.75
Quantiles
Mean
Std Dev
Std Err Mean
upper 95% Mean
lower 95% Mean
N
49.731481
46.078721
10.860859
72.64589
26.817073
18
Moments
Earliest Correct ID
Distributions Structure=Edge
1
3
5
7
Cou
nt
0 20 40 60 80 100 120 140
100.0%
99.5%
97.5%
90.0%
75.0%
50.0%
25.0%
10.0%
2.5%
0.5%
0.0%
maximum
quartile
median
quartile
minimum
120.00
120.00
120.00
120.00
120.00
54.05
27.67
20.93
18.45
18.45
18.45
Quantiles
Mean
Std Dev
Std Err Mean
upper 95% Mean
lower 95% Mean
N
74.096491
45.485592
10.435111
96.019845
52.173137
19
Moments
Earliest Correct ID
Distributions Structure=Hierarchy Hierarchy
Edge

31
Efficiency: SpeedTime of Earliest Correct ID
Difference not Significant at 0.95 level|t-Ratio| = 1.62
0
20
40
60
80
100
120
140
Ear
liest
Cor
rect
ID
Edge Hierarchy
Structure
Hierarchy-Edge
Assuming unequal variances
Difference
Std Err Dif
Upper CL Dif
Lower CL Dif
Confidence
24.365
15.062
54.947
-6.217
0.95
t Ratio
DF
Prob > |t|
Prob > t
Prob < t
1.617698
34.83622
0.1147
0.0574
0.9426 -50 -30 -10 0 10 20 30 40 50
t Test
Oneway Analysis of Earliest Correct ID By Structure
32
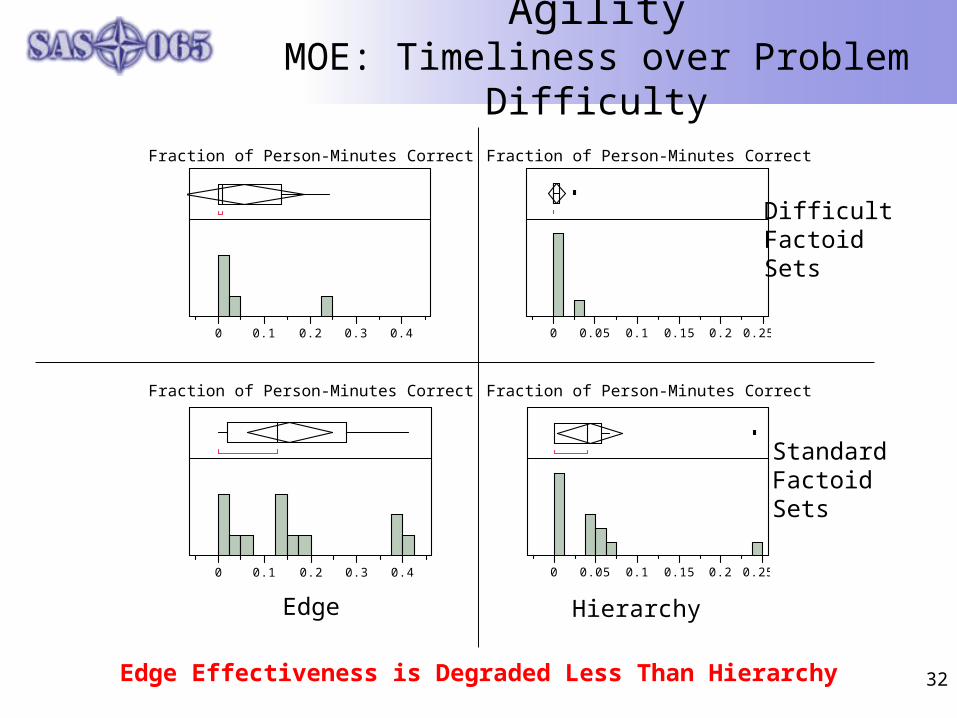
AgilityMOE: Timeliness over Problem Difficulty
Edge Effectiveness is Degraded Less Than Hierarchy
0 0.1 0.2 0.3 0.4
100.0%
99.5%
97.5%
90.0%
75.0%
50.0%
25.0%
10.0%
2.5%
0.5%
0.0%
maximum
quartile
median
quartile
minimum
0.24318
0.24318
0.24318
0.24318
0.13778
0.01092
0.00000
0.00000
0.00000
0.00000
0.00000
Quantiles
Mean
Std Dev
Std Err Mean
upper 95% Mean
lower 95% Mean
N
0.057295
0.1047481
0.0468448
0.1873569
-0.072767
5
Moments
Person-Minutes Correct/ Person-Minutes Available
Distributions Structure=Edge, Factoid Difficulty=Difficult
0 0.1 0.2 0.3 0.4
100.0%
99.5%
97.5%
90.0%
75.0%
50.0%
25.0%
10.0%
2.5%
0.5%
0.0%
maximum
quartile
median
quartile
minimum
0.41224
0.41224
0.41224
0.40626
0.27928
0.12907
0.02003
0.00000
0.00000
0.00000
0.00000
Quantiles
Mean
Std Dev
Std Err Mean
upper 95% Mean
lower 95% Mean
N
0.1556074
0.1506121
0.0417723
0.2466214
0.0645934
13
Moments
Person-Minutes Correct/ Person-Minutes Available
Distributions Structure=Edge, Factoid Difficulty=Standard
0 0.05 0.1 0.15 0.2 0.25
100.0%
99.5%
97.5%
90.0%
75.0%
50.0%
25.0%
10.0%
2.5%
0.5%
0.0%
maximum
quartile
median
quartile
minimum
0.02606
0.02606
0.02606
0.02606
0.00652
0.00000
0.00000
0.00000
0.00000
0.00000
0.00000
Quantiles
Mean
Std Dev
Std Err Mean
upper 95% Mean
lower 95% Mean
N
0.0043436
0.0106397
0.0043436
0.0155093
-0.006822
6
Moments
Person-Minutes Correct/ Person-Minutes Available
Distributions Structure=Hierarchy, Factoid Difficulty=Difficult
0 0.05 0.1 0.15 0.2 0.25
100.0%
99.5%
97.5%
90.0%
75.0%
50.0%
25.0%
10.0%
2.5%
0.5%
0.0%
maximum
quartile
median
quartile
minimum
0.24009
0.24009
0.24009
0.17058
0.05729
0.03994
0.00000
0.00000
0.00000
0.00000
0.00000
Quantiles
Mean
Std Dev
Std Err Mean
upper 95% Mean
lower 95% Mean
N
0.0434448
0.0647142
0.0179485
0.0825513
0.0043384
13
Moments
Person-Minutes Correct/ Person-Minutes Available
Distributions Structure=Hierarchy, Factoid Difficulty=Standard
Fraction of Person-Minutes Correct
Fraction of Person-Minutes Correct
0 0.1 0.2 0.3 0.4
100.0%
99.5%
97.5%
90.0%
75.0%
50.0%
25.0%
10.0%
2.5%
0.5%
0.0%
maximum
quartile
median
quartile
minimum
0.24318
0.24318
0.24318
0.24318
0.13778
0.01092
0.00000
0.00000
0.00000
0.00000
0.00000
Quantiles
Mean
Std Dev
Std Err Mean
upper 95% Mean
lower 95% Mean
N
0.057295
0.1047481
0.0468448
0.1873569
-0.072767
5
Moments
Person-Minutes Correct/ Person-Minutes Available
Distributions Structure=Edge, Factoid Difficulty=Difficult
0 0.1 0.2 0.3 0.4
100.0%
99.5%
97.5%
90.0%
75.0%
50.0%
25.0%
10.0%
2.5%
0.5%
0.0%
maximum
quartile
median
quartile
minimum
0.41224
0.41224
0.41224
0.40626
0.27928
0.12907
0.02003
0.00000
0.00000
0.00000
0.00000
Quantiles
Mean
Std Dev
Std Err Mean
upper 95% Mean
lower 95% Mean
N
0.1556074
0.1506121
0.0417723
0.2466214
0.0645934
13
Moments
Person-Minutes Correct/ Person-Minutes Available
Distributions Structure=Edge, Factoid Difficulty=Standard
0 0.05 0.1 0.15 0.2 0.25
100.0%
99.5%
97.5%
90.0%
75.0%
50.0%
25.0%
10.0%
2.5%
0.5%
0.0%
maximum
quartile
median
quartile
minimum
0.02606
0.02606
0.02606
0.02606
0.00652
0.00000
0.00000
0.00000
0.00000
0.00000
0.00000
Quantiles
Mean
Std Dev
Std Err Mean
upper 95% Mean
lower 95% Mean
N
0.0043436
0.0106397
0.0043436
0.0155093
-0.006822
6
Moments
Person-Minutes Correct/ Person-Minutes Available
Distributions Structure=Hierarchy, Factoid Difficulty=Difficult
0 0.05 0.1 0.15 0.2 0.25
100.0%
99.5%
97.5%
90.0%
75.0%
50.0%
25.0%
10.0%
2.5%
0.5%
0.0%
maximum
quartile
median
quartile
minimum
0.24009
0.24009
0.24009
0.17058
0.05729
0.03994
0.00000
0.00000
0.00000
0.00000
0.00000
Quantiles
Mean
Std Dev
Std Err Mean
upper 95% Mean
lower 95% Mean
N
0.0434448
0.0647142
0.0179485
0.0825513
0.0043384
13
Moments
Person-Minutes Correct/ Person-Minutes Available
Distributions Structure=Hierarchy, Factoid Difficulty=Standard
Hierarchy
StandardFactoidSets
DifficultFactoidSets
Edge
0 0.1 0.2 0.3 0.4
100.0%
99.5%
97.5%
90.0%
75.0%
50.0%
25.0%
10.0%
2.5%
0.5%
0.0%
maximum
quartile
median
quartile
minimum
0.24318
0.24318
0.24318
0.24318
0.13778
0.01092
0.00000
0.00000
0.00000
0.00000
0.00000
Quantiles
Mean
Std Dev
Std Err Mean
upper 95% Mean
lower 95% Mean
N
0.057295
0.1047481
0.0468448
0.1873569
-0.072767
5
Moments
Person-Minutes Correct/ Person-Minutes Available
Distributions Structure=Edge, Factoid Difficulty=Difficult
0 0.1 0.2 0.3 0.4
100.0%
99.5%
97.5%
90.0%
75.0%
50.0%
25.0%
10.0%
2.5%
0.5%
0.0%
maximum
quartile
median
quartile
minimum
0.41224
0.41224
0.41224
0.40626
0.27928
0.12907
0.02003
0.00000
0.00000
0.00000
0.00000
Quantiles
Mean
Std Dev
Std Err Mean
upper 95% Mean
lower 95% Mean
N
0.1556074
0.1506121
0.0417723
0.2466214
0.0645934
13
Moments
Person-Minutes Correct/ Person-Minutes Available
Distributions Structure=Edge, Factoid Difficulty=Standard
0 0.05 0.1 0.15 0.2 0.25
100.0%
99.5%
97.5%
90.0%
75.0%
50.0%
25.0%
10.0%
2.5%
0.5%
0.0%
maximum
quartile
median
quartile
minimum
0.02606
0.02606
0.02606
0.02606
0.00652
0.00000
0.00000
0.00000
0.00000
0.00000
0.00000
Quantiles
Mean
Std Dev
Std Err Mean
upper 95% Mean
lower 95% Mean
N
0.0043436
0.0106397
0.0043436
0.0155093
-0.006822
6
Moments
Person-Minutes Correct/ Person-Minutes Available
Distributions Structure=Hierarchy, Factoid Difficulty=Difficult
0 0.05 0.1 0.15 0.2 0.25
100.0%
99.5%
97.5%
90.0%
75.0%
50.0%
25.0%
10.0%
2.5%
0.5%
0.0%
maximum
quartile
median
quartile
minimum
0.24009
0.24009
0.24009
0.17058
0.05729
0.03994
0.00000
0.00000
0.00000
0.00000
0.00000
Quantiles
Mean
Std Dev
Std Err Mean
upper 95% Mean
lower 95% Mean
N
0.0434448
0.0647142
0.0179485
0.0825513
0.0043384
13
Moments
Person-Minutes Correct/ Person-Minutes Available
Distributions Structure=Hierarchy, Factoid Difficulty=Standard
0 0.1 0.2 0.3 0.4
100.0%
99.5%
97.5%
90.0%
75.0%
50.0%
25.0%
10.0%
2.5%
0.5%
0.0%
maximum
quartile
median
quartile
minimum
0.24318
0.24318
0.24318
0.24318
0.13778
0.01092
0.00000
0.00000
0.00000
0.00000
0.00000
Quantiles
Mean
Std Dev
Std Err Mean
upper 95% Mean
lower 95% Mean
N
0.057295
0.1047481
0.0468448
0.1873569
-0.072767
5
Moments
Person-Minutes Correct/ Person-Minutes Available
Distributions Structure=Edge, Factoid Difficulty=Difficult
0 0.1 0.2 0.3 0.4
100.0%
99.5%
97.5%
90.0%
75.0%
50.0%
25.0%
10.0%
2.5%
0.5%
0.0%
maximum
quartile
median
quartile
minimum
0.41224
0.41224
0.41224
0.40626
0.27928
0.12907
0.02003
0.00000
0.00000
0.00000
0.00000
Quantiles
Mean
Std Dev
Std Err Mean
upper 95% Mean
lower 95% Mean
N
0.1556074
0.1506121
0.0417723
0.2466214
0.0645934
13
Moments
Person-Minutes Correct/ Person-Minutes Available
Distributions Structure=Edge, Factoid Difficulty=Standard
0 0.05 0.1 0.15 0.2 0.25
100.0%
99.5%
97.5%
90.0%
75.0%
50.0%
25.0%
10.0%
2.5%
0.5%
0.0%
maximum
quartile
median
quartile
minimum
0.02606
0.02606
0.02606
0.02606
0.00652
0.00000
0.00000
0.00000
0.00000
0.00000
0.00000
Quantiles
Mean
Std Dev
Std Err Mean
upper 95% Mean
lower 95% Mean
N
0.0043436
0.0106397
0.0043436
0.0155093
-0.006822
6
Moments
Person-Minutes Correct/ Person-Minutes Available
Distributions Structure=Hierarchy, Factoid Difficulty=Difficult
0 0.05 0.1 0.15 0.2 0.25
100.0%
99.5%
97.5%
90.0%
75.0%
50.0%
25.0%
10.0%
2.5%
0.5%
0.0%
maximum
quartile
median
quartile
minimum
0.24009
0.24009
0.24009
0.17058
0.05729
0.03994
0.00000
0.00000
0.00000
0.00000
0.00000
Quantiles
Mean
Std Dev
Std Err Mean
upper 95% Mean
lower 95% Mean
N
0.0434448
0.0647142
0.0179485
0.0825513
0.0043384
13
Moments
Person-Minutes Correct/ Person-Minutes Available
Distributions Structure=Hierarchy, Factoid Difficulty=Standard
Fraction of Person-Minutes Correct
Fraction of Person-Minutes Correct

33
C2 Approach Intervening Variables
• Patterns of Interaction – Characteristic path length
– Clustering coefficient
– Connectedness
• Distribution of Information– The average number of unique facts to which each participant has
access as a function of time

34
-0.1
0.0
0.1
0.2
0.3
0.4
0.5
0.6
0.7
0.8
0.9
1.0
Mea
n(F
ract
ion
of A
ll F
acts
See
n)
Edg
eH
iera
rchy
Edg
eH
iera
rchy
Edg
eH
iera
rchy
Edg
eH
iera
rchy
Edg
eH
iera
rchy
Edg
eH
iera
rchy
Edg
eH
iera
rchy
Edg
eH
iera
rchy
Edg
eH
iera
rchy
Edg
eH
iera
rchy
Edg
eH
iera
rchy
Edg
eH
iera
rchy
Edg
eH
iera
rchy
Edg
eH
iera
rchy
Edg
eH
iera
rchy
5 10 15 20 25 30 35 40 45 50 55 60 65 70 75
Structure within Time Interval
Chart
Structure Edge Hierarchy
Distribution of InformationThe cumulative number of unique facts to which
each participant has access over time
Time (minutes)

35
-0.1
0.0
0.1
0.2
0.3
0.4
0.5
0.6
0.7
0.8
0.9
1.0
Mea
n(F
ract
ion
of A
ll F
acts
See
n)
Edg
eH
iera
rchy
Edg
eH
iera
rchy
Edg
eH
iera
rchy
Edg
eH
iera
rchy
Edg
eH
iera
rchy
Edg
eH
iera
rchy
Edg
eH
iera
rchy
Edg
eH
iera
rchy
Edg
eH
iera
rchy
Edg
eH
iera
rchy
Edg
eH
iera
rchy
Edg
eH
iera
rchy
Edg
eH
iera
rchy
Edg
eH
iera
rchy
Edg
eH
iera
rchy
5 10 15 20 25 30 35 40 45 50 55 60 65 70 75
Structure within Time Interval
Chart
Structure Edge Hierarchy
Distribution of InformationThe cumulative number of unique facts to which
each participant has access over time
Time (minutes)Edge Better Than Hierarchy
Significant at 0.95 level

36
Measures of C2 Effectiveness
• Quality of Information Position– Percentage of relevant facts for the assigned task that a participant
can access as a function of time
– Percentage of key facts for the assigned task that a participant can access as a function of time
• Extent of Shared Information– The average number of participants that have access to each fact as
a function of time
– The average number of participants that have access to each key fact as a function of time

37
-0.1
0.0
0.1
0.2
0.3
0.4
0.5
0.6
0.7
0.8
0.9
1.0
Mea
n(F
ract
ion
of
Rel
evan
t Fac
ts S
een)
Edg
eH
iera
rchy
Edg
eH
iera
rchy
Edg
eH
iera
rchy
Edg
eH
iera
rchy
Edg
eH
iera
rchy
Edg
eH
iera
rchy
Edg
eH
iera
rchy
Edg
eH
iera
rchy
Edg
eH
iera
rchy
Edg
eH
iera
rchy
Edg
eH
iera
rchy
Edg
eH
iera
rchy
Edg
eH
iera
rchy
Edg
eH
iera
rchy
Edg
eH
iera
rchy
5 10 15 20 25 30 35 40 45 50 55 60 65 70 75
Organization within Time Interval
Chart
Organization Edge Hierarchy
MOCE: Quality of Information Position Percentage of relevant facts for the assigned task that
a participant can access as a function of time
Time (minutes)

38
-0.1
0.0
0.1
0.2
0.3
0.4
0.5
0.6
0.7
0.8
0.9
1.0
Mea
n(F
ract
ion
of
Rel
evan
t Fac
ts S
een)
Edg
eH
iera
rchy
Edg
eH
iera
rchy
Edg
eH
iera
rchy
Edg
eH
iera
rchy
Edg
eH
iera
rchy
Edg
eH
iera
rchy
Edg
eH
iera
rchy
Edg
eH
iera
rchy
Edg
eH
iera
rchy
Edg
eH
iera
rchy
Edg
eH
iera
rchy
Edg
eH
iera
rchy
Edg
eH
iera
rchy
Edg
eH
iera
rchy
Edg
eH
iera
rchy
5 10 15 20 25 30 35 40 45 50 55 60 65 70 75
Organization within Time Interval
Chart
Organization Edge Hierarchy
MOCE: Quality of Information Position Percentage of relevant facts for the assigned task that
a participant can access as a function of time
Time (minutes)Edge Better Than Hierarchy
Significant at 0.95 level

39
MOCE: Quality of Information Position Percentage of key facts for the assigned task that a
participant can access as a function of time
-0.1
0.0
0.1
0.2
0.3
0.4
0.50.6
0.7
0.8
0.9
1.0
1.1
Mea
n(F
ract
ion
of
Rel
evan
t Key
Fac
ts)
Edg
eH
iera
rchy
Edg
eH
iera
rchy
Edg
eH
iera
rchy
Edg
eH
iera
rchy
Edg
eH
iera
rchy
Edg
eH
iera
rchy
Edg
eH
iera
rchy
Edg
eH
iera
rchy
Edg
eH
iera
rchy
Edg
eH
iera
rchy
Edg
eH
iera
rchy
Edg
eH
iera
rchy
Edg
eH
iera
rchy
Edg
eH
iera
rchy
Edg
eH
iera
rchy
5 10 15 20 25 30 35 40 45 50 55 60 65 70 75
Organization within Time Interval
Chart
Organization Edge Hierarchy
Time (minutes)
Key fact: Factoid Labeled as “Key” or “Key-Expertise”

40
MOCE: Quality of Information Position Percentage of key facts for the assigned task that a
participant can access as a function of time
-0.1
0.0
0.1
0.2
0.3
0.4
0.50.6
0.7
0.8
0.9
1.0
1.1
Mea
n(F
ract
ion
of
Rel
evan
t Key
Fac
ts)
Edg
eH
iera
rchy
Edg
eH
iera
rchy
Edg
eH
iera
rchy
Edg
eH
iera
rchy
Edg
eH
iera
rchy
Edg
eH
iera
rchy
Edg
eH
iera
rchy
Edg
eH
iera
rchy
Edg
eH
iera
rchy
Edg
eH
iera
rchy
Edg
eH
iera
rchy
Edg
eH
iera
rchy
Edg
eH
iera
rchy
Edg
eH
iera
rchy
Edg
eH
iera
rchy
5 10 15 20 25 30 35 40 45 50 55 60 65 70 75
Organization within Time Interval
Chart
Organization Edge Hierarchy
Time (minutes)Edge Better Than Hierarchy
Significant at 0.95 level
Key fact: Factoid Labeled as “Key” or “Key-Expertise”

41
0
10
Ave
rage
Par
ticip
ants
Kno
win
g
Edg
eH
iera
rchy
Edg
eH
iera
rchy
Edg
eH
iera
rchy
Edg
eH
iera
rchy
Edg
eH
iera
rchy
Edg
eH
iera
rchy
Edg
eH
iera
rchy
Edg
eH
iera
rchy
Edg
eH
iera
rchy
Edg
eH
iera
rchy
Edg
eH
iera
rchy
Edg
eH
iera
rchy
Edg
eH
iera
rchy
Edg
eH
iera
rchy
Edg
eH
iera
rchy
5 10 15 20 25 30 35 40 45 50 55 60 65 70 75
Org Type within Time
Chart
Org Type Edge Hierarchy
MOCE: Extent of Shared InformationThe average number of participants that have
access to each fact as a function of time
Time (minutes)

42
0
10
Ave
rage
Par
ticip
ants
Kno
win
g
Edg
eH
iera
rchy
Edg
eH
iera
rchy
Edg
eH
iera
rchy
Edg
eH
iera
rchy
Edg
eH
iera
rchy
Edg
eH
iera
rchy
Edg
eH
iera
rchy
Edg
eH
iera
rchy
Edg
eH
iera
rchy
Edg
eH
iera
rchy
Edg
eH
iera
rchy
Edg
eH
iera
rchy
Edg
eH
iera
rchy
Edg
eH
iera
rchy
Edg
eH
iera
rchy
5 10 15 20 25 30 35 40 45 50 55 60 65 70 75
Org Type within Time
Chart
Org Type Edge Hierarchy
MOCE: Extent of Shared InformationThe average number of participants that have
access to each fact as a function of time
Time (minutes)Edge Better Than Hierarchy
Significant at 0.95 level

43
MOCE: Extent of Shared InformationThe average number of participants that have access to each key fact as a function of time
Key fact: Factoid Labeled as “Key” or “Key-Expertise”
0
10
Ave
rage
Par
ticip
ants
Kno
win
g
Edg
eH
iera
rchy
Edg
eH
iera
rchy
Edg
eH
iera
rchy
Edg
eH
iera
rchy
Edg
eH
iera
rchy
Edg
eH
iera
rchy
Edg
eH
iera
rchy
Edg
eH
iera
rchy
Edg
eH
iera
rchy
Edg
eH
iera
rchy
Edg
eH
iera
rchy
Edg
eH
iera
rchy
Edg
eH
iera
rchy
Edg
eH
iera
rchy
Edg
eH
iera
rchy
5 10 15 20 25 30 35 40 45 50 55 60 65 70 75
Org Type by Time (minutes)
Average Number of Participants Knowing Key Facts by Time (minutes)
Org Type Edge Hierarchy
Time (minutes)

44
MOCE: Extent of Shared InformationThe average number of participants that have access to each key fact as a function of time
Key fact: Factoid Labeled as “Key” or “Key-Expertise”
0
10
Ave
rage
Par
ticip
ants
Kno
win
g
Edg
eH
iera
rchy
Edg
eH
iera
rchy
Edg
eH
iera
rchy
Edg
eH
iera
rchy
Edg
eH
iera
rchy
Edg
eH
iera
rchy
Edg
eH
iera
rchy
Edg
eH
iera
rchy
Edg
eH
iera
rchy
Edg
eH
iera
rchy
Edg
eH
iera
rchy
Edg
eH
iera
rchy
Edg
eH
iera
rchy
Edg
eH
iera
rchy
Edg
eH
iera
rchy
5 10 15 20 25 30 35 40 45 50 55 60 65 70 75
Org Type by Time (minutes)
Average Number of Participants Knowing Key Facts by Time (minutes)
Org Type Edge Hierarchy
Time (minutes)Edge Better Than Hierarchy
Significant at 0.95 level

45
Intervening Behavioral Variables
• Activity over time (sharing, website posts, website pulls, ID)– Sharing
• Peer-to-peer
• Posting
– Information Seeking
• Pulling
– Identification

46
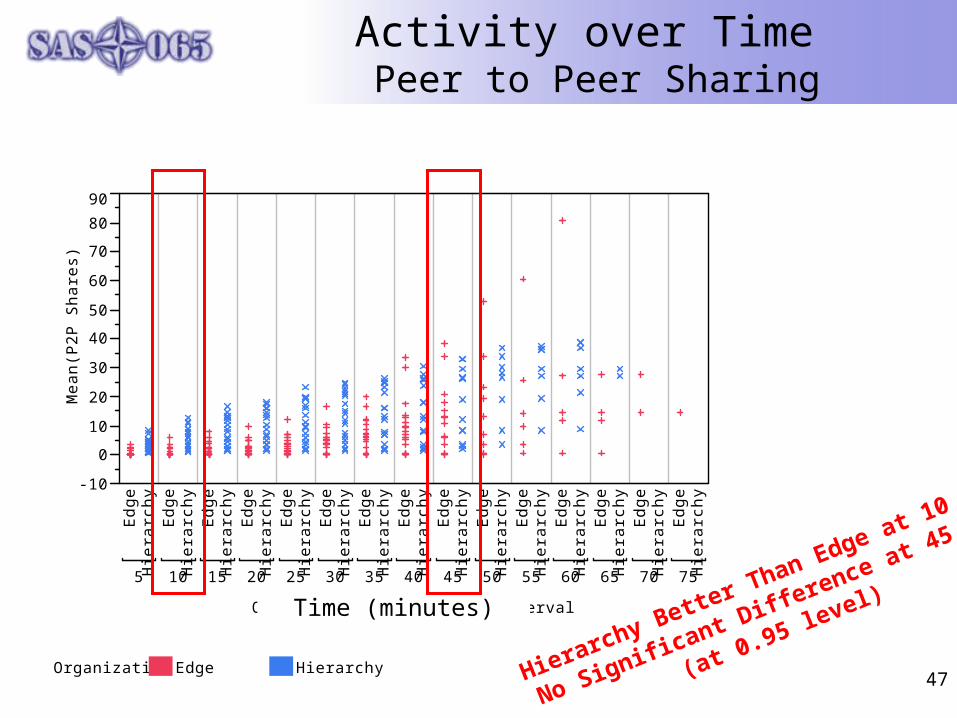
Activity over Time Peer to Peer Sharing
-10
0
10
20
30
40
50
60
70
80
90
Mea
n(P
2P S
hare
s)
Edg
eH
iera
rchy
Edg
eH
iera
rchy
Edg
eH
iera
rchy
Edg
eH
iera
rchy
Edg
eH
iera
rchy
Edg
eH
iera
rchy
Edg
eH
iera
rchy
Edg
eH
iera
rchy
Edg
eH
iera
rchy
Edg
eH
iera
rchy
Edg
eH
iera
rchy
Edg
eH
iera
rchy
Edg
eH
iera
rchy
Edg
eH
iera
rchy
Edg
eH
iera
rchy
5 10 15 20 25 30 35 40 45 50 55 60 65 70 75
Organization within Time Interval
Chart
Organization Edge Hierarchy
Time (minutes)
47
Activity over Time Peer to Peer Sharing
-10
0
10
20
30
40
50
60
70
80
90
Mea
n(P
2P S
hare
s)
Edg
eH
iera
rchy
Edg
eH
iera
rchy
Edg
eH
iera
rchy
Edg
eH
iera
rchy
Edg
eH
iera
rchy
Edg
eH
iera
rchy
Edg
eH
iera
rchy
Edg
eH
iera
rchy
Edg
eH
iera
rchy
Edg
eH
iera
rchy
Edg
eH
iera
rchy
Edg
eH
iera
rchy
Edg
eH
iera
rchy
Edg
eH
iera
rchy
Edg
eH
iera
rchy
5 10 15 20 25 30 35 40 45 50 55 60 65 70 75
Organization within Time Interval
Chart
Organization Edge Hierarchy
Time (minutes)
Hierarchy Better Than Edge at 10 min
No Significant Difference at 45 min
(at 0.95 level)

48
Activity over Time Posts
0
10
Mea
n(P
osts
)
Edg
eH
iera
rchy
Edg
eH
iera
rchy
Edg
eH
iera
rchy
Edg
eH
iera
rchy
Edg
eH
iera
rchy
Edg
eH
iera
rchy
Edg
eH
iera
rchy
Edg
eH
iera
rchy
Edg
eH
iera
rchy
Edg
eH
iera
rchy
Edg
eH
iera
rchy
Edg
eH
iera
rchy
Edg
eH
iera
rchy
Edg
eH
iera
rchy
Edg
eH
iera
rchy
5 10 15 20 25 30 35 40 45 50 55 60 65 70 75
Organization within Time Interval
Chart
Organization Edge Hierarchy
Time (minutes)

49
Activity over Time Posts
0
10
Mea
n(P
osts
)
Edg
eH
iera
rchy
Edg
eH
iera
rchy
Edg
eH
iera
rchy
Edg
eH
iera
rchy
Edg
eH
iera
rchy
Edg
eH
iera
rchy
Edg
eH
iera
rchy
Edg
eH
iera
rchy
Edg
eH
iera
rchy
Edg
eH
iera
rchy
Edg
eH
iera
rchy
Edg
eH
iera
rchy
Edg
eH
iera
rchy
Edg
eH
iera
rchy
Edg
eH
iera
rchy
5 10 15 20 25 30 35 40 45 50 55 60 65 70 75
Organization within Time Interval
Chart
Organization Edge Hierarchy
Time (minutes)No Significant Difference
at 0.95 level

50
Activity over Time Information Seeking (Pulls)
0
100
Mea
n(P
ulls
)
Edg
eH
iera
rchy
Edg
eH
iera
rchy
Edg
eH
iera
rchy
Edg
eH
iera
rchy
Edg
eH
iera
rchy
Edg
eH
iera
rchy
Edg
eH
iera
rchy
Edg
eH
iera
rchy
Edg
eH
iera
rchy
Edg
eH
iera
rchy
Edg
eH
iera
rchy
Edg
eH
iera
rchy
Edg
eH
iera
rchy
Edg
eH
iera
rchy
Edg
eH
iera
rchy
5 10 15 20 25 30 35 40 45 50 55 60 65 70 75
Organization within Time Interval
Chart
Organization Edge Hierarchy
Time (minutes)

51
Activity over Time Information Seeking (Pulls)
0
100
Mea
n(P
ulls
)
Edg
eH
iera
rchy
Edg
eH
iera
rchy
Edg
eH
iera
rchy
Edg
eH
iera
rchy
Edg
eH
iera
rchy
Edg
eH
iera
rchy
Edg
eH
iera
rchy
Edg
eH
iera
rchy
Edg
eH
iera
rchy
Edg
eH
iera
rchy
Edg
eH
iera
rchy
Edg
eH
iera
rchy
Edg
eH
iera
rchy
Edg
eH
iera
rchy
Edg
eH
iera
rchy
5 10 15 20 25 30 35 40 45 50 55 60 65 70 75
Organization within Time Interval
Chart
Organization Edge Hierarchy
Time (minutes)Edge Better Than Hierarchy
Significant at 0.95 Level

52
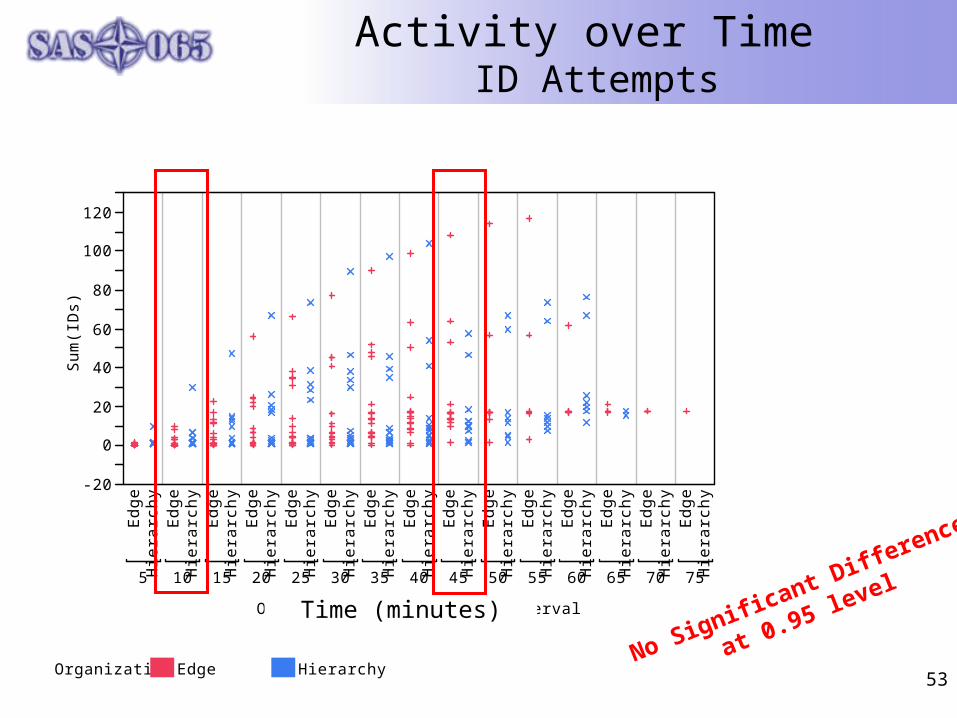
Activity over Time ID Attempts
-20
0
20
40
60
80
100
120
Sum
(ID
s)
Edg
eH
iera
rchy
Edg
eH
iera
rchy
Edg
eH
iera
rchy
Edg
eH
iera
rchy
Edg
eH
iera
rchy
Edg
eH
iera
rchy
Edg
eH
iera
rchy
Edg
eH
iera
rchy
Edg
eH
iera
rchy
Edg
eH
iera
rchy
Edg
eH
iera
rchy
Edg
eH
iera
rchy
Edg
eH
iera
rchy
Edg
eH
iera
rchy
Edg
eH
iera
rchy
5 10 15 20 25 30 35 40 45 50 55 60 65 70 75
Organization within Time Interval
Chart
Organization Edge Hierarchy
Time (minutes)
53
Activity over Time ID Attempts
-20
0
20
40
60
80
100
120
Sum
(ID
s)
Edg
eH
iera
rchy
Edg
eH
iera
rchy
Edg
eH
iera
rchy
Edg
eH
iera
rchy
Edg
eH
iera
rchy
Edg
eH
iera
rchy
Edg
eH
iera
rchy
Edg
eH
iera
rchy
Edg
eH
iera
rchy
Edg
eH
iera
rchy
Edg
eH
iera
rchy
Edg
eH
iera
rchy
Edg
eH
iera
rchy
Edg
eH
iera
rchy
Edg
eH
iera
rchy
5 10 15 20 25 30 35 40 45 50 55 60 65 70 75
Organization within Time Interval
Chart
Organization Edge Hierarchy
Time (minutes)No Significant Difference
at 0.95 level

54
Summary of Findings
• Edge structures exhibit more mature behaviors than Hierarchical structures– Distribution of Information– Quality of Information Position– Extent of Shared Information– Information Seeking (Pulling)
• Edge structures are more effective than Hierarchical structures– Correctness– Timeliness– Accuracy Rate
• Edge structures are generally more efficient than Hierarchical structures– Productivity (Person-Minutes)– Productivity (Actions) – at 90% level– Speed – at 90% level
• Edge structures are more agile than Hierarchical structures– Effectiveness over Problem Difficulty

55
Agenda
• Background
• Available Data
• Analysis Plan
• Results of Analyses
• Conclusions

56
Conclusion
• The data are consistent with the NATO C2 Maturity Model assumptions and hypotheses
• Additional analyses still underway– Extraction and analysis of network metrics
– Bivariate and multivariate analyses