1 chapter 1: introduction. embedded systems overview what are they? design challenge –...
TRANSCRIPT
1
Chapter 1: Introduction
EMBEDDED SYSTEM DESIGN

Outline
Embedded systems overview What are they?
Design challenge – optimizing design metrics
Technologies Processor technologies IC technologies Design technologies
2

Embedded systems overview Computing systems are everywhere Most of us think of “desktop”
computers PC’s Laptops Mainframes Servers
But there’s another type of computing system Far more common...
3

Embedded systems overview Embedded computing
systems Computing systems embedded
within electronic devices
Hard to define. Nearly any computing system other than a desktop computer
Billions of units produced yearly, versus millions of desktop units
4
Computers are in here...
and here...
and even here...
Lots more of these, though they cost a lot
less each.

A “short list” of embedded systems
And the list goes on and on
5
Anti-lock brakesAuto-focus camerasAutomatic teller machinesAutomatic toll systemsAutomatic transmissionAvionic systemsBattery chargersCamcordersCell phonesCell-phone base stationsCordless phonesCruise controlCurbside check-in systemsDigital camerasDisk drivesElectronic card readersElectronic instrumentsElectronic toys/gamesFactory controlFax machinesFingerprint identifiersHome security systemsLife-support systemsMedical testing systems
ModemsMPEG decodersNetwork cardsNetwork switches/routersOn-board navigationPagersPhotocopiersPoint-of-sale systemsPortable video gamesPrintersSatellite phonesScannersSmart ovens/dishwashersSpeech recognizersStereo systemsTeleconferencing systemsTelevisionsTemperature controllersTheft tracking systemsTV set-top boxesVCR’s, DVD playersVideo game consolesVideo phonesWashers and dryers

Some common characteristics of embedded systems
Single-functioned Executes a single program, repeatedly
Tightly-constrained Low cost, low power, small, fast, etc.
Reactive and real-time Continually reacts to changes in the
system’s environment Must compute certain results in real-time
without delay
6

An embedded system example – a digital camera
7
Microcontroller
CCD preprocessor Pixel coprocessorA2D
D2A
JPEG codec
DMA controller
Memory controller ISA bus interface UART LCD ctrl
Display ctrl
Multiplier/Accum
Digital camera chip
lens
CCD
• Single-functioned -- always a digital camera• Tightly-constrained -- Low cost, low power, small,
fast• Reactive and real-time -- only to a small extent

Design challenge – optimizing design metrics
Obvious design goal: Construct an implementation with desired
functionality Key design challenge:
Simultaneously optimize numerous design metrics
Design metric A measurable feature of a system’s
implementation Optimizing design metrics is a key challenge
8

Design challenge – optimizing design metrics
Common metrics Unit cost: the monetary cost of manufacturing each copy of
the system, excluding NRE cost
NRE cost (Non-Recurring Engineering cost): - refers to the one-time cost of researching, developing, designing and testing a new product
Size: the physical space required by the system
Performance: the execution time or throughput of the system
Power: the amount of power consumed by the system
Flexibility: the ability to change the functionality of the system without incurring heavy NRE cost
9

Design challenge – optimizing design metrics
Common metrics (continued) Time-to-prototype: the time needed to build a
working version of the system
Time-to-market: the time required to develop a system to the point that it can be released and sold to customers
Maintainability: the ability to modify the system after its initial release
Correctness, safety, many more
10

Design metric competition -- improving one may worsen others
Expertise with both software and hardware is needed to optimize design metrics Not just a hardware or
software expert A designer must be
comfortable with various technologies in order to choose the best for a given application and constraints
11
SizePerformance
Power
NRE cost
Microcontroller
CCD preprocessor Pixel coprocessorA2D
D2A
JPEG codec
DMA controller
Memory controller ISA bus interface UART LCD ctrl
Display ctrl
Multiplier/Accum
Digital camera chip
lens
CCD
Hardware
Software

Time-to-market: a demanding design metric
Time required to develop a product to the point it can be sold to customers
Market window Period during which the
product would have highest sales
Average time-to-market constraint is about 8 months
Delays can be costly
12
Rev
enue
s ($
)
Time (months)

Losses due to delayed market entry
Simplified revenue model Product life = 2W, peak
at W Time of market entry
defines a triangle, representing market penetration
Triangle area equals revenue
Loss The difference between
the on-time and delayed triangle areas
13
On-time Delayedentry entry
Peak revenue
Peak revenue from delayed entry
Market rise Market fall
W 2W
Time
D
On-time
Delayed
Rev
enue
s ($
)

The performance design metric Widely-used measure of system, widely-abused
Clock frequency, instructions per second – not good measures Digital camera example – a user cares about how fast it processes
images, not clock speed or instructions per second
Latency (response time) Time between task start and end
Throughput Tasks per second, e.g. Camera A processes 4 images per second Throughput can be more than latency seems to imply due to
concurrency, e.g. Camera B may process 8 images per second (by capturing a new image while previous image is being stored).
Speedup of B over A = B’s performance / A’s performance Throughput speedup = 8/4 = 2
14

Three key embedded system technologies
Technology A manner of accomplishing a task,
especially using technical processes, methods, or knowledge
Three key technologies for embedded systems Processor technology IC technology Design technology
15

Processor technology The architecture of the computation engine used
to implement a system’s desired functionality Processor does not have to be programmable
“Processor” not equal to general-purpose processor
16
Application-specific
Registers
CustomALU
DatapathController
Program memory
Assembly code for:
total = 0 for i =1 to …
Control logic and State register
Datamemory
IR PC
Single-purpose (“hardware”)
DatapathController
Control logic
State register
Datamemory
index
total
+
IR PC
Registerfile
GeneralALU
DatapathController
Program memory
Assembly code for:
total = 0 for i =1 to …
Control logic and
State register
Datamemory
General-purpose (“software”)

Processor technology Processors vary in their customization for the problem at
hand
17
total = 0for i = 1 to N loop total += M[i]end loop
General-purpose processor
Single-purpose processor
Application-specific processor
Desired functionality

General-purpose processors
Programmable device used in a variety of applications Also known as “microprocessor”
Features Program memory General datapath with large register file
and general ALU
User benefits Low time-to-market and NRE costs High flexibility
“Pentium” the most well-known, but there are hundreds of others
18
IR PC
Registerfile
GeneralALU
DatapathController
Program memory
Assembly code for:
total = 0 for i =1 to …
Control logic and
State register
Datamemory

Single-purpose processors Digital circuit designed to execute
exactly one program a.k.a. coprocessor, accelerator or
peripheral Features
Contains only the components needed to execute a single program
No program memory Benefits
Fast Low power Small size
19
DatapathController
Control logic
State register
Datamemory
index
total
+
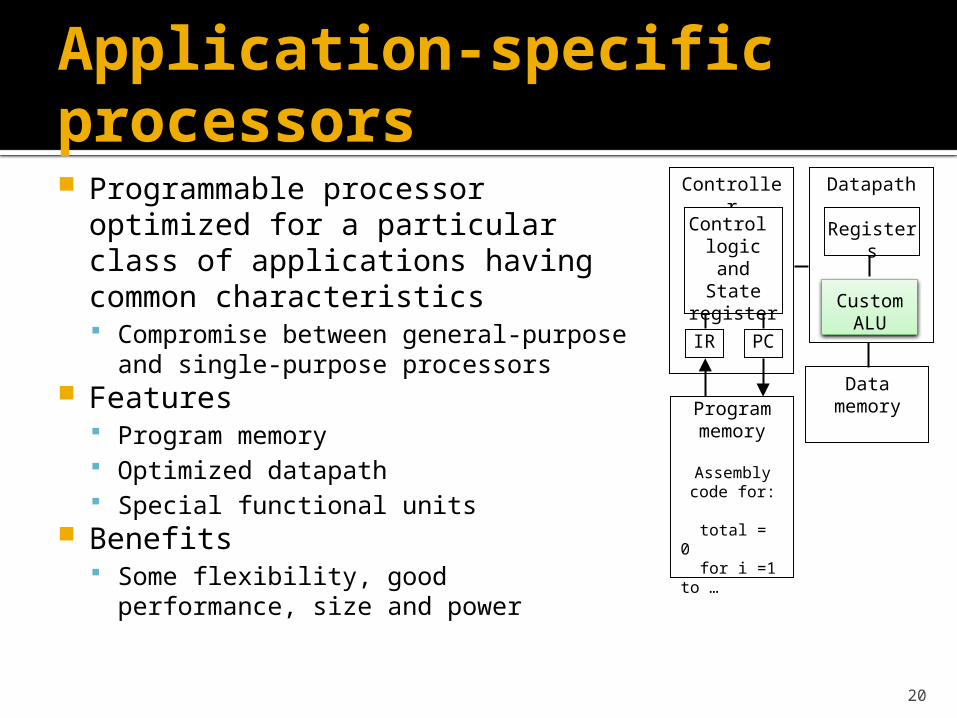
Application-specific processors Programmable processor
optimized for a particular class of applications having common characteristics Compromise between general-purpose
and single-purpose processors Features
Program memory Optimized datapath Special functional units
Benefits Some flexibility, good performance,
size and power
20
IR PC
Registers
CustomALU
DatapathController
Program memory
Assembly code for:
total = 0 for i =1 to …
Control logic and
State register
Datamemory

IC technology
The manner in which a digital (gate-level) implementation is mapped onto an IC IC: Integrated circuit, or “chip” IC technologies differ in their customization to a
design IC’s consist of numerous layers (perhaps 10 or more)▪ IC technologies differ with respect to who builds each layer
and when
21
source drainchanneloxidegate
Silicon substrate
IC package IC
IC technology
Three types of IC technologies Full-custom/VLSI Semi-custom ASIC (gate array and
standard cell) PLD (Programmable Logic Device)
22

Full-custom/VLSI
All layers are optimized for an embedded system’s particular digital implementation Placing transistors Sizing transistors Routing wires
Benefits Excellent performance, small size, low power
Drawbacks High NRE cost (e.g., $300k), long time-to-market
23

Semi-custom
Lower layers are fully or partially built Designers are left with routing of wires and
maybe placing some blocks
Benefits Good performance, good size, less NRE cost
than a full-custom implementation (perhaps $10k to $100k)
Drawbacks Still require weeks to months to develop
24

PLD (Programmable Logic Device) All layers already exist
Designers can purchase an IC Connections on the IC are either created or
destroyed to implement desired functionality Field-Programmable Gate Array (FPGA) very popular
Benefits Low NRE costs, almost instant IC availability
Drawbacks Bigger, expensive (perhaps $30 per unit), power
hungry, slower
25

Moore’s law The most important trend in embedded systems
Predicted in 1965 by Intel co-founder Gordon MooreIC transistor capacity has doubled roughly every 18
months for the past several decades
26
10,000
1,000
100
10
1
0.1
0.01
0.001
Logic transistors
per chip(in millions)
1981
1983
1985
1987
1989
1991
1993
1995
1997
1999
2001
2003
2005
2007
2009
Note: logarithmic scale

Graphical illustration of Moore’s law
Something that doubles frequently grows more quickly than most people realize!
27
1981 1984 1987 1990 1993 1996 1999 2002
Leading edgechip in 1981
10,000transistors
Leading edgechip in 2002
150,000,000transistors

Design Technology
The manner in which we convert our concept of desired system functionality into an implementation
28
Libraries/IP: Incorporates pre-designed implementation from lower abstraction level into higher level.
Systemspecification
Behavioralspecification
RTspecification
Logicspecification
To final implementation
Compilation/Synthesis: Automates exploration and insertion of implementation details for lower level.
Test/Verification: Ensures correct functionality at each level, thus reducing costly iterations between levels.
Compilation/Synthesis
Libraries/IP
Test/Verification
Systemsynthesi
s
Behaviorsynthesis
RTsynthesi
s
Logicsynthesis
Hw/Sw/OS
Cores
RTcomponents
Gates/Cells
Model simulat./checkers
Hw-Swcosimulators
HDL simulators
Gate simulators

Design productivity exponential increase
Exponential increase over the past few decades 29
100,000
10,000
1,000
100
10
1
0.1
0.01
1983
1981
1987
1989
1991
1993
1985
1995
1997
1999
2001
2003
2005
2007
2009
Pro
duct
ivit
y(K
) T
rans
./Sta
ff –
Mo.

The co-design ladder
In the past: Hardware and software
design technologies were very different
Recent maturation of synthesis enables a unified view of hardware and software
Hardware/software “codesign”
30
Implementation
Assembly instructions
Machine instructions
Register transfers
Compilers(1960's,1970's)
Assemblers, linkers(1950's, 1960's)
Behavioral synthesis(1990's)
RT synthesis(1980's, 1990's)
Logic synthesis(1970's, 1980's)
Microprocessor plus program bits: “software”
VLSI, ASIC, or PLD implementation: “hardware”
Logic gates
Logic equations / FSM's
Sequential program code (e.g., C, VHDL)
The choice of hardware versus software for a particular function is simply a tradeoff among various design metrics, like performance, power, size, NRE cost,
and especially flexibility; there is no fundamental difference between what hardware or software can implement.

Independence of processor and IC technologies Basic tradeoff
General vs. custom With respect to processor technology or IC technology The two technologies are independent
31
General-purpose
processorASIC
Single-purposeprocesso
r
Semi-custom
PLD Full-custom
General,providing improved:
Customized, providing improved:
Power efficiencyPerformance
SizeCost (high volume)
FlexibilityMaintainability
NRE costTime- to-prototype
Time-to-marketCost (low volume)

Design productivity gap
While designer productivity has grown at an impressive rate over the past decades, the rate of improvement has not kept pace with chip capacity
32
10,000
1,000
100
10
1
0.1
0.01
0.001
Logic transistors per chip
(in millions)
100,000
10,000
1000
100
10
1
0.1
0.01
Productivity(K) Trans./Staff-Mo.
1981
1983
1985
1987
1989
1991
1993
1995
1997
1999
2001
2003
2005
2007
2009
IC capacity
Productivity
Gap

Design productivity gap 1981 leading edge chip required 100 designer
months 10,000 transistors / 100 transistors/month
2002 leading edge chip requires 30,000 designer months 150,000,000 / 5000 transistors/month
Designer cost increase from $1M to $300M
33
10,000
1,000
100
10
1
0.1
0.01
0.001
Logic transistors per chip
(in millions)
100,000
10,000
1000
100
10
1
0.1
0.01
Productivity(K) Trans./Staff-Mo.
1981
1983
1985
1987
1989
1991
1993
1995
1997
1999
2001
2003
2005
2007
2009
IC capacity
productivity
Gap

The mythical man-month The situation is even worse than the productivity gap indicates In theory, adding designers to team reduces project
completion time In reality, productivity per designer decreases due to
complexities of team management and communication In the software community, known as “the mythical man-
month” (Brooks 1975) At some point, can actually lengthen project completion time!
34
10 20 30 400
10000
20000
30000
40000
50000
60000
43
24
1916 15 16
18
23
Team
Individual
Months until completion
Number of designers
• 1M transistors, 1 designer=5000 trans/month
• Each additional designer reduces for 100 trans/month
• So 2 designers produce 4900 trans/month each

Summary
Embedded systems are everywhere
Key challenge: optimization of design metrics Design metrics compete with one another
A unified view of hardware and software is necessary to improve productivity
Three key technologies Processor: general-purpose, application-specific, single-
purpose IC: Full-custom, semi-custom, PLD Design: Compilation/synthesis, libraries/IP,
test/verification35