1 commercial visibility of rural telecoms by: eng. ibrahim eisa el-baigawi, manager of projects...
TRANSCRIPT

1
Commercial Visibility of Rural TelecomsCommercial Visibility of Rural Telecoms
By: Eng. Ibrahim Eisa El-BAIGAWI, Manager of Projects Department, Sudatel, Sudan
Tel: + 249 1 83 77 63 99 Fax: + 249 1 83 78 50 27Cell: +249 9 12 30 32 01E-mail: [email protected] or [email protected]: [email protected] or [email protected]
Regional Workshop onRegional Workshop on
“ “ Visibility of Rural Connectivity ”Visibility of Rural Connectivity ”KhartoumKhartoum –Sudan –Sudan 05 - 07 September 200405 - 07 September 2004

2
Major Points:
1. Abstract2. Definition of Rural Areas/ Telecoms3. Rural Communications in Africa4. CAPEX and OPEX of Rural Telecom in Sudan5. Marketing of Rural Telecoms6. Resources for Telecom Business7. Revenues and ARPU’s8. Analysis of Commercial Viability9. Conclusion and remarks10. References
3
1.0 Abstract (1)1.0 Abstract (1): • Over 75 % of the people in the third world live in the
rural areas.
• The rural areas where those people live suffer from the lack of almost all kinds of infrastructures (roads, rails, electricity,. and ICT).
• As a human right, all the mankind should have an access to the ICT.
• In fact almost every one need an access to the voice/ telephone, data and Internet services and the relevant applications.
• The rural areas need the ICT services no matter what the cost is.
4
1.0 Abstract (2)1.0 Abstract (2): • The ICT is mandatory vehicle for the socio-economic
development.
• The investment cost of the rural networks is reasonably higher than that of a traditional network.
• The revenues from a telecom business in the rural areas are fairly low due to the poverty and lack of the affordability.
• In spite of these facts, there are some rural areas in the world who have shown remarkable commercial viability and business attractiveness.
• This paper will try to explore the rural telecom business and to proof its viability in some areas of the world (e.g. Sudan).

5
2.0 Definition of Rural Areas/ Telecoms (1)2.0 Definition of Rural Areas/ Telecoms (1):
• Urban, Su-Urban, Rural, Remote Isolated Areas• Rural areas are the areas in which people life is
more difficult due to lack of infrastructures. • Rural areas have small number of inhabitants the
residents and business buildings if any are in wide spread
• In the rural areas power/ electricity is either not available or unstable.

6
2.0 Definition of Rural Areas/ Telecoms (2)2.0 Definition of Rural Areas/ Telecoms (2):
• In the remote isolated areas there are very low levels of economic that makes the telecom services not affordable
• Rural areas are the areas that in bad need for economic, social, cultural development (walk 10 km to access service)
• Rural areas can disturb the stability of the urban areas and disorder the socio-economic structure if not treated well by development

7
2.0 Definition of Rural Areas/ Telecoms (3)2.0 Definition of Rural Areas/ Telecoms (3): • Rural Telecom System can be:
• Wireless Local Loop (WLL) systems
• Satellite systems
• Small switches
• Vsat + WLL
• Rural Telecom Technologies can be:• TDMA based
• CDMA based
• GMPC, Vsat
• GSM

8
2.0 Definition of Rural Areas/ Telecoms (4)2.0 Definition of Rural Areas/ Telecoms (4): Pros and cons of each standard in each geographical area type
DECT PHS GSM Proprietary WLL
Analogue WLL
CDMA Vsat
Urban X X X X XSuburban X X X X XFlat high-usage
X X X X
Flat low-usage
X X
Clustered high-usage
X X X
Clustered low-usage
X
Source: Analysis

9
2.0 Definition of Rural Areas/ Telecoms (5)2.0 Definition of Rural Areas/ Telecoms (5): Different technologies have coverage –specific cost structures
Source: Analysis
•TDMA-most effective in dense rural and urban areas
•Fixed cellular-cost-effective for urban and certain rural areas
•CDMA-best in high-density suburban/ flat areas
•Satellite-appropriate for remote isolated areas
‘’’

10
2.0 Definition of Rural Areas/ Telecoms (5)2.0 Definition of Rural Areas/ Telecoms (5): Example of cost characteristic curve
Source: Analysis
Decreasing subscriber density
Cost per access line
Wire line access
Wireless access

11
2.0 Definition of Rural Areas/ Telecoms (6)2.0 Definition of Rural Areas/ Telecoms (6): Spectrum is becoming more valuable
Source: Analysis
• In rural areas spectrum is not an issue, but closer to urban areas it can become of value.
• Spectrum is now seen as a national asset
• Technology choice is driven by the spectrum (range coverage)
• Spectrum is limited by existing users
12
2.0 Definition of Rural Areas/ Telecoms (7)2.0 Definition of Rural Areas/ Telecoms (7):
• Rural Telecom Manufacturers include many like:• Qualcomm, ZTE, Huawei, L3,…. (CDMA)
• SR Telecom, NEC, Intracom, Alcatel ..etc (TDMA)
• Ericsson, Motorola, …(GSM)
13
3.0 Rural Communications in Africa (1)3.0 Rural Communications in Africa (1): • Mitland Report”The Missing Link” PROMISES
(Nairobi 1982, ITU conference, committee report 1984) …. Telecom growth & Economic progress.
• The Universal-Service (Every individual have telephone Access)
• The Universal-Access (Those who can access a phone)
• The access to the Internet is a human right• Digital-Divide (Gaps to Telecommunications and
to the Information services, ICT)
14
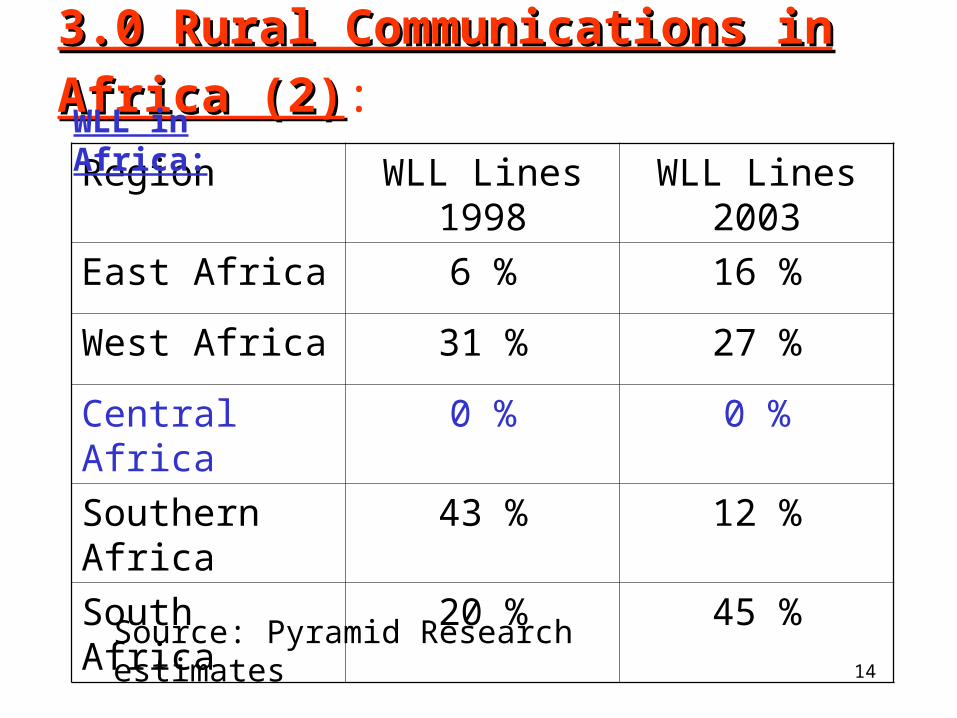
3.0 Rural Communications in Africa (2)3.0 Rural Communications in Africa (2):
Region WLL Lines 1998
WLL Lines 2003
East Africa 6 % 16 %
West Africa 31 % 27 %
Central Africa 0 % 0 %
Southern Africa 43 % 12 %
South Africa 20 % 45 %
Source: Pyramid Research estimates
WLL in Africa:

15
3.0 Rural Communications in Africa (3)3.0 Rural Communications in Africa (3):
Region WLL Lines 1998
WLL Lines 2003
East Africa 6300 232900
West Africa 32190 402810
Central Africa 400 4527
Southern Africa 43160 183860
South Africa 21000 658202
Source: Pyramid Research estimates
WLL in Africa:

16
Rural Communications in SudanRural Communications in Sudan:
0
10000
20000
30000
40000
50000
60000
الكلية 1280 2080 8380 12279 13423 24073 26443 55670
العاملة 610 1147 3432 3900 4857 15447 17817 22707
الشاغرة 670 933 4948 8379 8566 8626 8626 32963
النمو 610 537 2285 468 957 10590 2370 4890
1995م 1998م 1999م 2000م 2001م 2002م 2003م 2004م
Source: Core Planning Division
1995-2004
“Penetration: fixed line around 4 %, Rural around 0.16 %”
17
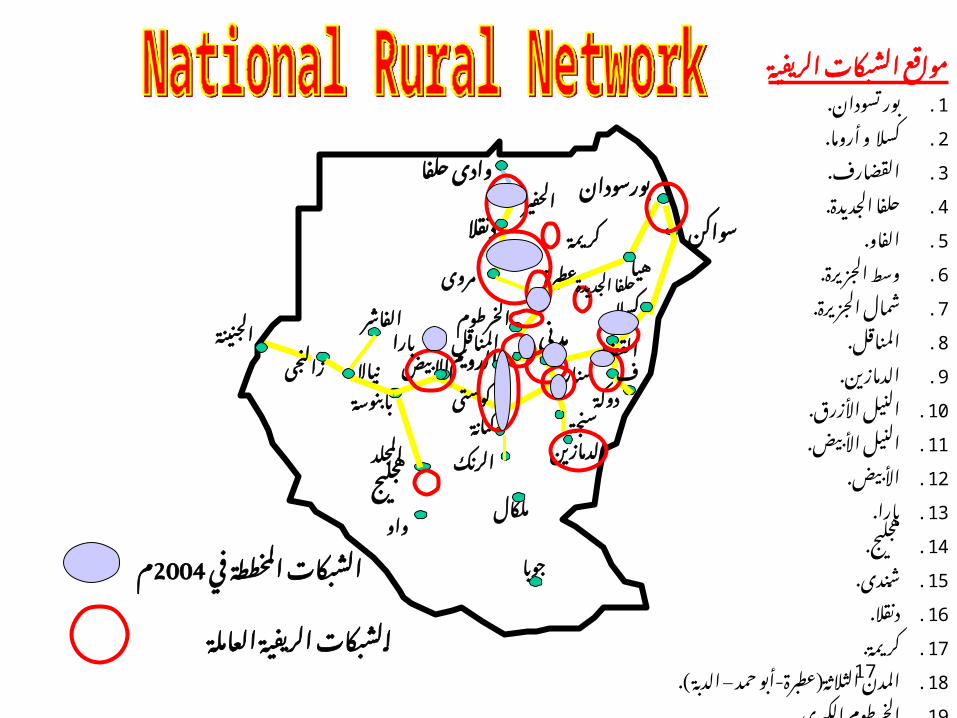
العاملة الريفية الشبكات
الدويم
المناقل مدني
دوكة
الجنينة
كسال
الدمازين
كنانة
عطبرة هيا
وادى حلفا
دنقال
بورسودان
الخرطوم
االبيض
واو
نياال سنار
ملكال
بابنوسة
مروى
جوبا
الفاشر
زالنجى
المجلد الرنك
سواكن
سنجة
الحفير
كوست ى
القضارف
المخططة الشبكاتم2004في
حلفا الجديدة
الريفية الشبكات مواقع
.1. تسودان بور
.2. أروما و كسال
القضارف.3.
.4. الجديدة حلفا
الفــــــاو.5.
.6. الجزيرة وسط
.7. الجزيرة شمال
المناقــــل.8.
الدمازين.9.
.10. األزرق النيل
.11. األبيض النيل
األبيض.12.
بـــــارا.13.
هجليج.14.
شــندى.15.
دنقـــال.16.
كريمة.17.
.18 – - ) حمد أبو عطبرة الثالثة المدنالدبة ).
.19. الكبرى الخرطوم
بارا
كريمة
هجليج
18
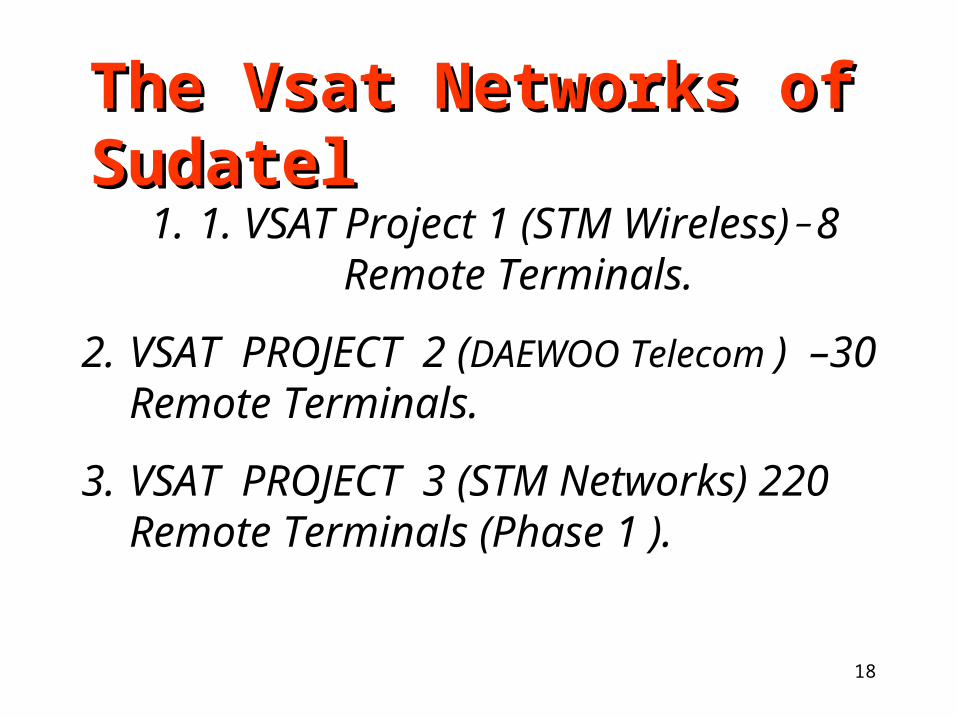
1. 1. VSAT Project 1 (STM Wireless)- 8 Remote Terminals.
2. VSAT PROJECT 2 (DAEWOO Telecom ) –30 Remote Terminals.
3. VSAT PROJECT 3 (STM Networks) 220 Remote Terminals (Phase 1 ).
The Vsat Networks of SudatelThe Vsat Networks of Sudatel

19
VSAT Projects 1& 2- Network Architecture
ARABSAT 2B @ 30.5° East
LEGEND
VSAT 1
Remote Terminal
Main Hub
VSAT 2 Remotes
20
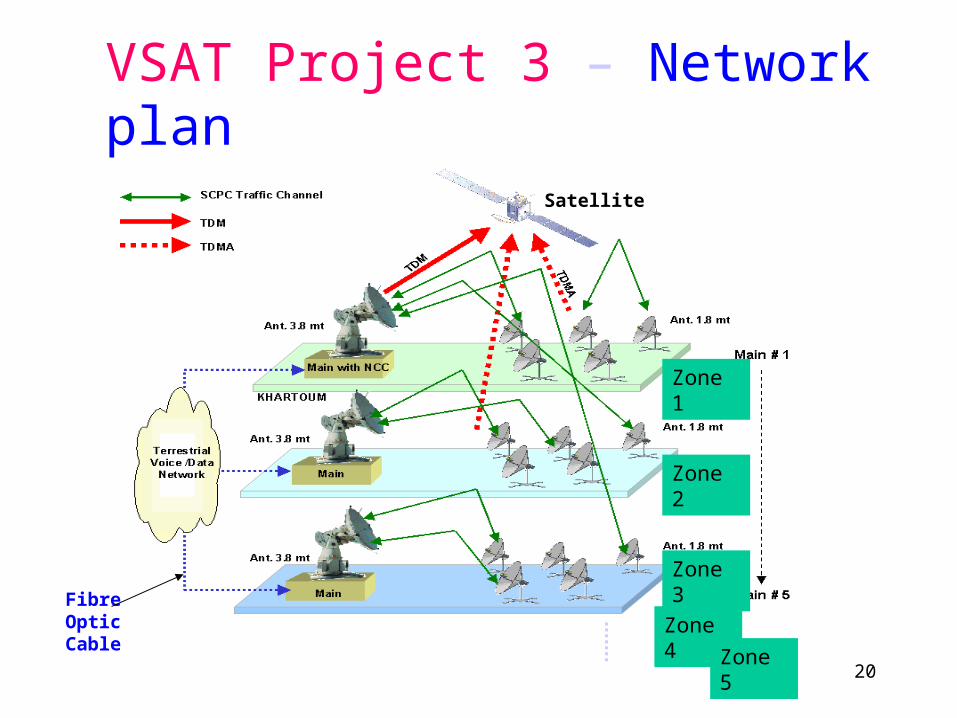
VSAT Project 3 – Network plan
Satellite
Zone 1
Zone 2
Zone 3
Zone 4
Zone 5
Fibre Optic Cable
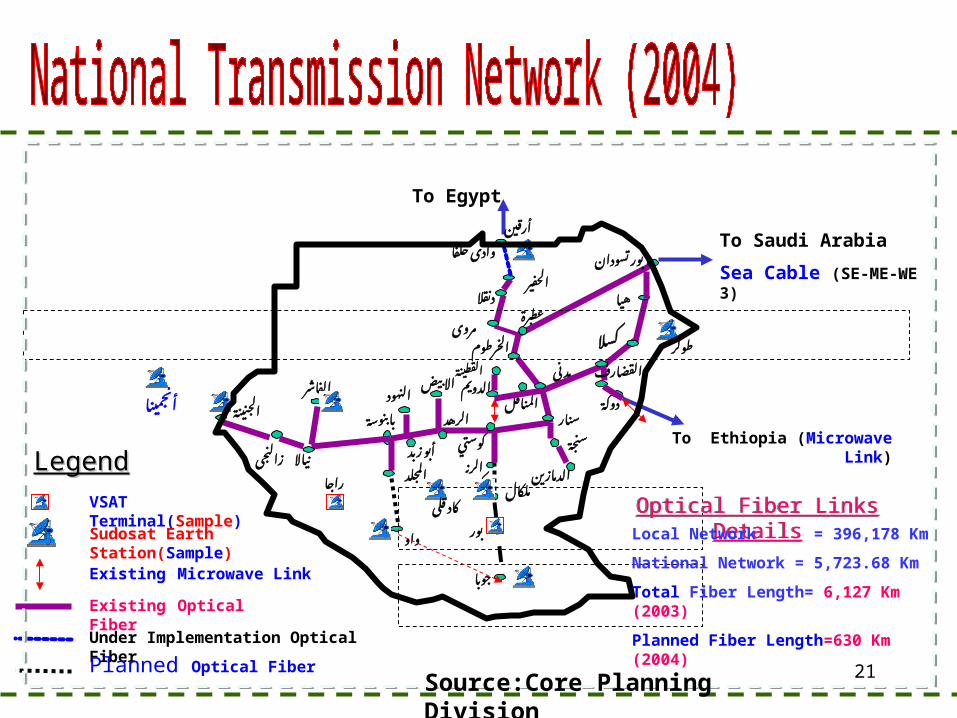
21
الدويمالمناقل
مدني
دوكة
كسال
الدمازين
كوستي
عطبرةهيا
النهود
حلفا وادى
دنقال
تسودان بور
واو
نياال
ملكال
بابنوسة
مروى
الفاشر
زالنجىالمجلد
الرنك
سنجة
الحفير
سنار
أرقين
أبو زبد
القطينة
أنجمينا
راجا
الخرطومطوكر
االبيض
الرهد
بور
جوبا
الجنينة
قلى كاد
Existing Optical Fiber
To Saudi Arabia
Sea Cable (SE-ME-WE 3)
Existing Microwave Link
القضارف
To Egypt
Under Implementation Optical Fiber Planned Optical Fiber
To Ethiopia (Microwave Link)
VSAT Terminal(Sample)
Optical Fiber Links DetailsOptical Fiber Links DetailsLocal Network = 396,178 Km
National Network = 5,723.68 Km
Total Fiber Length= 6,127 Km (2003)
Planned Fiber Length=630 Km (2004)
Sudosat Earth Station(Sample)
LegendLegend
Source:Core Planning Division

22
Annual Increase in Vsat & Sudosat stations (Sudatel)Annual Increase in Vsat & Sudosat stations (Sudatel)
Network Total Satellite
Channels
Remote stations
2003
Remote stations
2004
Total Remotes EOY 04
Rate of Increase
Vsat 38 38 62 120 163 %
Sudosat 809 36 6 42 17 %

23
4.0 Capex and Opex of Rural Telecoms (1)4.0 Capex and Opex of Rural Telecoms (1):
• The financial evaluation process is complex:• Business plans must analyze all factors equally
and business models should be able to determine which factor most sensitive to change.
• Evaluation includes: Demand, population density, coverage, equipment cost, regulatory framework, traffic, spectrum availability,
• Regulatory framework affects three economic variables: spectrum availability, traffic & coverage.
24
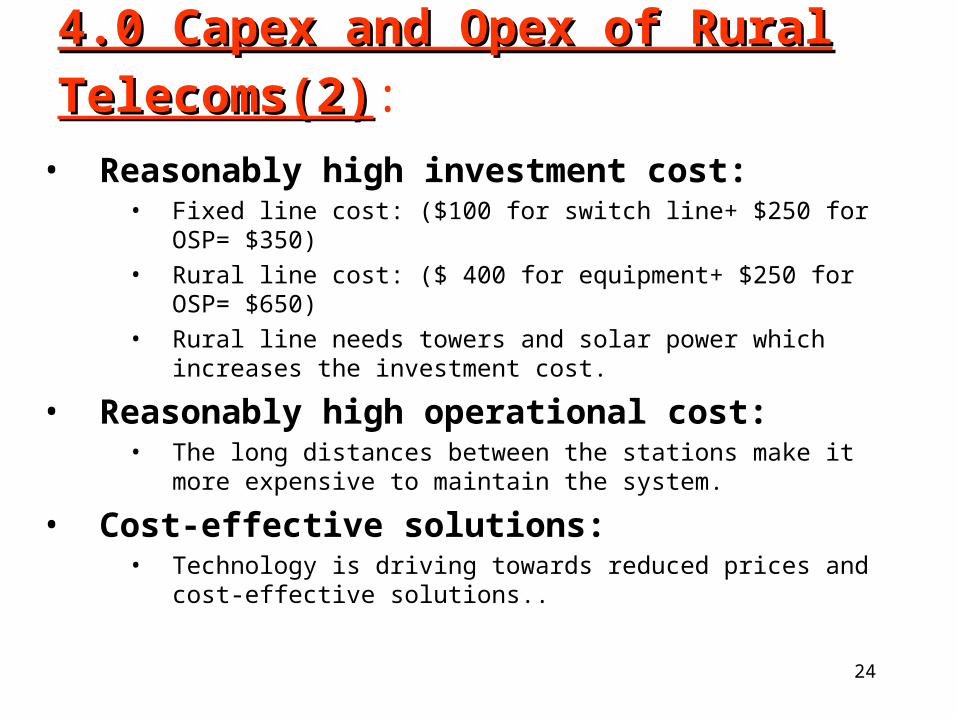
4.0 Capex and Opex of Rural Telecoms(2)4.0 Capex and Opex of Rural Telecoms(2):
• Reasonably high investment cost:• Fixed line cost: ($100 for switch line+ $250 for OSP= $350)
• Rural line cost: ($ 400 for equipment+ $250 for OSP= $650)
• Rural line needs towers and solar power which increases the investment cost.
• Reasonably high operational cost:• The long distances between the stations make it more expensive to
maintain the system.
• Cost-effective solutions:• Technology is driving towards reduced prices and cost-effective
solutions..

25
4.0 Capex and Opex of Rural Telecoms(3)4.0 Capex and Opex of Rural Telecoms(3):
• Installed capital costs are much more than sometimes quoted:
• Switch, transmission, access system, buildings, power
• Full operating costs are probably 25 % of capital cost per year:
• depreciation 8-15 % depending on technology• admin,marketing, operation & maintenance 10-15 %.• finance 4-5 %
Cost: General Rules
26
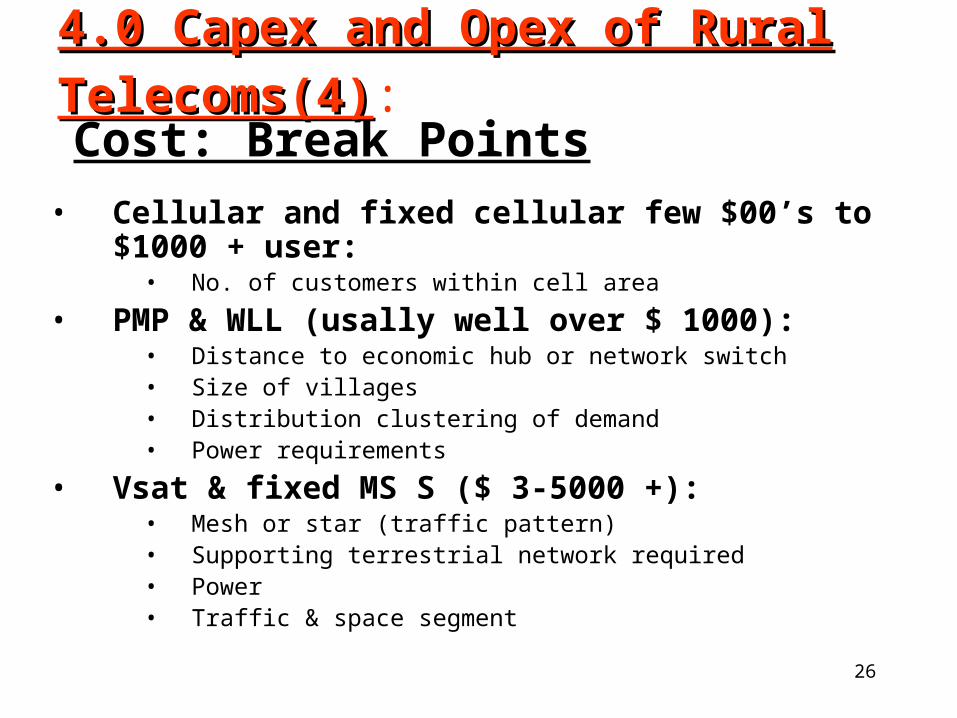
4.0 Capex and Opex of Rural Telecoms(4)4.0 Capex and Opex of Rural Telecoms(4):
• Cellular and fixed cellular few $00’s to $1000 + user:• No. of customers within cell area
• PMP & WLL (usally well over $ 1000):• Distance to economic hub or network switch• Size of villages• Distribution clustering of demand• Power requirements
• Vsat & fixed MS S ($ 3-5000 +):• Mesh or star (traffic pattern)• Supporting terrestrial network required• Power• Traffic & space segment
Cost: Break Points
27
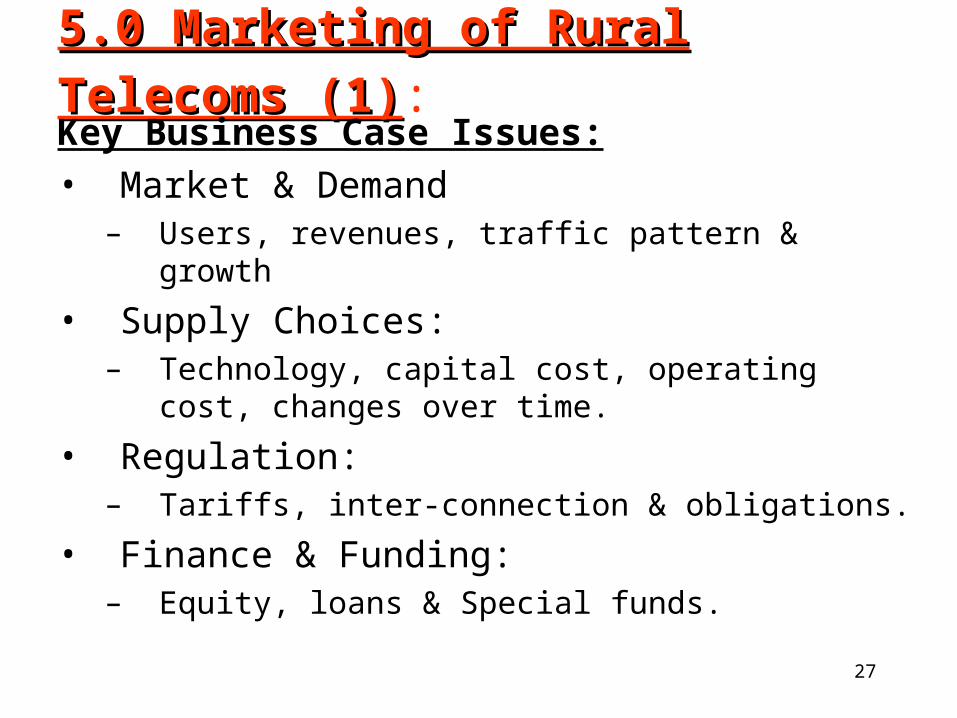
5.0 Marketing of Rural Telecoms (1)5.0 Marketing of Rural Telecoms (1): Key Business Case Issues:• Market & Demand
– Users, revenues, traffic pattern & growth
• Supply Choices:– Technology, capital cost, operating cost, changes over
time.
• Regulation:– Tariffs, inter-connection & obligations.
• Finance & Funding:– Equity, loans & Special funds.

28
5.0 Marketing of Rural Telecoms (2)5.0 Marketing of Rural Telecoms (2): Key Business Case Issues:• Market & Demand
– Users, revenues, traffic pattern & growth
• Supply Choices:– Technology, capital cost, operating cost, changes over
time.
• Regulation:– Tariffs, inter-connection & obligations.
• Finance & Funding:– Equity, loans & Special funds.
Source: www.inteleconResearch.com

29
5.0 Marketing of Rural Telecoms (3)5.0 Marketing of Rural Telecoms (3): Market Demand:• Composite affordability in rural areas• Local economies & communities spend 1-3 % of
their income on the telephone (African average 1.8-2.0 %).
• Institutions and business• Payphones and phone shops serving the populace• Private homes
• Access or market strategy? First few access lines in a village may attract large proportion of total potential demand.
• Rapidly declining revenues per line with penetration• Telephone affordability and cumulative average
revenue decrease with household penetration.
30
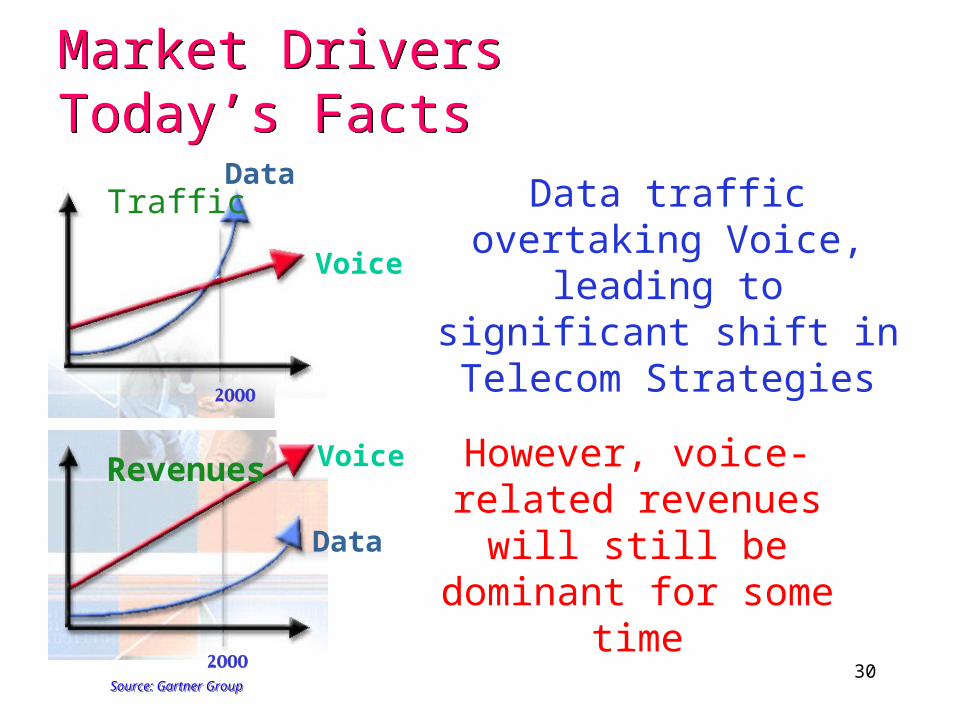
Voice
DataTraffic
2000
Data traffic overtaking Voice, leading to significant shift in
Telecom Strategies
Voice
Data
Revenues
2000
However, voice-related revenues will still be dominant for
some time
Source: Gartner GroupSource: Gartner Group
Market DriversToday’s FactsMarket DriversToday’s Facts
31
• Demand is for the POTS as well as for the data Demand is for the POTS as well as for the data communications, multimedia services and the Internet.communications, multimedia services and the Internet.
•Universal access to information services is not a luxury for Universal access to information services is not a luxury for
developing countries not regard as a priority (Digital Divide).developing countries not regard as a priority (Digital Divide). •Internet uses: Internet uses: •Business:Business: emerging global networked business infrastructure emerging global networked business infrastructure and knowledge-based economies, new business techniques and and knowledge-based economies, new business techniques and advanced information technologies.advanced information technologies.
•Education:Education: distance learning & training, > 100 million distance learning & training, > 100 million documents exist on line.documents exist on line.
•Healthcare:Healthcare:Telemedicine, consultation with expertsTelemedicine, consultation with experts
Demand structure

32
January 1999January 1999
WORLD TOTAL : 153.25 million 2.6 %)WORLD TOTAL : 153.25 million 2.6 %)
USA & Canada: 87 millionUSA & Canada: 87 million
Europe: 33.39 millionEurope: 33.39 million
Asia/ Pacific: 26.55 millionAsia/ Pacific: 26.55 million
South America: 4.5 millionSouth America: 4.5 million
Africa: 1.14 millionAfrica: 1.14 million
Of which South Africa between 850000 & 9000000Of which South Africa between 850000 & 9000000
““There is no parallel with the access to the Internet” There is no parallel with the access to the Internet”
Internet users on line

33
Elasticities important but :Elasticities important but :• Total affordability & cost is the starting point for rural.Total affordability & cost is the starting point for rural.• Affordability for total bill per line must meet operator’s Affordability for total bill per line must meet operator’s
commercial objectivescommercial objectives . .
• Elasticity changes with income, situation, tariff elementElasticity changes with income, situation, tariff element• Tariff elementsTariff elements::
• Call charges need to encourage usage by populace. Assume e.g. elasticity of Call charges need to encourage usage by populace. Assume e.g. elasticity of –0.5.–0.5.
• Installation fee should be set according to realistic roll-out targets and stage Installation fee should be set according to realistic roll-out targets and stage of development – can contribute to the “community valuation” & operators of development – can contribute to the “community valuation” & operators costscosts
• Rentals should be cost based & affordable to target customers- institutions & Rentals should be cost based & affordable to target customers- institutions & business firstbusiness first..
• ..
Tariffs/ Pricing

34
Revenue sharing :Revenue sharing :• % split between originating & terminating operator.% split between originating & terminating operator.• How much long for distance portionHow much long for distance portion . .
• Recognition of small/ rural operator’s high cost & riskRecognition of small/ rural operator’s high cost & risk
Access charge :Access charge :• Based on long run marginal costs per minute of use.Based on long run marginal costs per minute of use.• Universal access elementUniversal access element . .
Incoming outgoing :Incoming outgoing :• Can impact rural operator’s financial performance.Can impact rural operator’s financial performance.
Interconnection
35
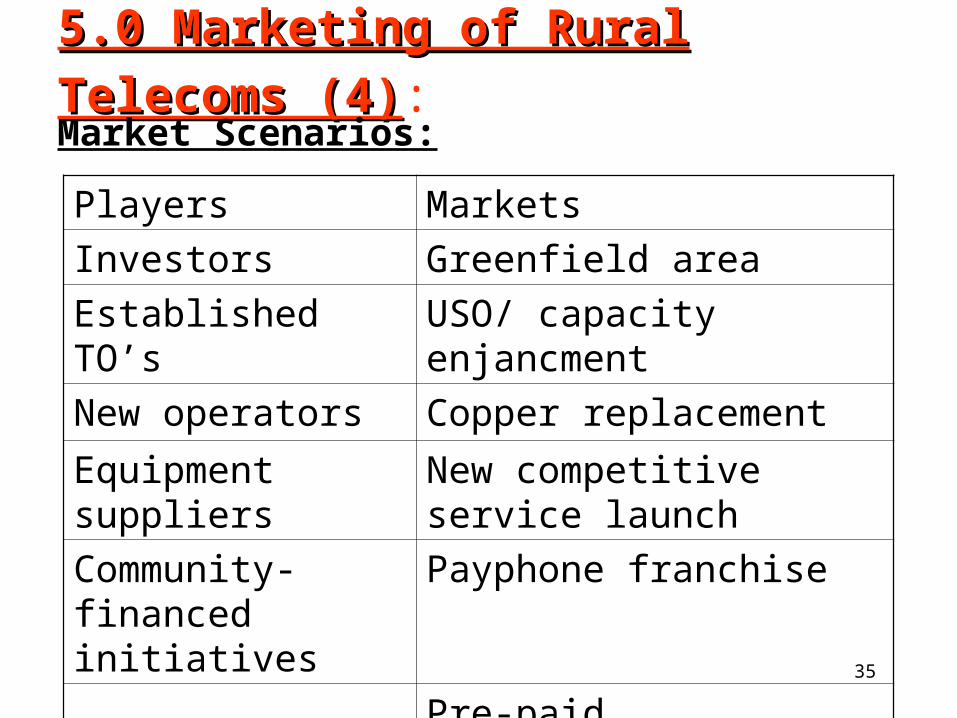
5.0 Marketing of Rural Telecoms (4)5.0 Marketing of Rural Telecoms (4): Market Scenarios:
Players Markets
Investors Greenfield area
Established TO’s USO/ capacity enjancment
New operators Copper replacement
Equipment suppliers New competitive service launch
Community-financed initiatives
Payphone franchise
Pre-paid
36
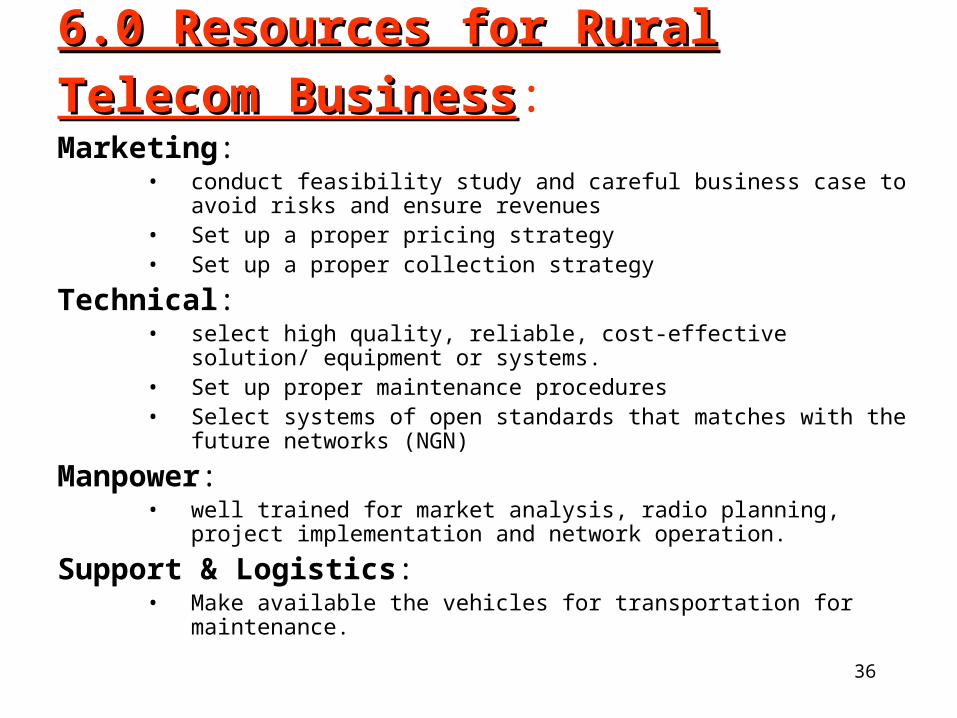
6.0 Resources for Rural Telecom Business6.0 Resources for Rural Telecom Business: Marketing:
• conduct feasibility study and careful business case to avoid risks and ensure revenues
• Set up a proper pricing strategy• Set up a proper collection strategy
Technical: • select high quality, reliable, cost-effective solution/ equipment or systems.• Set up proper maintenance procedures• Select systems of open standards that matches with the future networks
(NGN)
Manpower: • well trained for market analysis, radio planning, project implementation
and network operation.
Support & Logistics: • Make available the vehicles for transportation for maintenance.
37
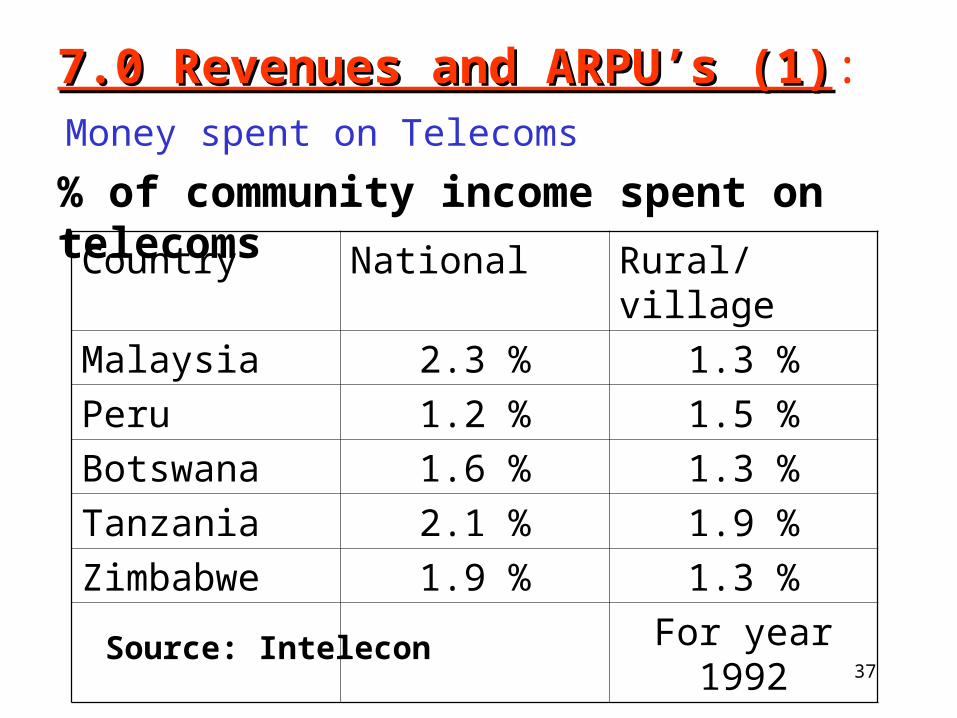
Money spent on Telecoms
Country National Rural/ village
Malaysia 2.3 % 1.3 %
Peru 1.2 % 1.5 %
Botswana 1.6 % 1.3 %
Tanzania 2.1 % 1.9 %
Zimbabwe 1.9 % 1.3 %
For year 1992
Source: Intelecon
% of community income spent on telecoms
7.0 Revenues and ARPU’s (1)7.0 Revenues and ARPU’s (1):

38
7.0 Revenues and ARPU’s (2)7.0 Revenues and ARPU’s (2):
Rural ARPU per month: 2135 SDD= $ 8.2
Overall ARPU per month: 4054 SDD= $ 16
In Greater Khartoum: Rural ARPU= 74 % to residential & 27 % to business area.
Rural ARPU= 72 % to residential & 27 % to the business (for Overall network).
Lessons from Sudatel:

39
RegionCurrent RPU
(SDD)
Total subscribers in the waiting list for
2005Remarks
Rural North Umdurman
1838 2000
Rural Southern
Umdurman
2826 5898
Rural Khartoum North
2006 15396
Rural Khartoum 1873 1642
ARPU 2135 24936 Total for 2005
Average Revenues Per User:
Source: Mass marketing dept & Business development dept.
One USD=260 Sudanese Dinars (SDD)

40
Region RPU (SDD) Subscribers Remarks
Northern (Dongola) 3616 22846
Karima 2915 14495
River Nile 3017 40012
Northern Gezira 2168 65693
Central Gezira 2203 84466
White Nile 2799 61976
Blue Nile 2455 34357
Damazin 3482 14740
Gedarif 3405 22636
Kassala 4716 33803
Red Sea 4845 40411
Northern Kordofan 4049 51903
Southern Kordofan 5100 16668
Northern Darfur 3321 23542
Southern Darfur 3713 40284
Southern Sudan 5500 12171
Residential 2970 675497
Business 8040 153000
Rural 2135 11500
ARPU for the Telecom Regions and Khartoum for telephony service
Rural ARPU= 72 % to residential & 27 % to the business (for Overall network).

41
8.0 Analysis of the Commercial viability(1)8.0 Analysis of the Commercial viability(1): Fundamental drivers of Viability:
Services Revenues
Population, economy & demand
Incentives Profit?
NPV, IRR, Time cycles{STEM outputs}
Obligations (may not all be uneconomic)
Operating costs Interconnect
Finance
Capital costs{deprec./ amort}
Taxes

42
8.0 Analysis of the Commercial viability(2)8.0 Analysis of the Commercial viability(2): Reasons for exceeding the viability zone:
Operator investment in the future•Kick start a promising market
•Dynamic area with economic growth potential
•Establish presence, reduce future costs
Low marginal cost for few extra lines and low risk•Fiscal reasons (good loss for a year or two)
Advertising and brand recognition
Policy/ regulatory “push”•Incentive/ subsidy received
•Fair compensation for incoming revenue through interconnect

43
9.0 Conclusion and Remarks9.0 Conclusion and Remarks: • In spite of the fact that the CAPEX & OPEX are high for the
telecoms business in the rural areas but the revenues are considerable (72 % of the residential & 27 % of the business areas of the whole network).
• In some cases the revenues generated by the rural network are higher that than the mother switch that is tying them
• Proper Marketing studies need to be carried out with full functionality
• Rural connectivity can be a true business opportunity as well as a high risk business.
• Commercial viability cab proofed if the right technology and the cost-effective solution is chosen.
• Access to the ICT is a human right supported by business

44
10.0 References10.0 References: 1. Rural telecoms’ 99 Cape Town, South Africa organized by
IRR group.
2. Pyramid research
3. Report of the independent commission for world wide telecommunications development “The Missing Link” Executive Summary
4. Analysis research center
5. Intelecon research center
6. Business development department, sudatel
7. Mass marketing department, Sudatel
8. Core planning division, Projects department, Sudatel

45
Thanks • Thanks are due to the ITU and Center of Excellence
who invited me to contribute to this workshop (Visibility of Rural Connectivity) .
• Thanks to Sudatel for giving the honor to lead the (Workshop Preparatory Steering Committee).
• Thanks to Dr. Abuqayyas for recommending me to the ITU/ BDT to do this work.
• Thanks to our distinguished delegates and guests from esteemed companies and sister countries.
The END