1 convective systems in the 2006 west african monsoon: a radar study nick guy ms research sjsu phd...
Post on 22-Dec-2015
214 views
TRANSCRIPT
1
Convective Systems in the 2006 West African Monsoon:
A Radar Study
Nick Guy
MS Research SJSU
PhD Research CSU
17 February 2009

2
• African Monsoon Multidisciplinary Analyses
• Cooperative international project
• Science Objectives:– Improve understanding of
WAM
– Create strategy for monitoring and prediction of WAM
– Relate underlying science to socioeconomic issues
• NASA AMMA• Collaboration with AMMA• Primary Scientific Interests
– Relationship between AEWs and tropical cyclogenesis in the Atlantic basin
– role of the Saharan Air Layer (SAL) in modulating the intensity of the waves and tropical cyclone growth
3
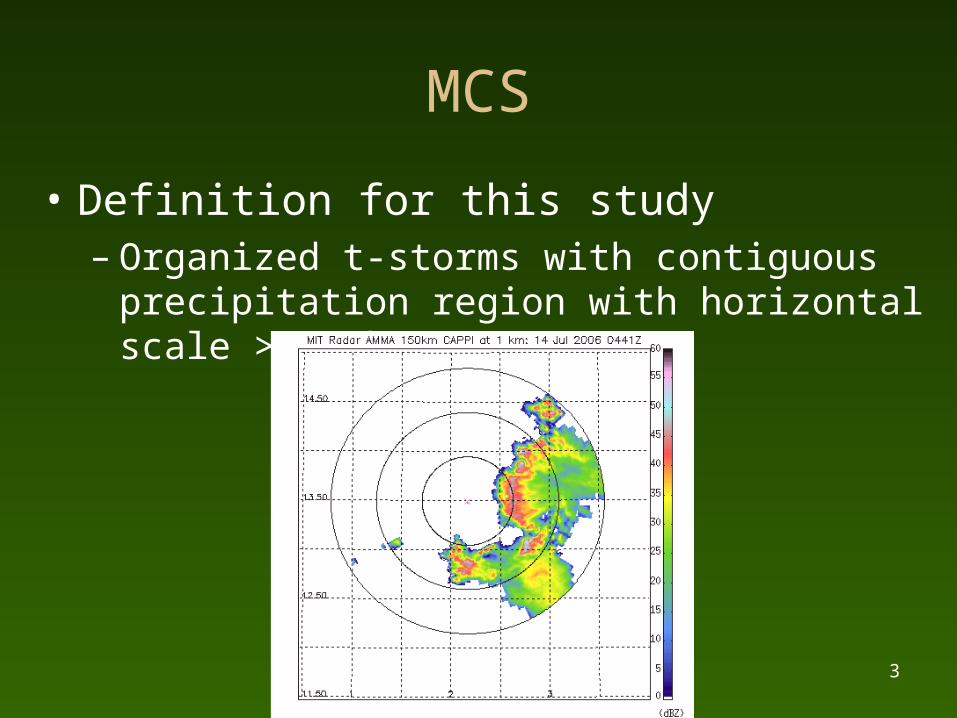
MCS
• Definition for this study– Organized t-storms with contiguous precipitation
region with horizontal scale >100 km
4
SLMCS
• Linear organization and propagation
• Large impact of thermodynamic and dynamic structure of environment
• High prevalence of this type throughout season for MIT and NPOL radar sites
• Large contributor of precipitation totals in some areas
• Large trailing stratiform region

5
African Precipitation
• Northward progression of rainfall
• Banded structure
ObservationalData GCM GCM

6
West African Monsoon• Seasonally dependent thermally-induced
low over African continent
• Migration northward during boreal summer
Ferreira (2007)
10 N 20 N 30 NEQ
600
200
Pre
ssur
e (m
b)
Latitude
ITC
Z (
Mo
ns
oo
n R
ain
)
Sahara Warm DryAir
African Easterly Jet
Cool Gulf of Guinea SSTs

7
WAM Characteristics I
• Two distinct phases (Sultan and Janicot 2003b)– Preonset – migration of southwesterly winds
and ITF past 15˚N– Onset - abrupt northward shift of the ITCZ
from 5˚N to 10˚N
• Time-frame: April – October precipitation– Results in 99% of annual rainfall (Shinoda et
al. 1999)– mid-June – September generally defines
WAM period
8
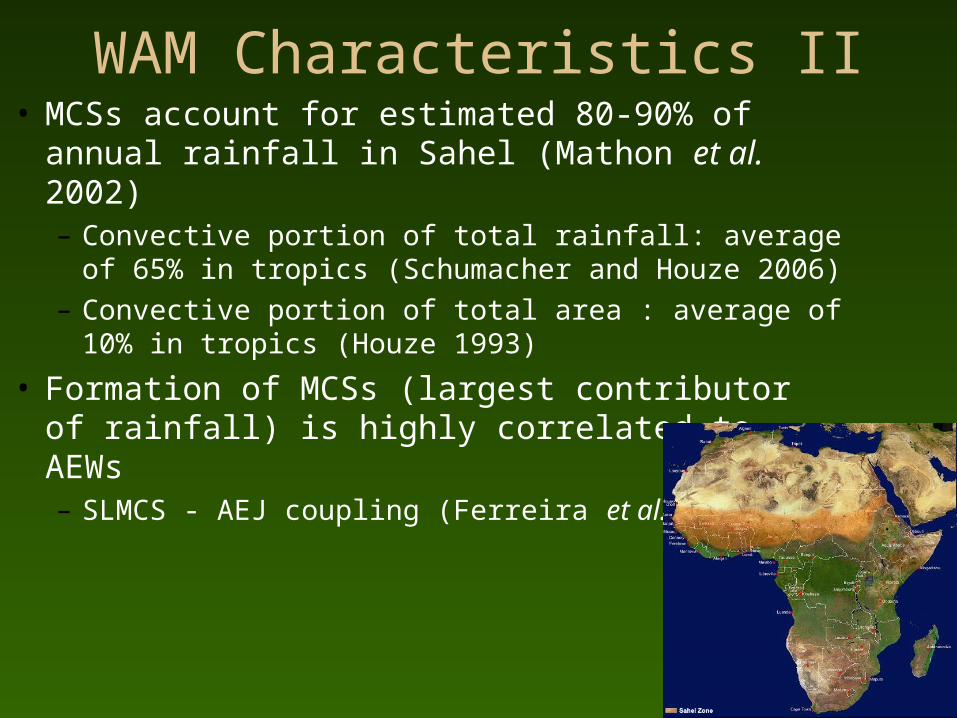
WAM Characteristics II• MCSs account for estimated 80-90% of annual
rainfall in Sahel (Mathon et al. 2002)– Convective portion of total rainfall: average of 65% in
tropics (Schumacher and Houze 2006)
– Convective portion of total area : average of 10% in tropics (Houze 1993)
• Formation of MCSs (largest contributor of rainfall) is highly correlated to AEWs– SLMCS - AEJ coupling (Ferreira et al. 2009)

9
Section 2
Radar Data Analysis

10
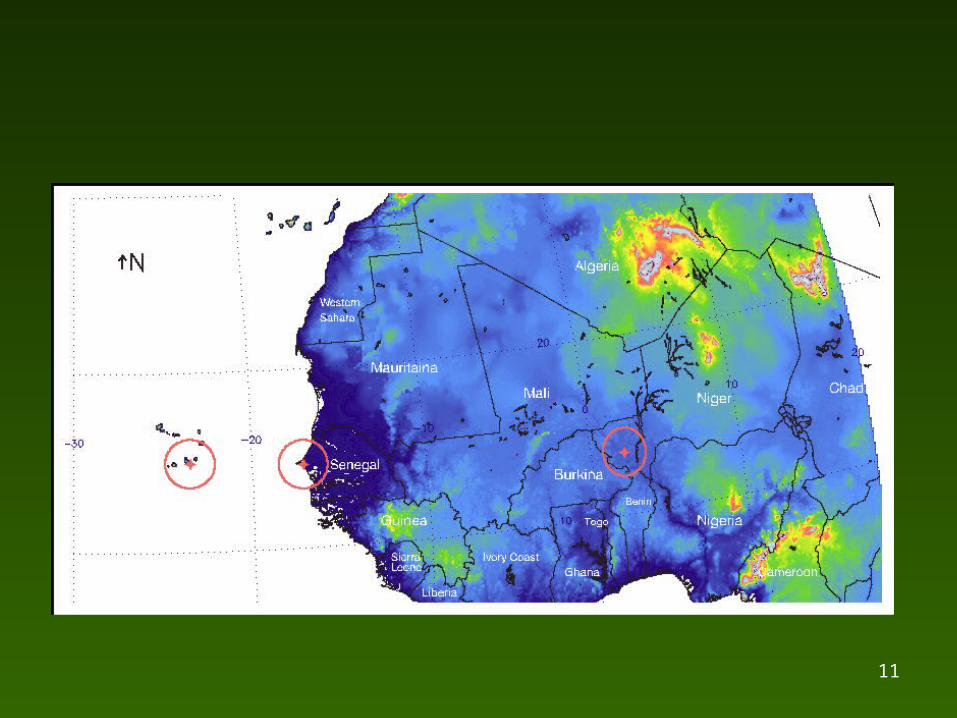
Radar Locations• MIT – Niamey, Niger (13.49ºN, 2.17ºE)
• C-band Doppler radar• Operated 5 July – 27 September 2006• ~11250 scans for analysis• 37 MCS-scale events observed
• TOGA – Praia, São Tiago (14.92ºN, 23.48ºW)• C-band Doppler radar• Operated 15 August – 16 September 2006• ~4300 scans for analysis• 6 MCS-scale events observed
• NPOL – Dakar, Senegal (14.66ºN, 17.10ºW)• S-band, dual polarized Doppler radar• Operated 19 August – September 30 2006 • ~3500 scans for analysis• 12 MCS-scale events observed
11
12
13
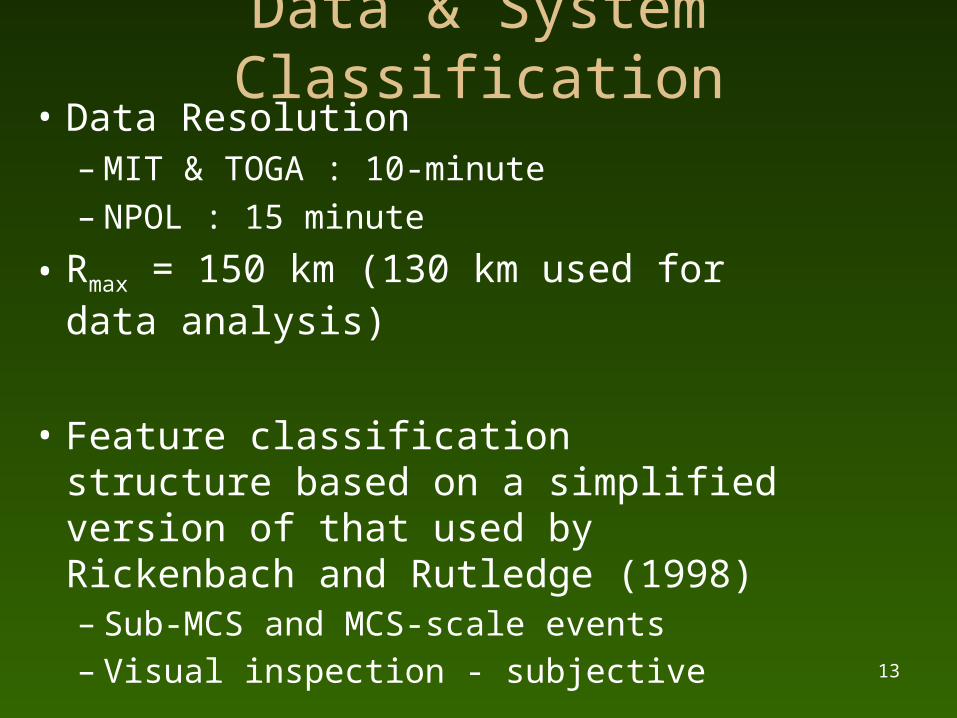
Data & System Classification• Data Resolution
– MIT & TOGA : 10-minute– NPOL : 15 minute
• Rmax = 150 km (130 km used for data analysis)
• Feature classification structure based on a simplified version of that used by Rickenbach and Rutledge (1998)– Sub-MCS and MCS-scale events– Visual inspection - subjective

14
MIT Radar Data Quality Control• GVS software package employed for QC
– Removal of non-meteorological data
– Maximize meteorological echo retained– Algorithm based on a modified approach developed by
Rosenfeld et al. (1995)
• Generally favorable results from the QC operation
• Attenuation correction for MIT site (Russell and Williams 2009) [GATE correction used for data set]
• Comparison to TRMM PR showed good agreement – bias adjusted in radar data
15
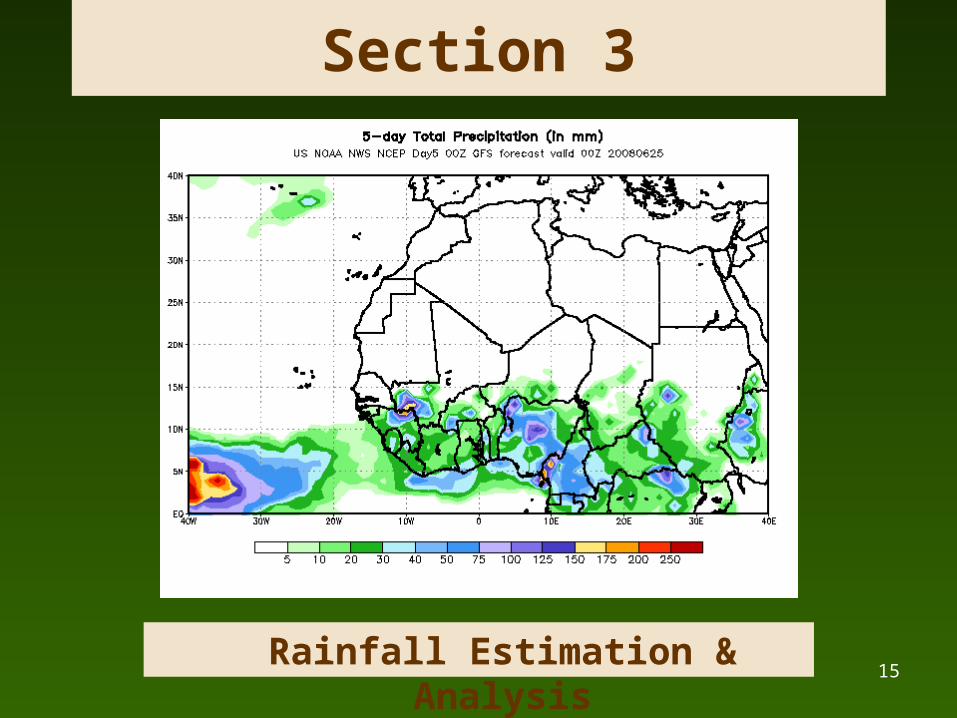
Section 3
Rainfall Estimation & Analysis
16
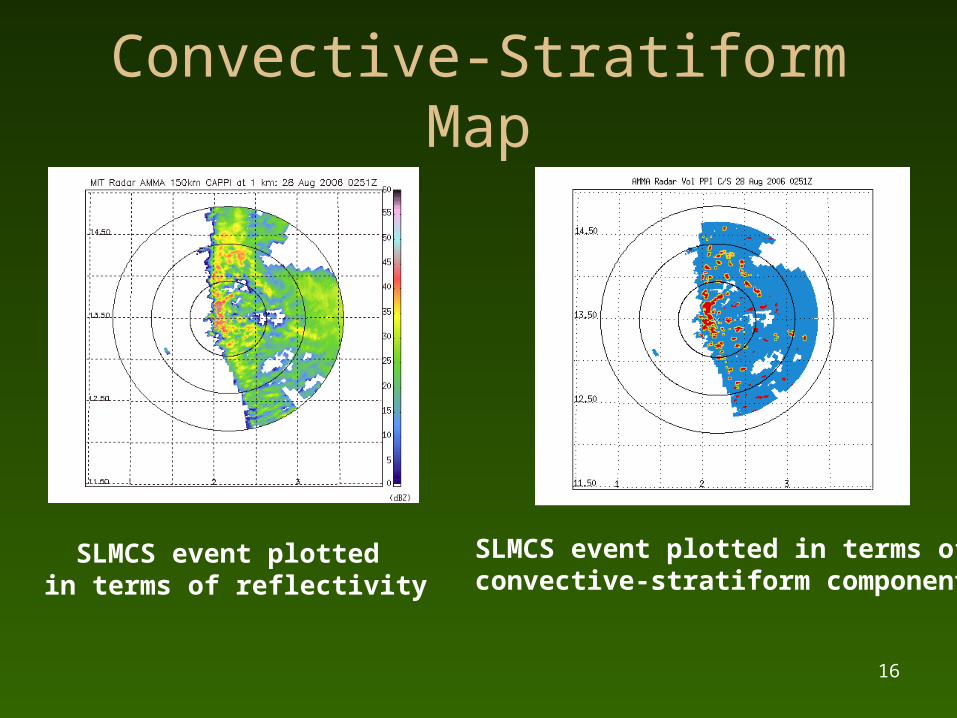
Convective-Stratiform Map
SLMCS event plotted in terms of convective-stratiform components
SLMCS event plotted in terms of reflectivity
17
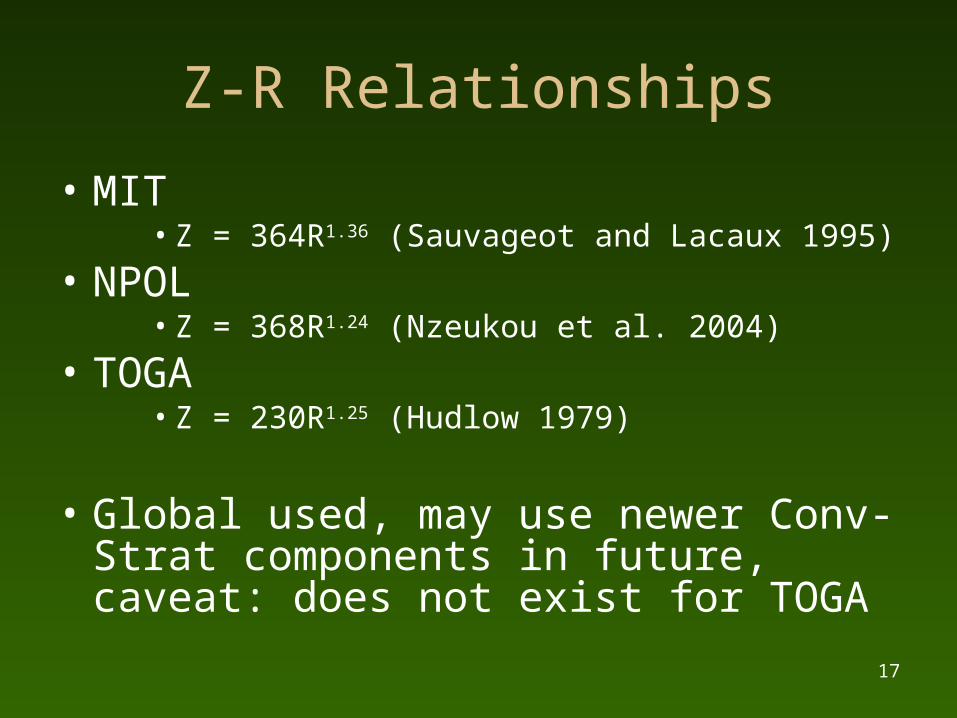
Z-R Relationships
• MIT• Z = 364R1.36 (Sauvageot and Lacaux 1995)
• NPOL• Z = 368R1.24 (Nzeukou et al. 2004)
• TOGA• Z = 230R1.25 (Hudlow 1979)
• Global used, may use newer Conv-Strat components in future, caveat: does not exist for TOGA

18
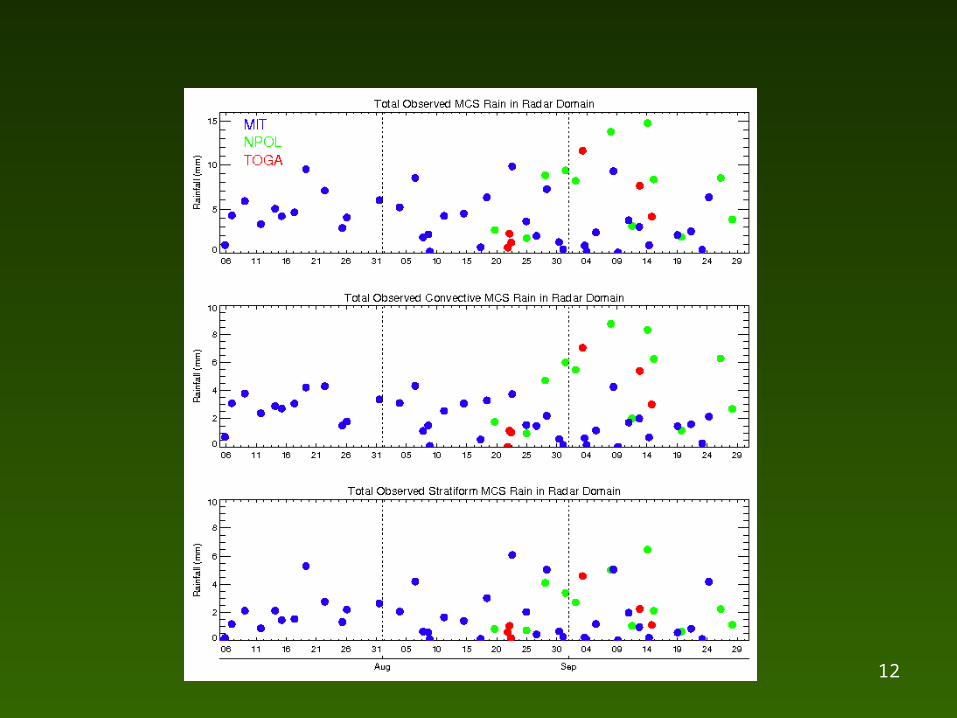
Rainrate Timeseries

19
MCS Contributions to Seasonal Totals
Rain Fraction Area Fraction
TOGA
MCS 0.670 0.394
Sub-MCS 0.279 0.428
NPOL
MCS 0.670 0.576
Sub-MCS 0.223 0.305
MIT MCS 0.919 0.872
Sub-MCS 0.071 0.106
20
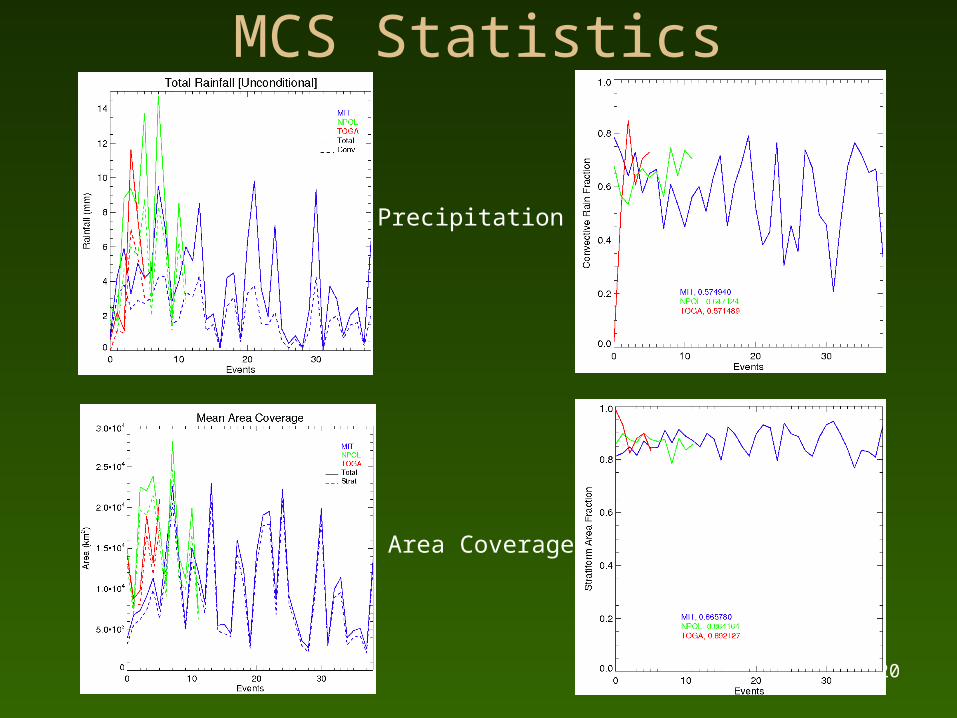
MCS Statistics
Precipitation
Area Coverage

21
Sub-MCS Statistics
Precipitation
Area Coverage

22
Diurnal Composites
MCS-scale systems Sub- MCS-scale systems
Note the difference in vertical scales MCS component dominates total
23
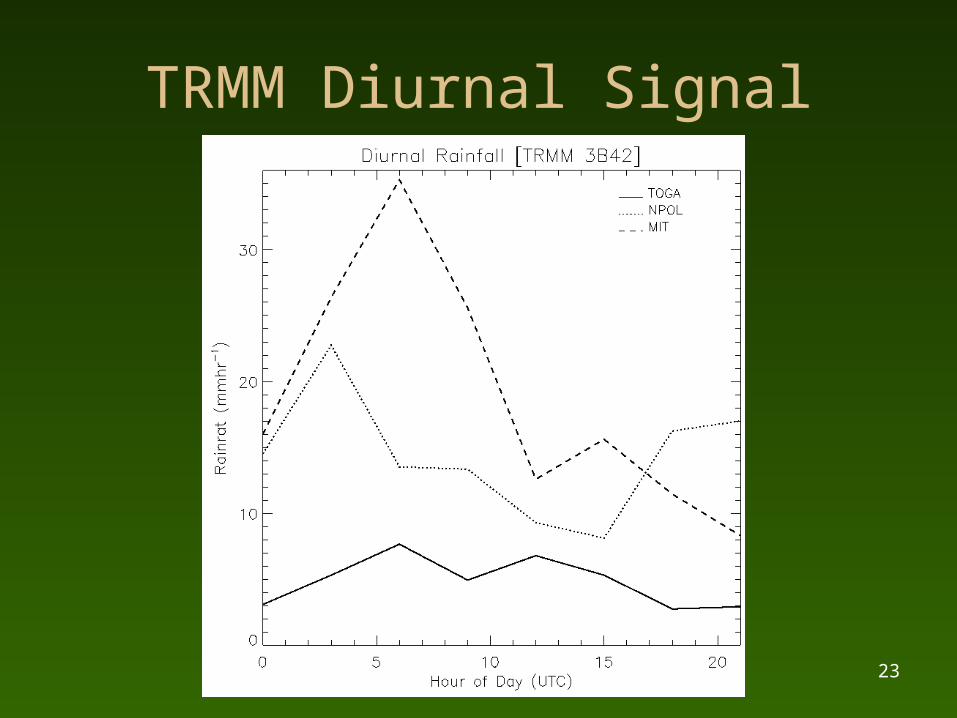
TRMM Diurnal Signal

24
Vertical Structure
25
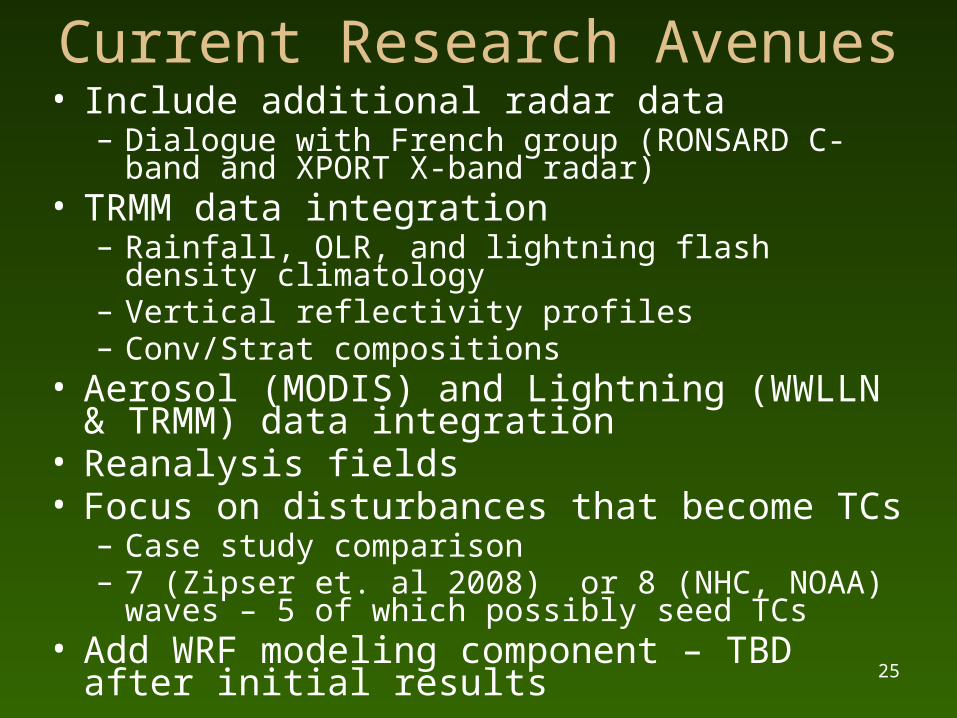
Current Research Avenues• Include additional radar data
– Dialogue with French group (RONSARD C-band and XPORT X-band radar)
• TRMM data integration– Rainfall, OLR, and lightning flash density climatology– Vertical reflectivity profiles– Conv/Strat compositions
• Aerosol (MODIS) and Lightning (WWLLN & TRMM) data integration
• Reanalysis fields• Focus on disturbances that become TCs
– Case study comparison– 7 (Zipser et. al 2008) or 8 (NHC, NOAA) waves – 5 of
which possibly seed TCs• Add WRF modeling component – TBD after initial
results
26
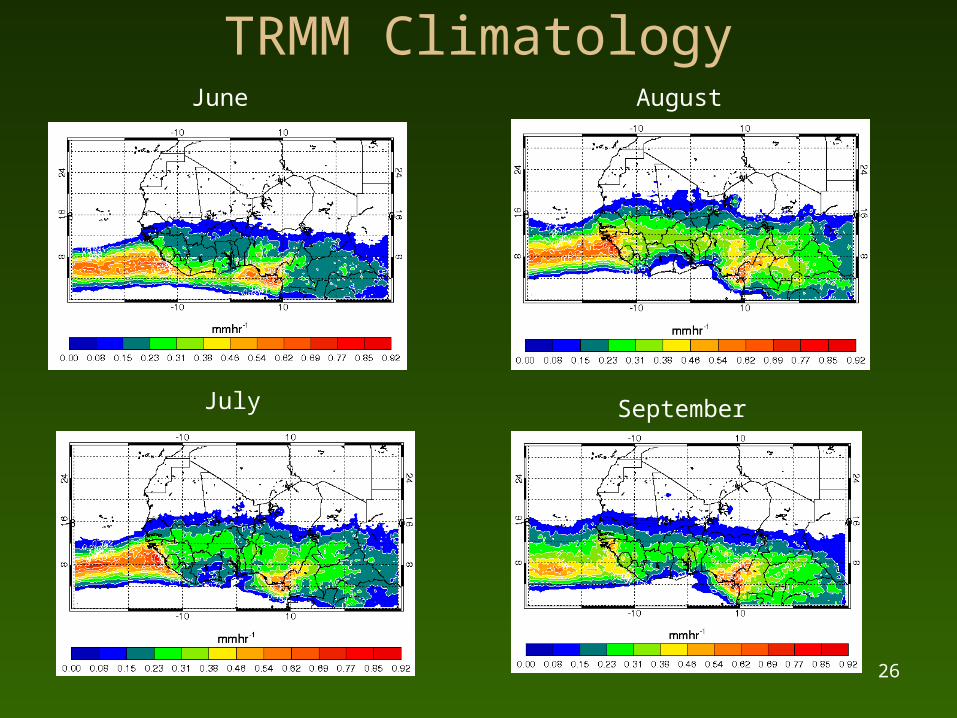
TRMM ClimatologyJune
July
August
September

27
2006 WAM vs. Climatology
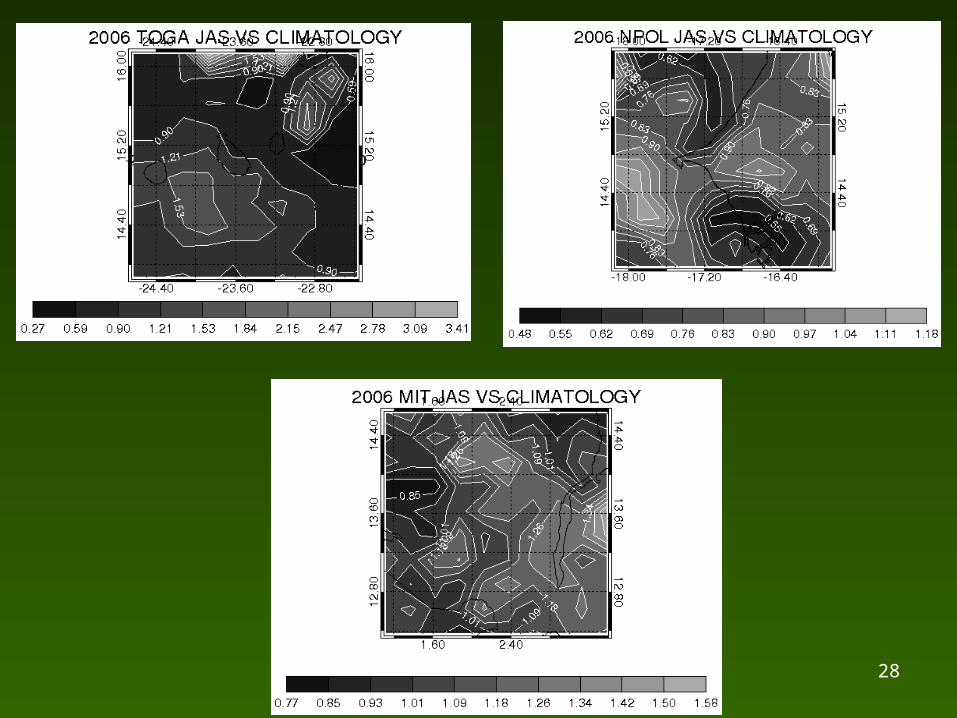
28

29
WWLLN Lightning Distribution
TOGA NPOL
MIT

30
Wave 5 Case Study
31
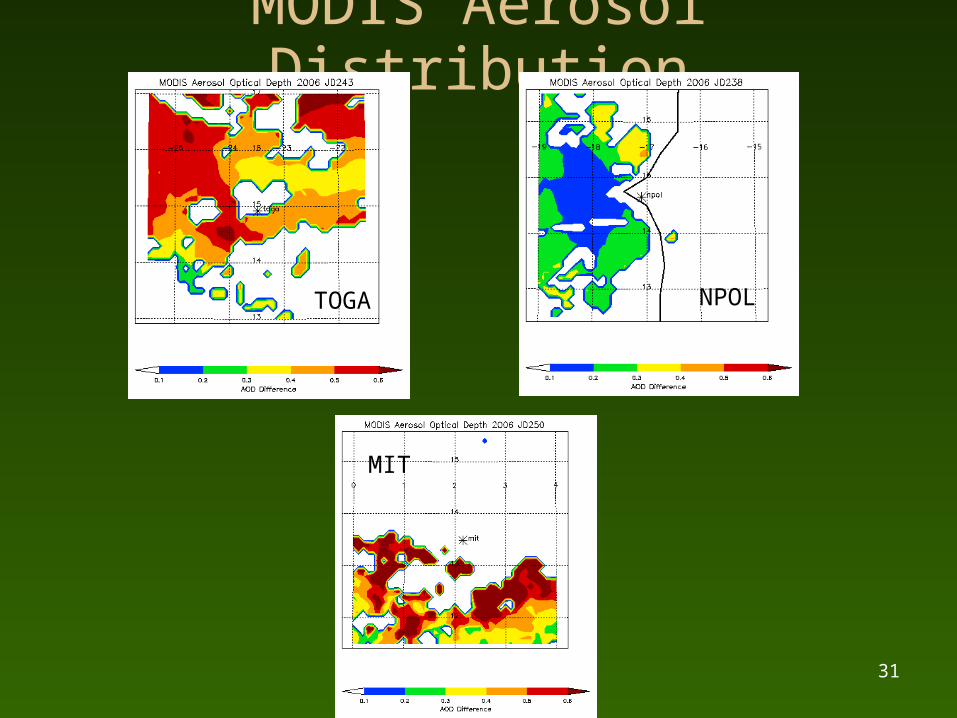
MODIS Aerosol Distribution
TOGA
MIT
NPOL

32
Acknowledgements
• Drs. Steve Rutledge, Rob Cifelli, Tom Rickenbach, Tim Lang
• Bart Kelley, Jason Pippitt, Dave Wolfe at GSFC
• Paul Kucera, Earle Williams, and Brian Russell
• CEAS Fellowship for making this possible