1 cs 525 advanced distributed systems spring 2013 indranil gupta (indy) measurement studies march...
TRANSCRIPT

1
CS 525 Advanced Distributed
SystemsSpring 2013
Indranil Gupta (Indy)
Measurement Studies
March 26, 2013
All Slides © IG Acknowledgments: Some slides by Long Vu, Jay Patel

We’ve seen a variety of distributed systems so far…
• P2P file sharing systems (Kazaa, Gnutella, etc.)• Clouds (AWS, Hadoop, etc.)• P2P streaming systems (PPLive etc.)
• Often, the behavior and characteristics of these systems, when deployed in the wild, are surprising.
• Important to know these in order to build better distributed systems for deployment
2

3
How do you find characteristics of these Systems in Real-life Settings?
• Write a crawler to crawl a real working system• Collect traces from the crawler• Tabulate the results
• Papers contain plenty of information on how data was collected, the caveats, ifs and buts of the interpretation, etc.– These are important, but we will ignore them for this lecture
and concentrate on the raw data and conclusions

4
Measurement, Modeling, and Analysis of a Peer-to-Peer File-Sharing
Workload
Gummadi et al
Department of Computer Science
University of Washington

5
What They Did
• 2003 paper analyzed 200-day trace of Kazaa traffic
• Considered only traffic going from U. Washington to the outside
• Developed a model of multimedia workloads

6
Results Summary
1. Users are patient
2. Users slow down as they age
3. Kazaa is not one workload
4. Kazaa clients fetch objects at-most-once
5. Popularity of objects is often short-lived
6. Kazaa is not Zipf

7
User characteristics (1)
• Users are patient

8
User characteristics (2)• Users slow down as they age
– clients “die”– older clients ask for less each time they use
system

9
User characteristics (3)• Client activity
– Tracing used could only detect users when their clients transfer data
– Thus, they only report statistics on client activity, which is a lower bound on availability
– Avg session lengths are typically small (median: 2.4 mins)
• Many transactions fail
• Periods of inactivity may occur during a request if client cannot find an available peer with the object

10
Object characteristics (1)
• Kazaa is not one workload
•This does notaccount forconnection overhead

11
Object characteristics (2)
• Kazaa object dynamics– Kazaa clients fetch objects at most once– Popularity of objects is often short-lived– Most popular objects tend to be recently-born
objects– Most requests are for old objects (> 1 month)
• 72% old – 28% new for large objects
• 52% old – 48% new for small objects

12
Object characteristics (3)• Kazaa is not Zipf• Zipf’s law: popularity of ith-most popular object is
proportional to i-α, (α: Zipf coefficient)• Web access patterns are Zipf• Authors conclude that Kazaa is not Zipf because of
the at-most-once fetch characteristics
Caveat: what is an “object”in Kazaa?

13
Model of P2P file-sharing workloads
[?] Why a model?• On average, a client requests 2 objects/day• P(x): probability that a user requests an object of
popularity rank x Zipf(1)– Adjusted so that objects are requested at most once
• A(x): probability that a newly arrived object is inserted at popularity rank x Zipf(1)
• All objects are assumed to have same size• Use caching to observe performance changes
(effectiveness hit rate)

14
Model – Simulation results• File-sharing effectiveness
diminishes with client age– System evolves towards one
with no locality and objects chosen at random from large space
• New object arrivals improve performance– Arrivals replenish supply of
popular objects• New clients cannot stabilize
performance– Cannot compensate for
increasing number of old clients– Overall bandwidth increases in
proportion to population size
• By tweaking the arrival rate of of new objects, were able to match trace results (with 5475 new arrivals per year)

15
Some Questions for You• “Unique object” : When do we say two objects A and B are “different”?
– When they have different file names• fogonthetyne.mp3 and fogtyne.mp3
– When they have exactly same content• 2 mp3 copies of same song, one at 64 kbps and the other at 128 kbps
– When A (and not B) is returned by a keyword search, and vice versa– …?
• Based on this, does “caching” have a limit? Should caching look into file content? Is there a limit to such intelligent caching then?
• Should there be separate overlays for small objects and large objects? For new objects and old objects?
• Or should there be separate caching strategies?• Most requests for old objects, while most popular objects are new ones –
is there a contradiction?

16
Understanding Availability
R. Bhagwan, S. Savage, G. Voelker
University of California, San Diego

17
What They Did
• Measurement study of peer-to-peer (P2P) file sharing application– Overnet (January 2003)– Based on Kademlia, a DHT based on xor routing metric
• Each node uses a random self-generated ID• The ID remains constant (unlike IP address)• Used to collect availability traces
– Closed-source
• Analyze collected data to analyze availability• Availability = % of time a node is online
(node=user, or machine)

18
• Crawler: – Takes a snapshot of all the active hosts by repeatedly requesting
50 randomly generated IDs.– The requests lead to discovery of some hosts (through routing
requests), which are sent the same 50 IDs, and the process is repeated.
– Run once every 4 hours to minimize impact• Prober:
– Probe the list of available IDs to check for availability• By sending a request to ID I; request succeeds only if I replies• Does not use TCP; potentially avoids problems with NAT and DHCP
– Used on only randomly selected 2400 hosts from the initial list– Run every 20 minutes
• All Crawler and Prober trace data from this study is available for your project (ask Indy if you want access)
What They Did

19
Scale of Data
• Ran for 15 days from January 14 to January 28 (with problems on January 21) 2003
• Each pass of crawler yielded 40,000 hosts.
• In a single day (6 crawls) yielded between 70,000 and 90,000 unique hosts.
• 1468 of the 2400 randomly selected hosts probes responded at least once

20
Results Summary
1. Overall availability is low, but need to take IP aliasing into account for measurement studies
2. Diurnal patterns existing in availability
3. Availabilities are uncorrelated across nodes
4. High Churn exists

21
Multiple IP Hosts

22
Availability

23
Host Availability
As time intervalincreased, av. decreases

24
Diurnal Patterns
•6.4 joins/host/day•32 hosts/day lost
•N changes by only 100/day
•Normalized to “local time” at peer,not EST

25
Are Node Failures Interdependent?30% with 0 difference, 80% within
+-0.2
Should be sameif X and Y independent

26
Arrival and Departure
•20% of nodes each dayare new•Number of nodesstays about 85,000

27
Conclusions and Discussion • Each host uses an average 4 different IP addresses
within just 15 days– Keeping track of assumptions is important for trace
collection studies
• Strong diurnal patterns– Design p2p systems that are adaptive to time-of-day?
• Value of N stable in spite of churn– Can leverage this in building estimation protocols, etc.,
for p2p systems.

28
Measurement and Modeling of a Large-scale Overlay for Multimedia Streaming
Long Vu, Indranil Gupta, Jin Liang, Klara Nahrstedt
UIUC
This was a CS525 Project (Spring 2006). Published in QShine 2007 conference, and ACM TOMCCAP.

29
Motivation• IPTV applications have flourished (SopCast, PPLive, PeerCast,
CoolStreaming, TVUPlayer, etc.)
• IPTV growth: (MRG Inc. April 2007)
– Subscriptions: 14.3 million in 2007, 63.6 million in 2011.
– Revenue: $3.6 billion in 2007, $20.3 billion in 2011
• Largest IPTV in the world today are P2P streaming systems
• A few years ago, this system was PPLive: 500K users at peak,
multiple channels and per-channel overlay, nodes may be recruited as
relays for other channels. (Data from 2006)
• Do peer to peer IPTV systems have the same overlay
characteristics as peer to peer file-sharing systems?

30
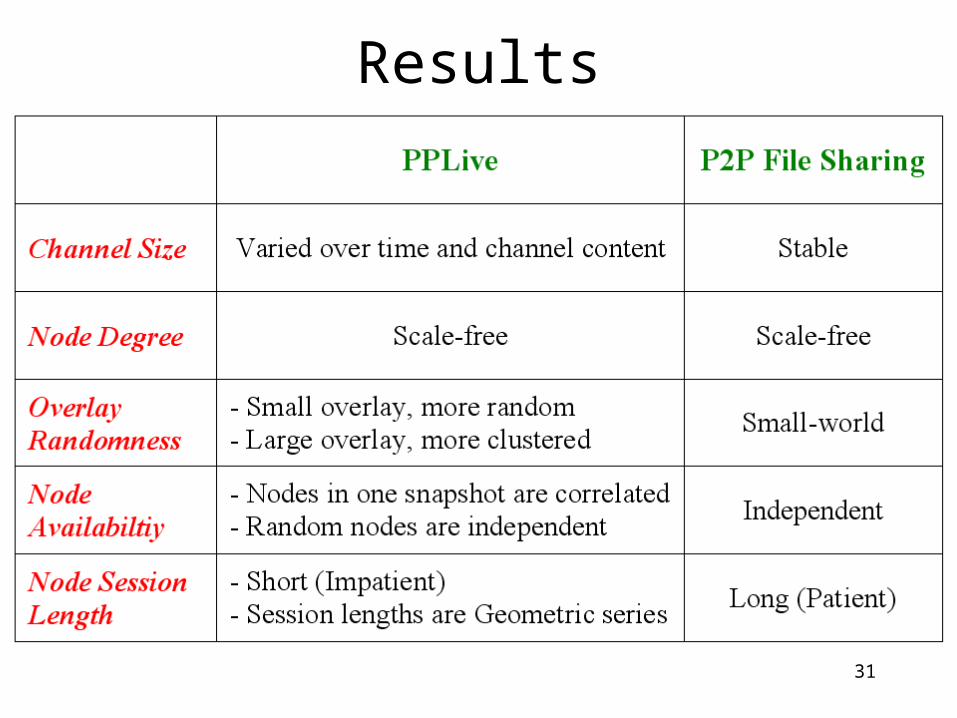
Summary of Results
P2P Streaming overlays are different from File-sharing P2P overlays in a few ways:
1. Users are impatient: Session times are small, and exponentially distributed (think of TV channel flipping!)
2. Smaller overlays are random (and not power-law or clustered)
3. Availability is highly correlated across nodes within same channel
4. Channel population varies by 9x over a day.
31
Results

32
PPLive Channels
A Program Segment (PS)
An episode channel
Movie 1 Movie 2 Movie 3 Movie 4
PS PS PS PS PS
Day 2Day 1
Time

33
PPLive Membership Protocol
Client
An overlay
ChallengesPPLive is a closed source system:Makes measurement challenging – have to select metrics carefully!

34
Channel Size Varies over a day
• Use 10 PlanetLab geographically distributed nodes to crawl peers
• Popular channel varies 9x, less popular channel varies 2x

35
Channel Size Varies over Days
The same channel, same program: Peaks drift
First day Second day

36
OperationsSnapshot collects peers in one channel
PartnerDiscovery collects partners of responsive peers
Studied
channels
Time1st Snapshot 2nd Snapshot 3rd Snapshot 4th Snapshot
10 min 10 min 10 min 10 min

37
K-degree• Problem: When PPLive node is
queried for membership list, it sends back a fixed size list. – Subsequent queries return
slightly different lists
• One option: figure out why– Lists changing?– Answers random?– …
• Our option: define – K-degree = Union of answers
received when K consecutive membership queries are sent to the PPLive node
• K=5-10 gives half of entries as K=20

38
Node Degree is Independent of Channel Size
Similar to P2P file sharing [Ripeanu 02]
Average node
degree scale-free

39
Overlay Randomness
• Clustering Coefficient (CC) [Watts 98]– for a random node x with two neighbors y and z, the CC
is the probability that either y is a neighbor of z or vice versa
• Probability that two random nodes are neighbors (D)– Average degree of node / channel size
• Graph is more clustered if CC is far from D [well-known results theory of networks and graphs]

40
Smaller Overlay, More Random
• Small overlay, more random
• Large overlay, more clustered
P2P file sharing overlays are clustered. [Ripeanu 02, Saroiu 03]

41
Nodes in one Snapshot Have Correlated Availability
In P2P file sharing, nodes are uncorrelated [Bhagwan 03]
Correlated Availability
Nodes appearing together is likely appear together again

42
Random Node Pairs (across snapshots) Have Independent Availabilities
Similar to P2P file sharing [Bhagwan 03]
IndependentAvailabilities

43
PPLive Peers are Impatient
90% sessions are less than 70 minutes
In P2P file sharing, peers are patient [Saroiu 03]

44
Feasible Directions/Discussion
• Nodes are homogeneous due to their memoryless session lengths. Does a protocol that treats all nodes equally is simple and work more effectively?
• As PPLive overlay characteristics depend on application behavior, a deeper study of user behavior may give better design principle
• Designing “generic” P2P substrates for a wide variety of applications is challenging
• Node availability correlations can be used to create sub-overlays of correlated nodes or to route media streams?
• Simulation of multimedia streaming needs to take this correlated availability into account?
• Geometrically distributed session lengths can be used to better simulate node arrival/departure behavior

45
An Evaluation of Amazon’s Grid Computing Services: EC2, S3,
and SQS
Simson L. Garfinkel
SEAS, Harvard University

46
What they Did
• Did bandwidth measurements– From various sites to S3 (Simple Storage
Service)– Between S3, EC2 (Elastic Compute Cloud) and
SQS (Simple Queuing Service)

47
Results Summary
1. Effective Bandwidth varies heavily based on geography!
2. Throughput is relatively stable, except when internal network was reconfigured.
3. Read and Write throughputs: larger is better– Decreases overhead
4. Consecutive requests receive performance that are highly correlated.
5. QoS received by requests fall into multiple “classes”

48Effective Bandwidth varies heavily based on geography!

49
100 MB Get Ops from EC2 to S3
Throughout is relatively stable, except when internalnetwork was reconfigured.

50Read and Write throughputs: larger is better (but beyond some block size, it makes little difference).

51
Concurrency: Consecutive requests receive performance that are highly correlated.

52
QoS received by requests fall into multiple “classes”- 100 MB xfers fall into 2 classes.

53
Feasible Directions
1. Effective Bandwidth varies heavily based on geography!• Wide-area network transfer algorithms!
2. Throughout is relatively stable, except when internal network was reconfigured.
• Guess the structure of an internal datacenter (like AWS)? Datacenter tomography
3. Read and Write throughputs: larger is better– Make these better?
4. Consecutive requests receive performance that are highly correlated.
• Really concurrent? Improve?
5. QoS received by requests fall into multiple “classes”• Make QoS explicitly visible? Adapt SLAs?SLOs?

What Do Real-Life Hadoop Workloads Look Like?
(Cloudera)
(Slide Acknowledgments: Brian Cho)54

What They Did
• Hadoop workloads from 5 Cloudera customers– Diverse industries: “in e-commerce,
telecommunications, media, and retail”– 2011
• Hadoop workloads from Facebook– 2009, 2010 across same cluster
55

The Workloads
TB/Day
Jobs/Day
GB/Job
3 190 14
67 2550 26
600 700 856
133 220 602
66 1200 55
52 6270 8
33333 25980 1283
56
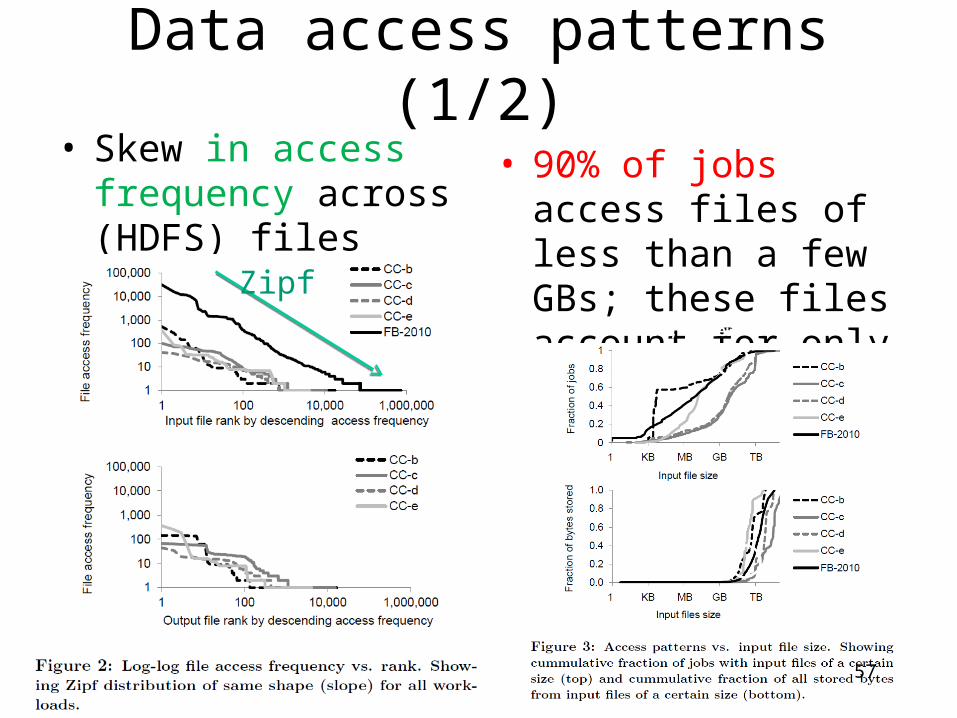
• Skew in access frequency across (HDFS) files
• 90% of jobs access files of less than a few GBs; these files account for only 16% of bytes stored
90%, < few GBs
16%
Data access patterns (1/2)
57
Zipf
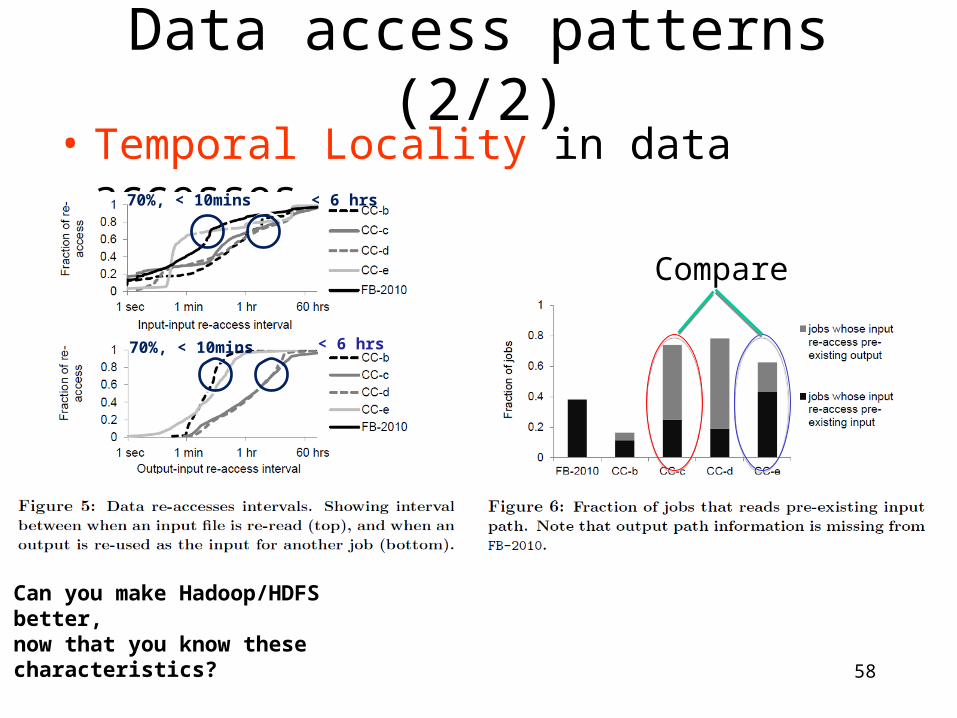
Data access patterns (2/2)• Temporal Locality in data accesses
70%, < 10mins
70%, < 10mins
= Sequences of Hadoop jobs?
Can you make Hadoop/HDFS better, now that you know these characteristics?
58
< 6 hrs
< 6 hrs
Compare

Burstiness• Plotted
– Sum of task-time (map + reduce) over an hour interval
– n-th percentile / median
• Facebook– From 2009 to 2010, peak-to-
median ratio dropped from 31:1 to 9:1
– Claim: consolidating resources decreases effect of burstiness
59

High-level Processing Frameworks
60
Each clusterprefers 1-2 data processing frameworks

Classification by multi-dimensional clustering
61
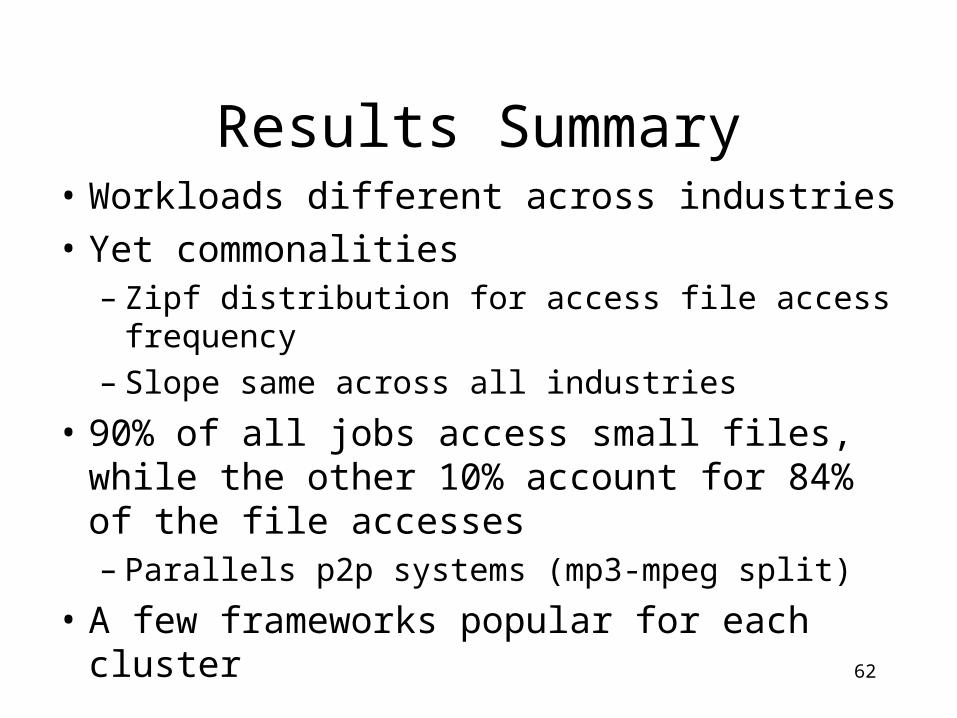
Results Summary• Workloads different across industries
• Yet commonalities– Zipf distribution for access file access frequency– Slope same across all industries
• 90% of all jobs access small files, while the other 10% account for 84% of the file accesses– Parallels p2p systems (mp3-mpeg split)
• A few frameworks popular for each cluster
62

63
Backup slides

64
Recommendations for P2P IPTV designers
• Node availability correlations can be used to create sub-overlays of correlated nodes or to route media streams
• Simulation of multimedia streaming needs to take this bimodal availability into account
• Geometrically distributed session lengths can be used to simulate node arrival/departure behavior
• Nodes are homogeneous due to their memoryless session lengths. A protocol treats all nodes equally is simple and works effectively
• As PPLive overlay characteristics depend on application behavior, a deeper study of user behavior may give better design principle
• Designing “generic” P2P substrates for a wide variety of applications is challenging