1 csse 477 – intro to performance steve chenoweth friday, 9/2/11 week 0, day 2 right – a close...
Post on 21-Dec-2015
213 views
TRANSCRIPT

1
CSSE 477 – Intro to
Performance Steve Chenoweth
Friday, 9/2/11
Week 0, Day 2
Right – A close analogy to performance as we mean it – Danica Patrick in an Andretti Honda at the Indy 500, 2007. From http://www.zimbio.com/pictures/jMc7rq1aK8x/91st+Indianapolis+500/0nC_oFFbsHj/Danica+Patrick.

2
Today
• Finalize who’s on what team / project• How to do Project 1…• Which is all about software performance
engineering…– Bass’s Ch 4 (pp 82-85) and Ch 4 (pp 111-
116)– For a whole lot more, see Performance
Solutions: A Practical Guide to Creating Responsive, Scalable Software, by Connie Smith and Lloyd Williams

3
Yesterday, we picked performance from Bass’s QA list…
• Bass’s list of six, from the inside back cover of his book:– Availability– Modifiability– Performance– Security– Testability– Usability

4
And you got a first project about it:
• On the project you selected to work on,
• Improve the performance by 100%.
And a first step to take:
• Decide what “Improve the performance by 100%” means.

5
With luck…
• You picked something you could measure!
• Which, as we’ll see on all the QA’s…
• Is why Bass writes down “scenarios” with measurable responses, as his arch targets
• We’ll cover these systematically in Ch 4
• See also “The Notes” at the end of the supplementary spec template.

6
Bass’s perf scenarios
• Source: One of a number of independent sources, possibly from within system
• Stimulus: Periodic events arrive; sporadic events arrive; stochastic events arrive
• Artifact: System• Environment: Normal mode; overload mode• Response: Processes stimuli; changes level of
service• Response Measure: Latency, deadline,
throughput, jitter, miss rate, data loss

7
Example scenario
• Source: Users
• Stimulus: Initiate transactions
• Artifact: System
• Environment: Under normal operations
• Response: Transactions are processed
• Response Measure: With average latency of two seconds

8
So if you need to fix yours up…
• Find a “doable” performance improvement
• Whose starting state can be characterized as one of those scenarios!

9
What do you do next?
• Adopt a tactic or two…– Ch 5 in Bass has these– But they are deceptively brief– Each area – like designing high performance
into a system – could be your career!
• What on earth could improve performance by 100%?

10
The tactics for performance
• Mostly, they have to work like this (Fig. 5.6):
Tactics to control
performanceEventsarrive
Responsesgeneratedwithin timeconstraints
11
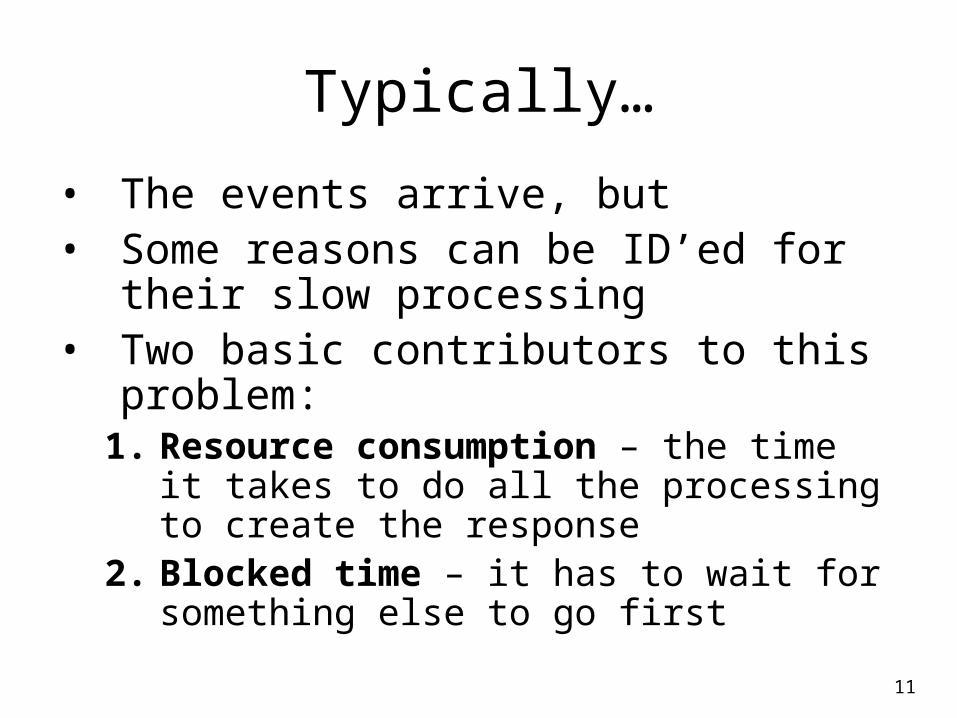
Typically…
• The events arrive, but• Some reasons can be ID’ed for their slow
processing• Two basic contributors to this problem:
1. Resource consumption – the time it takes to do all the processing to create the response
2. Blocked time – it has to wait for something else to go first

12
Which one’s easier to fix?
• Blocked time – sounds like it could lead pretty directly to some solution ideas, like:– Work queues are building up, so add more
resources and distribute the load, or– Pick the higher priority things out of the
queue, and do them first

13
Blocked time, cntd
• In your system, of course, adding resources may or may not be possible!– Add disk drives?– Add CPU’s?– Speed up communication paths?
• On servers, these are standard solutions:– Put every DB table on its own disk drive– Stick another blade in the rack, etc.

14
Resource consumption?
• You first have to know where it is:• If you’re trying to speed up a GUI activity,
time the parts, and go after the long ones.• If it’s internal, you need some way to
“observe” what’s happening, so you can do a similar analysis.– Put timings into the various pieces of activity– Some parts may be tough to break down, like
time spent in the O/S

15
Performance Engineering with a SpreadsheetTypical new system design analysis – For a network management system
Note: Having everything add up to only 60% allows for some “blocked time”
Note: Theseare all resourceconsumptionestimates

16
Performance Engineering with a SpreadsheetTypical existing system performance-improvement analysis –
To improve a customer help desk system
ActivityCurrent clock time (sec)
Current elapsed time
Proposed new ET New clock time Notes
0 0
Wait between calls 18 18 12 12 To allow for peaks
Take next call 23 5 5 17 Operator response time
Greet customer 38 15 15 32
Loop - repeat factor: Each cycle: 2 1.5 Each cycle: Retries of the next steps
Get nature of problem 30 30 15 15 Includes questioning
Analyze 45 15 15 30 Mostly think time
Propose solution 65 20 20 50 Mostly explaining steps
Customer tries solution 85 20 20 70 Widest variance here
Each loop total: 85 70
End of last loop: 208 137
Close-out call 218 10 10 147 Thank you, etc.
Write-up call 248 30 30 177 Documentation
Total savings : 71 sec
Improvement : 40 %

17
Bass’s Performance Remedies
• Try one of these 3 Strategies – look at:– Resource demand– Resource management– Resource arbitration
• See next slides for details on each – They’re also summarized on the inside back
cover of Bass’s book, pp. 111-116

18
Resource Demand – example:
• Server system has “the database” for retail inventory (for CSSE 374’s NextGen POS):– Transactions hit it at a high rate, from POS– Managers also periodically do huge queries,
like, “What toothpaste is selling best West of the Mississippi?”
– When they do, transactions back up
• How to fix?

19
Resource Demand – options:
• Increase computational efficiency
• Reduce computational overhead
• Manage event rate
• Control frequency of sampling
• Bound execution times
• Bound queue sizes

20
Resource Management – example:
• You have a “pipe and filter” system to convert some data for later processing:
• It runs too slowly, because it reads and writes all files on the same disk (on your laptop, say)
• How to fix?
Picture from http://www.dossier-andreas.net/software_architecture/pipe_and_filter.html.
Non-XMLdata fromoutside
XML datayou canprocess
Clean up Convert

21
Resource Management – options:
• Introduce concurrency– How about on your project?
• Maintain multiple copies of data or computations
• Increase available resources

22
Resource Arbitration – example:
• In reader / writer scheduling…
• For a shared resource, like a DB table…
• Why give priority to the readers?

23
Resource Arbitration – options:
• Scheduling policy– FIFO– Fixed-priority
• semantic importance• deadline monotonic• rate monotonic
– Dynamic priority– Static scheduling

24
Cartoon of the Day (1/2)

25
Cartoon of the Day (2/2)

26
Back to Project 1…
Project 1 - review:
• On the team and project you picked, your first goal is to:
• Improve the performance by 100%.
We’ll have presentations / demos next week.
• They should be convincing!
• Show before and after.

27
What to do next?• Get with your teammate(s) and
1. If you are still deciding the things that are due to be turned in tonight (Turnin 1), work on those! Like writing up what the project is, or the performance goals you want to try for.
2. Do a quantitative analysis of your situation and proposed improvement, on a spreadsheet– Like slide 16
3. Revise your goal, if necessary…– It should be testable – A week from today!
4. Pick a tactic, to try for the 100% improvement.• Capture your discussion in your “team journal” (by adding a new
entry – include your revised goal, your tactic, and how you arrived at each of these)
• Over the weekend – work with your team!• Turnin 2 - Turn in your spreadsheet and journal on Angel by the end
of the day on Monday– Should discuss all 3 of Bass’s “tactics”– Should explain HOW you plan to use one