1 data & process modeling. 2 data modeling data modeling – a technique for organizing and...
TRANSCRIPT
1
Data & Process Modeling

2
Data Modeling
Data modeling – a technique for organizing and documenting a system’s data. Sometimes called database modeling.
Entity relationship diagram (ERD) – a data model utilizing several notations to depict data in terms of the entities and relationships described by that data.
3
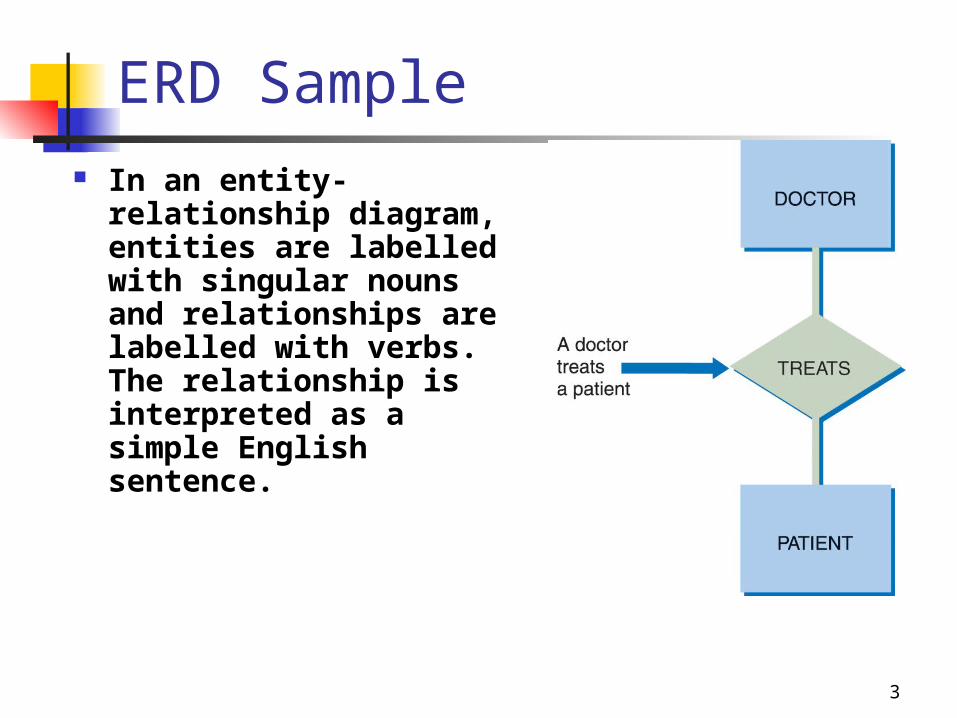
ERD Sample In an entity-
relationship diagram, entities are labelled with singular nouns and relationships are labelled with verbs. The relationship is interpreted as a simple English sentence.
4
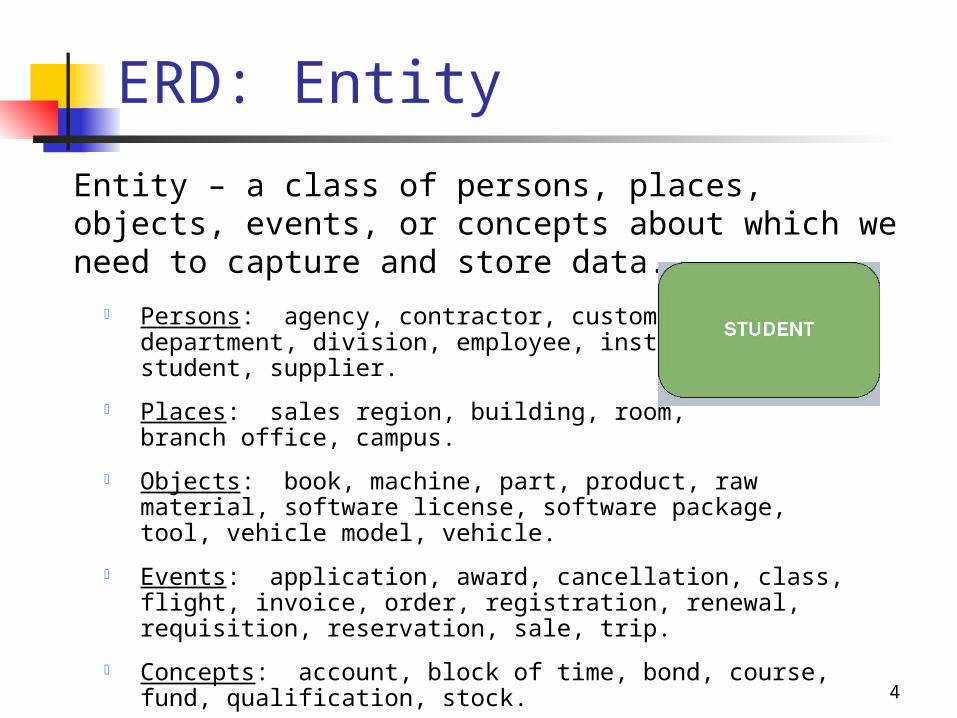
Persons: agency, contractor, customer, department, division, employee, instructor, student, supplier.
Places: sales region, building, room, branch office, campus.
Objects: book, machine, part, product, raw material, software license, software package, tool, vehicle model, vehicle.
Events: application, award, cancellation, class, flight, invoice, order, registration, renewal, requisition, reservation, sale, trip.
Concepts: account, block of time, bond, course, fund, qualification, stock.
ERD: Entity
Entity – a class of persons, places, objects, events, or concepts about which we need to capture and store data.

5
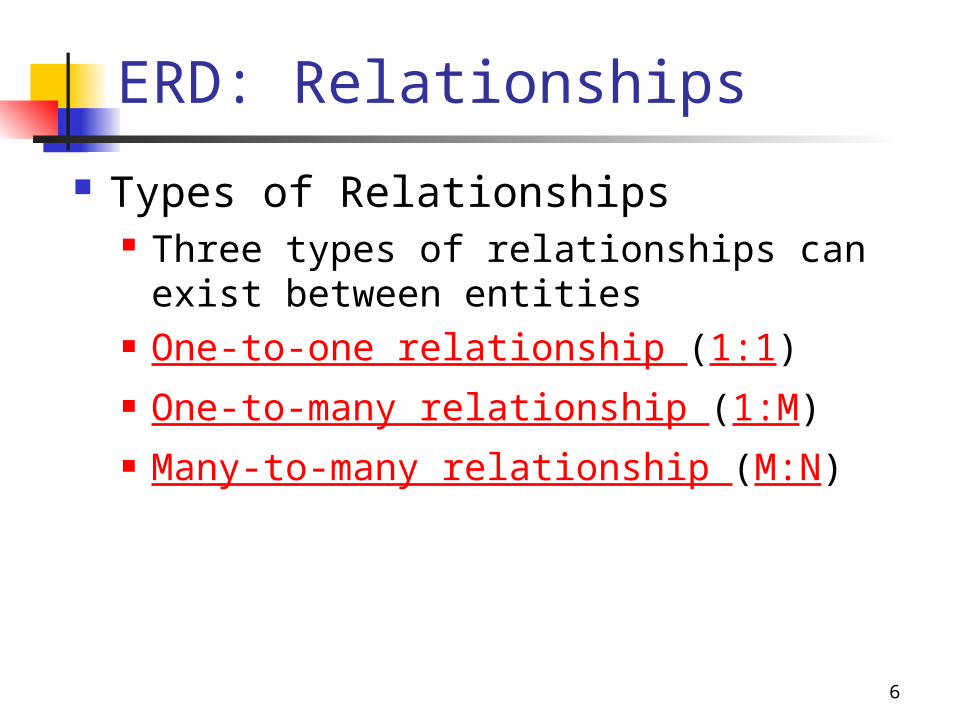
ERD: Relationships
Relationship – a natural business association that exists between one or more entities.
The relationship may represent an event that links the entities or merely a logical affinity that exists between the entities.
Student CurriculumIs being studied by is enrolled in
6
ERD: Relationships
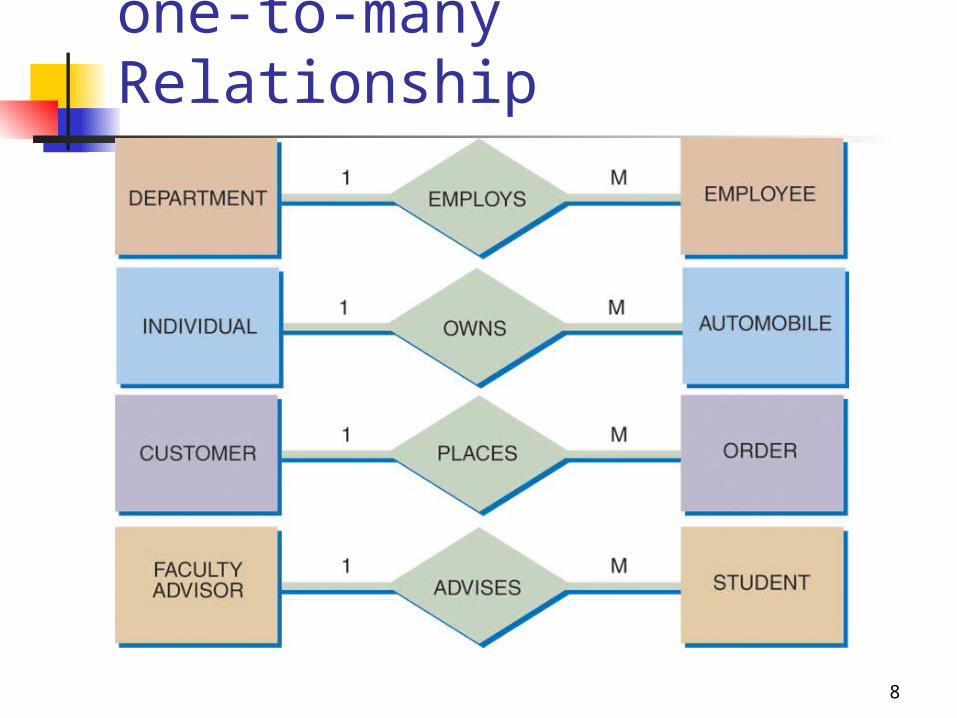
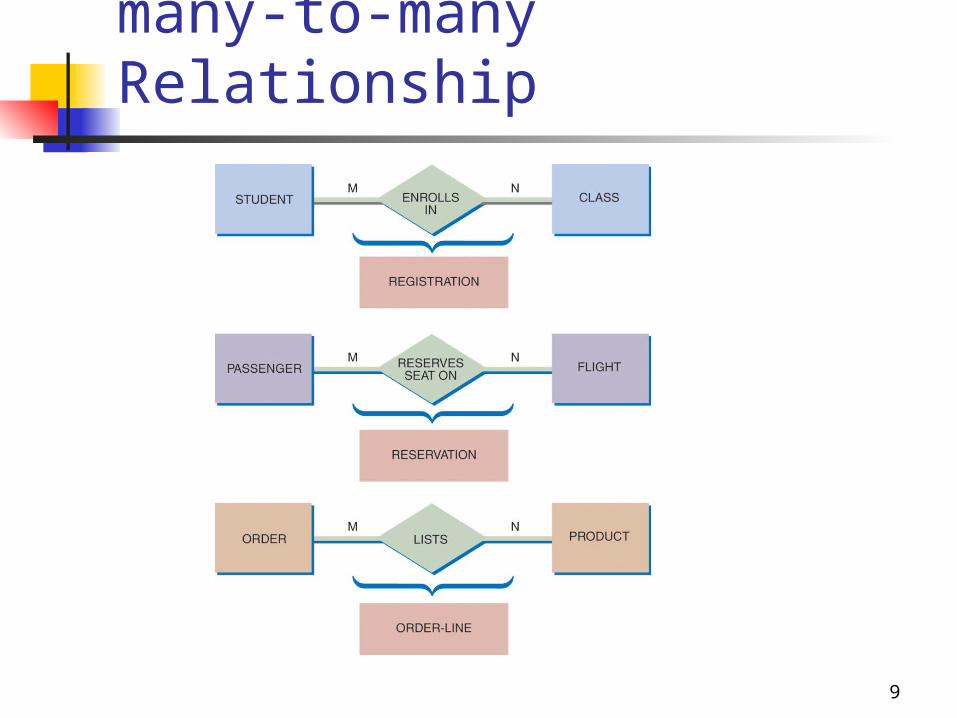
Types of Relationships Three types of relationships can exist
between entities One-to-one relationship (1:1) One-to-many relationship (1:M) Many-to-many relationship (M:N)
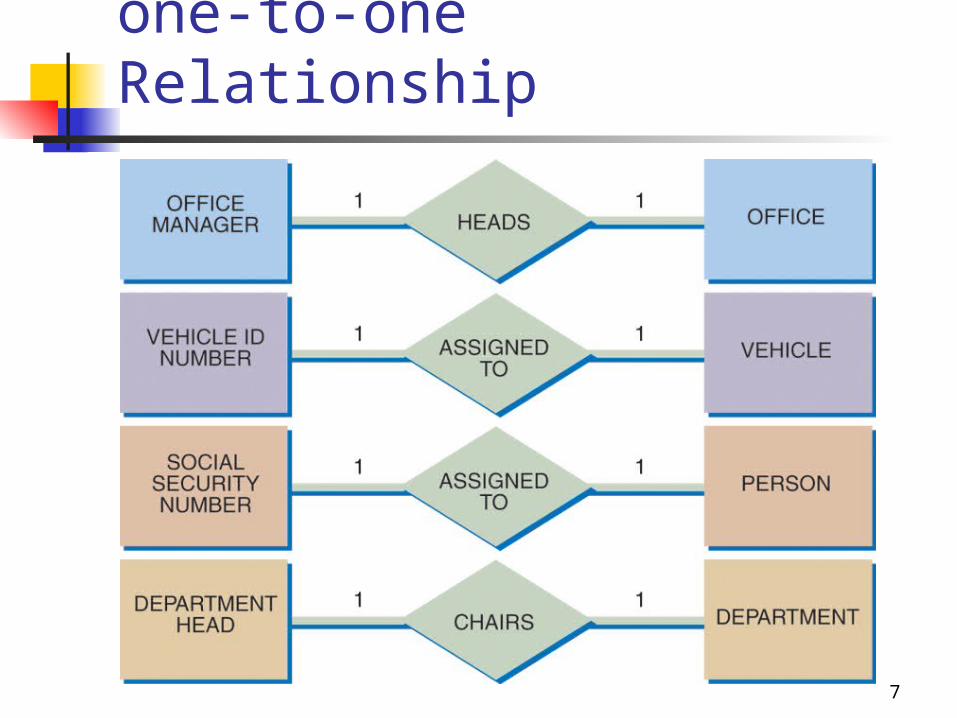
7
one-to-one Relationship
8
one-to-many Relationship
9
many-to-many Relationship
10
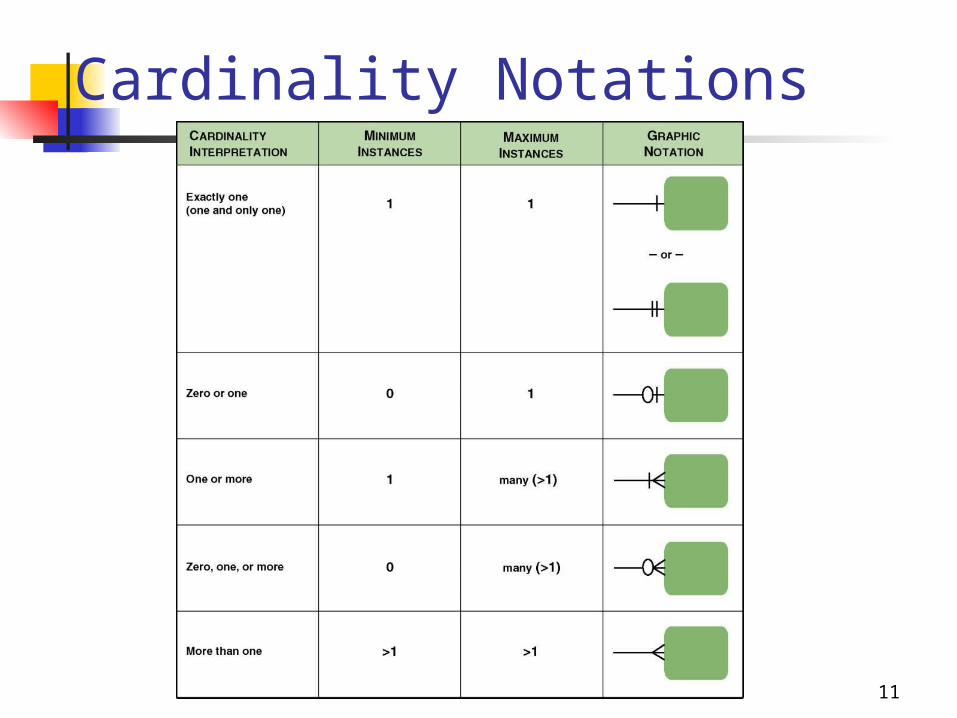
ERD: Cardinality
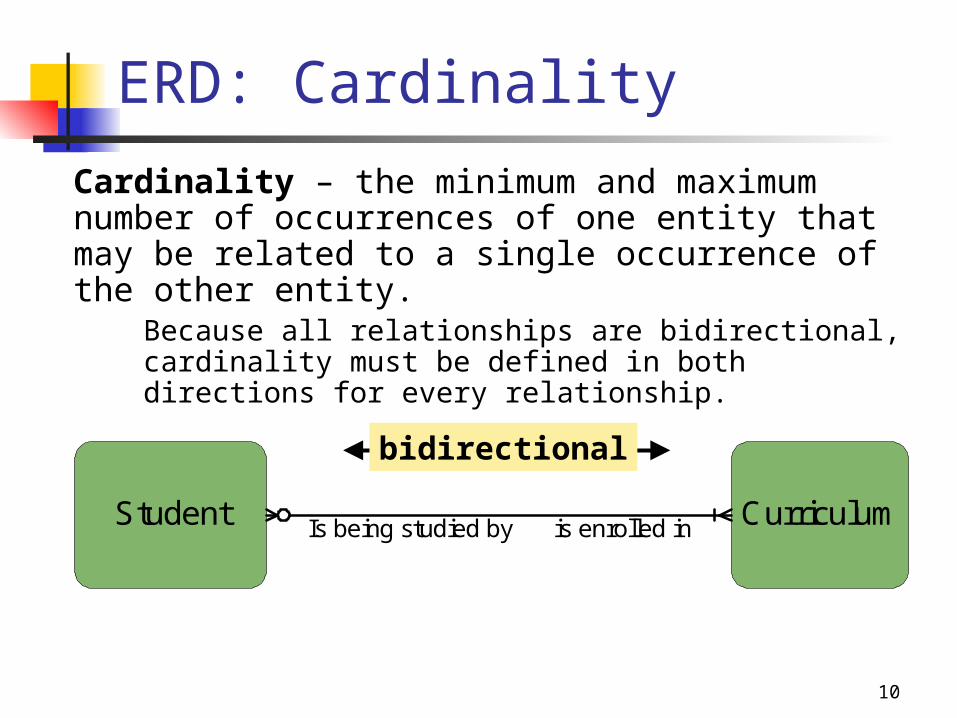
Cardinality – the minimum and maximum number of occurrences of one entity that may be related to a single occurrence of the other entity.
Because all relationships are bidirectional, cardinality must be defined in both directions for every relationship.
Student CurriculumIs being studied by is enrolled in
bidirectional
11
Cardinality Notations
12
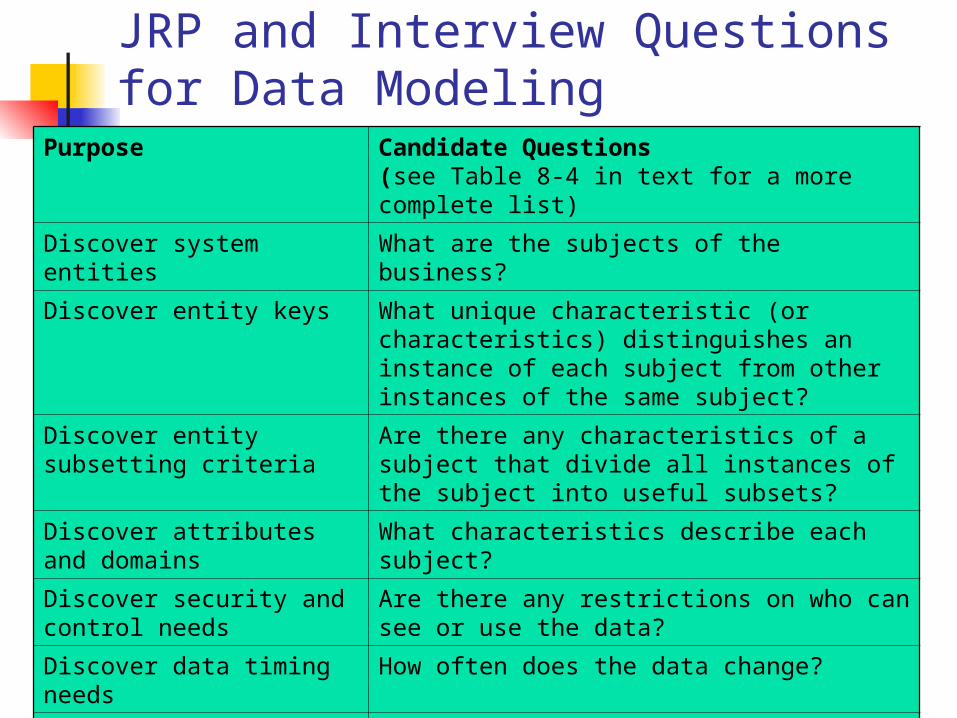
JRP and Interview Questions for Data Modeling
Purpose Candidate Questions (see Table 8-4 in text for a more complete list)
Discover system entities What are the subjects of the business?
Discover entity keys What unique characteristic (or characteristics) distinguishes an instance of each subject from other instances of the same subject?
Discover entity subsetting criteria Are there any characteristics of a subject that divide all instances of the subject into useful subsets?
Discover attributes and domains What characteristics describe each subject?
Discover security and control needs Are there any restrictions on who can see or use the data?
Discover data timing needs How often does the data change?
Discover generalization hierarchies Are all instances of each subject the same?
Discover relationships? What events occur that imply associations between subjects?
Discover cardinalities Is each business activity or event handled the same way, or are there special circumstances?
13
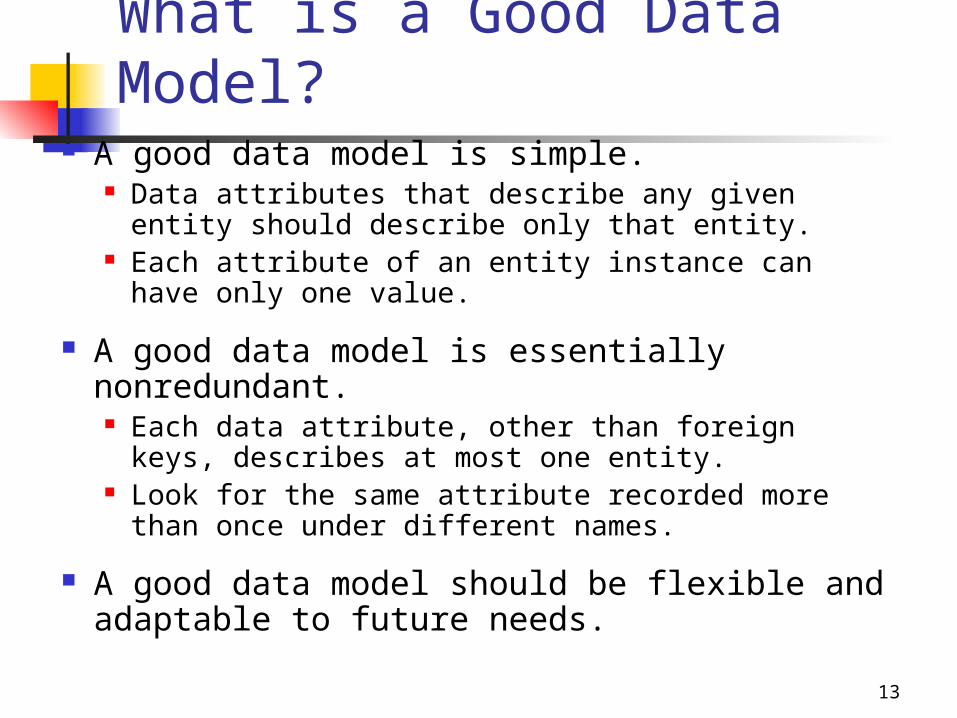
What is a Good Data Model?
A good data model is simple. Data attributes that describe any given entity
should describe only that entity. Each attribute of an entity instance can have only
one value.
A good data model is essentially nonredundant. Each data attribute, other than foreign keys,
describes at most one entity. Look for the same attribute recorded more than
once under different names.
A good data model should be flexible and adaptable to future needs.
14
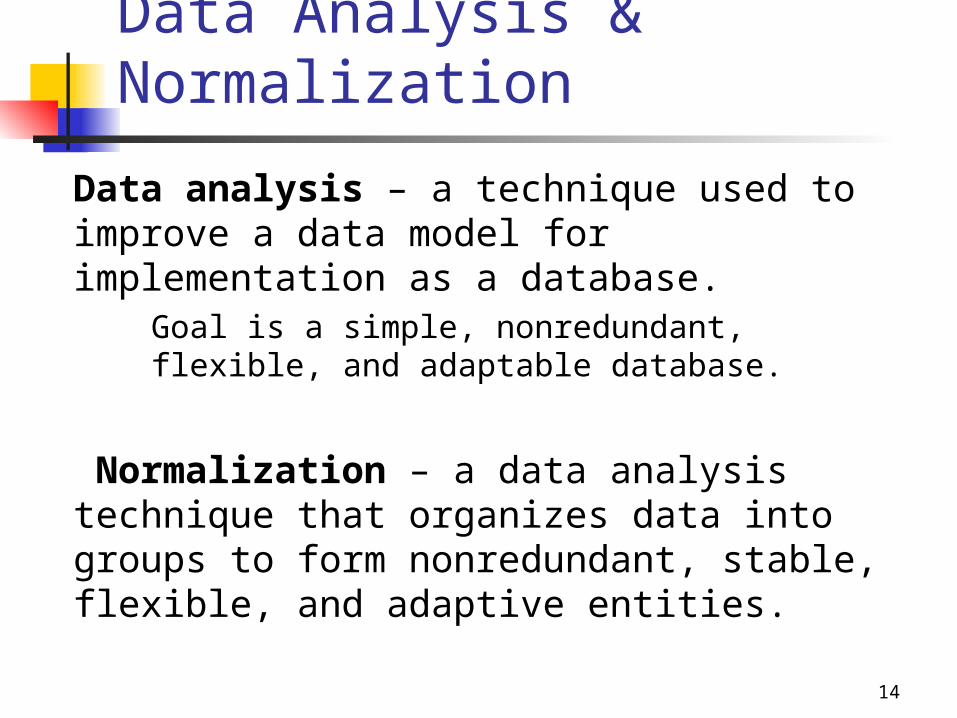
Data Analysis & Normalization
Data analysis – a technique used to improve a data model for implementation as a database.
Goal is a simple, nonredundant, flexible, and adaptable database.
Normalization – a data analysis technique that organizes data into groups to form nonredundant, stable, flexible, and adaptive entities.
15
More Issues on ERD
Degree Binary & ternary relationship
Foreign Key Primary Key (Identification Entity) Normalization

16
Process Modeling and DFDs
Process modeling – a technique used to organize and document a system’s processes.
Flow of data through processes Logic Policies Procedures
Data flow diagram (DFD) – a process model used to depict the flow of data through a system and the work or processing performed by the system. Synonyms are bubble chart, transformation graph, and process model.
17
Data Flow Diagrams
A data flow diagram (DFD) shows how data moves through an information system but does not show program logic or processing steps
A set of DFDs provides a logical model that shows what the system does, not how it does it
18
Differences Between DFDs and Flowcharts
Processes on DFDs can operate in parallel (at-the-same-time) Processes on flowcharts execute one at a time
DFDs show the flow of data through a system Flowcharts show the flow of control (sequence
and transfer of control)
Processes on a DFD can have dramatically different timing (daily, weekly, on demand) Processes on flowcharts are part of a single
program with consistent timing
19
Data Flow Diagrams
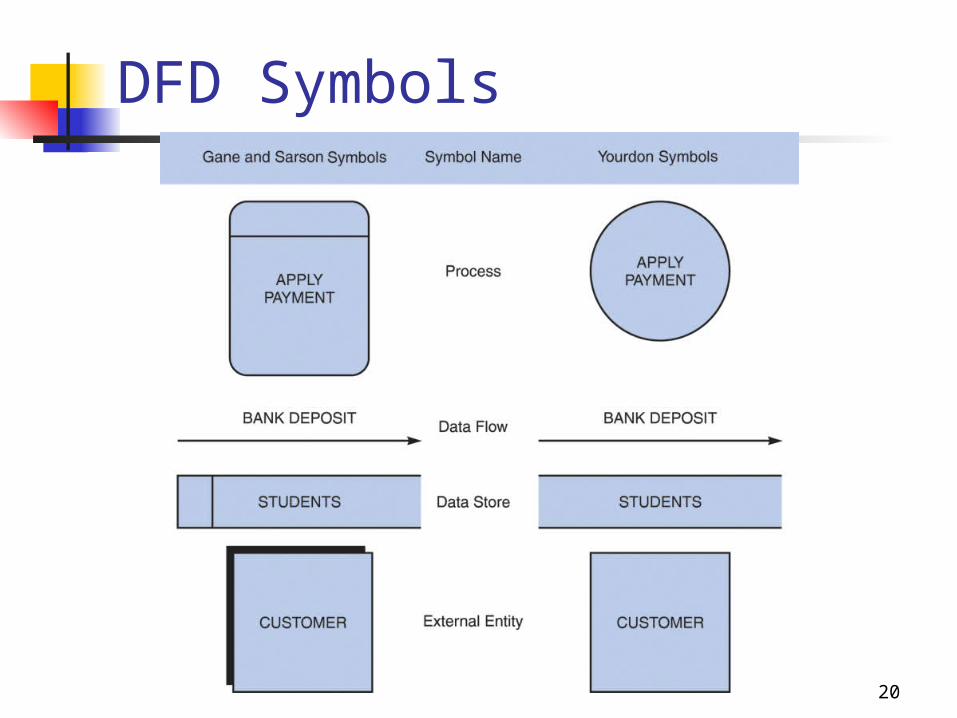
DFD Symbols DFDs use four basic symbols that
represent processes, data flows, data stores, and entities
Gane and Sarson symbol set Yourdon symbol set
Symbols are referenced by using all capital letters for the symbol name
20
DFD Symbols
21
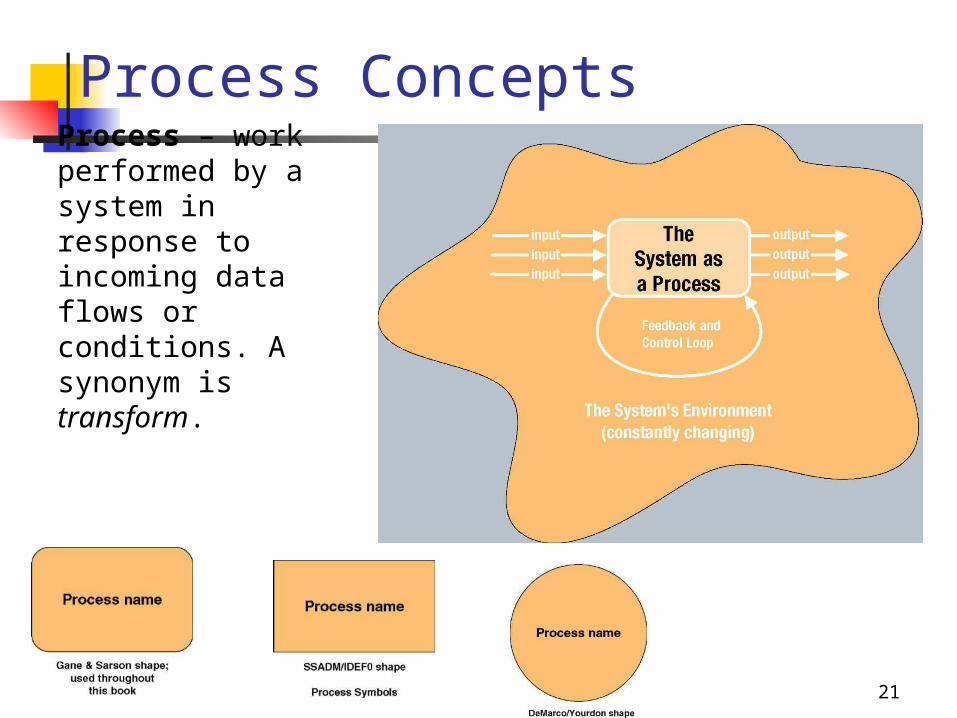
Process ConceptsProcess – work performed by a system in response to incoming data flows or conditions. A synonym is transform.
22
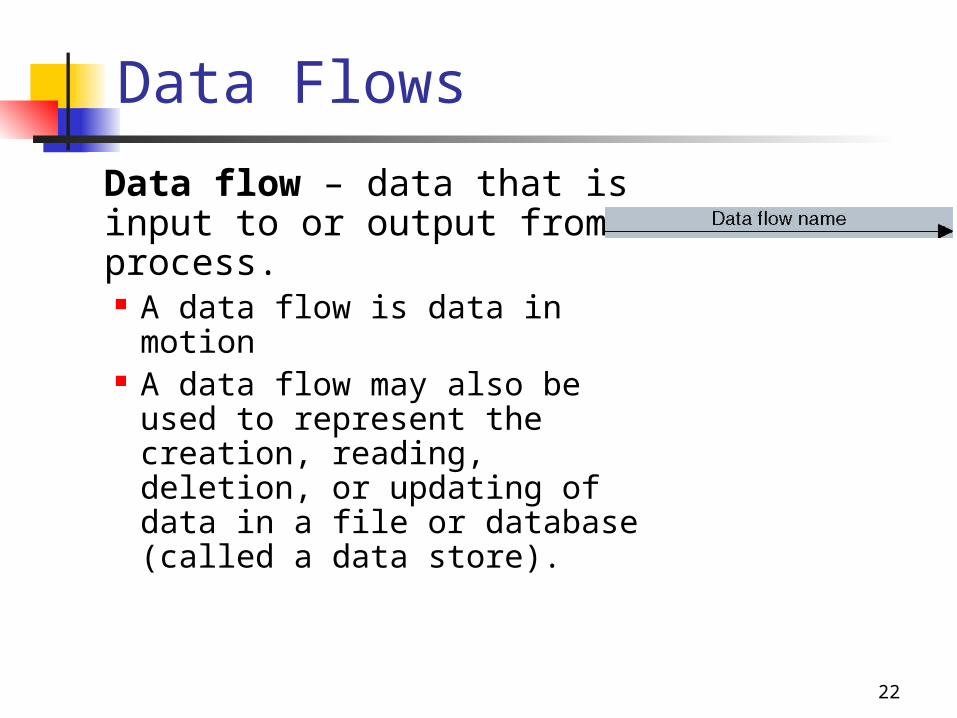
Data flow – data that is input to or output from a process. A data flow is data in motion A data flow may also be
used to represent the creation, reading, deletion, or updating of data in a file or database (called a data store).
Data Flows
23
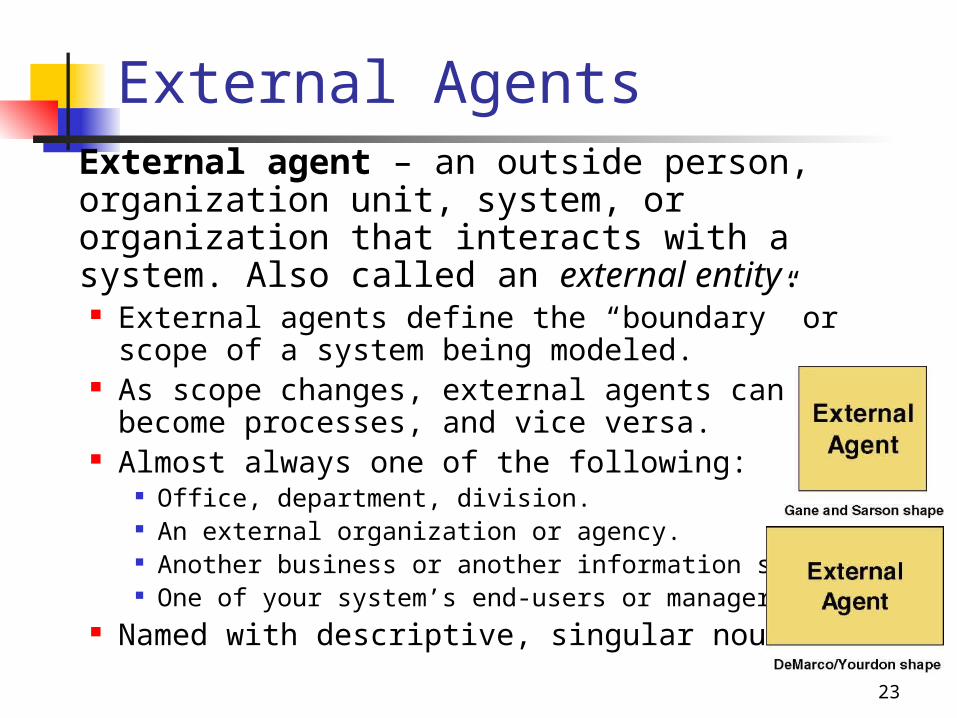
External AgentsExternal agent – an outside person, organization unit, system, or organization that interacts with a system. Also called an external entity. External agents define the “boundary” or
scope of a system being modeled. As scope changes, external agents can become
processes, and vice versa. Almost always one of the following:
Office, department, division. An external organization or agency. Another business or another information system. One of your system’s end-users or managers
Named with descriptive, singular noun
24
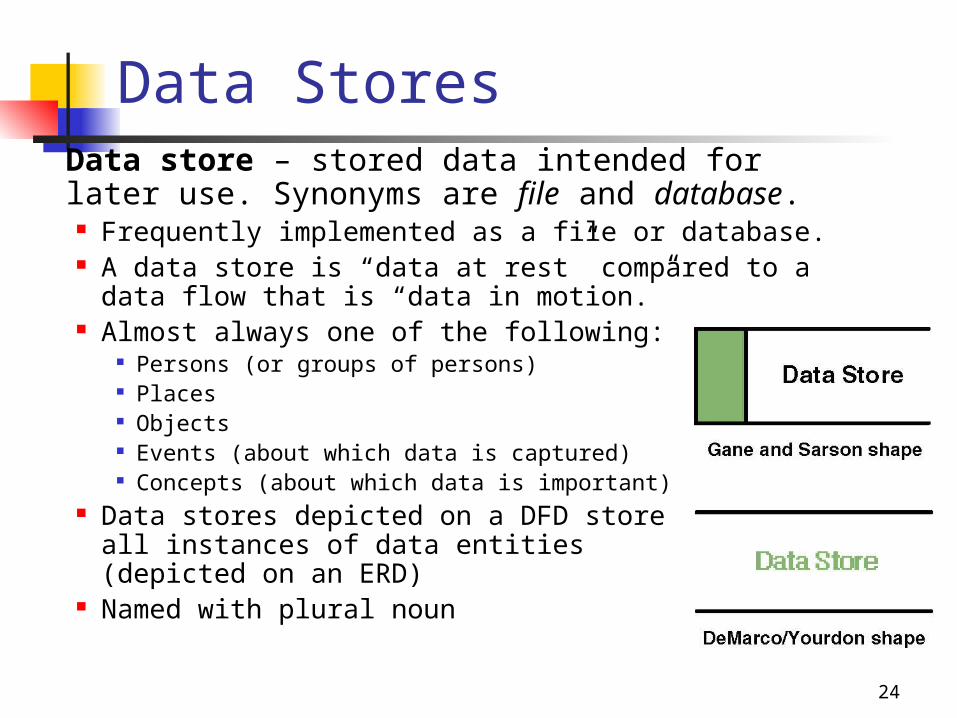
Data StoresData store – stored data intended for later use. Synonyms are file and database. Frequently implemented as a file or database. A data store is “data at rest” compared to a data
flow that is “data in motion.” Almost always one of the following:
Persons (or groups of persons) Places Objects Events (about which data is captured) Concepts (about which data is important)
Data stores depicted on a DFD store all instances of data entities (depicted on an ERD)
Named with plural noun
25
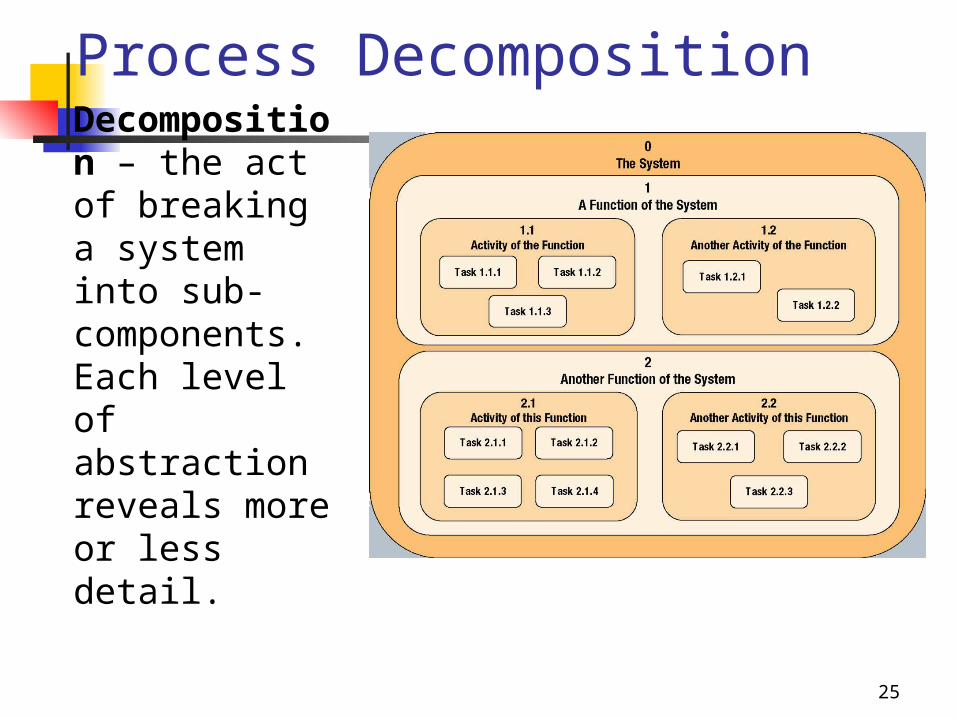
Process DecompositionDecomposition – the act of breaking a system into sub-components. Each level of abstraction reveals more or less detail.
26
Decomposition Diagrams
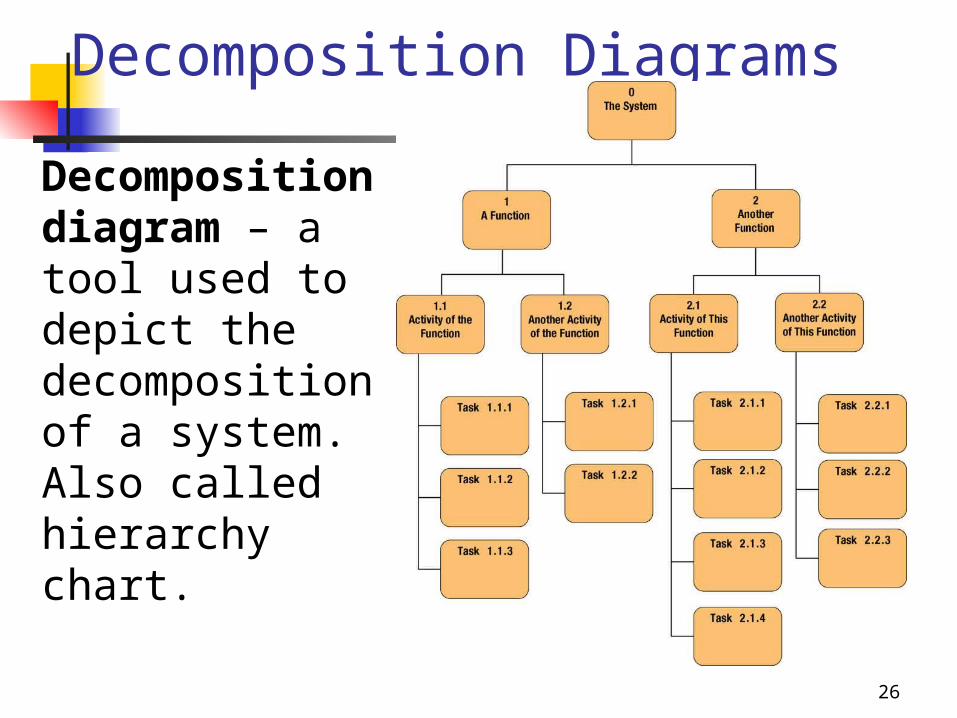
Decomposition diagram – a tool used to depict the decomposition of a system. Also called hierarchy chart.
27
Data Flow Diagrams
Context Diagrams Top-level view of an information system
that shows the system’s boundaries and scope
Do not show any data stores in a context diagram because data stores are internal to the system
Begin by reviewing the system requirements to identify all external data sources and destinations
28
Data Flow Diagrams
Context Diagrams Record the name of the entities and the
name and content of the data flows, and the direction of the data flows
What makes one system more complex than another is the number of components, the number of levels, and the degree of interaction among its processes, entities, data stores, and data flows
29
Data Flow Diagrams
Conventions for DFDs1. Each context diagram must fit on one
page2. The process name in the context
diagram should be the name of the information system
3. Use unique names within each set of symbols
30
Data Flow Diagrams
Conventions for DFDs4. Do not cross lines5. Use a unique reference number for
each process symbol
31
Data Flow Diagrams
Strategies for Developing DFDs A set of DFDs is a graphical, top-down
model With a bottom-up strategy, you first
identify all functional primitives, data stores, entities, and data flows
The main objective is to ensure that your model is accurate and easy to understand
32
Data Flow Diagrams
Strategies for Developing DFDs General rule of thumb is that a diagram
should have no more than nine process symbols
To construct a logical model of a complex system, you might use a combination of top-down and bottom-up strategies
The best approach depends on the information system you are modeling
33
Illegal Process
Spontaneous generation Process with no inputs
Black Hole Process with no outputs
Gray Hole The inputs is insufficient to generate the
output

34
35
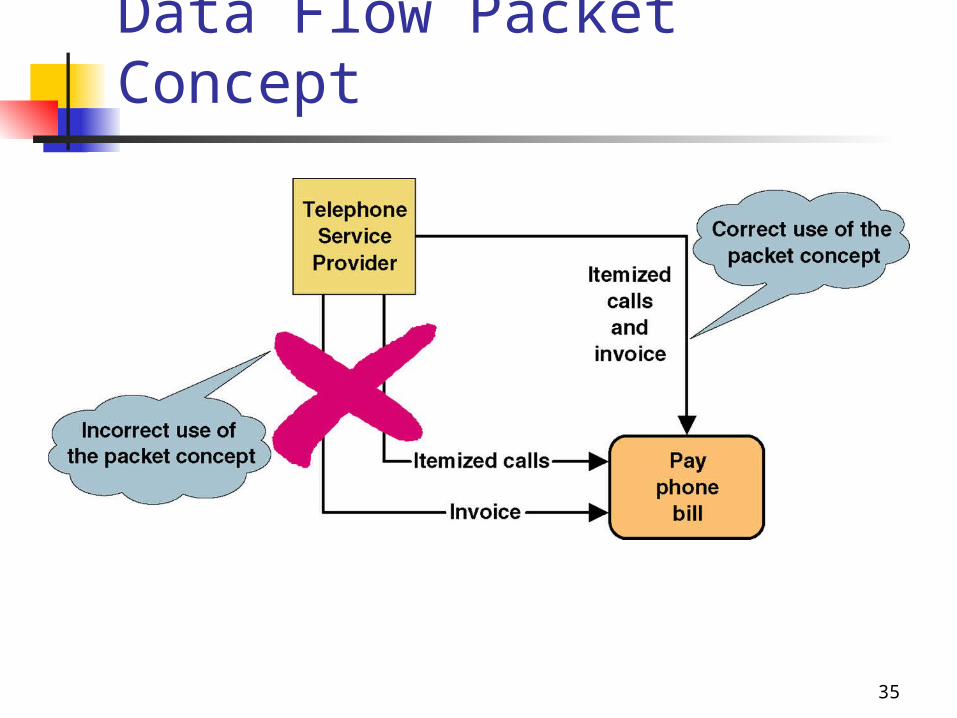
Data Flow Packet Concept
36
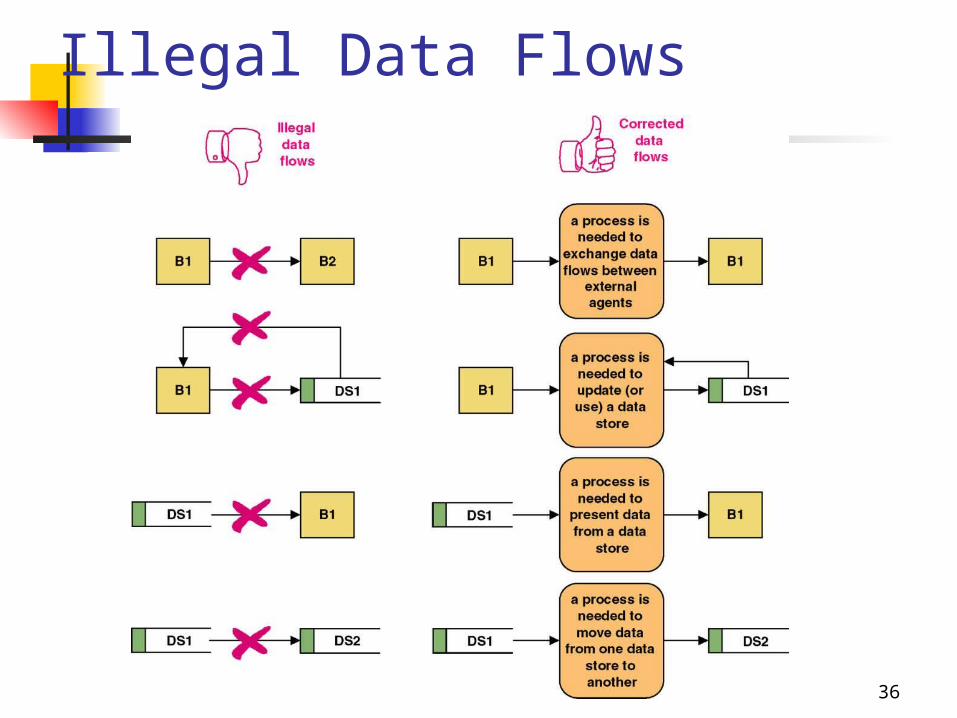
Illegal Data Flows
37
More Issues on Process Model
Natural English Structured English Decision Table Use Cases
38
Test Yourself
1. Data flow diagrams show what a system does, not how it does it (T/F).

39
Test Yourself
1. Data flow diagrams show what a system does, not how it does it (T/F).
True
40
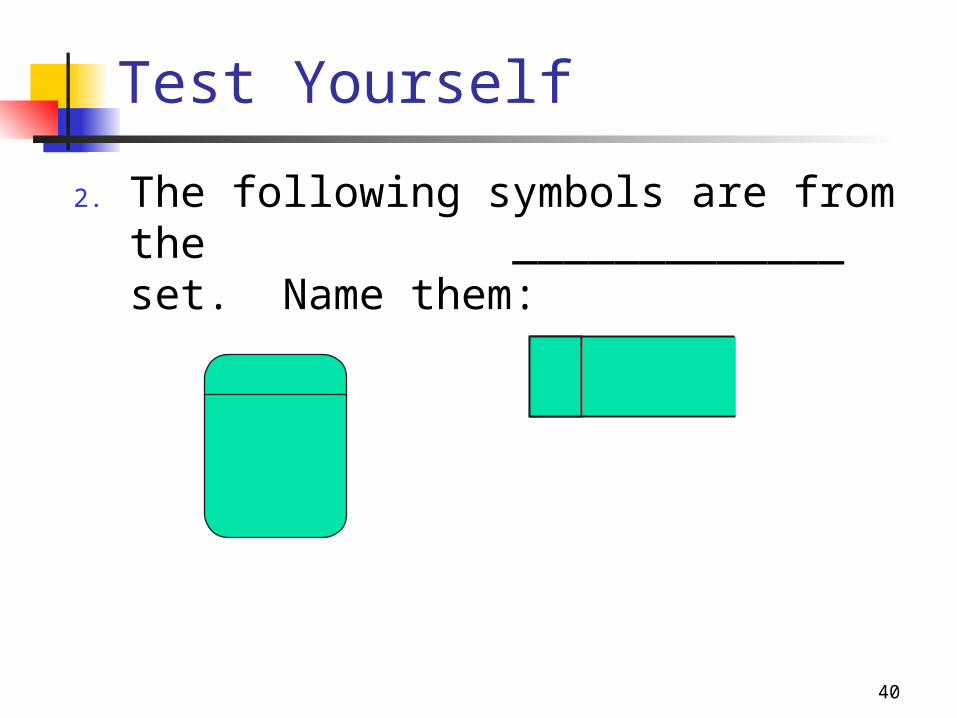
Test Yourself
2. The following symbols are from the _____________ set. Name them:
41
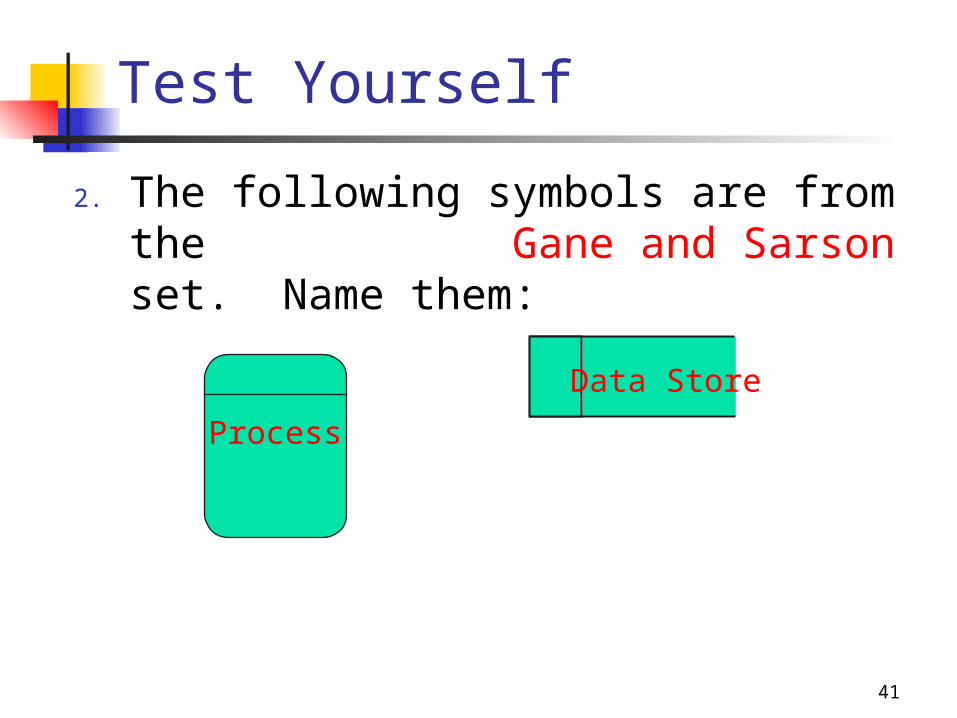
Test Yourself
2. The following symbols are from the Gane and Sarson set. Name them:
Data Store
Process
42
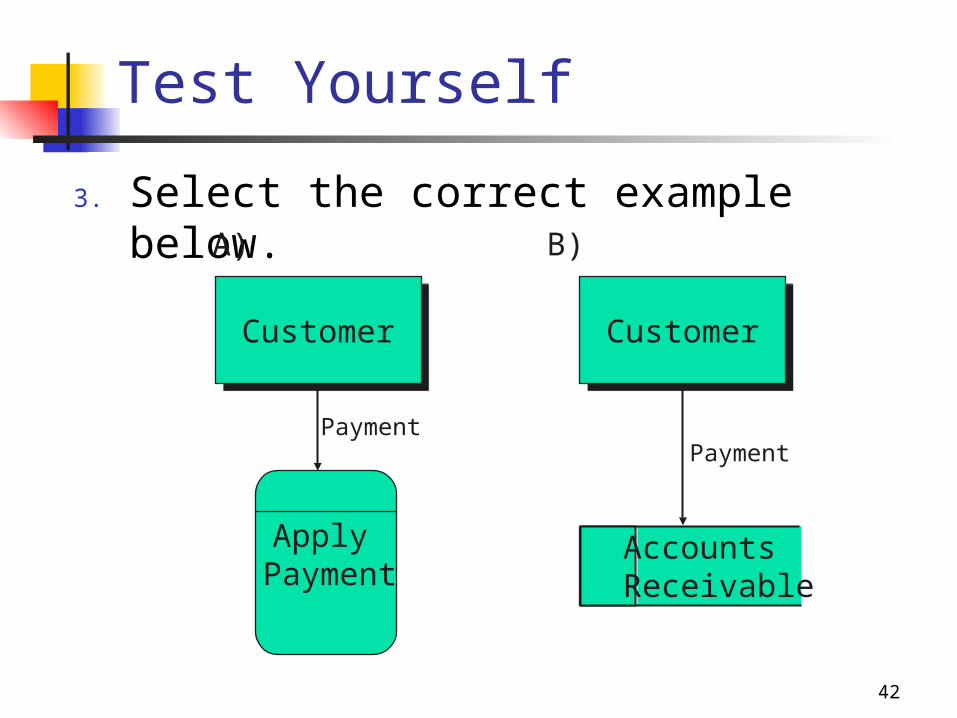
Test Yourself
3. Select the correct example below.
CustomerCustomer CustomerCustomer
A) B)
Apply Payment
AccountsReceivable
PaymentPayment
43
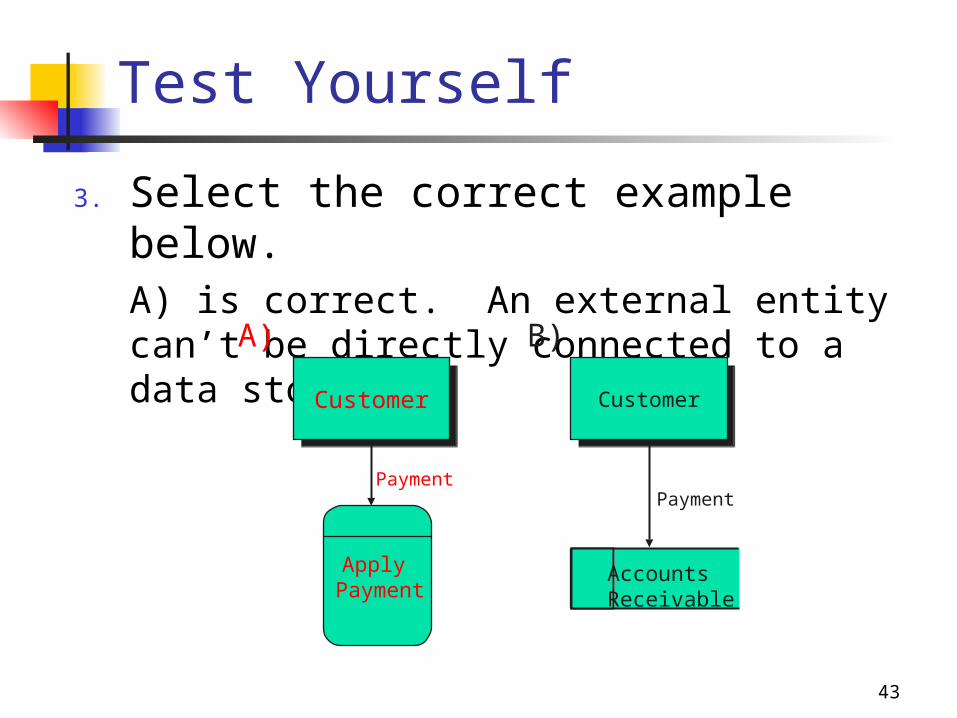
Test Yourself
3. Select the correct example below.A) is correct. An external entity can’t be directly connected to a data store.
A) B)
CustomerCustomer CustomerCustomer
Apply Payment
AccountsReceivable
PaymentPayment
44
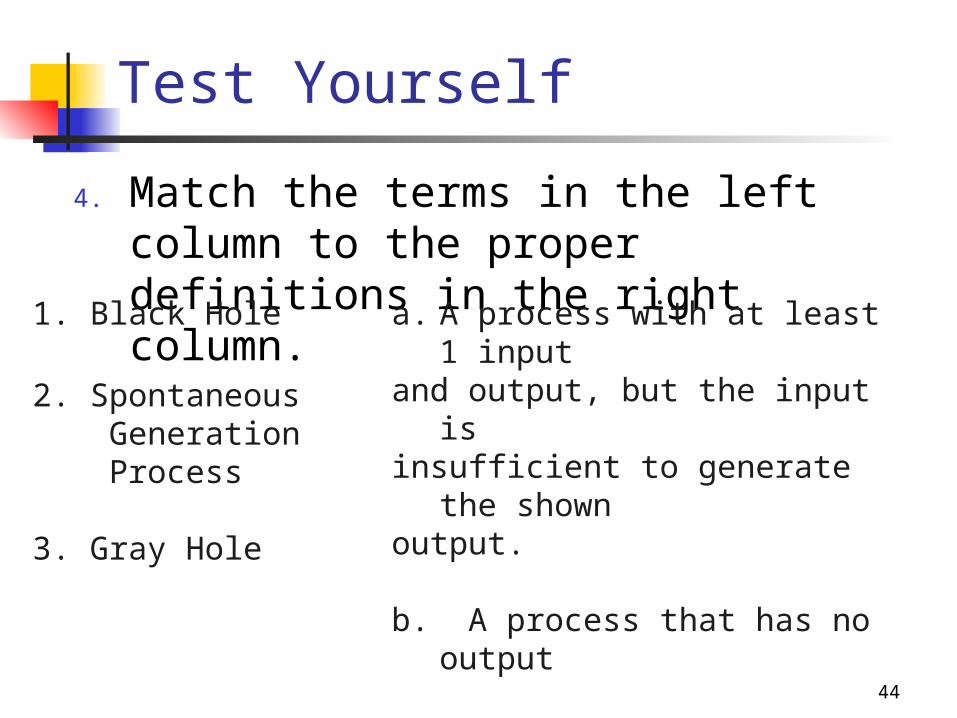
Test Yourself
4. Match the terms in the left column to the proper definitions in the right column.1. Black Hole
2. Spontaneous Generation Process
3. Gray Hole
a. A process with at least 1 input and output, but the input is insufficient to generate the shownoutput.
b. A process that has no output
c. Used to describe an unexplainedgeneration of data or information.
45
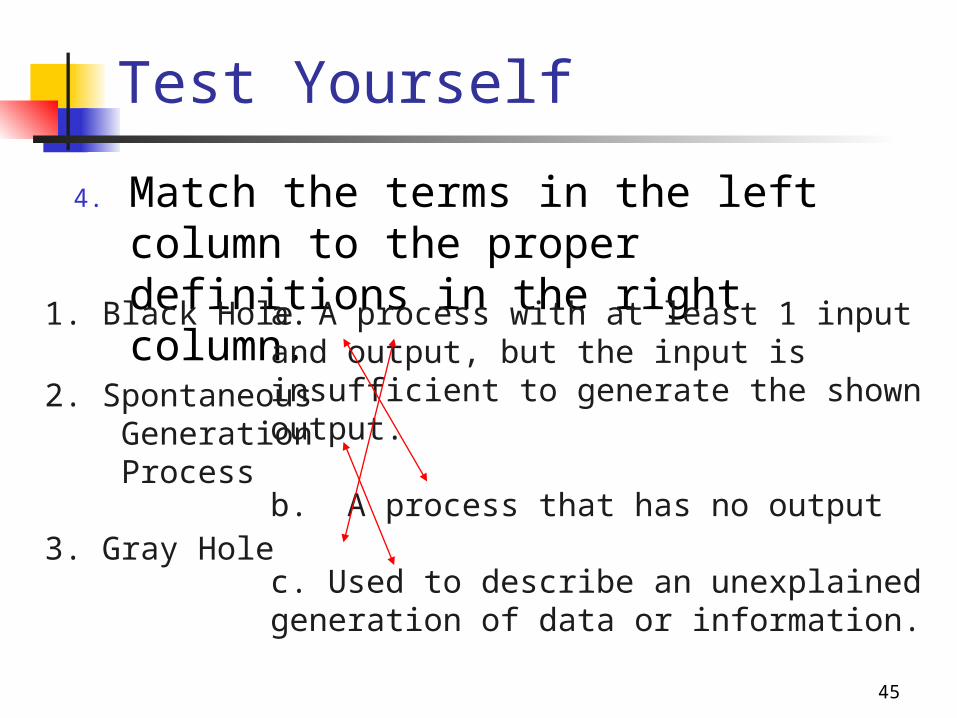
Test Yourself
4. Match the terms in the left column to the proper definitions in the right column.1. Black Hole
2. Spontaneous Generation Process
3. Gray Hole
a. A process with at least 1 input and output, but the input is insufficient to generate the shownoutput.
b. A process that has no output
c. Used to describe an unexplainedgeneration of data or information.