1. demographic processes - tarki.hu · 16 1. demographic processes tÁrki european social report...
TRANSCRIPT

14 1. DEMOGRAPHIC PROCESSES
TÁRKI EUROPEAN SOCIAL REPORT TÁRKI EUROPEAN SOCIAL REPORT
1. DEMOGRAPHIC PROCESSES

TÁRKI EUROPEAN SOCIAL REPORT TÁRKI EUROPEAN SOCIAL REPORT
151. DEMOGRAPHIC PROCESSES
1.1. Introduction
This chapter reviews the relevant literature, the major indicators and the results of our empirical analyses concerning the demographic processes characteristic of the European Union. Three determinants of the demographic profile of Europe will be presented first: fertility, mortality and migration (Section 1.2). Next, the immediate and the more far-reaching consequences of these processes will be discussed and there will be a brief outline of some alternative options for social policy, aimed at alleviating or forestalling the negative consequences (Section 1.3). Demographic processes also have a bearing on the household structure of societies, the rearrangement of which may, in turn, affect – as a micro-level mediator – social, economic and political processes. Our next section, therefore, looks at the impact of macro-processes at the level of households, and compares the countries of the European Union from this perspective (Section 1.4). Finally, the relationship between household structure and income position will be investigated (Section 1.5). Our empirical analyses are based on the 2005 cross-section wave of the EU-SILC survey. Since cross-section data only allow a very limited analysis of the causes and consequences of demographic events, our efforts will be directed towards other goals. It is our aim to refine the demographic picture drawn of Europe on the basis of macro-level data, by including individual and household-level data in the analysis.
1.2. The demographic profile of the European Union – macro-processes and forecasts
1.2.1. Fertility
Trends and forecasts
At the same time as the world’s population is steadily increasing, the population of the European continent is expected to decline – unless there is some radical change in immigration patterns – both in absolute and relative terms. The slowing in the rate of population growth can, to a large extent, be attributed to a recent fall in fertility rates over and above earlier predictions.
We seek to refine the demographic picture draWn of europe on the basis of macro-level data, by including individual and household-level data in the analysis.
the population of the european continent Will decline in the near future, both in absolute and relative terms.
16 1. DEMOGRAPHIC PROCESSES
TÁRKI EUROPEAN SOCIAL REPORT TÁRKI EUROPEAN SOCIAL REPORT
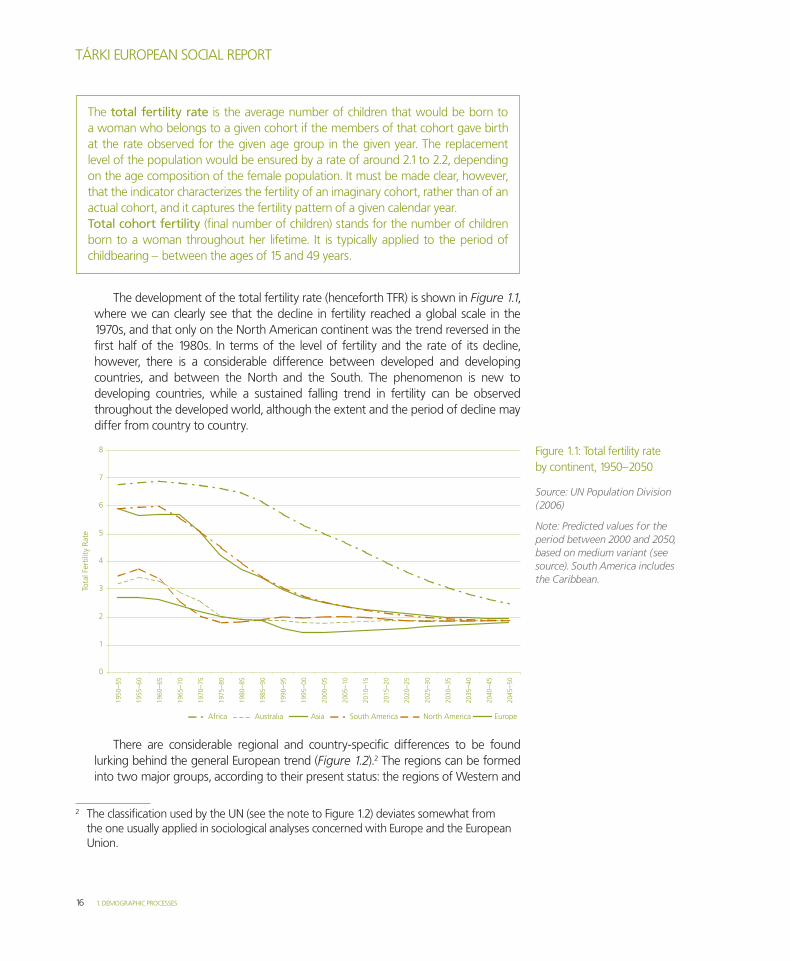
The development of the total fertility rate (henceforth TFR) is shown in Figure 1.1, where we can clearly see that the decline in fertility reached a global scale in the 1970s, and that only on the North American continent was the trend reversed in the first half of the 1980s. In terms of the level of fertility and the rate of its decline, however, there is a considerable difference between developed and developing countries, and between the North and the South. The phenomenon is new to developing countries, while a sustained falling trend in fertility can be observed throughout the developed world, although the extent and the period of decline may differ from country to country.
There are considerable regional and country-specific differences to be found lurking behind the general European trend (Figure 1.2).2 The regions can be formed into two major groups, according to their present status: the regions of western and
2 The classification used by the UN (see the note to Figure 1.2) deviates somewhat from the one usually applied in sociological analyses concerned with Europe and the European Union.
The total fertility rate is the average number of children that would be born to a woman who belongs to a given cohort if the members of that cohort gave birth at the rate observed for the given age group in the given year. The replacement level of the population would be ensured by a rate of around 2.1 to 2.2, depending on the age composition of the female population. It must be made clear, however, that the indicator characterizes the fertility of an imaginary cohort, rather than of an actual cohort, and it captures the fertility pattern of a given calendar year.Total cohort fertility (final number of children) stands for the number of children born to a woman throughout her lifetime. It is typically applied to the period of childbearing – between the ages of 15 and 49 years.
Figure 1.1: Total fertility rate by continent, 1950–2050
Source: UN Population Division (2006)
Note: Predicted values for the period between 2000 and 2050, based on medium variant (see source). South America includes the Caribbean.

TÁRKI EUROPEAN SOCIAL REPORT TÁRKI EUROPEAN SOCIAL REPORT
171. DEMOGRAPHIC PROCESSES
Northern Europe form a cluster with relatively high fertility, while Southern and Eastern Europe form another cluster with comparatively low fertility.
This current situation has arisen in a variety of ways, however. while the regions of Northern and western Europe display very similar patterns, the curves that describe Southern and Eastern Europe differ both from those patterns and from one another. In the wake of the roller-coaster curve of the baby boom and the baby bust (the period of the second demographic transition3), the patterns describing the countries of western and Northern Europe diverged: in western Europe, the eighties were characterized by decline, while a period of general stagnation described Northern Europe at this time. In the countries of western Europe, the fertility rate had stabilized by the mid-1990s, and this was followed by a period of increase up to 2005. The region of Northern Europe, by contrast, saw a slow decline throughout the nineties.
while, at the start of the period under analysis, the regions of Southern and Eastern Europe had higher fertility rates than the countries of Northern and western Europe, by the end of the period the situation had been reversed. An effectively unbroken declining trend is to be observed for both groups of countries, but their curves only meet at the start and at the end of the period, while in between we see divergent trends. The countries of Eastern Europe, with their state-socialist regimes, displayed a relatively stable fertility pattern in the period from the late sixties to the late eighties, and this was followed by an exceptionally steep fall in the decade after the political and economic regime change. By contrast, the generally equivalent decline in fertility in the countries of Southern Europe was the result of a long steady trend.
3 Lesthaeghe (1983), van de Kaa (2001).
the countries of the eu form tWo major clusters: a higher-fertility group, comprising the countries of the Western and northern european regions, and a loWer-fertility group, comprising the countries of southern and eastern europe. this has not alWays been so.
Figure 1.2: Total fertility rate by region in Europe, 1950–2050
Source: UN Population Division (2006)
Regional grouping: Northern Europe – Denmark, Estonia, Finland, Iceland, Ireland, Latvia, Lithuania, Norway, Sweden, United Kingdom; Western Europe – Austria, Belgium, France, Germany, Luxembourg, the Netherlands, Switzerland; Southern Europe – Albania, Bosnia and Herzegovina, Croatia, Greece, Italy, Malta, Montenegro, Portugal, Serbia, Slovenia, Spain, Macedonia; Eastern Europe – Belarus, Bulgaria, Czech Republic, Hungary, Poland, Moldova, Romania, Russia, Slovakia, Ukraine.

18 1. DEMOGRAPHIC PROCESSES
TÁRKI EUROPEAN SOCIAL REPORT TÁRKI EUROPEAN SOCIAL REPORT
Eastern and Southern Europe have TFRs of around 1.3, while the TFRs of Northern and western Europe hover around 1.6 (where TFR is expressed as the average of the countries of each region). Notwithstanding the observed differences, we may conclude that the simple replacement of the population is not ensured in any of the EU countries. The medium variant of the UN projections predicts a convergence in fertility trends in the countries of Europe by 2050, at a TFR of around 1.6. The average fertility of Eastern European countries is expected to fall somewhat below that level. The demographic forecasts estimated by Eurostat largely accord with the UN projections (EC, 2007a).
An examination of the country-level data behind the trends displayed in Figure 1.2 reveals that, over the period from 1950 to 2005, the highest TFR is to be found in Ireland, with values that never fall below 1.9. High total fertility rates – with greater or lesser fluctuations – are also to be observed in France, Denmark and Sweden. The TFR there remained at over 1.6 throughout the period (with the exception of Denmark in the first half of the 1980s). Taking the average values of recent years, the lowest levels of fertility are experienced by the Czech Republic (1.18), Slovakia (1.22), Latvia (1.25), Greece (1.28), Italy and Spain (1.29 each).
In Hungary, the TFR was over 2.5 in the first half of the 1950s, thanks primarily to the surge in childbearing at the time of the Ratko population policy. The declining trend was halted by another rise in the mid-seventies. As in the other formerly state-socialist countries, the decline in fertility accelerated in the years following the regime change, and recently stabilized at around 1.3. This places Hungary among the countries of low fertility.
The determinants of fertility trends
Childbearing trends develop under the influence of a complex set of factors. The direct, typically demographic causes (such as cohabitation patterns and the timing of childbirth) essentially reflect the costs involved in having a child and raising a family. These costs – as suggested by theories of economic science (e.g. willis, 1973, 1979; Becker, 1981; Easterlin, 1968) – are determined by the social and economic processes of recent decades, such as the development of welfare systems based on intergenerational solidarity, the considerable increase in the value of human capital and the rise in women’s real wages, and, related to that, the increase in the number of working women. Since the scope of our study does not permit discussion of all these factors, we shall focus on the effects that the age of childbearing and women’s labour supply have on fertility.4
The age of childbearing. In 2005, the European Union had an average TFR of around 1.5. This figure collapses together two groups of countries that differ in their yearly indicators, but the general conclusion that childbearing propensity falls below the threshold rate of 2.1 needed for population replacement holds for both groups. The first group comprises countries with TFRs of around 1.6 to 1.9 (predominantly the
4 A detailed analysis of these processes is given in comprehensive demographic studies, see RAND Europe (2004), SSO (2005), EC (2007a).
eastern and southern europe have total fertility rates of around 1.3, While the tfrs of northern and Western europe hover around 1.6. the simple replacement of the population is not ensured in any of the eu countries. forecasts predict a convergence in childbearing propensity by 2050, at a tfr of around 1.6.
the trends in childbearing are primarily explained by the increasing costs of starting a family and of raising children.
it is a reasonable conjecture that the rise in the age of childbearing means a delay in births but does not affect the final number of children...

TÁRKI EUROPEAN SOCIAL REPORT TÁRKI EUROPEAN SOCIAL REPORT
191. DEMOGRAPHIC PROCESSES
countries of Northern and western Europe), while the value of the indicator remains below 1.5 in the countries of the other group (the Mediterranean region and the former state-socialist countries) (EC, 2007a). Some researchers believe that the actual situation with respect to fertility is better than might be suggested by the currently observed period fertility rates.5 The trend towards delaying the age of first childbirth began in 1980 and is with us to this day. The overall average age of childbearing is also on the increase (Figure 1.3). As well as affecting the mean age of childbearing (tempo effect), this has an impact on the number of births (quantum effect), and it may influence the period fertility rate in two opposing directions. with the delayed age of childbirth, a rapid decline in the period fertility rates does not necessarily mean a reduction in the total number of births. It could be that the delay only affects the timing of childbirth within the propagative period. This assumption is one of the factors justifying the increasing fertility trend used for the medium variant of population projections mentioned above.
we get the opposite result if the changes in the age of childbirth are expected to have an effect on the total number of births. It is easy to see that the longer the age of first childbirth is delayed, the less time will be left for further births. This assumption is supported by Frejka and Calot (2001), who compare the cohort fertility rates of women born in the 1930s and 1960s in countries with low fertility rates. Lutz, Skirbekk and Testa (2005) work with a similar hypothesis in formulating their theory of the low fertility trap. This theory states that there is more than one mechanism that can result in the currently observed low fertility rate leading to a further decline in childbearing propensity or to stagnation at this low level.
5 The debate was started by Bongaarts and Feeney’s (1998) study. Total fertility rate is considered to be a period fertility indicator in this context.
... but it is more likely that, as the birth of the first child is delayed, less time Will be left for further births.
Figure 1.3: Average age at childbirth in the European Union, by country (years)
Source: EC, 2007a
20 1. DEMOGRAPHIC PROCESSES
TÁRKI EUROPEAN SOCIAL REPORT TÁRKI EUROPEAN SOCIAL REPORT
The issue can only be decided by examining total cohort fertility rates. The analysis, however, comes up against the problem that the total number of births is only known for women aged at least 40, and not, for obvious reasons, for younger women. we can therefore state that the EU-25 mean total cohort fertility rate of women born in the mid-1960s is substantially lower than that of women born shortly after world war II, but we have no knowledge of the average number of children born to younger generations by the end of their fertile years.
The indicators of total cohort fertility available in Hungary do not show the kind of variability observed for period fertility. The lowest currently available total cohort fertility rate is observed among women born in the 1940s (around 1.87); the equiva-lent indicators for women born later show a (very slowly) increasing trend. The analy-sis, however, cannot extend to the generation of women born later than the early 1960s, and it remains to be seen whether younger generations will have a similarly high number of children at the end of their fertile period.
Labour supply and childbearing. The most significant item in the costs of childbearing and child rearing is the loss of the mother’s labour income (opportunity cost), the size of which is determined by the employment rate and the labour wages of women. In recent literature, however, there has been some debate as to whether the relationship between women’s employment and fertility is positive or negative. Some researchers argue – on the basis of correlation analyses of cross-section and macro-level data – that since the late 1980s the negative relationship predicted by the theory has been reversed (Ahn and Mira, 2002; Rindfuss, Guzzo and Morgan, 2003; Billari et al., 2002; Del Boca et al., 2003; d’Addio and d’Ercole, 2005). This is often interpreted as evidence of a cause and effect relationship between the two factors. Other empirical studies come to the conclusion – through time-series analyses of aggregate data and analysis of individual-level data – that the relationship continues to be negative but has become weaker over the period in question (Engelhardt, Kögel and Prskawetz, 2001; Engelhardt and Prskawetz, 2002; Kögel, 2004, 2006). This phenomenon is largely attributed to public programmes, and especially to developments in the sphere of maternity leave, the expansion of childcare facilities outside the home and the flexibility of labour markets. An increase in the labour market participation of women, therefore, can hardly be expected in itself to lead to an increase in fertility; but the introduction of a third factor does appear to make it possible for them to grow concurrently. This factor would include the availability of childcare facilities outside the home – so long as the cost of such childcare remains lower than the real income gain attainable by women workers, or if public funds are used to reduce the cost.
The potential influence of public programmes on fertility
The countries of the European Union do not traditionally employ government measures to influence childbearing decisions. Some countries (e.g. France, Sweden and the former state-socialist countries) did exploit the potential of financial and non-financial incentives for a long time (and some continue to do so), but very few of these were targeted specifically at encouraging fertility (although almost all the
the most significant item in the costs of childbearing and child rearing is the loss of the mother’s labour income. the negative correlation betWeen fertility and Women’s labour supply has not been reversed, but it has declined in strength.
options are being sought in the eu, With increasing openness, to reverse or sloW the negative trend in fertility.
TÁRKI EUROPEAN SOCIAL REPORT TÁRKI EUROPEAN SOCIAL REPORT
211. DEMOGRAPHIC PROCESSES
countries maintain an institution system that can have this effect). In recent years, this attitude of non-intervention appears to have shifted, and even EU-wide options are being sought with increasing openness to reverse or slow the negative trend in fertility – in part as a form of public investment in human capital (EC, 2007a). The question that must be asked is whether public programmes are a suitable means by which to influence decisions of fertility and, if so, what combinations of policies are the most efficient.
The theoretical framework for investigating the effects of public programmes on fertility is provided by models of economics. In the economics literature, children typically appear in models of childbearing decisions in either of two ways: as consumption goods (Becker, 1960, 1981) or as capital goods (willis, 1979; Cigno, 1993). while econometric studies investigating the effects of family support programmes on fertility use the consumption model, the capital model is typically used as the framework for analyses of the effects of the pension system on fertility.
The results of empirical studies using econometric models to investigate the fertility effects of public programmes related to child rearing indicate that approaches based on micro-level, rational decision processes appear to make the right predictions with regard to the positive effects. The variables capturing the cash provision programmes of family support systems invariably have a positive and statistically significant effect on the factors of fertility behaviour in most of the cases. The empirical literature is summarized in Gauthier and Hatzius (1997), Sleebos (2003), Del Boca et al. (2003), d’Addio and d’Ercole (2005), and Björklund (2007). The results further indicate that the impact of cash benefits is not particularly strong. The redistribution of incomes – directly or indirectly – targeting families in the developed world is only one of several factors contributing to childbirth, and it offers governments only a relatively limited option in their efforts to influence fertility.
As we mentioned above, micro-economic theory projects a negative relationship between women’s labour market participation and fertility. Assuming that labour market participation affects childbearing decisions, the negative relationship is primarily attributed to the fact that the mother’s labour supply prior to childbirth substantially raises the costs of child rearing due to the loss of labour income and the decline in human capital caused by the mother’s subsequent absence from the labour market.
For this reason, a programme that helps resolve the work–family conflict and achieve a work–life balance is one of the main objectives of policy making. The most frequently recommended policy combinations in this context echo the practices of the Scandinavian countries: the development of childcare facilities outside the home, the encouragement of flexible working conditions and the development of a well-designed parental leave system (e.g. Del Boca et al., 2003).
An analysis of data from Hungary was carried out by Gábos, Gál and Kézdi (2005). The results reveal that over the past five decades the effect on fertility of cash benefits to support families in Hungary has been positive. Bálint and Köllő (2008) find that the elements of the Hungarian family support system that are related to maternity (childbirth leave, cash benefits to mothers) act as a major disincentive to mothers’ labour market participation. As a result, while the employment rate among Hungarian women roughly corresponds to the OECD average, the activity rate among mothers with young children is one of the lowest.
empirical studies reveal that financial support programmes for families invariably have a positive effect on fertility, and this effect generally reaches statistical significance, but the impact of such programmes is limited.
the most frequently recommended policies are: the development of childcare facilities outside the home, the encouragement of flexible Working conditions, and the development of a Well-designed parental leave system

22 1. DEMOGRAPHIC PROCESSES
TÁRKI EUROPEAN SOCIAL REPORT TÁRKI EUROPEAN SOCIAL REPORT
1.2.2. Mortality
Trends and forecasts
In the decades following the war, mortality trends diverged across the regions of Europe. There were pronounced differences in life expectancy at birth between the relatively highly developed countries of Northern Europe and the less highly developed countries of Southern and Eastern Europe, though the differences were substantially reduced in the course of the 1950s and 1960s. The improving trend in mortality came to a halt in the sixties, but resumed in the seventies. Some of the western and Southern European countries closed the gap on Northern Europe in this period. Mortality trends in Eastern Europe, however, showed a different pattern. From the seventies onwards, life expectancy at birth stagnated or decreased in most of the countries with state-socialist regimes, including Hungary (Meslé, 1996).
In Hungary, the rise in life expectancy at birth experienced in the late 1960s came to a halt in the early 1970s, as was the case with most other state-socialist countries. The improving trend in mortality among the female population appeared to end, and mortality among men showed a clear deterioration. From then on, the gap between Hungary and the more highly developed countries (and countries with a developed health awareness) gradually widened with respect to life expectancy (Józan, 2002). The life prospects of the Hungarian population started improving again in the mid-1990s.
Across the EU countries, the average life expectancy at birth among men rose from 69.8 years in 1980 to 75.3 years in 2004 (Figure 1.4). The corresponding indicator for women shows an increase from 76.8 to 81.5 years over the same period (Figure 1.5). The difference between the average life expectancy of men and women fell somewhat in the same period (from 7 to 6.2 years). Life expectancy at birth continues to be substantially higher in the old member states of the EU (76.4 years for men and 82.2 years for women) than in the countries that joined in 2004. At the time of their birth, men can expect to live for 70.1 years and women for 78.3 years in the EU-10. The difference between the life expectancies of the two sexes is even more pronounced in this group than among the old EU members (8 years compared to 5.8 years).
In 2004, the population (men and women) of the Baltic states had the lowest average life expectancy at birth of all the EU countries. Among men, the figures for Latvia (64.9 years), Estonia (65.5 years) and Hungary (68.5 years) are the lowest, while the highest average life expectancies at birth are to be found in Sweden (78.1 years) and Spain (76.6 years). women have the lowest life expectancies in Latvia (76.2 years), Hungary (76.8 years) and Estonia (76.9 years) and the highest life expectancies in Spain (83.4 years), France (83.4 years), Italy (83.2 years) and Sweden (82.4 years).
A further increase in life expectancy at birth is forecast until 2050. There is no agreement among demographers, however, as to the rate and extent of the increase. Some experts predict a continuing rate of two years’ increase per decade in life expectancy at birth, while others argue that the improvement in life expectancy at birth will slow down when a biological limit has been reached (EC, 2007a).
life expectancy at birth continues to be loWer in the neW member states of the eu than in the old member states.
the increasing trend in life expectancy at birth is projected to continue in the countries of the eu; a greater improvement is expected in the neW member states, Which Will result in a slight narroWing of the gap betWeen them and the old member states by the year 2050.

TÁRKI EUROPEAN SOCIAL REPORT TÁRKI EUROPEAN SOCIAL REPORT
231. DEMOGRAPHIC PROCESSES
Nevertheless, the differences between the EU countries – as well as a comparison with non-EU countries – suggest that there is room for improvement. Past projections issued by official sources have tended to underestimate the increase in life expectancy, which is a risk that must be taken into consideration when interpreting current estimates (EC, 2006a).
Eurostat forecasts put men’s average life expectancy at birth 6.4 years higher, at 81.8 years in 2050; and the corresponding estimate for women sees an increase of 5.4 years to 86.9 years. However, significant differences are predicted between the various EU countries in terms of the expected improvement in longevity. Forecasts project that the greatest improvement will be in the new member states among both men and women. In the countries of the EU-15, men and women born in 2050 can expect to live respectively 5.9 and 5.2 years longer than those born in 2004. The corresponding figures are 8.6 and 5.9 years in the new EU countries. The greatest increase in men’s life expectancy is projected for Hungary (9.6 years) and the Baltic states (9–9.4 years), while women’s life expectancy is predicted to show the most improvement in Hungary (6.6 years). The gap between the new and the old EU countries is consequently expected to narrow by 2050, though it will not be completely closed.
From the point of view of economic policy, it is important to note that the projected increase in life expectancy up to 2050 is largely attributable to improving old-age mortality. This can be seen in the rising life expectancy in old age. In the countries of the EU-25, 65-year-old men can expect to live for a further 15.9 years, and women of the same age have a life expectancy of 19.5 years (data from 2004). The gap between the life expectancies of men and women is clearly greater at birth due to differences in mortality rates at a young age (infant mortality is well known to be higher among boys).
Differences between the old and the new EU members can also be observed in life expectancy at the age of 65. In the new EU countries, 65-year-old men have an
Figure 1.4: Life expectancy at birth in the European Union by country, men (years)
Source: Eurostat
Note: The data projected for 2050 are provided by Europop 2004, Baseline. The abbreviation MT refers to Malta.
a substantial share of the future rise in life expectancy at birth Will be due to improvements in old-age mortality.

24 1. DEMOGRAPHIC PROCESSES
TÁRKI EUROPEAN SOCIAL REPORT TÁRKI EUROPEAN SOCIAL REPORT
average life expectancy of 13.5 years, and the corresponding figure is 17.2 years for women. In the EU-15, their life expectancies are 16.3 and 19.9 years, respectively. In 2004, men of this age could expect the shortest life spans in Latvia, Estonia, Slovakia and Hungary (13.1 years) and the longest life spans in France, Spain, Italy and Sweden. women aged 65 years have the worst prospects in Slovakia, Latvia and Hungary (16.7 years) and the best prospects in France, Spain and Italy.
The forecasts for 2050 suggest an increase of 4.6 years in the average life expectancy of 65-year-old men and an increase of 4.4 years for 65-year-old women in the EU. This means that in 2050 men and women of this age can expect to live for a further 20.5 and 23.9 years, respectively. The gap between the two sexes is predicted to be smaller at this age, compared to life expectancies at birth. The expected rate of improvement in the longevity of the 65-year-old population varies from country to country. In the countries of the EU-10, men can expect a greater improvement (5 years) than in the countries of the EU-15 (4.4 years), while the reverse is predicted for women. Compared to 2004, an increase of 4.4 years is projected for women aged 65 in the EU-15 group, and a rise of 4.1 years in the EU-10.
An important issue to consider is the portion of the expected life span that is spent in good health. The length of this period determines whether older populations have the capacity to remain active in the labour market. Depending on how ‘good’ health is defined, the measure of a healthy life span can be established in a variety of ways (Eurostat and the world Health Organization approach this issue in different ways). According to the Eurostat data for 2003, men in the old EU countries can expect to have 65 and women 66 healthy years of life.6 The longest period of good health among men is measured in Italy (71 years). Hungarian men, by contrast, can
6 The figures represent the values of the HLy (Healthy Life Expectancy) structural indicator, which are based on the measurement of health-related limitations in everyday activities.
Figure 1.5: Life expectancy at birth in the European Union by country, women (years)
Source: Eurostat
Note: The data projected for 2050 are provided by Europop 2004, Baseline.
the number of years expected to be spent in good health is an important indicator of quality of life. men can expect 65 and Women 66 healthy years of life in the old eu member states.

TÁRKI EUROPEAN SOCIAL REPORT TÁRKI EUROPEAN SOCIAL REPORT
251. DEMOGRAPHIC PROCESSES
only expect to have 54 healthy years.7 The indicators for women show the best quality of life in Italy (74 years), Spain, Cyprus and Austria (70 years), and the worst in Finland (57 years), Hungary (58 years) and the Netherlands (59 years).8
The determinants of mortality trends
we have shown that a wide gap can be observed between the old and the new EU member states in terms of life expectancy at birth. As is noted in a report by the European Commission, a substantial part of this difference is attributable to prevent-able or treatable mortality. The report labels as preventable mortality those causes of death that can be avoided by effective intervention (e.g. lifestyle factors and acci-dents), while treatable mortality covers cases for which effective medical treatments are available (EC, 2007a).
There are considerable differences between the various socio-demographic groups with respect to life expectancy. As is indicated by the data presented above, the difference between the life expectancies of men and women is striking. The male population born in 2004 can expect to live for 6 years less than the female population, but it is predicted that the gap between the sexes will have narrowed by 2050. The lower mortality risk for women is, however, accompanied by a higher risk of old-age disability (EC, 2007a).
Life expectancy at birth is also related to educational attainment. The UN reports that, in the developed world, educational attainment is a good predictor of the morbidity and mortality figures that apply to individuals (and their households) (UN, 2003). The data further indicate that, in the countries of Europe, the number of years of schooling does not affect the mortality figures for the two sexes to the same extent as in the United States of America. The returns to education measured in years of life are higher for men than for women. The gains – in years of life – to staying at school longer show significant differences between the sexes in Denmark, Hungary and Sweden (SSO, 2005).
Klinger’s (2001) study reveals that differences in mortality attributed to educational attainment have increased over the past 30 years among the population of Hungary. The excess mortality among people with less than 8 years of schooling has displayed an especially strong increase, while the relative position of people with higher education has improved significantly. Both trends have been observed for both sexes, but the effect is substantially stronger for men.
7 Note that Hungary is the only former socialist country for which data are available. 8 www.euphix.org/object_ class/euph _ health _ expectancy.html
life expectancy at birth shoWs variation betWeen social groups With different educational attainments, as Well as betWeen the sexes. education is a good predictor of individual (and household) mortality in the developed countries.

26 1. DEMOGRAPHIC PROCESSES
TÁRKI EUROPEAN SOCIAL REPORT TÁRKI EUROPEAN SOCIAL REPORT
1.2.3. Migration
The third important determinant of demographic change is international migration. A number of European countries that were formerly sources of migration became host countries in the second half of the 20th century. The exact number of migrants in Europe is unknown, in part because the statistical records of several countries register nationality rather than the place of birth (country), thus making it impossible to identify first-generation immigrants once they have obtained citizenship (EC, 2007a).
For the year 2005, the UN has estimated that there are approximately 40 million migrants in the EU-27 member states.9 Around 3 per cent of migrants are estimated to be refugees. Migrants make up 8.3 per cent of the total population of the European Union. In 10 of the member states, the proportion of people born abroad exceeds 10 per cent. The highest concentrations are found in Luxembourg (37.4 per cent), Latvia (19.5 per cent), Estonia (15.2 per cent), Austria (15.1 per cent) and Ireland (14.1 per cent) (EC, 2007a).
Most of the international migration flow to the European Union targets the countries of the EU-15. All of the 15 old EU member states have now become host countries, including Greece, Ireland, Italy and Spain, which were typically the origins of migration flows before (Monnier, 2004). The new member states attract considerably fewer migrants. The EU-10, therefore, is overall characterized as a source region. Among the new member states, Latvia, Lithuania, Poland and Slovakia had a negative annual migration balance in 2004.
The EU is expected to remain a significant target for migration over the next few decades. Eurostat forecasts10 estimate the cumulative rate of net migration to be around 40 million people over the period between 2004 and 2050 (EC, 2006a). It should be noted, however, that migration forecasts are to be treated with some caution.
The number of immigrants living in Hungary was estimated to be 316,000 in 2005. These immigrants typically come from the Hungarian-populated regions of neighbouring countries, and the great majority of them are of Hungarian ethnicity. Annual net migration amounted to around 15,000 in 2005 (EC, 2006a). Assuming a similar migration rate projected up to the year 2030, and a net positive migration balance of around 20,000 after 2030, the cumulative net immigration figure will reach 800,000 in the period between 2004 and 2050 (EC, 2006a).
9 The number of immigrants is insignificant in Romania and Bulgaria.10 According to the scenario put forward by the Ageing working Group (AwG) working with
the European Policy Committee of the European Commission.
due to constraints regarding statistical data collection, the data on migration phenomena are unreliable. the share of migrants in the total population of the eu is 8.3 per cent.
With regard to migration, the eu is considered to be a ‘host’ overall. Within the eu, the old member states have a positive immigration balance, and the eu-10 a negative one.
TÁRKI EUROPEAN SOCIAL REPORT TÁRKI EUROPEAN SOCIAL REPORT
271. DEMOGRAPHIC PROCESSES
1.3. The socio-economic consequences of demographic processes
1.3.1. Population decline and population ageing
As a result of the trends detailed above (sustained low, sub-replacement fertility, increasing life expectancy), the population of the EU is expected to decline and become significantly older. That is, the share of relatively old cohorts in the population is predicted to grow, and the average age to rise. As well as presenting the trends of population decline and ageing, we will discuss the constraints and the options available to migration policy in its efforts to alleviate the negative effects.
The population of the EU (formerly EEC) has increased in the 50 years since its foundation. This population growth is primarily a result of successive expansions (the admittance of new member states), while demographic processes (fertility, mortality and migration) have had a substantially weaker contribution (Monnier, 2004). In the past, population growth was mainly driven by natural growth (the difference between the number of births and deaths), while nowadays the main cause is immigration (Monnier, 2004). Several EU countries (Germany, Greece, Italy) experienced an increase in their population in 2004 purely due to immigration (net immigration flow was greater than natural decline). Among member states, only France, the Netherlands, Finland and Ireland have natural growth rates that exceed net migration rates (SSO, 2005).
The population of the EU is expected to grow from 457 million people in 2004 to 470 million in 2025, and this is then expected to be followed by a decreasing trend, leading to a population of 454 million people in 2050, which amounts to a decline of 1 per cent over the whole of the period. The Eurostat forecast predicts population growth in some member states and significant decline in others. The greatest increase is projected for Luxembourg (42 per cent) and Ireland (36 per cent). A less marked growth (8–13 per cent) is expected in Sweden, the United Kingdom, France and the Netherlands. The projections indicate a substantial decline in the population of Germany, Greece, Italy and Portugal among the old member states. while the population of the countries of the EU-15 is expected to have grown by 1 per cent by 2050, that of the new member states is predicted to decrease by 12 per cent (EC, 2006a). Each of the former socialist countries is expected to experience a significant decline in population.
In Hungary, a greater number of deaths than births have been registered in every year since 1981. The natural decline amounted to 31,700 people in 2006. However, owing to the country’s positive migration balance, the overall decline in population was smaller than that. Eurostat projects a 12 per cent decline in the population of Hungary over the period between 2004 and 2050, with an anticipated population of 8.9 million people at the end of the period. A similar rate of population decline is predicted for some other former socialist countries, including Slovakia, Poland and the Czech Republic.
While, in the past, population groWth Was mainly driven by natural groWth, immigration is the most important factor at present.
a slight decline is projected in the population of the eu by 2050. While the population of the eu-15 countries is predicted to remain static, that of the neW member states is expected to decline by 12 per cent by the year 2050.

28 1. DEMOGRAPHIC PROCESSES
TÁRKI EUROPEAN SOCIAL REPORT TÁRKI EUROPEAN SOCIAL REPORT
Trends in population ageing
The expected shift in the age composition of the population will have a significantly greater effect on the economy than will population decline. The decreasing trend in fertility and the continuing rise in average life expectancy at birth result in population ageing. This trend is a feature of every member state, although there are differences in degree.
Let us start by looking at the age pyramids of the EU population. The pyramids reveal the development of demographic processes over time, as well as the composition of the population by sex and age. The pyramids of both old and new member states characteristically taper towards the bottom, i.e. the size of the youngest cohorts is strikingly small. This is a consequence of the fall in fertility. The age structure of the old and the new member states differs in that, while the age pyramid of the old member states widens at a single age group (specifically the group of people born at the time of the baby boom following world war II), where a large cohort is to be found, the age pyramid of the new member states bulges in two places – for people born in the periods from 1946 to 1955 and from 1972 to 1990 (SSO, 2005). Demographic projections suggest that the age structure of the EU in 2050 will most resemble an upside-down pyramid, reflecting the baby boom generation entering retirement age, the rise in life expectancy and the persistently low fertility rate.
The new member states have a considerably younger population than the EU-15 countries. The median age is 40.3 years in the old EU countries – i.e. half of the population is aged over 40.3 years – as opposed to 37.4 years in the new member states. The ‘oldest’ countries in the European Union are Italy and Germany, while Ireland, Cyprus, Slovakia and Poland are among the ‘youngest’ states. Across the whole of the EU, the median age is expected to rise from 39 years in 2004 to 49 years in 2050. The current age advantage of the new member states is expected to persist until 2035 (SSO, 2005).
The dependency ratio of the old-age population – the ratio of the inactive population aged 65 and over to the working-age (15–64-year-old) population – stood at 24.5 per cent for the EU in 2004. This means that there are currently four active-age people to every person of 65 years and over. The highest old-age dependency ratios are observed in Italy (28.9 per cent), Germany (26.8 per cent), Sweden (26.4 per cent) and Belgium (26.1 per cent), while the lowest ratios are found in Slovakia (16.3 per cent), Ireland (16.4 per cent) and Cyprus (17.5 per cent). This indicator also reveals a significant difference between the EU-15 (25.5 per cent) and the EU-10 (19.6 per cent) countries.
The old-age dependency ratio in the EU is projected11 to have doubled to 51.4 per cent by 2050, meaning that there will be only two active-age people, rather than the current four, to every individual aged 65 and over. The forecasts predict a deterioration in the dependency ratio of each of the member states, although differences are expected in the degree of change. Spain and Ireland are expected to experience the highest rate of increase in the ratio between 2004 and 2050, and Sweden and Luxembourg the lowest rate. The gap that is currently to be observed between the
11 AwG scenario.
population ageing is a feature of every eu member state, although there are differences of scale.
the populations of the neW member states are younger than those of the old member states, and this age advantage is predicted to remain until 2035.
the current old-age dependency ratio of 24.5 per cent is expected to have doubled by 2050 in the eu.

TÁRKI EUROPEAN SOCIAL REPORT TÁRKI EUROPEAN SOCIAL REPORT
291. DEMOGRAPHIC PROCESSES
countries of the EU-15 and those of the EU-10 is predicted to have effectively disappeared by 2050: the former group can expect an old-age dependency ratio of 51.6 per cent, and the corresponding figure is predicted to be 50.4 per cent for the latter group (EC, 2005).
Let us take a closer look at the development of the size of major age cohorts. The forecasts predict a decline in the young (0–14-year-old) population and a significant increase in the population of an advanced age (65 years and over). The size of the working-age population (aged 15–64 years) will increase up to 2010, and this will be followed by a downwards trend.
The young population (14 years and under) of the whole of the EU is expected to decline by 18 per cent from 2004 to 2050. A decrease of 15 per cent is projected for the old member states, compared to a decrease of 30 per cent for the new member states. The dependency ratio of young people – the ratio of the young population to the working-age population – is predicted to rise slightly from the current 24 per cent to 26 per cent in the countries of the EU-25. The child dependency ratios are expected to show greater variation among the new member states than among the EU-15 countries, but the figures for the former will remain lower than those for the latter through to 2050.
The predicted declining trend in the working-age (15–64 years) population is expected to start around 2010. The extent of the decline between 2004 and 2050 is estimated to amount to 16 per cent. Those countries that have recently joined the EU can expect a greater decline (27 per cent) than the old member states (13 per cent). According to the forecasts, the population of working-age people will have fallen by a quarter by 2050.
A dramatic spike is expected in the number of people aged 65 and over in the period to 2050. The size of this age cohort will increase by 77 per cent in the EU-25, 75 per cent in the EU-15 and 88 per cent in the EU-10 from 2004 to the middle of the century. The population of people aged 80 and over will display the steepest rise: the size of this group will be 174 per cent greater than it is at present. The growth is expected to reach 172 per cent in the old member states of the EU and 193 per cent in the new member states.
In Hungary, the old-age dependency ratio has been on the increase since the 1990s, i.e. the ratio of the population aged 65 and over to the working-age population is steadily rising. The old-age dependency ratio was 22.6 per cent in 2004 and is projected to reach 48.3 per cent by the middle of the century.
The options for migration policy in mitigating negative effects
The negative trends presented above may be counteracted by migration to the member states from outside the European Union. Since immigrants are generally assumed to be younger than the population of the host country, immigration flows can have a favourable impact on the age structure of the population: an increase in the number of working-age people improves the dependency ratio. In fact, as long as the retirement age remains unchanged, immigration flow may be the only means
the size of the young population (aged under 14) of the eu is predicted to have fallen by 18 per cent by the year 2050, While the number of old people (aged 65 and over) is expected to have risen by 77 per cent.
migration originating outside the eu is thought to sloW doWn the process of population ageing and dampen its adverse effects.

30 1. DEMOGRAPHIC PROCESSES
TÁRKI EUROPEAN SOCIAL REPORT TÁRKI EUROPEAN SOCIAL REPORT
of improving the dependency ratio in the short to medium term. Also, immigration may have an impact on the future dynamics of population growth, as it is a feature of migrants that they have different (typically higher) fertility rates than the population of the host country (RAND Europe, 2004).
There is some disagreement among experts, however, on the supposed positive effects of migration. Some researchers argue that an unprecedented degree of mi-gration flow would be needed to counterbalance the ageing of the population (Lesthaeghe, Page and Surkyn, 1988). And ours is an age when immigration policies are typically aimed at curtailing the number of new immigrants into Europe. A number of studies have further shown that immigration flows only have a minor effect on the age composition of the host country (see e.g. Mitra, 1990; Le Bras, 1991). Immigrant populations have lower rates of employment than are typical of the host country. Economically active immigrants eventually grow old and gain pension entitlement (EC, 2006a). Thus, even if the large-scale migration of working-age groups was viable, it is debatable whether this would not simply defer the problem of population ageing to a later time (RAND Europe, 2004). Migration from outside the EU is likely to be a partial – and temporary – solution to the problem of counter-balancing the effects of low fertility and rising life expectancy on the age structure of the population. The effectiveness of migration as a strategy against population ageing is, nevertheless, highly dependent on the success of national governments in delivering appropriate immigration policies (RAND Europe, 2004).
Polónyi and Timár (2002) estimate that the current positive migration balance of 14–15,000 people would need to increase to about 20,000 from the year 2000 to 2050 in order to satisfy the labour demand of the Hungarian labour market. with a positive migration balance of this size, the ratio of the economically active population would increase by around 6 to 7 percentage points (approximately 600,000 people) by the end of the next decade.
1.3.2. Social and economic consequences
Consequences for the labour market
The adverse effects of population ageing on the labour market are expected by the European Commission and the Economic Policy Committee to surface in the countries of the EU in 2018. The decline in the working-age population is expected to start earlier (from about 2010), when the baby boom generation enters retirement. The effects of the decline will be delayed, however, by the expected increase in employment rates. The employment rate in the EU-25 is projected to rise from 63 per cent in 2004 to 67 per cent in 2010 and 70 per cent in 2020. The EU will thus achieve the Lisbon target for the employment rate in 2020. The projected overall increase in employment is attributable to two major factors: the trend towards having more women in the workplace is the primary cause, and the trend towards having more elderly people in employment is the secondary cause.
a great volume of migration floWs Would be needed to counterbalance population ageing, and even that could only constitute a partial – and temporary – solution to the problem of population ageing.
the negative labour market effects of population ageing are predicted to be temporarily counteracted by an expected expansion in employment, Which Will result from an increase in Women’s employment and in employment among older people.

TÁRKI EUROPEAN SOCIAL REPORT TÁRKI EUROPEAN SOCIAL REPORT
311. DEMOGRAPHIC PROCESSES
The employment rate among women is expected to rise from 55 per cent in 2004 to 65 per cent in 2025, due to a tendency for the population of older women with a low rate of employment to be gradually replaced by a more highly educated generation of younger women. The trend is expected to mean that the Lisbon target of an employment rate of 60 per cent among women by 2010 will be met.
The second factor that will contribute to the projected overall increase in em-ployment is that the employment rate among the elderly is predicted to increase from the 40 per cent measured in 2004 to 47 per cent in 2010 and then 59 per cent in 2025. (If the projection is correct, the Lisbon target of 50 per cent will be achieved in 2013.) The rising trend in employment among older people (aged 55–64) – which started in 2000 – signals a reversal of the decades-long trend of early retirement from the labour market. Older workers are currently responsible for three-quarters of the increase in the employment rate of the EU. About half of the projected growth in employment can be attributed to the positive effects of the pension system reforms introduced thus far, which have tightened up on early retirement and provided incentives for old-age workers to remain in the labour market (EC, 2007a).
Three phases of future development can be distinguished with regard to the effects of population ageing on the labour market. First, in the period up to 2011, the size of the working-age population is expected to grow and employment rates are expected to rise, which is good for economic growth. This favourable period opens up the way to structural reforms. The expansion of employment can counterbalance the decline in the working-age population brought about by the retirement of the baby boom generation, which will be replaced by the much smaller population of the next generations. Thus second, the total number of people in employment will continue to increase, albeit at a slower rate. An increase of about 20 million is projected in the number of people in employment over the period from 2004 to 2017. Third, this is expected to be followed by a phase when the ageing of the population is the dominant factor. The overall employment rate will start falling. It is predicted that the total number of people in employment will have fallen by about 30 million by the end of the period from 2017 to 2050 (EC, 2007a).
Productivity and economic growth
The fact that older workers make up an increasingly large share of the labour force does not necessarily give rise to lower productivity. The available data do not support the hypothesis that older workers are less productive or less innovative. Physical and mental capacities do not start declining until a more advanced age, and anyway the decline is gradual, shows considerable variation across individuals, and can be slowed with the help of preventive health programmes. The general improvement in educational attainment has a major impact on productivity, which can, in the long term, compensate for reduced productivity due to ageing (EC, 2007a).
An improvement of 1.3 per cent is expected in labour productivity between 2004 and 2010, 1.8 per cent between 2011 and 2030, and 1.7 per cent between 2031 and 2050 in the countries of the EU-15. In the EU-10, the level of improvement is predicted
the total number of people in employment is expected to start declining around 2017.
improvements in educational attainment can compensate for the productivity-reducing effects of population ageing in the long term.

32 1. DEMOGRAPHIC PROCESSES
TÁRKI EUROPEAN SOCIAL REPORT TÁRKI EUROPEAN SOCIAL REPORT
to be higher: 3.6 per cent on average for the period between 2004 and 2010, 3.1 per cent for the years between 2011 and 2030, and 1.9 per cent between 2031 and 2050.
Taking account of the above trends in employment and the assumptions concerning productivity, a decline is to be expected in the potential GDP growth rate. Forecasts by the Economic Policy Committee and the European Commission predict that the annual average potential GDP growth rate of 2.4 per cent over the period between 2004 and 2010 will drop to 1.2 per cent between 2031 and 2050, assuming no changes in current trends and policies. In the old member states, the annual average potential GDP growth rate of 2.2 per cent in the period from 2004 to 2010 is projected to decrease to 1.3 per cent for the period between 2031 and 2050. A considerably steeper drop – from 4.3 to 0.9 per cent – is expected in the EU-10 countries, partly on account of their less favourable demographic prospects.
The sources of economic growth will be drastically restructured. As the increase in the level of employment stops, the enhancement of productivity will become the primary source of GDP growth. If the future development of productivity and the employment rate fail to correspond to the forecasts, the potential GDP growth rate may plunge to a level even lower than predicted (EC, 2006a).
The effects of future demographic changes on economic growth have recently been estimated in growth models, too (Prskawetz et al., 2006). The researchers investigated the following five separate scenarios: 1) the baseline scenario; 2) the baseline scenario focusing on the effects of migration, with zero migration assumed; 3) the scenario analysing high fertility; 4) the scenario with a maximized number of young people, assuming low life expectancy; 5) the scenario with a maximized number of old people, assuming low fertility and high life expectancy. The outcome of the model estimations can be summarized briefly as follows. The general long-term trend shows a decrease in growth rates, primarily due to the ageing of the population. The high fertility variant (Scenario 3) indicates a growth rate after 2030 that is 0.2 per cent greater than that of the baseline scenario. The scenario with the maximum number of young people (Scenario 4) results in a growth rate that is 0.3 per cent higher. The variant of zero migration (Scenario 2) leads to 0.4 per cent lower growth rate. Finally, Scenario 5, with the maximum number of old people, effects a reduction of 0.5 per cent in the growth rate compared to the baseline. In general, the negative effects of ageing and/or of less migration on GDP growth are greater than the positive effects of higher fertility and younger age structure (EC, 2007a).
welfare spending
Long-term forecasts suggest that population ageing – with current policies left as they are – will lead to a substantial increase in public expenditure by 2050 in most EU countries. A large proportion of the expected increase is made up of pensions, health and long-term care costs. The effects of ageing on public expenditure will be clearly felt in most member states from 2010 onwards. The most significant increase in public spending is projected to occur in the period between 2020 and 2040.
There may be considerable variation from country to country in terms of the costs of population ageing. Public expenditure is expected to rise by about 4
the negative effects of population ageing and/or reduced migration floWs on gdp groWth are greater than the positive effects of higher fertility and a younger age structure.
population ageing results in a substantial increase in public costs. this is expected to have the greatest impact betWeen 2020 and 2040.

TÁRKI EUROPEAN SOCIAL REPORT TÁRKI EUROPEAN SOCIAL REPORT
331. DEMOGRAPHIC PROCESSES
percentage points between 2004 and 2050 in the EU-15 countries and in the entire Eurozone. A smaller, 1.5 percentage-point, increase is projected for the states of the EU-10, but this is primarily because a drastic reduction is expected in the pension expenditure of Poland, following pension reform. with Poland excluded, the public costs of population ageing will increase by more than 5 percentage points of GDP in the EU-10.
Public pension expenditure is predicted to rise in each of the EU-15 countries – with the exception of Austria, where a reform process was initiated in 2000. Italy and Sweden can expect a slight increase in the cost of pensions; the majority of EU member states are likely to experience a relatively modest rise (1.5 to 3.5 percentage points); while Ireland, Spain, Luxembourg and Portugal are predicted to see a much greater increase – of 6.4 to 9.7 percentage points.
In the EU-10 countries, public spending on pensions is expected to fall by 1 per cent of GDP between 2004 and 2030. This will be followed by an increase of 1.3 percentage points, resulting in a total average increase of 0.3 percentage points from 2004 to 2050. The various countries, however, are expected to display fairly divergent trends. while Poland is likely to experience a decrease of 5.9 percentage points of GDP, an increase of 6.7 percentage points is projected for Hungary, 7.3 percentage points for Slovenia and 12.9 percentage points for Cyprus. These figures class Cyprus, Slovenia and Hungary with the EU countries expected to face the greatest challenge (EC, 2006a).
It is a highly complex task to project the healthcare expenditure of the central budget in the long term, partly because it is difficult to predict the development of major demographic and non-demographic factors with reasonable confidence. It seems clear, however, that the advancing age of the population will put more pressure on the healthcare budget and will increase costs. The forecasts12 suggest that healthcare expenditure will increase by 1 to 2 per cent of GDP by 2050 in most member states. The estimates further indicate that the health of the elderly will have a major impact on the development of costs. If the rise in age-specific life expectancy is accompanied by a corresponding increase in the number of healthy years individuals enjoy, the increase in age-related spending could be reduced by as much as 50 per cent. It must also be noted that the estimates of healthcare expenditure are highly sensitive to the income elasticity of demand and to assumptions regarding the development of unit costs (EC, 2006a).
Similarly, an increase is expected in the public costs of long-term care following the steep rise in the size of the population over 80 years of age. Assuming no changes in current policies, the forecasts project an increase of 0.1 to 1.8 percentage points of GDP in public spending by 2050. Public costs are highly sensitive to the incidence of disability among the elderly (EC, 2006a).
12 AwG scenario.
population ageing is manifested in the rising costs of pensions, healthcare and long-term care.

34 1. DEMOGRAPHIC PROCESSES
TÁRKI EUROPEAN SOCIAL REPORT TÁRKI EUROPEAN SOCIAL REPORT
1.4. The mediators of demographic changes: household structure
Processes of population mobility (fertility, mortality and migration), changes in age structure and other demographic processes, such as marriage, cohabitation or divorce all have an impact on household size and household structure (RAND Europe, 2004). In the following sections, micro-level data will be presented in an effort to explore the major features of households of various sizes in the countries of the EU-24. Then we look at households with different generation structures, and finally we examine families with children.
1.4.1. Household size
The total number of households in the EU-15 countries had increased from just over 100 million in 1960 to 190 million in 2001, which clearly shows that the rise in household number (90 per cent) was much faster than the growth in the population (30 per cent). The figures thus indicate that the average size of households follows a declining trend. The average household size of 3.2 people measured in 1960 in the EU-15 had dropped to 2.4 people by 2001 (SSO, 2005).
The falling trend in the number of households is characteristic of each of the EU-15 countries, though significant differences do remain between individual member states in terms of household size. The average number of people living in a household continues to be higher in the countries where the decline in fertility started later, including in Ireland, Portugal, Spain and, to a lesser extent, Greece and Italy. Differences in household size suggest that young people leave the family home at different ages in the various member states, and that there is variation in the living arrangements of old people left by themselves after the loss of a spouse (SSO, 2005).
Single-person households are on the rise. An increasing number of people live alone, although some of them for only a relatively brief period. young people often live by themselves after leaving the parental home until they start a cohabiting relationship. when a cohabiting relationship or marriage breaks up, the result is single-person households – or lone-parent households if there are children. Since women typically live longer than men and typically marry older partners, the majority of single-person households are composed of lone women.
The proportion of single-person households in the EU-15 countries rose from 16 per cent in 1960 to 28 per cent in 2001. This household type constituted 15 to 40 per cent of all households in 2001. The highest proportion was observed in Sweden, followed by Denmark and Finland, while the lowest proportions were measured in Portugal and Spain. The rising number of people living by themselves, together with the decline in the average household size, means that the average size of households with two persons or more will also decrease. This trend can be seen right across the
the average household size of 3.2 people measured in 1960 in the eu-15 countries had fallen to 2.4 by 2001. the declining trend in household size is observed in each of the countries, but significant differences remain betWeen them.
the share of single-person households in the eu-15 countries greW from 16 per cent in 1960 to 28 per cent in 2001. at the same time, the proportion of households With five or more members is on the Wane.

TÁRKI EUROPEAN SOCIAL REPORT TÁRKI EUROPEAN SOCIAL REPORT
351. DEMOGRAPHIC PROCESSES
EU-15: the share of households with five or more people is shrinking in almost every member state.
Household structure is greatly dependent on marriage and childbearing trends. while, in the past, marriage was a precondition of having children, the recent rise in the number of children being born outside marriage indicates that the relationship between marriage and childbearing is looser than it used to be. There is nothing exceptional today about a couple choosing not to marry when they have children – or even later. This is especially true of Austria, Denmark, Estonia, Finland, France, Sweden and the United Kingdom, where the average age of women is in fact lower at their first childbirth than at their first marriage. Relatively late first marriages (at the age of 27 or over) are frequent in Austria, Denmark, Finland, Luxembourg, the Netherlands, Slovenia and Sweden. By contrast, relatively early marriage (at the age of 24 or younger) is the standard in Latvia, Lithuania and Poland (SSO, 2005).
The results of the EU-SILC survey show an average household size of 2.4 people for the year 2004. The highest sizes were observed in Cyprus, Slovakia, Poland, Slovenia and, among the old member states, in Ireland and Spain (2.8–3 people) (see Figure 1.6). At the other end of the scale we find Denmark, Sweden, Germany and Finland (with average household sizes of 2–2.2 people).
The EU-SILC data reveal that the average proportion of single-person house-holds stands at 30 per cent in the European Union. This average figure, however, conceals considerable cross-country variation. Somewhat over four households in ten have one member in Denmark and Sweden. At the other end of the spectrum come Cyprus, Spain and Portugal, where the figure is only about 16 per cent (see Figure 1.7).
the age of marriage and childbirth shoWs different patterns among the eu member states. While in the majority of the eu-15 countries, late marriage is the dominant pattern, in some of the former socialist countries, early marriage continues be prevalent.
the average household size Was 2.4 people in 2004 in the eu.
Figure 1.6: Average household size in the European Union, by country (people)
Source: Authors’ computations based on the EU-SILC (2005) data
the proportion of single-person households ranges from 16 to 43 per cent in the eu.

36 1. DEMOGRAPHIC PROCESSES
TÁRKI EUROPEAN SOCIAL REPORT TÁRKI EUROPEAN SOCIAL REPORT
Large households with at least five members make up less than 7 per cent of all households in the European Union. This type of household is to be found in Poland and Slovakia with far higher than average frequency (14–15 per cent). The likelihood of one, two or more generations living together in large households is discussed in the next section.
Hungary had an average household size of 3.1 people in 1960 and 2.6 in 1990. The EU-SILC data put the household size at only 2.5 people in 2004. Single-person households amount to 29 per cent of all households (1,167,000 households). Barely 8 per cent (approximately 315,000) of households have five members or more.
As the survey results show, 59 per cent of all single-person households in the EU are made up of women. The figures for individual countries vary from 50 per cent (Ireland) to 78 per cent (Slovakia). The new members of the EU have higher than average proportions of women in single-person households (Figure 1.8). One explanation is that the gap between the average life expectancy at birth of men and of women is greater here than in the old member states (8 years as opposed to 5.8 years).
the proportion of households With at least five members is under 7 per cent in the eu.
Figure 1.7: Household size composition in the European Union, by country (%)
Source: Authors’ computations based on EU-SILC (2005) data
some 59 per cent of all single-person households in the eu are made up of Women.

TÁRKI EUROPEAN SOCIAL REPORT TÁRKI EUROPEAN SOCIAL REPORT
371. DEMOGRAPHIC PROCESSES
The elderly (aged 65 and over) account for the largest proportion (about 43 per cent) of single-person households. Once again, there are considerable differences between the countries: the figures for the member states vary between 33 and 67 per cent. we can see that, in some countries, it is not the older cohorts that form the greatest proportion of single-person households: in Denmark, Luxembourg and the Netherlands we find more 25–49-year-olds living in a single-person household than people aged 65 and over (Figure 1.9). Portugal is at the other extreme, with elderly people making up two-thirds of single-person households. There is a higher than average proportion of elderly people among single-person households in each of the new member states.
The age distribution of single-person households is, of course, correlated with their labour market status. On average, 40 per cent of lone people are employed in the EU. Not surprisingly, this figure is higher in Denmark, Luxembourg and the Netherlands, where the majority of lone people are of an active age. The proportion of lone people in employment is, in contrast, very low in Slovakia and Slovenia. In these countries, the majority of single-person households are composed of pensioners or people in early retirement (77 per cent in Slovakia and 71 per cent in Slovenia). There is a markedly high proportion of other inactive people in the Netherlands and Ireland (39 and 37 per cent, respectively, compared to the EU average of 13 per cent).
Figure 1.8: The gender composition of single-person households in the European Union, by country (%)
Source: Authors’ computations based on EU-SILC (2005) data
the elderly account for betWeen 33 and 67 per cent of single-person households in the eu.

38 1. DEMOGRAPHIC PROCESSES
TÁRKI EUROPEAN SOCIAL REPORT TÁRKI EUROPEAN SOCIAL REPORT
The distribution of people living in single-person households in terms of their marital status is very varied in the individual member states (Figure 1.10). Two main groups of countries emerge from the data. In one group, singles (those who have never been married) constitute the largest share of the population of people living alone. This group comprises Austria, Belgium, Germany, Denmark, Finland, France, Ireland, Luxembourg, the Netherlands and Sweden. In the countries belonging to the second group, widows and widowers make up the largest share of people living alone. This class comprises the new member states, Greece, Portugal and, to a lesser extent, Spain and Italy as well. The United Kingdom is in the unique position of having as many divorced or separated people13 represented in the figures as single people. The divorced and the separated also form a higher than average share of single-person households in Germany and Latvia.
The socio-demographic features of single-person households were also analysed separately for men and women. while the greatest share of lone men (45 per cent) belong to the age group of 25–49 years, most lone women (54 per cent) are 65 and over. These figures of course reflect the difference between the sexes in terms of life expectancy at birth. In line with the age differences, women living alone are far less likely to be employed than are lone men. As regards marital status, most men living alone (55 per cent) have never been married, while lone women are more likely to be widowed (42 per cent) than single (31 per cent).
In Hungary, women make up 65 per cent of single-person households. As with the other former socialist countries, 65 and over is the most common age group (49 per cent) among people living in single-person households. As regards marital status, the largest proportion of those living alone (49 per cent) are widowed.
13 The survey offered the categories of ‘divorced’ and ‘separated’ as separate response options. However, as none of the respondents chose ‘separated’ in some of the member states, the two categories are collapsed together in our analysis.
Figure 1.9: Age composition of single-person households in the European Union, by country (%)
Source: Authors’ computations based on EU-SILC (2005) data
the distribution of single-person households by marital status appears to divide the countries into tWo groups. single people dominate in one group, While WidoWed people form the largest share in the other.
the largest share of lone men belong in the age group 25–49 years and have never been married, While the largest share of lone Women are old (65 and over) and WidoWed.

TÁRKI EUROPEAN SOCIAL REPORT TÁRKI EUROPEAN SOCIAL REPORT
391. DEMOGRAPHIC PROCESSES
1.4.2. Generations (not) living together
The transition between traditional and modern societies is accompanied by a process whereby the large family model, i.e. households with several generations living together, is replaced by (nuclear) families of one or two generations. This process is driven by young adults typically leaving the parental home early, even before embarking on a cohabiting relationship. They thus create an independent household either on their own or in a formal or informal cohabiting relationship. The result will be, as was noted in Section 1.3.1, an increase in the overall number of households, and specifically, a higher incidence of single-person and two-person households. A further factor leading to an increased proportion of one-generation households is population ageing, the growing share of old and very old people and their households. The countries of Europe, and the EU member states within them, however, display – at times substantial – differences with respect to the number of generations sharing a household.
Our analysis makes use of a variable (formed using the labels identifying the father and the mother of each household member)14 which shows whether one, two or more generations live in a given household. As can be seen in Figure 1.11, one-generation households account for between 40 and 70 per cent of all households across the 24 EU countries under analysis in 2004. There is a marked difference between the new and the old member states: in the former group, the share of one-
14 The variable classes a household as having one generation if none of its members share the household with their parents. Two-generation households are those where one parent or a parent couple live with children, and a household has more than two generations if at least two hierarchical levels of parents live together.
Figure 1.10: The marital status of people in one-person households in the European Union, by country (%)
Source: Authors’ computations based on EU-SILC (2005) data
the transition betWeen traditional and modern societies is accompanied by a process Whereby the large family model, i.e. households With several generations living together, is replaced by (nuclear) families of one or tWo generations.
the share of one-generation households ranged from 40 to 70 per cent...

40 1. DEMOGRAPHIC PROCESSES
TÁRKI EUROPEAN SOCIAL REPORT TÁRKI EUROPEAN SOCIAL REPORT
generation households does not significantly go above 50 per cent; it is lowest in Slovenia and Slovakia (40 per cent) and highest in the Czech Republic, Estonia (50 per cent each) and Hungary (51 per cent). Among the EU-15 countries, the share of this household type remains below 50 per cent in the Southern European countries and Ireland only, while the figure is well above 60 per cent in Germany, Finland, Sweden and Denmark. Two-generation households are in the majority in Slovenia, Slovakia, Portugal, Cyprus, Ireland and Greece.
Multi-generation households do not exceed 10 per cent likelihood in any of the countries: they account for around 10 per cent in Latvia, 9 per cent in Poland and 6 per cent in Slovenia and Slovakia. The frequency with which this type of household occurs varies greatly between the old and the new member states. Households with three or more generations make up less than 1 per cent of all households in France, Belgium, the Netherlands, Germany and the Northern states.
There are differences in the age composition of households with different num-bers of generations. Our analysis reveals a median age of about 60 years for the members of one-generation households, with relatively little variation across mem-ber states (Tárki–UniCredit, 2008, Figure F1.1). The highest median age is estimated for Greece, Portugal and Slovenia (65 years) and the lowest for Denmark, Finland and the Netherlands (57 years). The lower median value of age is explained by the relatively large share of young one-generation households in the latter group of countries. The data show greater variation for households with two or more generations. In two-generation households, the median age ranges from 24 years (Sweden) to 35 years (Italy, Spain and Greece). The corresponding indicator is even more extended for mul-ti-generation households: 24 years in Denmark but 43 years in Spain.
... While the share of households With three or more generations Was about 10 per cent or less in the eu countries in 2004.
Figure 1.11: Household composition as a function of number of generations in the European Union, by country (%)
Source: Authors’ computations based on EU-SILC (2005) data
people living in one-generation households are significantly older than those living in households With more generations.

TÁRKI EUROPEAN SOCIAL REPORT TÁRKI EUROPEAN SOCIAL REPORT
411. DEMOGRAPHIC PROCESSES
Figure 1.12 displays the age distribution of children living with their parents in the countries of the EU.15 Children of an active age, i.e. over 16 years, are most likely to live with their parents in the new member states and in the Mediterranean countries, where they account for over half of all households with two or more generations. This ratio is highest in Slovenia, Slovakia, Spain and Latvia (60–63 per cent), and lowest in Denmark and Sweden (24 per cent and 28 per cent, respectively).
In Hungary, one generation lives in about half of all households (51 per cent), two generations share a further 45 per cent of households, and only the remaining 4 per cent of households have members of three or more generations. People living in one-generation households in Hungary have a median age of 61 years, those in two-generation households have a median age of 32 years, and the figure is 34 years for multi-generation households. The age distribution of children living with their parents is similar to the pattern observed in Eastern and Southern Europe.
1.4.3. Households with children
The highest frequencies of households with children (40–45 per cent) are to be found in the new member states (Cyprus, Slovakia, Poland, Latvia), Portugal and Ireland, which typically coincide with high frequencies of multi-generation households (Figure 1.13). Correspondingly, the lowest indicators (25–30 per cent) are observed in the United Kingdom, the Scandinavian countries (Denmark, Sweden), Finland and
15 In this analysis, the definition of child is, for obvious reasons, based on family relationships rather than age. It also follows that only two- and multi-generation households are included in the analysis here.
the share of children over the age of 16 living With their parents is highest in the neW member states and the mediterranean countries.
Figure 1.12: Age distribution of children living with their parents in the European Union, by country (%)
Source: Authors’ computations based on EU-SILC (2005) data
the share of households With children is typically highest in countries With a large proportion of multi-generation households...

42 1. DEMOGRAPHIC PROCESSES
TÁRKI EUROPEAN SOCIAL REPORT TÁRKI EUROPEAN SOCIAL REPORT
Germany, where one-generation households have the largest share. In Hungary, a third of all households have members under the age of 18.
Figure 1.13 reveals a U-shaped relationship: the average number of children is highest in the countries where the ratio of households with children is either very small or very large. In Cyprus, Ireland, Slovakia and Poland, a high or relatively high number of children is coupled with a large proportion of households with children, while in the United Kingdom, Denmark, the Netherlands, Belgium and Sweden, it is coupled with a small proportion of this household type.
Households with children have an average number of 1.5 to 2.0 children. The highest average numbers of children are observed in Ireland (1.97 children per household), Belgium (1.89), the Netherlands (1.85), Cyprus (1.86), Luxembourg (1.83) and Finland (1.82); and the lowest for Portugal (1.51), Latvia (1.57) and Greece (1.58). The EU-SILC data put the average number of children in households with children in Hungary at 1.68.
Looking at household composition by household type in the EU member states (Table 1.1) we can see that the categories of ‘two adults with one child’ and ‘two adults with two children’ dominate within the one-third of all households that have children: on average, the two types together account for 62 per cent of all households with children. Lone-parent households represent a further 13 per cent, families with three or more children 10 per cent, and other household types with dependent children 15 per cent.
...While the average number of children is highest in countries With either a very small or a very large share of households With children.
Figure 1.13: Proportion of households with children (%) and average number of children in the European Union, by country (%)
Source: Authors’ computations based on EU-SILC (2005) data
the average number of children in households With children ranges from 1.5 to 2.0.
the most frequent types of household With children are ‘tWo adults With one child’ and ‘tWo adults With tWo children’: the tWo types together make up on average 62 per cent of all households With children.

TÁRKI EUROPEAN SOCIAL REPORT TÁRKI EUROPEAN SOCIAL REPORT
431. DEMOGRAPHIC PROCESSES
CountryLone-parent
household
2 adults with 1
dependent child
2 adults with 2
dependent children
2 adults with 3+
dependent children
Other household type with
dependent child(ren)
Total
AT 11.5 29.3 29.9 11.8 17.5 100.0BE 17.3 27.2 27.8 17.5 10.2 100.0Cy 6.3 20.2 41.3 12.5 19.6 100.0CZ 12.0 28.3 37.6 6.5 15.4 100.0DE 17.0 32.2 32.6 11.0 7.2 100.0DK 19.7 27.1 35.7 14.0 3.5 100.0EE 19.4 31.9 22.4 8.3 18.1 100.0ES 5.1 31.2 32.6 6.8 24.3 100.0FI 15.3 30.5 31.8 17.1 5.4 100.0FR 15.2 29.4 36.6 11.8 7.0 100.0GR 4.9 28.2 48.2 2.7 16.0 100.0HU 14.4 28.1 26.1 10.7 20.8 100.0IE 17.5 19.8 25.7 18.1 18.8 100.0IT 7.6 31.5 34.3 7.5 19.2 100.0LT 14.4 32.1 27.3 8.1 18.0 100.0LU 8.6 27.9 32.5 16.5 14.4 100.0Lv 16.1 30.2 20.4 5.8 27.5 100.0NL 10.3 26.3 37.2 17.8 8.4 100.0PL 6.8 27.5 24.8 10.3 30.6 100.0PT 7.2 37.0 25.9 5.5 24.5 100.0SE 21.7 24.7 33.5 15.1 5.0 100.0SI 9.4 24.4 32.8 7.7 25.7 100.0SK 6.9 22.0 31.0 11.7 28.4 100.0UK 25.8 25.7 28.2 10.6 9.6 100.0
Overall 13.3 29.4 32.2 10.3 14.8 100.0
Looking at the composition of households with children by country, the following observations can be made.
The share of lone-parent households ranges from 5 per cent to 22 per cent. The highest share is measured in the United Kingdom (26 per cent), Sweden (22 per cent), Denmark (20 per cent), Estonia (19 per cent), Ireland (18 per cent) and Belgium (17 per cent). In Greece and Spain, by contrast, the frequency is around 5 per cent, and it still remains under 7 per cent in Cyprus, Poland and Slovakia. Households with two adults and a child are represented in a proportion that is significantly higher than average in Portugal (37 per cent). This category is also above the average of the 24 states under consideration in Germany, Lithuania and Estonia (32 per cent each). In Ireland, Cyprus and Slovakia, by contrast, it makes up only 20–22 per cent of households with children.Households with two adults and two children are represented in higher than average proportions in Greece (48 per cent), Cyprus (41 per cent), the Czech Republic (38 per cent), France and the Netherlands (37 per cent each) and Denmark (36 per cent). The share of such households is substantially below average in Lithuania (20 per cent) and Estonia (22 per cent).
•
•
•
Table 1.1: Distribution of households with children by household type in each country in the European Union (%)
Source: Authors’ computations based on EU-SILC (2005) data

44 1. DEMOGRAPHIC PROCESSES
TÁRKI EUROPEAN SOCIAL REPORT TÁRKI EUROPEAN SOCIAL REPORT
Across all the countries under consideration, at most one household in five has three or more children. The share of such households approaches 20 per cent in Ireland, the Netherlands, Belgium (18 per cent each), Finland and Luxembourg, while they account for less than 3 per cent of households with children in Greece and less than 6 per cent in Portugal.
In addition to the share of households with children in the population and their internal structure, our analysis also extends to a more specific subject – that of the youngest group of children (Figure 1.14). The overall figures for the 24 countries included in our study reveal that a third of all women caring for children aged 0–2 years have at least a higher education degree. This ratio is 15 per cent higher than the corresponding figure for all women aged 25–49 years. Taking this difference as our baseline for a comparison of the EU countries, we find that the indicator value is significantly above 15 per cent in Slovenia (69 per cent), the Czech Republic (51 per cent), Luxembourg (29 per cent), Italy (24 per cent) and France (23 per cent). This contrasts with countries where the proportion of women with higher education among women caring for children aged 0–2 is lower than or equal to the proportion among all women aged 25–49 years: Latvia (84 per cent of the figure for all women aged 25–49 years), the United Kingdom (96 per cent), Estonia (98 per cent), Lithuania, Slovakia and Finland (100 per cent each).
we also find that, in the first few years of the 21st century, women typically gave birth at the age of 28–33 years; taking all the countries into consideration, the median age was 32 years. The age range was not especially wide across the countries. The lowest median age was observed in Latvia and Lithuania (28 years each) and the highest in Germany, Spain, Ireland, Italy and the Netherlands (33 years).
In Hungary, one-third of households have members under the age of 18. Lone-parent households and those that fall into the category of ‘other type of household with dependent children’ occur more frequently than the average for the EU, and households with two adults and one or two children occur less frequently than the average. The share of families with three or more children corresponds to the average for the 24 countries under analysis. The ratio of women with higher education among mothers caring for children aged 0–2 years is 5 per cent higher than the corresponding figure for women aged 25–49 years. women caring for infants have a median age of 30 years in Hungary.
•
taking the average of the countries studied, those mothers With children aged 0–2 years are tWice as likely to have a higher education degree as are all Women aged 25–49.
no significant differences are observed betWeen the countries in the average age of mothers With young children.

TÁRKI EUROPEAN SOCIAL REPORT TÁRKI EUROPEAN SOCIAL REPORT
451. DEMOGRAPHIC PROCESSES
1.5. Household composition and income
In this section, we seek to present a descriptive analysis of the income positions of individual age cohorts and of a selection of household types. The analysis involves households of different sizes; single-person households of different sexes and ages, lone-parent households and households with a couple and children are examined separately.
The indicator of income position. The relative income positions of household types are captured by the following indicator. The equivalent household incomes calculated on the basis of OECD Scale II are grouped into five categories:
1. less than half the median income2. 50–80 per cent of the median income3. 80–120 per cent of the median income4. 120–200 per cent of the median income5. more than twice the median income.
For each household type, its distribution across the five income categories was ob-served in each of the countries. To allow us to determine the position of a given household type in the income structure by means of a single indicator, the next step was to calculate the ratio of households in the top two and the bottom two catego-ries. This step was also carried out for all households combined, in each individual country. Finally, for each country, the figure for the position of a given household type was divided by the figure calculated for all households combined. The resulting indi-cator is used in every figure in Section 1.5 to describe the relative income positions of individual household types. The mean value – a value of 1.0 by definition – is always marked.
Figure 1.14: Some features of children aged 0–2 years by country: mother’s level of education (proportion of mothers with higher education relative to the average of the 24 countries) and median age
Source: Authors’ computations based on EU-SILC (2005) data
Note: The columns (left axis) represent the number of mothers with higher education caring for children aged 0–2 in proportion to the female population aged 25–49 years in the given country.

46 1. DEMOGRAPHIC PROCESSES
TÁRKI EUROPEAN SOCIAL REPORT TÁRKI EUROPEAN SOCIAL REPORT
the relative income position of single-person households is Worse than average in every country. households With tWo to four members have the best standing.
Figure 1.15: Household size (people) and income position in the European Union, by country
Source: Authors’ computations based on EU-SILC (2005) data
among single-person households, Women aged 65 and over are in the Worst position in terms of income.
Household size. Analysis of the relative income positions of households of different sizes in the countries that were studied reveals the following (Figure 1.15).
The relative income position of single-person households, which are becoming increasingly frequent due to population ageing, is below average in each of the member states under consideration. Households with two to four members, i.e. those with at most two generations, caring for a small number of children, have the best standing.In most of the countries, households with three members are in the best position in terms of income. In some countries (France, Hungary, Luxembourg, the Netherlands), two-member households enjoy the best income position relative to all households, while in others (Cyprus, Estonia, Ireland, Latvia), this is true of four-member households. In Sweden, both two-member and four-member households have better positions than do households with three members. In none of the member states do one- and six-person households enjoy a position that is better than average, and five-member households are positioned slightly above the average only in Estonia, Latvia and Slovenia.
Single-person households by age and gender. As we saw in our analysis of household size, single-person households overall are in a disadvantaged position. It was shown in Section 1.3.1 that there is great variation among these households, and we therefore resolved to look more closely at the relative income positions of the different age groups and sexes that go to make up single-person households (Figure 1.16).
Only in a handful of countries do single-person households (of whatever type) occupy a position that is above average. They include Mediterranean countries (Spain, Greece, Italy,), Luxembourg, the Netherlands and the United Kingdom. In Luxembourg, every type of single-person household we looked at is ranked close to the average. People living alone do not have an above-average standard of living in terms of income in any of the new member states, excepting men aged over 65 in Poland.
•
•
•
•
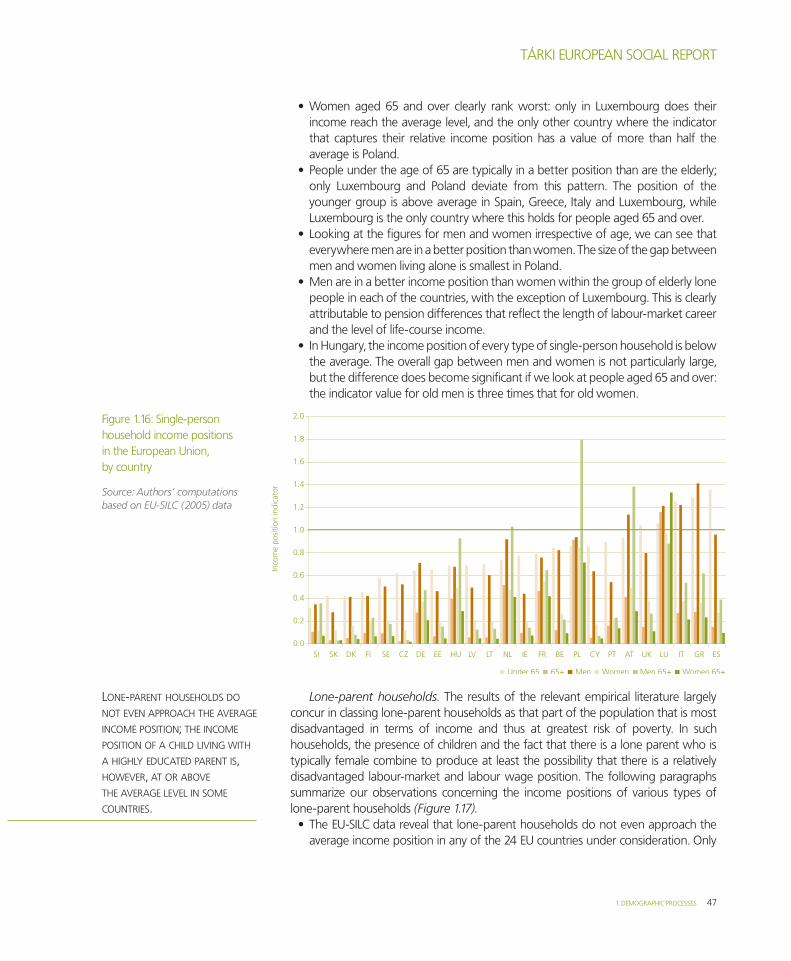
TÁRKI EUROPEAN SOCIAL REPORT TÁRKI EUROPEAN SOCIAL REPORT
471. DEMOGRAPHIC PROCESSES
women aged 65 and over clearly rank worst: only in Luxembourg does their income reach the average level, and the only other country where the indicator that captures their relative income position has a value of more than half the average is Poland. People under the age of 65 are typically in a better position than are the elderly; only Luxembourg and Poland deviate from this pattern. The position of the younger group is above average in Spain, Greece, Italy and Luxembourg, while Luxembourg is the only country where this holds for people aged 65 and over.Looking at the figures for men and women irrespective of age, we can see that everywhere men are in a better position than women. The size of the gap between men and women living alone is smallest in Poland.Men are in a better income position than women within the group of elderly lone people in each of the countries, with the exception of Luxembourg. This is clearly attributable to pension differences that reflect the length of labour-market career and the level of life-course income. In Hungary, the income position of every type of single-person household is below the average. The overall gap between men and women is not particularly large, but the difference does become significant if we look at people aged 65 and over: the indicator value for old men is three times that for old women.
Lone-parent households. The results of the relevant empirical literature largely concur in classing lone-parent households as that part of the population that is most disadvantaged in terms of income and thus at greatest risk of poverty. In such households, the presence of children and the fact that there is a lone parent who is typically female combine to produce at least the possibility that there is a relatively disadvantaged labour-market and labour wage position. The following paragraphs summarize our observations concerning the income positions of various types of lone-parent households (Figure 1.17).
The EU-SILC data reveal that lone-parent households do not even approach the average income position in any of the 24 EU countries under consideration. Only
•
•
•
•
•
•
Figure 1.16: Single-person household income positions in the European Union, by country
Source: Authors’ computations based on EU-SILC (2005) data
lone-parent households do not even approach the average income position; the income position of a child living With a highly educated parent is, hoWever, at or above the average level in some countries.
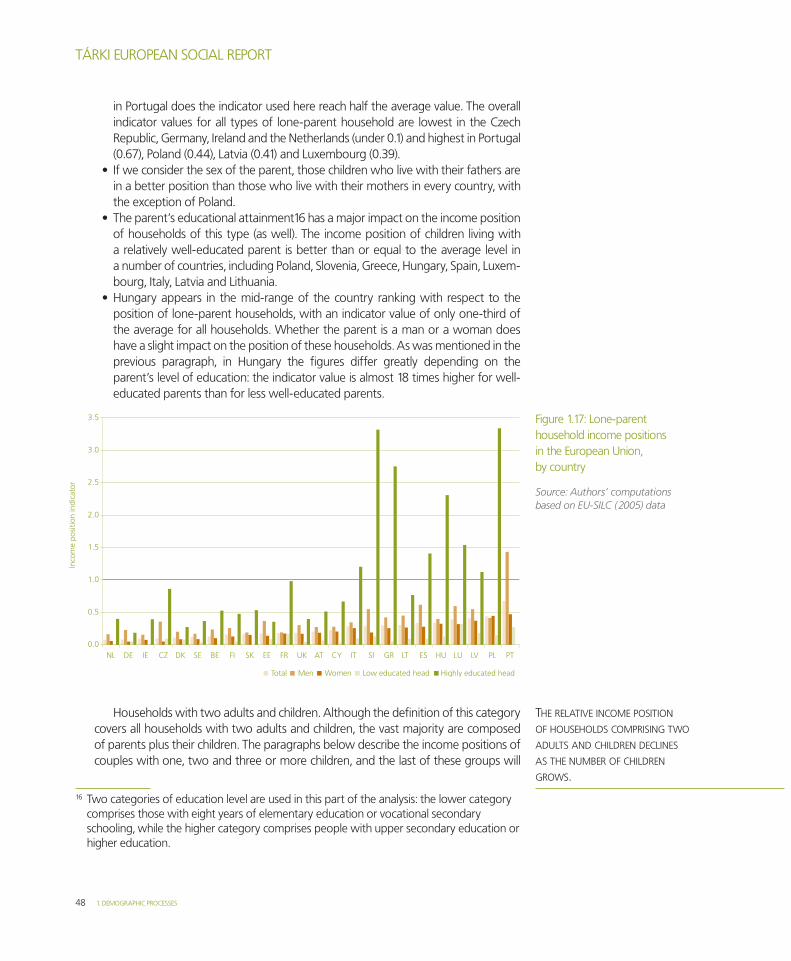
48 1. DEMOGRAPHIC PROCESSES
TÁRKI EUROPEAN SOCIAL REPORT TÁRKI EUROPEAN SOCIAL REPORT
in Portugal does the indicator used here reach half the average value. The overall indicator values for all types of lone-parent household are lowest in the Czech Republic, Germany, Ireland and the Netherlands (under 0.1) and highest in Portugal (0.67), Poland (0.44), Latvia (0.41) and Luxembourg (0.39).If we consider the sex of the parent, those children who live with their fathers are in a better position than those who live with their mothers in every country, with the exception of Poland.The parent’s educational attainment16 has a major impact on the income position of households of this type (as well). The income position of children living with a relatively well-educated parent is better than or equal to the average level in a number of countries, including Poland, Slovenia, Greece, Hungary, Spain, Luxem-bourg, Italy, Latvia and Lithuania. Hungary appears in the mid-range of the country ranking with respect to the position of lone-parent households, with an indicator value of only one-third of the average for all households. whether the parent is a man or a woman does have a slight impact on the position of these households. As was mentioned in the previous paragraph, in Hungary the figures differ greatly depending on the parent’s level of education: the indicator value is almost 18 times higher for well-educated parents than for less well-educated parents.
Households with two adults and children. Although the definition of this category covers all households with two adults and children, the vast majority are composed of parents plus their children. The paragraphs below describe the income positions of couples with one, two and three or more children, and the last of these groups will
16 Two categories of education level are used in this part of the analysis: the lower category comprises those with eight years of elementary education or vocational secondary schooling, while the higher category comprises people with upper secondary education or higher education.
•
•
•
Figure 1.17: Lone-parent household income positions in the European Union, by country
Source: Authors’ computations based on EU-SILC (2005) data
the relative income position of households comprising tWo adults and children declines as the number of children groWs.

TÁRKI EUROPEAN SOCIAL REPORT TÁRKI EUROPEAN SOCIAL REPORT
491. DEMOGRAPHIC PROCESSES
be further broken down according to the educational attainment of the head of the household (Figure 1.18).
Among nuclear families of two parents plus their children, households with a single child are in the best position in each of the 24 EU countries under consideration. The income standing of families with one child is better than average in every country, with the exception of Hungary. The indicator shows a value of above 2.0 in Belgium, Denmark, Finland, Ireland, Sweden and the United Kingdom.within the household type under examination, income position declines as the number of children grows. Families with two children still occupy an above-average relative position in half the countries, while households with three or more children do not reach the average in any of the states; in fact, they are positioned far below. The values of the indicator show very little variation across the countries within this group.Those families with three or more children in which the head of the household is relatively well educated are in a significantly better position than are those with a less well-educated household head. Households of the former type have an even better than average income position in Belgium, Spain, Greece and Portugal.The position of Hungary is unusual, in that two adults living with one child do not have an above-average income position. we also find, however, that households with one child and those with two children show barely any difference in terms of relative income positions. The educational level of the household head is decisive with regard to the position of households with three or more children in Hungary as well, but the size of the effect does not compare to that observed among lone-parent households.
•
•
•
•
Figure 1.18: ‘Two adults with children’ household income positions in the European Union, by country
Source: Authors’ computations based on EU-SILC (2005) data