1 demonstration of methodology expert panel open meeting austin, texas november 12, 2014
TRANSCRIPT

1
Demonstration of Methodology
Expert Panel Open Meeting
Austin, TexasNovember 12, 2014

2
Agenda
Introductions Overview Preliminary Overall Methodology Demonstration of Methodology
Site Residential Features Hazard Module Damage Module Results
Future Work Q&A

3
Introductions
Sam Amoroso, Ph.D. P.E., S.E. Forte & Tablada, Inc.
Bob Bailey, Ph.D., P.E. Exponent, Inc.
Bill Coulbourne, P.E. Coulbourne Consulting
Andrew Kennedy, Ph.D. University of Notre Dame
Doug Smith, Ph.D., P.E. Texas Tech University

4
Overview
1st Open Meeting: Austin, August 22, 2013
2nd Open Meeting: Corpus Christi, December 10, 2013
3rd Open Meeting: Austin, March 13, 2014
4th Open Meeting: Austin, May 29, 2014
5th Open Meeting: Austin, August 7, 2014
6th Open Meeting: Austin, November 12, 2014

5
1st Open Meeting
Panel Member Backgrounds
The TWIA expert panel has been appointed under Insurance Code §2210.578 and 28 Texas Administrative Code §§5.4260-5.4268. The panel’s purpose is to develop ways of determining whether a loss to TWIA-insured property was caused by wind, waves, tidal surges, or rising waters not caused by waves or surges.
After the panel completes its work, the commissioner will consider the panel’s findings and publish guidelines that TWIA must use to settle claims.
6
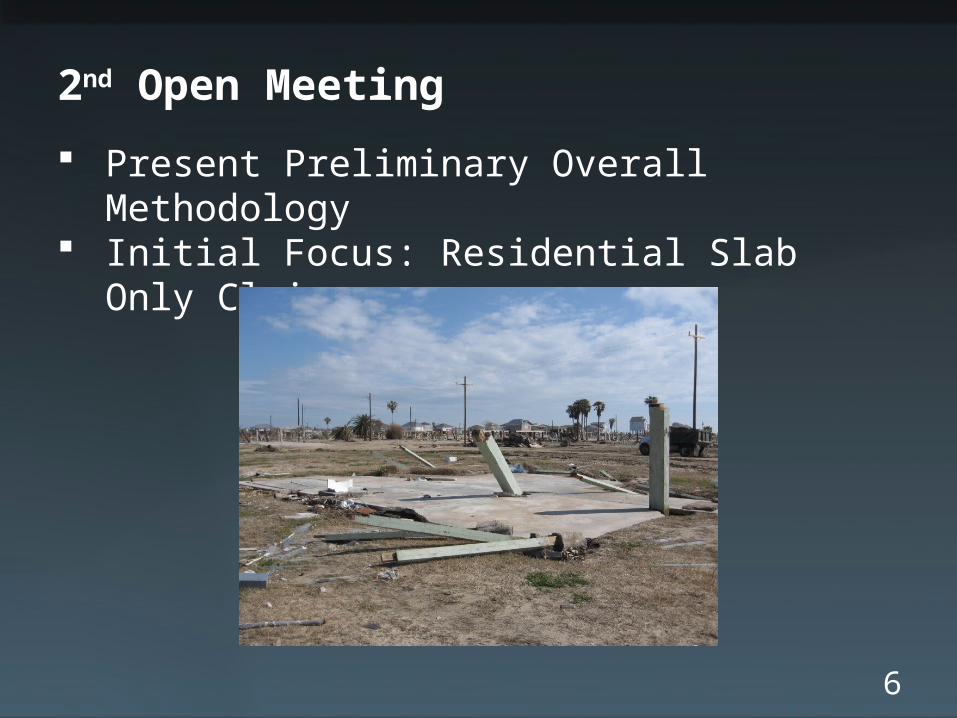
2nd Open Meeting
Present Preliminary Overall Methodology Initial Focus: Residential Slab Only Claims

7
3rd Open Meeting
Present Proposed Hazard Module Methodology Goal: To provide a time history of wind, surge, and
wave heights for a given property location.

8
4th Open Meeting
Present Proposed Damage Module Methodology Goal: To provide an estimate of component damage
attributable to wind prior to collapse of the structure due to surge forces.

9
5th Open Meeting
Present Proposed Economic Loss Methodology Goal: To provide an estimate of the loss due to
component damage attributable to wind prior to collapse of the structure due to surge forces.

10
TDI Website
11
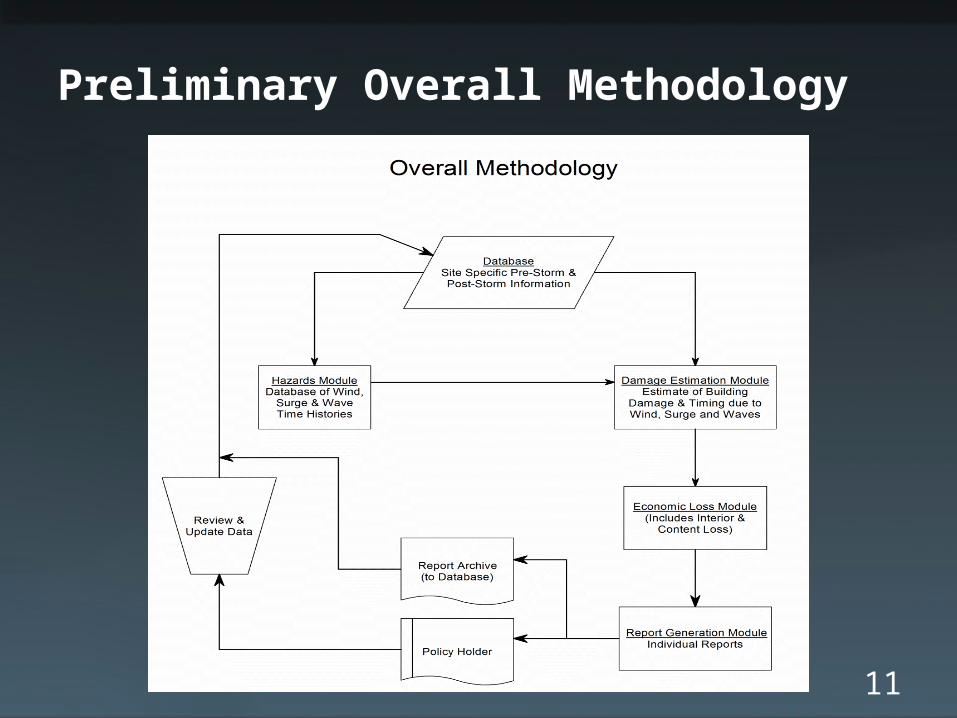
Preliminary Overall Methodology
12
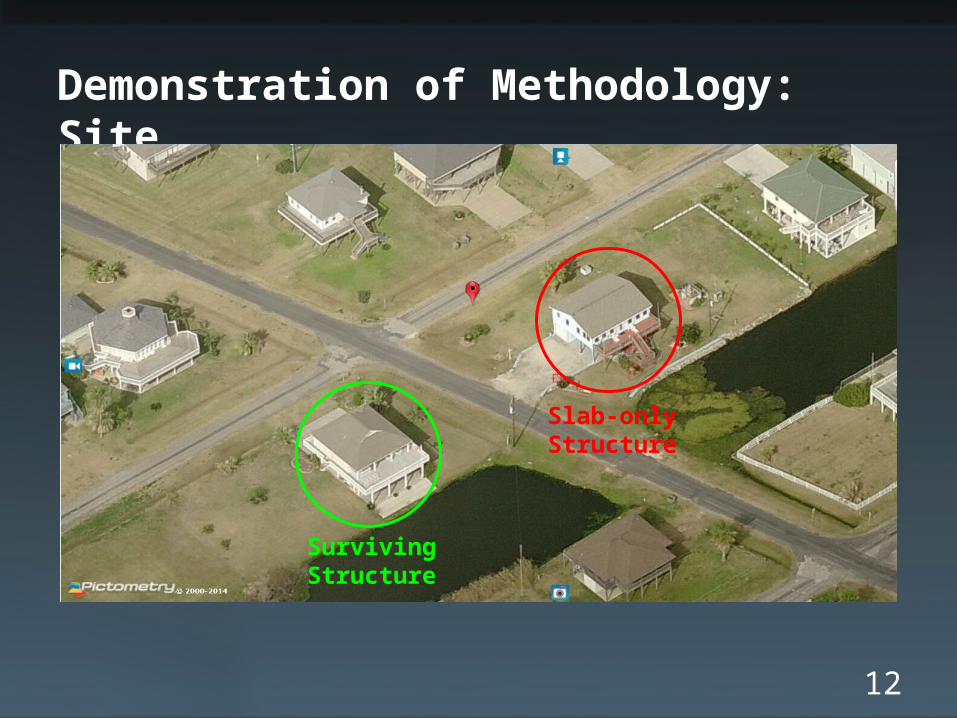
Demonstration of Methodology: Site
Surviving Structure
Slab-only Structure

13
Pictometry™: Aerial View Before Ike

14
Pictometry™: Aerial View After Ike

15
Residential Features
Roof shape: Gable Roof cover type: Asphalt Shingle Roof slope: 4:12 Roof height: 20 ft. Roof cover age: 9 years Length: 42 ft. Width: 34 ft. Eave height: 17 ft.

16
Residential Features
Structure primary axis: 60° Terrain exposure: D Overhead garage door: Yes Direction of garage door: 240° Garage panel door width: Single Garage attached: Yes Percent window area: 0-25 Elevation of Lowest
Horizontal StructuralMember: 14.83 ft.

17
Hazard Module: Objectives
Goals Site Specific:
Wind speed time history Wind direction time history Surge time history Wave time history
Minimum of error Used to predict damage to
individual structure as the storm passes

18
Hazard Timing
12 m/s
75 deg
10 ft 2.2 ft

19
Hazards Module Flow Chart
Steps Collect Hurricane Wind Field
Data over Life of Storm. Develop Global Hurricane
Wind Field. Use the hurricane wind field as
input to surge model and wave model.
Obtain time correlated histories.
Refine the time histories. Final time histories for
vulnerability module.

20
Wind Speeds: Hurricane Ike at Landfall
A
C
B
D
21
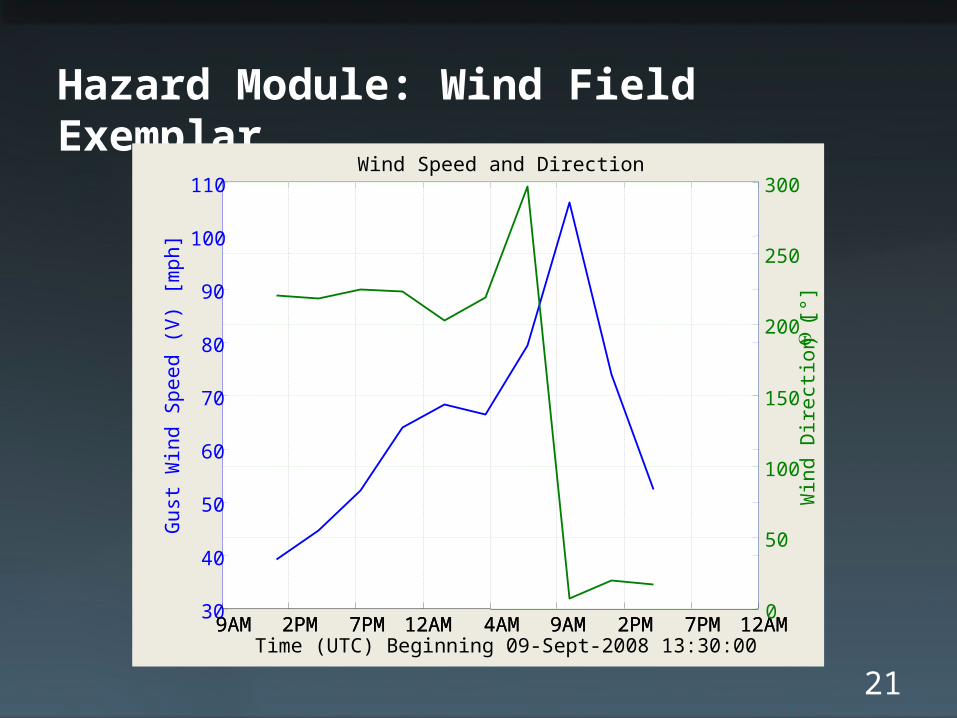
Hazard Module: Wind Field Exemplar
9AM 2PM 7PM 12AM 4AM 9AM 2PM 7PM 12AM30
40
50
60
70
80
90
100
110G
ust
Win
d S
pe
ed
(V
) [m
ph
]
Time (UTC) Beginning 09-Sept-2008 13:30:00
Wind Speed and Direction
9AM 2PM 7PM 12AM 4AM 9AM 2PM 7PM 12AM0
50
100
150
200
250
300
Win
d D
ire
ctio
n (Q
) [°
]

22
Hazard Module: Surge + Wave Definitions
Separate inundation into waves and surge
Surge is the slow variation of average water levels over periods of 10 minutes or longer
Waves are the faster variation of water levels
Like waves at the beach Typically 5-20s periods
dominate in hurricanes
At a given location wave and surge properties will define the hazard.
When combined with the structural properties, these will allow damage estimates.

23
Example of High Resolution Hurricane Ike Simulation using SWAN+ADCIRC SWAN computes waves, ARCIRC computes surge May not be the only model choice that could give
good results. 18 million element simulation using hindcast winds
(high accuracy reconstruction) . Resolution down to 20m in some complex areas. Runs on parallel computer (like all high resolution
simulations). Tides included. Comparisons against high water marks, NOAA gauges,
rapidly installed gauges.

24
Surge + Wave: Hurricane Ike
Source: ARCADIS U.S., Inc., Highlands Ranch, Colorado 80129

25
Hazard Module: Surge + Wave Exemplar

26
Surge + Wave Fragility
Probability of slabbing defined for houses exposed to waves and surge.
Inputs: Significant Wave Height Surge Elevation Lowest Horizontal Structural Member House Age
Based on almost 2000 homes examined after Ike. Once Probability of slabbing exceeds a threshold,
house has failed; no more wind damage is possible.

27
Inputs for Surge + Wave Vulnerability
Significant Wave Height
Surge Elevation
House Age(in ranges of years)Lowest
Horizontal Structural Member Elevation

28
Damage Module
Input Hazard Time Histories
Wind Surge + Wave Construction Features
Output Time of probable collapse from
surge + waves Time Histories of component
damage due to wind

29
Damage Module
Construction Features:
Surviving Structure Slab-Only Structure

30
Damage Module
Surviving Structure: Time of Probable Collapse
18.24 ft.

31
Damage Module
Slab-Only Structure: Time of Probable Collapse
14.83 ft.

32
Damage Module
Surviving Structure: Component Damage Time Histories

33
Damage Module
Slab-Only Structure: Component Damage Time HistoriesPoint where structure
topples over.

34
Damage Module
Gable Roof Zones:

35
Damage Module
Wall Zones:

36
Results
Surviving Structure: Component Wind DamageTime Roof Cover Roof Panel Wall Cover Wall Panel Windows Doors Garage Dr Roof Frame Interior
9/12/08 13:30 0.9% 0.8% 0.9% 0.0% 0.0% 0.0% 0.0% 0.0% 0.0%9/12/08 14:00 0.9% 0.8% 0.9% 0.0% 0.0% 0.0% 0.0% 0.0% 0.0%9/12/08 14:30 1.0% 0.8% 0.9% 0.0% 0.0% 0.0% 0.0% 0.0% 0.0%9/12/08 15:00 1.0% 0.8% 1.0% 0.0% 0.0% 0.0% 0.0% 0.0% 0.0%9/12/08 15:30 1.0% 0.8% 1.0% 0.0% 0.0% 0.0% 0.0% 0.0% 0.0%9/12/08 16:00 1.0% 0.8% 1.0% 0.0% 0.0% 0.0% 0.0% 0.0% 0.0%
9/13/08 5:00 2.1% 1.1% 2.4% 0.0% 0.3% 0.1% 0.0% 0.0% 0.1%9/13/08 5:30 2.3% 1.2% 2.6% 0.0% 0.4% 0.2% 0.0% 0.0% 0.1%9/13/08 6:00 2.7% 1.3% 2.8% 0.0% 0.5% 0.3% 0.0% 0.0% 0.1%9/13/08 6:30 2.9% 1.3% 2.9% 0.0% 0.6% 0.4% 0.0% 0.0% 0.2%9/13/08 7:00 3.2% 1.4% 3.2% 0.0% 0.8% 0.5% 0.0% 0.0% 0.2%9/13/08 7:30 3.3% 1.4% 4.5% 0.0% 1.4% 1.0% 0.0% 0.0% 0.3%9/13/08 8:00 4.2% 1.6% 5.1% 0.0% 2.0% 1.5% 0.1% 0.0% 0.4%9/13/08 8:30 5.6% 1.9% 6.4% 0.0% 3.3% 2.9% 0.2% 0.0% 0.8%9/13/08 9:00 6.1% 2.0% 8.3% 0.0% 5.6% 5.4% 0.4% 0.0% 1.2%9/13/08 9:30 9.0% 2.5% 9.3% 0.1% 7.0% 7.0% 0.8% 0.0% 2.4%
9/13/08 10:00 10.0% 2.7% 12.4% 0.2% 10.7% 11.6% 1.5% 0.0% 3.4%9/13/08 10:30 16.4% 4.2% 18.1% 0.8% 21.1% 23.0% 9.2% 0.1% 8.6%9/13/08 11:00 16.4% 4.2% 18.1% 0.8% 21.1% 23.0% 9.2% 0.1% 8.6%

37
Results
Slab-Only Structure : Component Wind DamageTime Roof Cover Roof Panel Wall Cover Wall Panel Windows Doors Garage Dr Roof Frame Interior
9/12/08 13:30 0.9% 0.7% 0.9% 0.0% 0.0% 0.0% 0.0% 0.0% 0.0%9/12/08 14:00 0.9% 0.7% 0.9% 0.0% 0.0% 0.0% 0.0% 0.0% 0.0%9/12/08 14:30 1.0% 0.8% 1.0% 0.0% 0.0% 0.0% 0.0% 0.0% 0.0%9/12/08 15:00 1.0% 0.8% 1.0% 0.0% 0.0% 0.0% 0.0% 0.0% 0.0%9/12/08 15:30 1.0% 0.8% 1.0% 0.0% 0.0% 0.0% 0.0% 0.0% 0.0%9/12/08 16:00 1.0% 0.8% 1.0% 0.0% 0.0% 0.0% 0.0% 0.0% 0.0%9/12/08 16:30 1.0% 0.8% 1.0% 0.0% 0.0% 0.0% 0.0% 0.0% 0.0%9/12/08 17:00 1.1% 0.8% 1.1% 0.0% 0.0% 0.0% 0.0% 0.0% 0.0%9/12/08 17:30 1.1% 0.8% 1.1% 0.0% 0.0% 0.0% 0.0% 0.0% 0.0%9/12/08 18:00 1.1% 0.8% 1.2% 0.0% 0.0% 0.0% 0.0% 0.0% 0.0%9/12/08 18:30 1.2% 0.8% 1.2% 0.0% 0.0% 0.0% 0.0% 0.0% 0.0%
9/13/08 4:00 2.6% 1.2% 2.3% 0.0% 0.2% 0.1% 0.0% 0.0% 0.1%9/13/08 4:30 2.6% 1.2% 2.3% 0.0% 0.2% 0.1% 0.0% 0.0% 0.1%9/13/08 5:00 2.6% 1.2% 2.4% 0.0% 0.3% 0.1% 0.0% 0.0% 0.1%9/13/08 5:30 2.8% 1.2% 2.7% 0.0% 0.4% 0.2% 0.0% 0.0% 0.1%9/13/08 6:00 2.9% 1.2% 2.9% 0.0% 0.5% 0.3% 0.0% 0.0% 0.1%9/13/08 6:30 3.9% 1.4% 3.1% 0.0% 0.7% 0.4% 0.0% 0.0% 0.2%9/13/08 7:00 4.2% 1.5% 3.3% 0.0% 0.8% 0.6% 0.0% 0.0% 0.2%9/13/08 7:30 4.6% 1.5% 3.5% 0.0% 1.1% 0.7% 0.0% 0.0% 0.3%9/13/08 8:00 4.9% 1.6% 4.7% 0.0% 2.3% 1.8% 0.1% 0.0% 0.5%9/13/08 8:30 7.1% 1.9% 5.4% 0.0% 3.2% 2.7% 0.1% 0.0% 1.0%9/13/08 9:00 8.0% 2.1% 8.3% 0.0% 5.6% 5.4% 0.4% 0.0% 1.5%
9/13/08 13:00 20.6% 4.2% 18.2% 0.8% 21.0% 23.1% 14.1% 0.0% 12.0%9/13/08 13:30 20.6% 4.2% 18.2% 0.8% 21.0% 23.1% 14.1% 0.0% 12.0%9/13/08 14:00 20.6% 4.2% 18.2% 0.8% 21.0% 23.1% 14.1% 0.0% 12.0%9/13/08 14:30 20.6% 4.2% 18.2% 0.8% 21.0% 23.1% 14.1% 0.0% 12.0%9/13/08 15:00 20.6% 4.2% 18.2% 0.8% 21.0% 23.1% 14.1% 0.0% 12.0%9/13/08 15:30 20.6% 4.2% 18.2% 0.8% 21.0% 23.1% 14.1% 0.0% 12.0%9/13/08 16:00 20.6% 4.2% 18.2% 0.8% 21.0% 23.1% 14.1% 0.0% 12.0%9/13/08 16:30 20.6% 4.2% 18.2% 0.8% 21.0% 23.1% 14.1% 0.0% 12.0%

38
Results
Slab-Only Structure: Roof Cover Damage Variation with Height and Exposure
15 ft 20 ft 25 ft2.3% 2.3% 2.3%7.7% 7.7% 7.7%2.7% 2.8% 3.1%9.5% 10.0% 11.2%3.6% 3.8% 4.1%18.7% 19.6% 21.4%
Mean Roof Height
B
C
D
Exposure

39
Future Work
Peer Review
Finalize recommendations and present to TDI
Continue with Model Development: Consideration of model building code changes. Impact of WPI information on building vulnerability. Consideration of the use of TDI-tested building products. A method or model to estimate damage to commercial
properties starting with slab-only cases.

40
Q&A