1 department of economics, stockholm school of economics, p.o. box 6501, se-113 83 stockholm,...
TRANSCRIPT

1Department of Economics, Stockholm School of Economics, P.O. Box 6501, SE-113 83 Stockholm, Sweden, www.sse.edu
Lars E.O. SvenssonStockholm School of Economics
Web: larseosvensson.se
Conference of Housing and Monetary Policy,Federal Reserve Bank of San Francisco,UCLA Ziman Center for Real Estate, San Francisco, September 4-5, 2014
Leaning against household debt:The Swedish experience

2
Outline Should standard flexible inflation targeting be combined
with some leaning against the wind, in order to promote financial stability?
Leaning promoted by BIS Skepticism elsewhere, but debate continues Sweden a case study: Quite aggressive leaning since
summer 2010 Outcome: Very low inflation, very high unemployment,
probably higher real debt Was Riksbank leaning justified?

3
Leaning against the wind
Tighter monetary policy than justified by stabilizing inflation and unemployment
Purpose is to moderate financial “imbalances” and threats to financial stability
Presumes (Smets 2013):(1) Macroprudential instruments or policies are ineffective
(2) A higher policy rate has a significant negative impact on threats to financial stability
My view:(1) varies from country to country
(2) has little theoretical and empirical support, although the latter may vary depending on the structure of the financial sector (competitive/oligopolistic, shadow banking…)
4
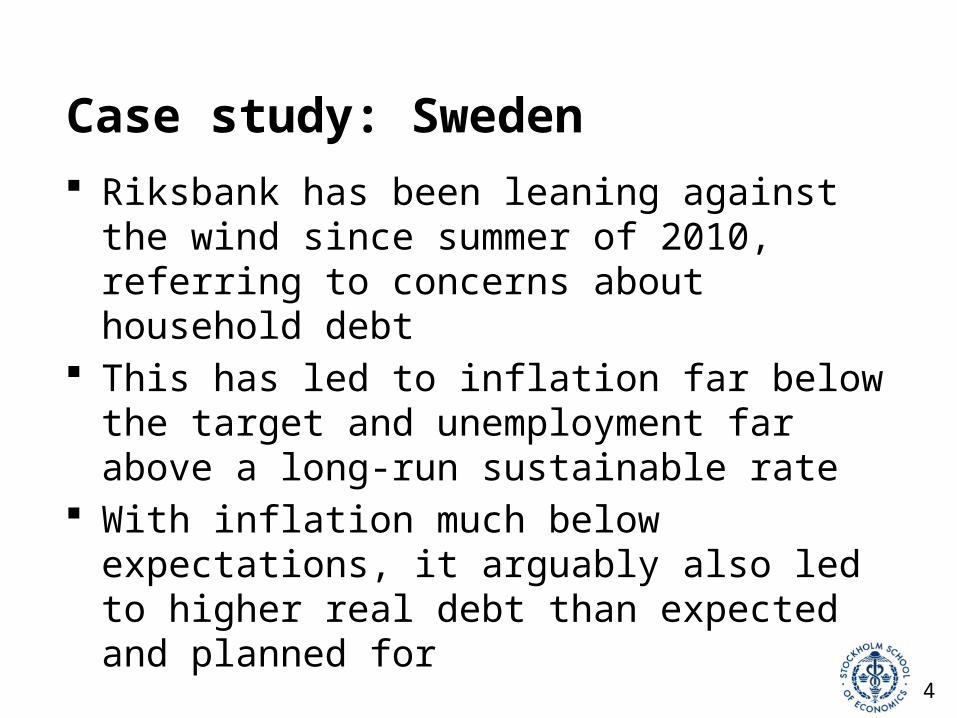
Case study: Sweden
Riksbank has been leaning against the wind since summer of 2010, referring to concerns about household debt
This has led to inflation far below the target and unemployment far above a long-run sustainable rate
With inflation much below expectations, it arguably also led to higher real debt than expected and planned for
5
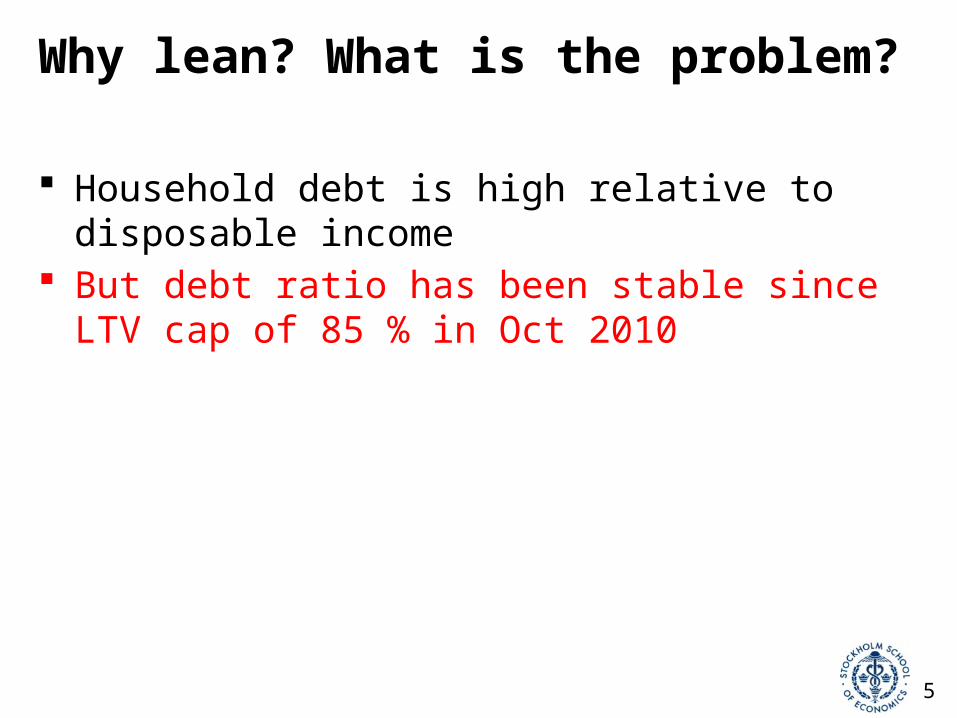
Why lean? What is the problem? Household debt is high relative to disposable income But debt ratio has been stable since LTV cap of 85 % in
Oct 2010

6
Household debt-to-income ratio(% of disposable income)
7
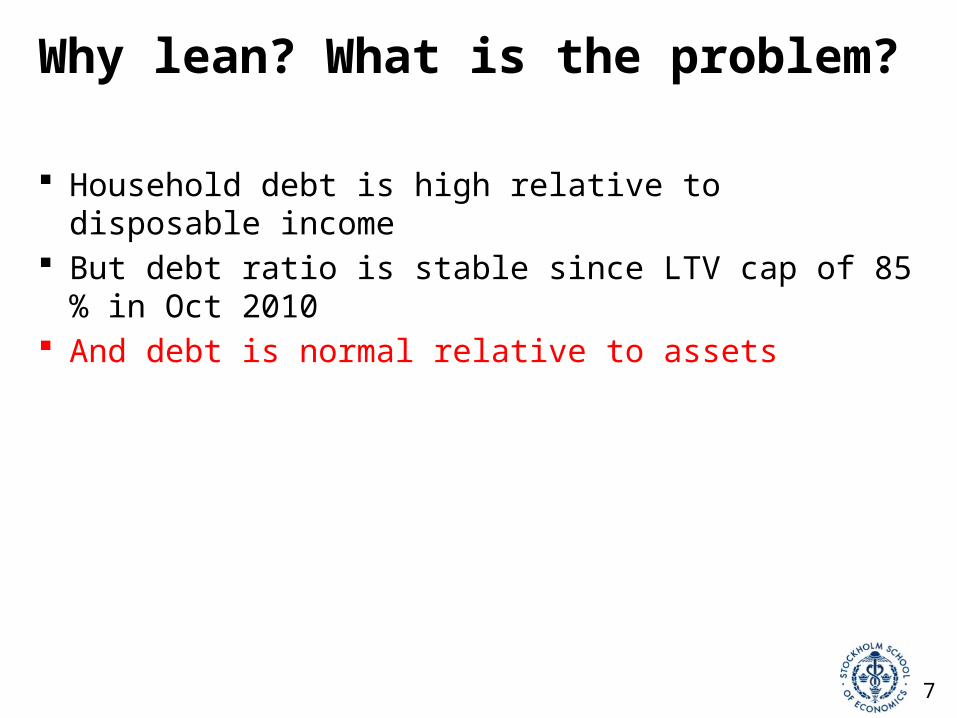
Why lean? What is the problem? Household debt is high relative to disposable income But debt ratio is stable since LTV cap of 85 % in Oct 2010 And debt is normal relative to assets

8
Household debt and assets (excluding collective pensions), % of disposable income

9
10
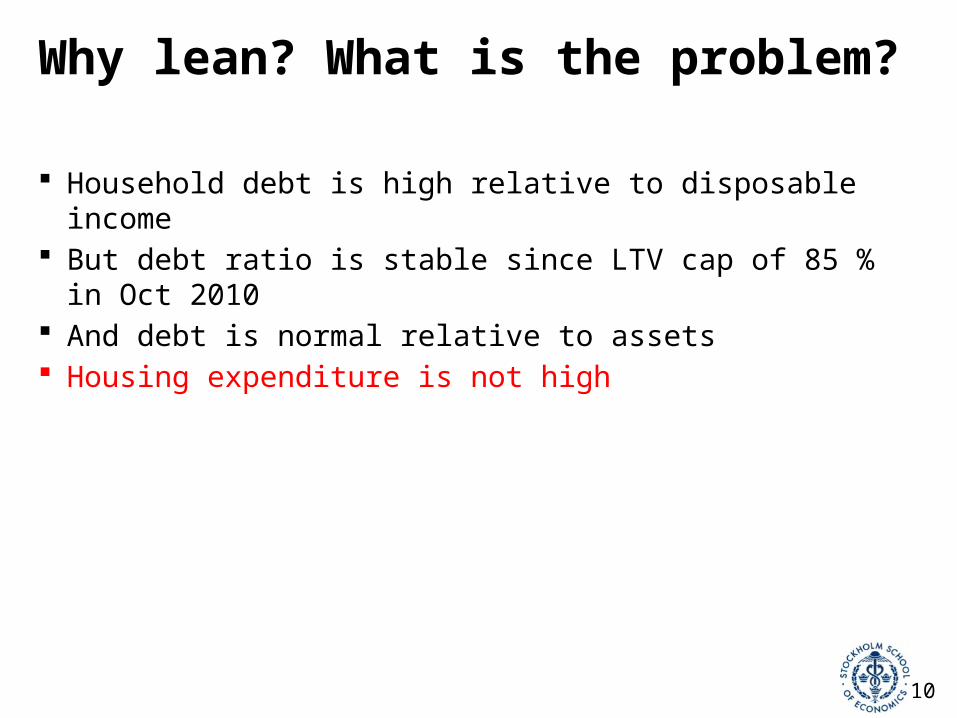
Why lean? What is the problem? Household debt is high relative to disposable income But debt ratio is stable since LTV cap of 85 % in Oct 2010 And debt is normal relative to assets Housing expenditure is not high
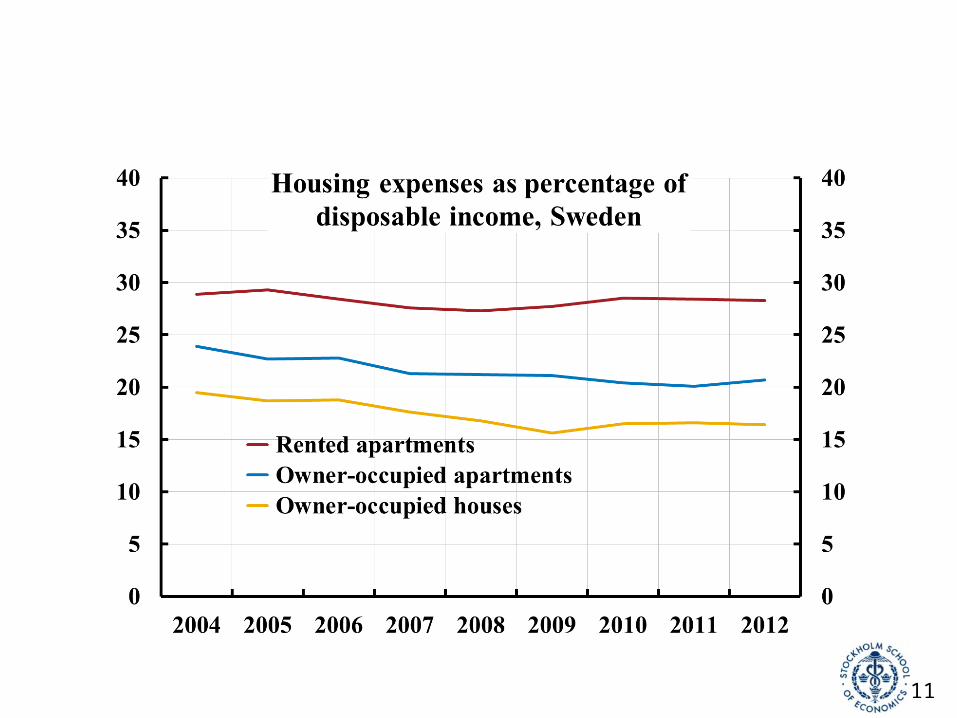
11

12
Why lean? What is the problem? Household debt is high relative to disposable income But debt ratio is stable since LTV cap of 85 % in Oct 2010 And debt is normal relative to assets Housing expenditure is not high Average LTV for new mortgages has stabilized around 70 %

13

14
Why lean? What is the problem? Household debt is high relative to disposable income But debt ratio is stable since LTV cap of 85 % in Oct 2010 And debt is normal relative to assets Housing expenditure is not high Average LTV for new mortgages has stabilized around 70 % Housing prices have not increased faster than disposable income since
2007

15

16
Why lean? What is the problem? Household debt is high relative to disposable income But debt ratio is stable since LTV cap of 85 % in Oct 2010 And debt is normal relative to assets Housing expenditure is not high Average LTV for new mortgages has stabilized around 70 % Housing prices have not increased faster than disposable income
since 2007 Housing prices are in line with fundamentals (disposable income,
mortgage rates, tax changes, urbanization, construction…)

17
Why lean? What is the problem? And, the FSA has:
• introduced an LTV cap of 85 %• introduced higher risk weights on mortgages (25 %)• introduced higher capital requirements (16 % CET1)• proposed individual amortization plans for borrowers• produces an annual mortgage market report, according to which
o lending standards are higho households’ repayment capacity is goodo households’ resilience to disturbances in the form of mortgage rate increases,
housing price falls, and income falls due to unemployment is good
Macroprudential tools and policy are arguably effective in Sweden

18
The leaning: Policy rates in Sweden, UK, and US;Eonia rate in euro area
19
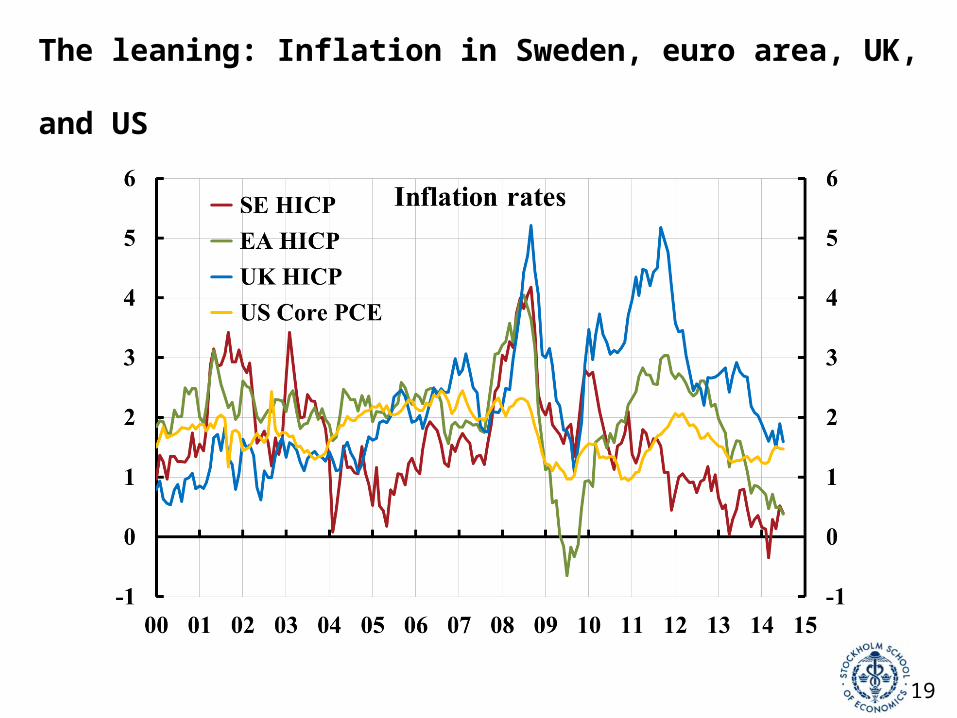
The leaning: Inflation in Sweden, euro area, UK, and US

20
The leaning: Real policy rate in Sweden, UK, and US,real Eonia rate in euro area

21
The leaning: Policy-rate increases from summer of 2010 have led to inflation below target and higher unemployment (and probably a higher debt ratio)
Cont.
Source: Svensson (2013), “Unemployment and monetary policy – update for the year 2013,” Svensson (2013), “Leaning against the wind increase (not reduces) the household debt-to-GDP ratio”,posts on larseosvensson.se.
LTV cap

22
Riksbank’s case for leaning against the wind
Higher debt could imply a higher probability of a future crisis, or a deeper crisis if it occurs
Hence, a tradeoff between (1) tighter policy now with worse outcome now and (2) worse expected outcome in the future
Worse outcome now is an insurance premium worth paying Is that true? The answer can be found in the Riksbank’s own boxes in
MPR July 2013 and February 2014, plus Schularick and Taylor (2012) and Flodén (2014)

23
Three issues in Williams (2014)
Williams (Bundesbank conference, 2014), “Financial stability and monetary policy: Happy marriage or untenable union”
1. What are the costs of using monetary policy actions to address perceived and potential risks to financial stability
2. How do monetary policy actions affect financial stability risks?
3. Can monetary policy policy be designed to improve these tradeoffs?

24
Williams issue (1): Cost of 1 pp higher policy rate: 0.5 pp higher unemployment rate
Source: MPR July 2013, chapt. 2; Svensson, post onlarseosvensson.se, March 31, 2014.

25
Williams issue (2): Benefit of 1 pp higher policy rate: Lower probability of a crisis
1 pp higher policy rate leads to 0.25 % lower real debt in 5 years
Lowers probability of crises by 0.25*0.4/5 = 0.02 pp
Assume 5 pp higher unemployment in crisis (Riksbank crisis scenario, MPR July 2013, box):
Benefit: Expected lower future unemployment:0,0002*5 = 0.001 pp
Compare to cost: Higher unemployment rate now: 0.5 pp
Schularick and Taylor (2012): 5 % lower real debt in 5 yrs implies 0.4 pp lower probability of crisis (average probability of crises about 4 %)
Riksbank, MPR Feb 2014, box:
Source: Svensson, post on larseosvensson.se, March 31, 2014.

26
Williams issue (2): Benefit of 1 pp higher policy rate: Smaller increase in unemployment if crisis
1 pp higher policy rate leads to 0.44 pp lower debt ratio in 5 yrs
Smaller increase in unemployment in crisis:0.44*0.02 = 0.009 pp
With probability of crisis as high as 10 %, divide by 10 (Shularick & Taylor: 4 %)
Benefit: Expected lower future unemployment: 0.0009 pp
Compare to cost: Higher unemployment now: 0.5 pp
1 pp lower debt ratio may imply 0.02 pp smaller increase in unemployment rate in crisis (Flodén 2014)
(Riksbank, MPR Feb 2014, box)
Source: Svensson, post on larseosvensson.se, March 31, 2014.

27
Williams issue (1) and (2): Summarize cost and benefit of 1 pp higher policy rate
Riksbank case does not stand up to scrutiny
Should have been > 1!

28
More costs: Inherent flaw in leaning against the wind:Inflation below credible target causes negative real effects
Inflation expectations anchored at target Lower average inflation than expected causes real
effects Higher unemployment Higher real debt for households (additional cost of
leaning against the wind)

29
CPI inflation and household inflation expectations

30
The real value of an SEK 1 million loan taken out in Nov 2011, actual and for 2 percent inflation
31
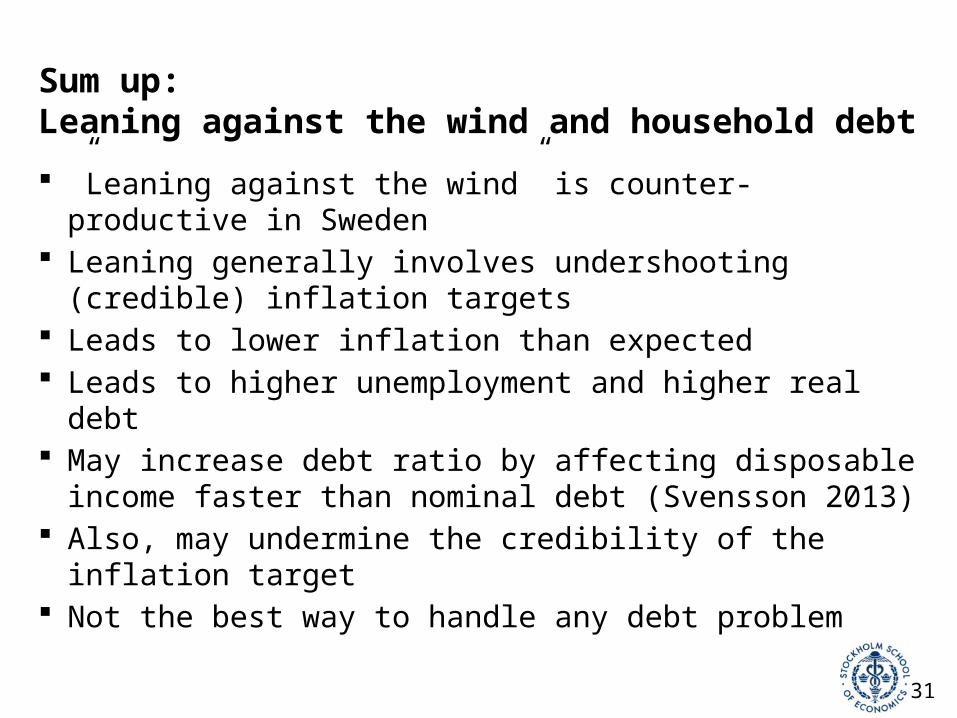
Sum up:Leaning against the wind and household debt
”Leaning against the wind” is counter-productive in Sweden Leaning generally involves undershooting (credible)
inflation targets Leads to lower inflation than expected Leads to higher unemployment and higher real debt May increase debt ratio by affecting disposable income
faster than nominal debt (Svensson 2013) Also, may undermine the credibility of the inflation target Not the best way to handle any debt problem
32
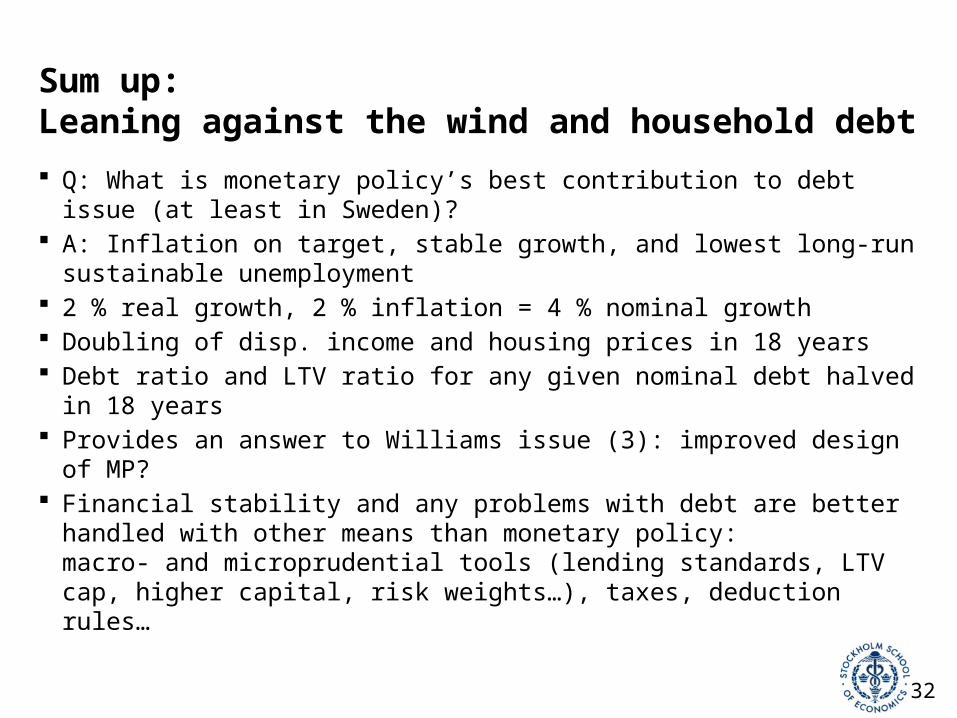
Sum up:Leaning against the wind and household debt Q: What is monetary policy’s best contribution to debt issue (at least in
Sweden)? A: Inflation on target, stable growth, and lowest long-run sustainable
unemployment 2 % real growth, 2 % inflation = 4 % nominal growth Doubling of disp. income and housing prices in 18 years Debt ratio and LTV ratio for any given nominal debt halved in 18 years Provides an answer to Williams issue (3): improved design of MP? Financial stability and any problems with debt are better handled with
other means than monetary policy: macro- and microprudential tools (lending standards, LTV cap, higher capital, risk weights…), taxes, deduction rules…

33

34
Flexible inflation targeting
Stabilize inflation around inflation target and resource utilization around long-run sustainable rate (employment/unemployment around a long-run sustainable rate)
Same as Fed’s dual mandate

35
The monetary policy mandate
Sveriges Riksbank Act• "The objective for monetary policy shall be to maintain price stability"
Government bill• "In addition, as an authority under the Riksdag, the Riksbank, without prejudice
to the price stability target, is to support the goals of general economic policy with the aim to achieve sustainable growth and high employment".
• High employment = highest sustainable rate of employment
Price stability and the highest sustainable rate of employment• Highest sustainable rate of employment = the lowest sustainable rate of
unemployment• Stabilize inflation around the inflation target and unemployment around a long-
run sustainable rate

36
Target achievement:Average inflation significantly below target

37
Fed and Riksbank, June/July 2010Similar forecasts, very different policies
Policy rate Inflation
Unemployment
Svensson (2011), “Practical Monetary Policy: Examples from Sweden and the United,” Brookings Papers on Economic Activity, Fall 2011, 289-332.
38
Lowflation/deflation and debt:A negative involuntary amortization Chair Yellen: “[W]ith longer-term inflation expectations
anchored near 2 percent in recent years, persistent inflation well below this expected value increases the real burden of debt for households and firms, which may put a drag on economic activity.”
Governor Ingves, in reply to a question if low inflation increases indebtedness: ”Interest rates are low and then it is easy to borrow… But in this context, the inflation rate is not a particularly significant issue.”

39

40
Scaremongering? Dagens Nyheter, January 15, 2013
41
Riksbank I
Governor Ingves: ”When interest rates are low, people borrow more. If you borrow too much, sooner or later there are problems.”
Riksbank: Probably no direct credit losses from mortgages But housing price fall and doubts about the Swedish
housing market might create problems for banks’ funding through covered housing bonds• But actually liquidity problem, not solidity problem: Solved by
lending of last resort from the Riksbank and the National Debt Office (and information) (Posts on Ekonomistas and larseosvensson.se, Feb 10, 2014)

42
Riksbank III: Households’ mortgage-rate expectations are too low Households’ expectations of mortgage rates in 5 years
are low compared to a normal policy rate of 4% and a normal spread• But who believes in “normal” interest rates in 5 years?
Households’ mortgage-rate expectations are low relative to the Riksbank’s policy-rate path• But what credibility does the policy-rate path have?

43
Policy rate, policy-rate path, market expectations, and household expectations about 3-month mortgage rates: Sep 2011
44
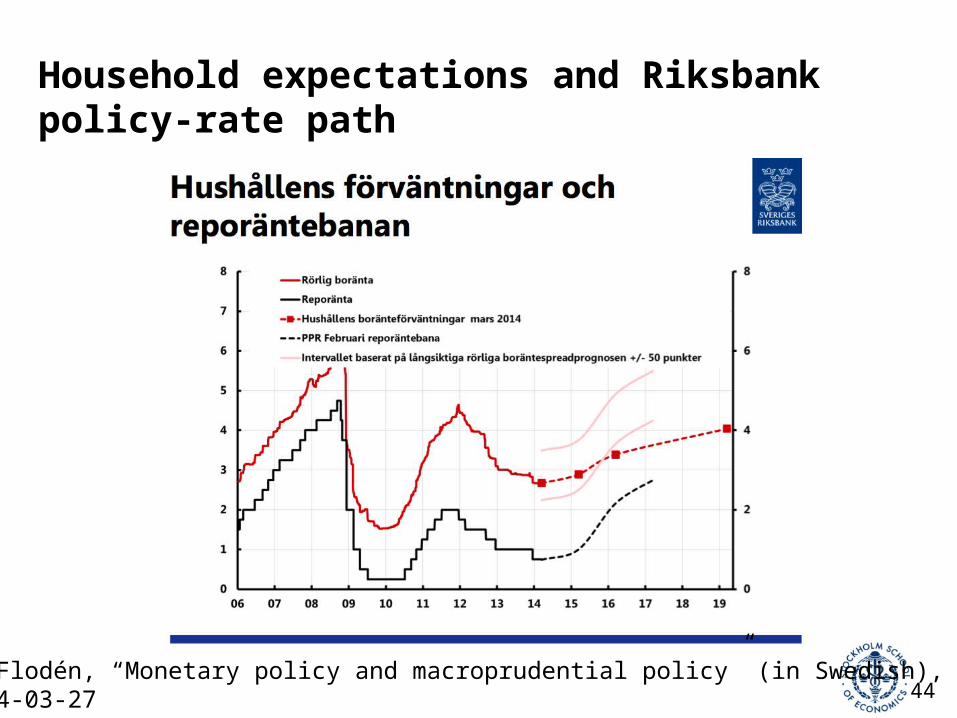
Household expectations and Riksbank policy-rate path
Source: Flodén, “Monetary policy and macroprudential policy” (in Swedish), LO, 2014-03-27

45
Household expectations and market expectations
Source: Flodén, “Monetary policy and macroprudential policy” (in Swedish), LO, 2014-03-27

46
Households’ expected mortgage-rate costs and actual yield curve

47
Households’ expected 5-year mortgage-rate costs and actual 5-year mortgage rate

48
Riksbank III: Households’ mortgage-rate expectations are too low Households’ expectations of mortgage rates in 5 years
are low compared to a normal policy rate of 4% and a normal spread• But who believes in “normal” interest rates in 5 years?
Households’ mortgage-rate expectations are low relative to the Riksbank’s policy-rate path• But what credibility does the policy-rate path have?
At a closer examination, no evidence of too low mortgage-rate expectations

49
Inflation expectations close to target, in spite of low inflation

50
Inflation expectations close to target, in spite of low inflation5-year trailing moving averages

51
Average CPIX/CPIF inflation also below target
Note: CPIX inflation through March 2008, CPIF inflation from April 2008.
52
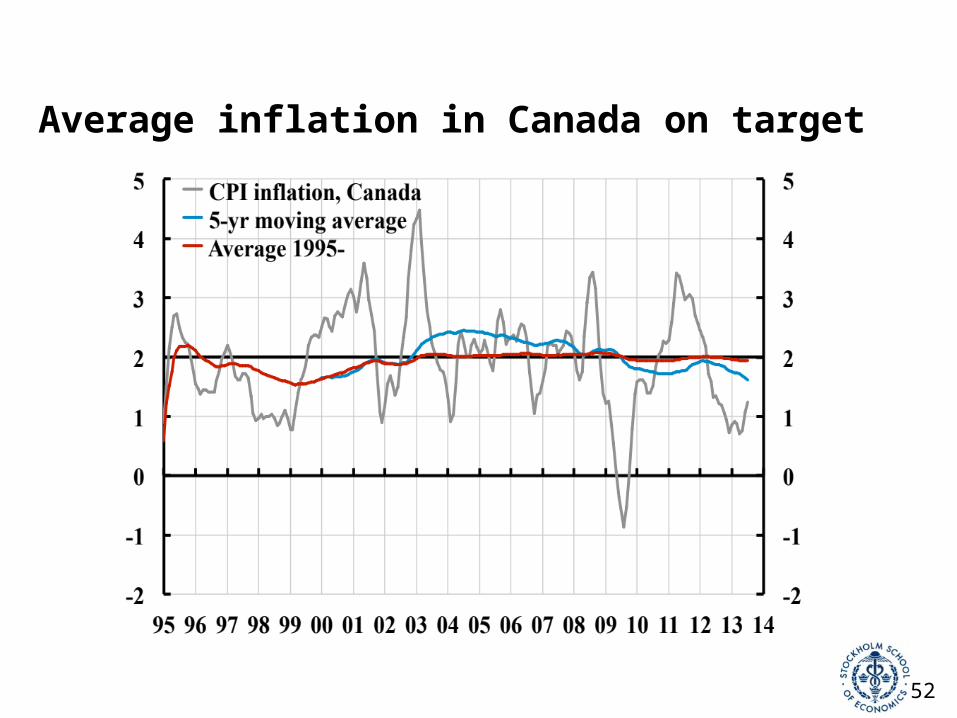
Average inflation in Canada on target

53
Average inflation in some countries: Sweden an outlier
Country Target Index Period Average Deviation
Sweden 2 (1995-) CPI 1997-2011 1.4 - 0.6
2 (1995-) CPI 1997-2007 1.3 - 0.7
Australia 2-3 (1993-) CPI 1997-2011 2.7 0.2
Canada 2 (1995-) CPI 1997-2011 2.0 0.0
UK 2.5 (1992-2003) RPIX 1997-2003 2.4 - 0.1
2 (2004-) CPI 2004-2007 2.0 0.0
2 (2004-) CPI 2008-2011 3.4 1.4
Euro zone (< 2) (1999-) HICP 2000-2011 2.1
USA (≤ 2) (2000-) core CPI 2000-2011 2.0
core PCE 2000-2011 1.9
54
-4
0
4
8
12
16
1 2 3 4 5 6 7 8 9 10 11 12
1976Q2
1991Q4
2011Q3
1998Q1
1993Q4
Unemployment, percent
CP
I in
flat
ion,
Y/Y
, per
cent
21.4
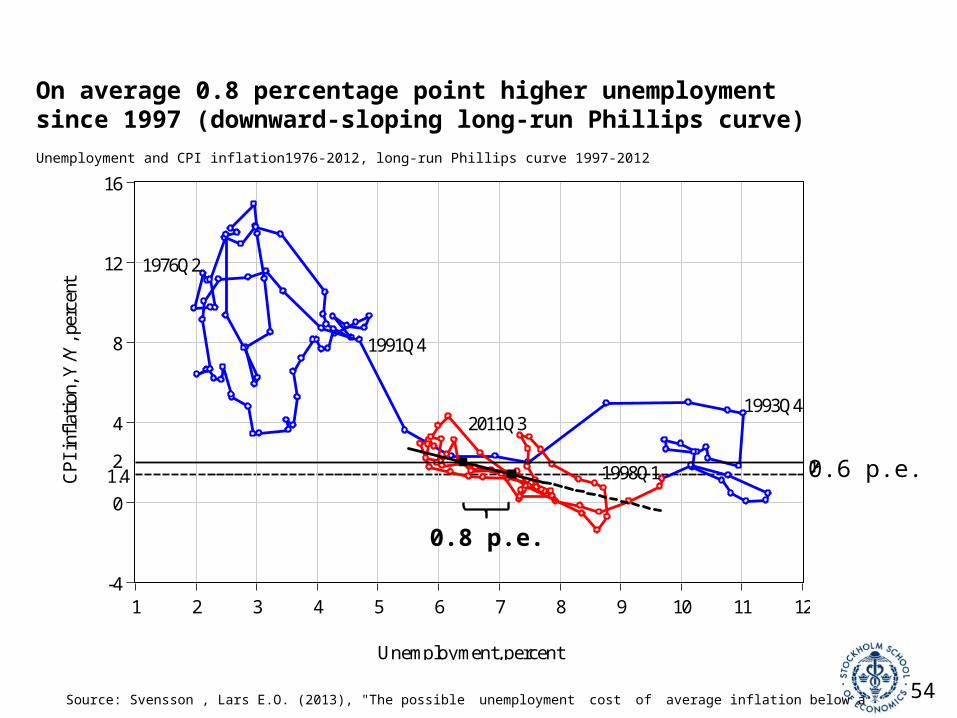
On average 0.8 percentage point higher unemployment since 1997 (downward-sloping long-run Phillips curve)
Unemployment and CPI inflation1976-2012, long-run Phillips curve 1997-2012
0.8 p.e.
0.6 p.e.
Source: Svensson , Lars E.O. (2013), "The possible unemployment cost of average inflation below a credible target", www.larseosvensson.net.

55
Long-run effect on real debt:Price level lower than expected
56
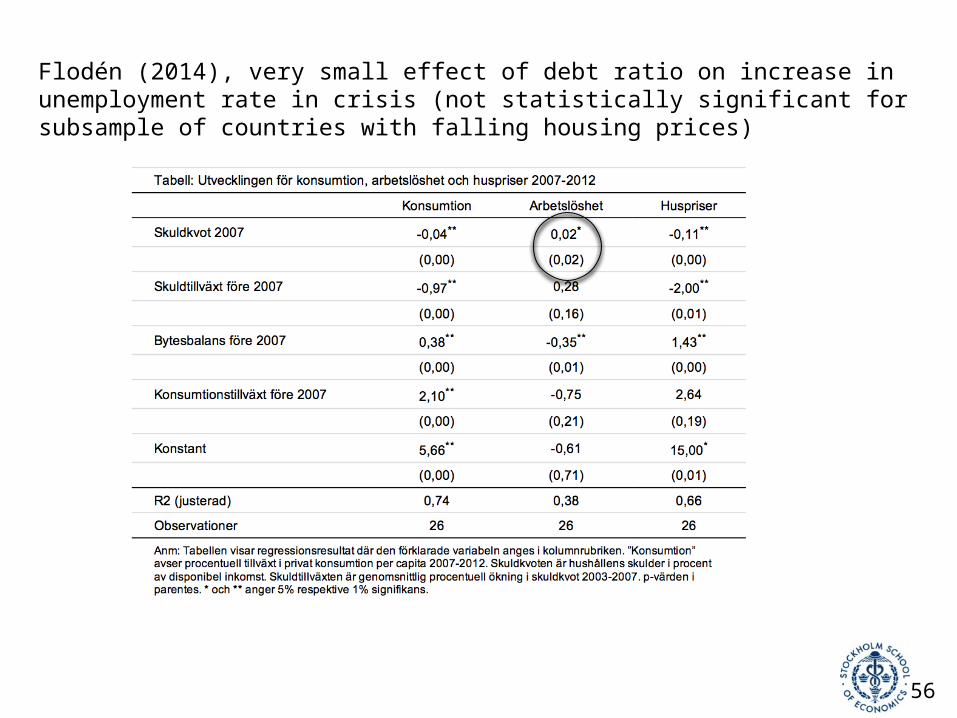
Flodén (2014), very small effect of debt ratio on increase in unemployment rate in crisis (not statistically significant for subsample of countries with falling housing prices)
57
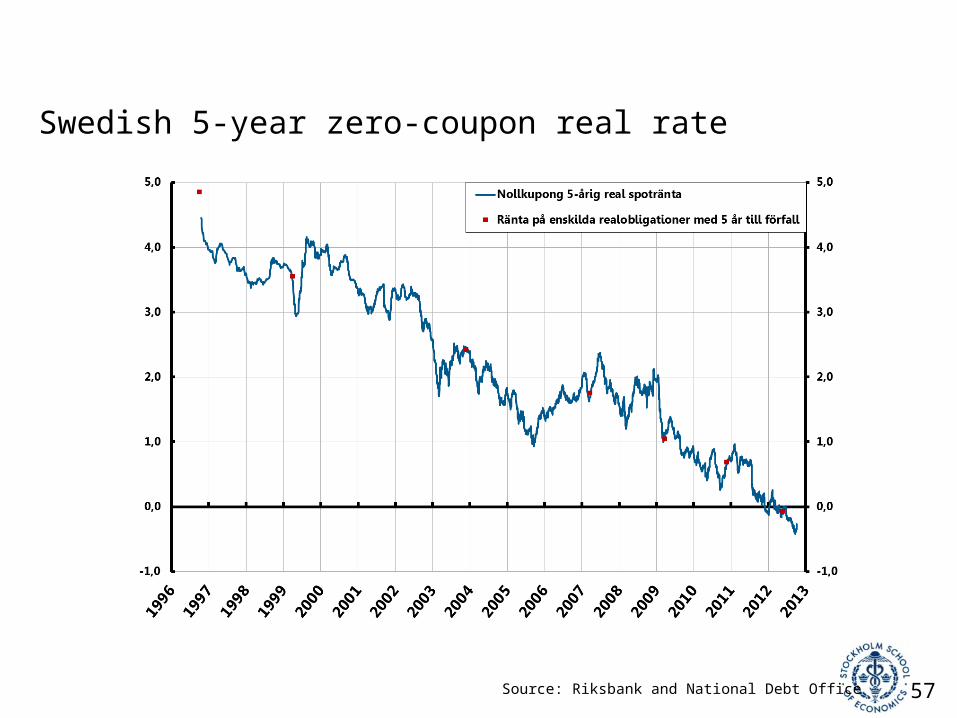
Swedish 5-year zero-coupon real rate
Source: Riksbank and National Debt Office

58
Capital to assets for households, som large listed companies, and Swedish banksPercent
Källor: Dagens Industri (soliditeten 2011 för börsbolag och svenska banker) och Riksbanken (hushållens soliditet).
0
10
20
30
40
50
60
70
80
59
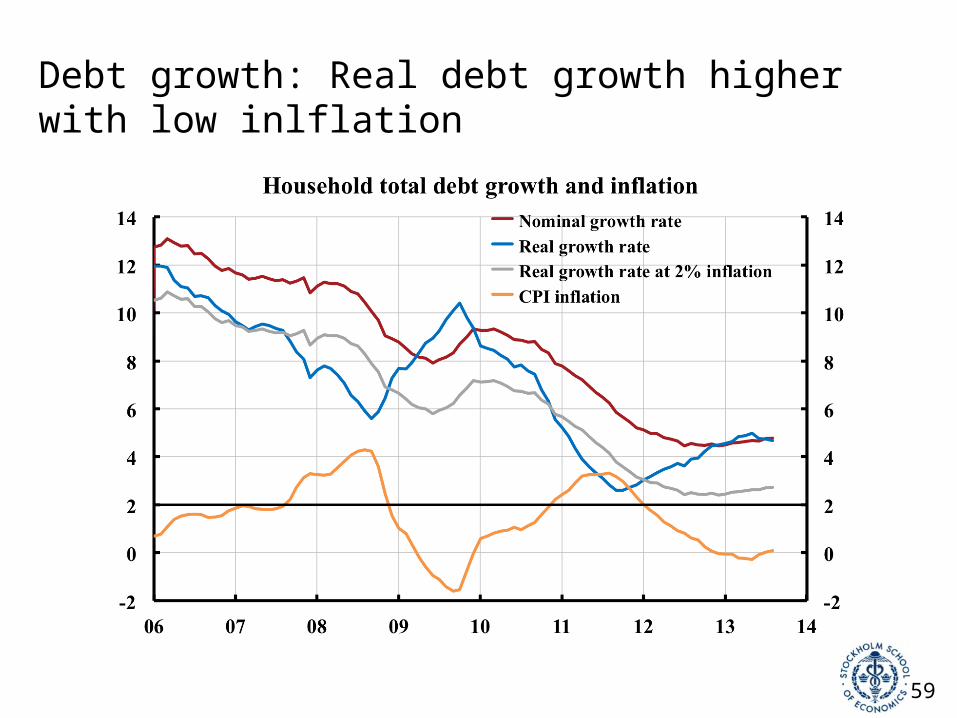
Debt growth: Real debt growth higher with low inlflation
60
Short- and long-run effects on debt Real debt is a ratio:
Nominal debt/Price level Debt ratio:
Nominal debt/Nominal disposable income LTV ratio:
Nominal debt/Nominal value of housing One (and the Riksbank!) must not forget the denominator,
and the effect of monetary policy on it Reala housing prices is a relative price:
Nominal housing price/Price level (nom. price on consumption)

61
Household debt/real assets and repo rate:No negative correlationPercent
Sources: The Riksbank and Statistics Sweden

62
Policy rate, policy-rate path, market expectations, and household expectations: April 2013

63
Stress test of new borrowers
Source: Finansinspektionen (Swedish FSA) (2014), “Mortgage market report”

64
Amortization hysterics? Why amortize? Depends exclusively on the individual borrower’s situation
• Amortization is fixed saving• Comparison of mortgage rate with the return on alternative investments, plus any
liquidity needs• It may be better to build up a liquidity buffer and/or invest in other assets (diversify)• SBAB:s price of liquidity: about 0.27 percentage points
Besides, 2% inflation and 2% real growth imply considerable automatic amortization• Nominal disposable income increase by 4 %/year• Doubles in 18 years, halves the debt ratio without nominal amortization• Assume real housing prices grow with real disposable income, 2 %/year• Nominal housing prices grow by 4 %/year• Doubles in 18 years, halves the LTV ratio without nominal amortization

65
SEK 1 million loan, taken out in March 2003:Real value of loan: Actual and for 2% inflationIncease in real value: Actual compared to 2% inflation
SEK Thousand SEK Thousand

66
Policy-rate increases from summer of 2010 have led to inflation below target and higher unemployment (and probably a higher debt ratio)
Cont.
Source: Svensson (2013), “Unemployment and monetary policy – update for the year 2013,” Svensson (2013), “Leaning against the wind increase (not reduces) the household debt-to-GDP ratio”,posts on larseosvensson.se.
LTV cap

67
Impulse responses to 1 percentage point higher policy rate during year 1Deviations from baseline

68
Robustness: T = 4 years, inflation and GDP responses half of Ramses

69