1. digital connectivity - asia-europe foundation …. digital connectivity.pdfbangladesh india...
TRANSCRIPT
ASEF Outlook Report 2016/2017 7Volume I: Data on Connectivity
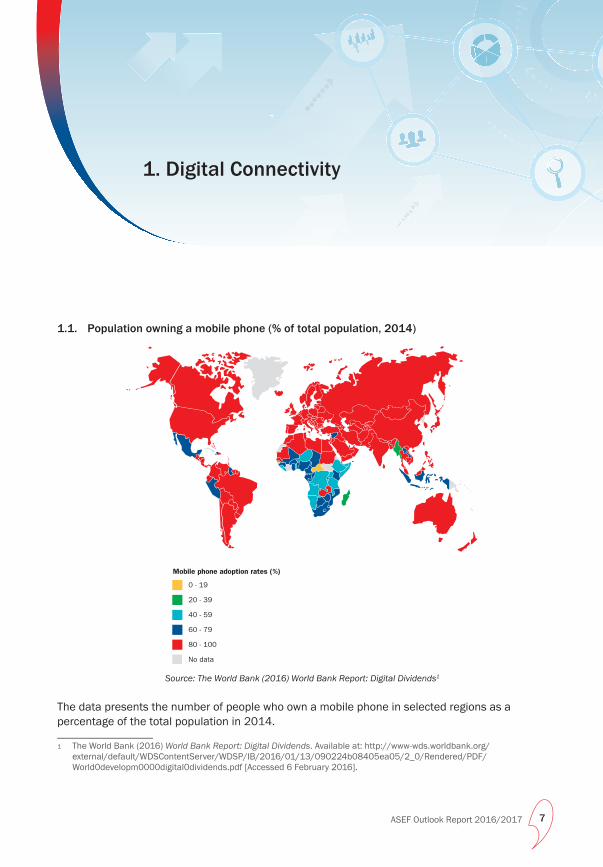
1.1. Population owning a mobile phone (% of total population, 2014)
No data
80 - 100
0 - 19
40 - 59
60 - 79
20 - 39
Mobile phone adoption rates (%)
Source: The World Bank (2016) World Bank Report: Digital Dividends1
The data presents the number of people who own a mobile phone in selected regions as a percentage of the total population in 2014.
1 The World Bank (2016) World Bank Report: Digital Dividends. Available at: http://www-wds.worldbank.org/external/default/WDSContentServer/WDSP/IB/2016/01/13/090224b08405ea05/2_0/Rendered/PDF/World0developm0000digital0dividends.pdf [Accessed 6 February 2016].
1. Digital Connectivity

1. Digital Connectivity
Volume I: Data on Connectivity8 ASEF Outlook Report 2016/2017
1.2. Mobile cellular subscriptions in ASEM countries (per 100 people, 2014)
Country
KazakhstanEstonia
SingaporePoland
Russian FederationCambodia
ItalyAustria
MalaysiaLuxembourg
Viet NamLithuaniaThailand
SwitzerlandFinland
BulgariaAustralia
Czech RepublicSweden
MaltaIndonesiaDenmark
LatviaUnited Kingdom
GermanyJapan
HungarySlovakiaNorway
NetherlandsKorea
GreeceBelgiumSlovenia
New ZealandPortugal
PhilippinesBrunei Darussalam
SpainRomaniaMongolia
CroatiaIrelandFranceCyprusChina
BangladeshIndia
PakistanLao PDRMyanmar
16916115815615515515415214914814714714414114013813113012812712612612412412012011811711711611611511411211211211111010810610510410410096927674736749
0 175
European ASEM CountriesAsian ASEM Countries
Source: The World Bank (2016) Mobile cellular subscriptions (per 100 people)2
2 The World Bank (2016) Mobile cellular subscriptions (per 100 people). Available at: http://data.worldbank.org/indicator/IT.CEL.SETS.P2/countries/1W?display=default [Accessed 8 March 2016].
CONNECTIVITY: Facts and Perspectives
Volume I: Data on Connectivity ASEF Outlook Report 2016/2017 9
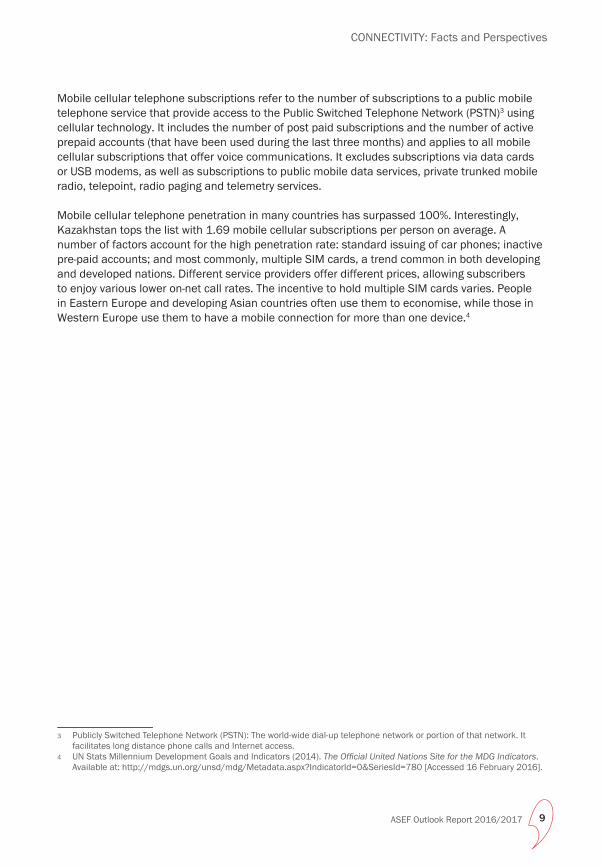
Mobile cellular telephone subscriptions refer to the number of subscriptions to a public mobile telephone service that provide access to the Public Switched Telephone Network (PSTN)3 using cellular technology. It includes the number of post paid subscriptions and the number of active prepaid accounts (that have been used during the last three months) and applies to all mobile cellular subscriptions that offer voice communications. It excludes subscriptions via data cards or USB modems, as well as subscriptions to public mobile data services, private trunked mobile radio, telepoint, radio paging and telemetry services.
Mobile cellular telephone penetration in many countries has surpassed 100%. Interestingly, Kazakhstan tops the list with 1.69 mobile cellular subscriptions per person on average. A number of factors account for the high penetration rate: standard issuing of car phones; inactive pre-paid accounts; and most commonly, multiple SIM cards, a trend common in both developing and developed nations. Different service providers offer different prices, allowing subscribers to enjoy various lower on-net call rates. The incentive to hold multiple SIM cards varies. People in Eastern Europe and developing Asian countries often use them to economise, while those in Western Europe use them to have a mobile connection for more than one device.4
3 Publicly Switched Telephone Network (PSTN): The world-wide dial-up telephone network or portion of that network. It facilitates long distance phone calls and Internet access.
4 UN Stats Millennium Development Goals and Indicators (2014). The Offi cial United Nations Site for the MDG Indicators. Available at: http://mdgs.un.org/unsd/mdg/Metadata.aspx?IndicatorId=0&SeriesId=780 [Accessed 16 February 2016].

1. Digital Connectivity
Volume I: Data on Connectivity10 ASEF Outlook Report 2016/2017
1.3. Price of mobile broadband services (price per gigabyte a month, USD, 2014)
No data / no service available
Europe inset
Above 32.00
2.00 - 10.99
16.50 - 22.99
23.00 - 31.99
11.00 - 16.49
Price of 1 GB of data per month, in USD PPP
Source: The World Bank (2016) World Bank Report: Digital Dividends5
Globally, mobile broadband prices are falling, but large differences remain between regions. North, South and Central America register high prices for mobile data, attributable to bundling.6 In general, Northern Asia, in particular the Russian Federation and Kazakhstan have cheaper mobile broadband services than Southern and Southeast Asia.
Overall, mobile broadband services tend to be more expensive in developing countries, but they still tend to cost considerably less than fixed broadband services.
5 The World Bank (2016) World Bank Report: Digital Dividends. Available at: http://www-wds.worldbank.org/external/default/WDSContentServer/WDSP/IB/2016/01/13/090224b08405ea05/2_0/Rendered/PDF/World0developm0000digital0dividends.pdf [Accessed 6 February 2016].
6 Bundling is a profi t-making strategy employed by companies that combines various goods and services offered into one streamline package.

CONNECTIVITY: Facts and Perspectives
Volume I: Data on Connectivity ASEF Outlook Report 2016/2017 11
1.4. Top 16 ASEM countries ranked by smartphone users (million, 2014)
0
55051
9.7
123.
3
50.8
49.0
38.3
36.4
36.4
32.8
26.7
24.1
22.0
20.0
17.5
16.6
13.2
12.7
275
China
India
Japa
n
Russia
n Fe
dera
tion
Indo
nesia
German
y
United
King
dom
Kore
a
Fran
ceIta
lySp
ain
Philip
pines
Thail
and
Viet N
am
Aust
ralia
Polan
d
European ASEM CountriesAsian ASEM Countries
Source: eMarketer (2015) Asia Pacific Boasts More Than 1 Billion Smartphone Users7
The data captures the number of smartphone users for every 1 million people in selected ASEM countries.8 This includes individuals of any age who own at least one smartphone and use the smartphone(s) at least once per month. China and India have the greatest number of smartphone users amongst ASEM countries. China leads by a huge margin with 519.7 million users, almost 400 million ahead of India with 123.3 million users. Asia-Pacific, on the whole, is expected to see a huge growth in smartphone ownership, driven by the emerging middle class and the proliferation of a wide range of cheaply manufactured smartphones and affordable service plans. Smartphone penetration among mobile phone users is expected to grow from 37.3% in Asia-Pacific to 51.5% in 2019.9
The projected increase in Internet users in developing Asia is expected to be driven by the widespread adoption of smartphones rather than traditional PCs via fixed broadband. This has immensely disruptive effects on news distribution, advertising and retail industries as the pattern of consumption changes with the use of smartphones.
7 eMarketer (2015) Asia Pacific Boasts More Than 1 Billion Smartphone Users. Available at: http://www.emarketer.com/Article/Asia-Pacific-Boasts-More-Than-1-Billion-Smartphone-Users/1012984 [Accessed 25 February 2016].
8 Data available for 16 ASEM countries only.9 eMarketer (2015). Asia Pacific Boasts More Than 1 Billion Smartphone Users. Available at: http://www.emarketer.com/
Article/Asia-Pacific-Boasts-More-Than-1-Billion-Smartphone-Users/1012984 [Accessed 25 February 2016].
1. Digital Connectivity
Volume I: Data on Connectivity12 ASEF Outlook Report 2016/2017
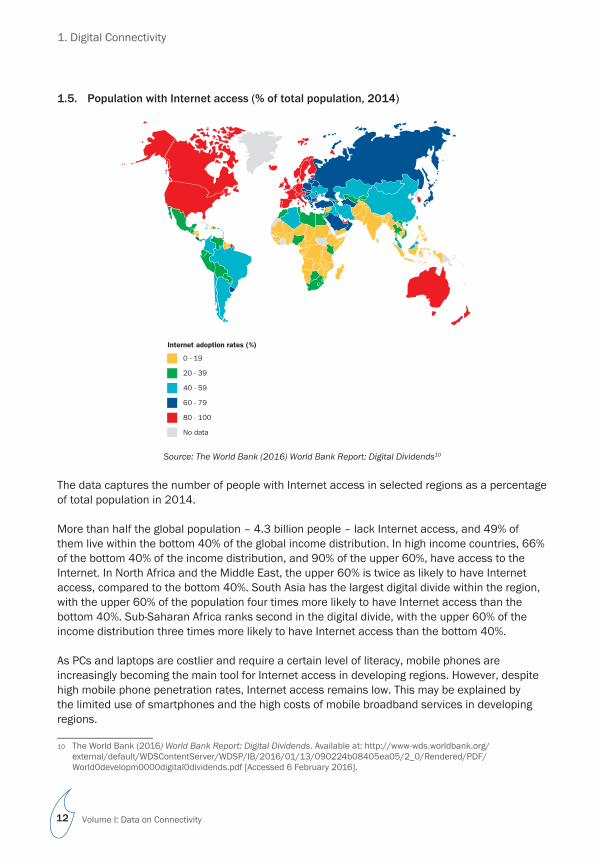
1.5. Population with Internet access (% of total population, 2014)
No data
80 - 100
0 - 19
40 - 59
60 - 79
20 - 39
Internet adoption rates (%)
Source: The World Bank (2016) World Bank Report: Digital Dividends10
The data captures the number of people with Internet access in selected regions as a percentage of total population in 2014.
More than half the global population – 4.3 billion people – lack Internet access, and 49% of them live within the bottom 40% of the global income distribution. In high income countries, 66% of the bottom 40% of the income distribution, and 90% of the upper 60%, have access to the Internet. In North Africa and the Middle East, the upper 60% is twice as likely to have Internet access, compared to the bottom 40%. South Asia has the largest digital divide within the region, with the upper 60% of the population four times more likely to have Internet access than the bottom 40%. Sub-Saharan Africa ranks second in the digital divide, with the upper 60% of the income distribution three times more likely to have Internet access than the bottom 40%.
As PCs and laptops are costlier and require a certain level of literacy, mobile phones are increasingly becoming the main tool for Internet access in developing regions. However, despite high mobile phone penetration rates, Internet access remains low. This may be explained by the limited use of smartphones and the high costs of mobile broadband services in developing regions.
10 The World Bank (2016) World Bank Report: Digital Dividends. Available at: http://www-wds.worldbank.org/external/default/WDSContentServer/WDSP/IB/2016/01/13/090224b08405ea05/2_0/Rendered/PDF/World0developm0000digital0dividends.pdf [Accessed 6 February 2016].
CONNECTIVITY: Facts and Perspectives
Volume I: Data on Connectivity ASEF Outlook Report 2016/2017 13
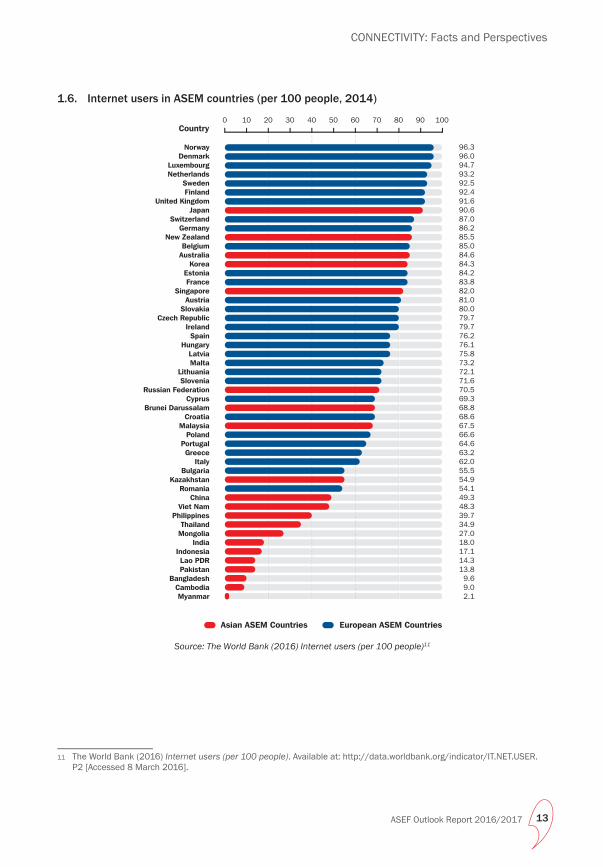
1.6. Internet users in ASEM countries (per 100 people, 2014)
Country0 10050 60 70 80 9040302010
NorwayDenmark
LuxembourgNetherlands
SwedenFinland
United KingdomJapan
SwitzerlandGermany
New ZealandBelgium
AustraliaKorea
EstoniaFrance
SingaporeAustria
SlovakiaCzech Republic
IrelandSpain
HungaryLatviaMalta
LithuaniaSlovenia
Russian FederationCyprus
Brunei DarussalamCroatia
MalaysiaPoland
PortugalGreece
ItalyBulgaria
KazakhstanRomania
ChinaViet Nam
PhilippinesThailand
MongoliaIndia
IndonesiaLao PDRPakistan
BangladeshCambodiaMyanmar
96.396.094.793.292.592.491.690.687.086.285.585.084.684.384.283.882.081.080.079.779.776.276.175.873.272.171.670.569.368.868.667.566.664.663.262.055.554.954.149.348.339.734.927.018.017.114.313.89.69.02.1
European ASEM CountriesAsian ASEM Countries
Source: The World Bank (2016) Internet users (per 100 people)11
11 The World Bank (2016) Internet users (per 100 people). Available at: http://data.worldbank.org/indicator/IT.NET.USER.P2 [Accessed 8 March 2016].

1. Digital Connectivity
Volume I: Data on Connectivity14 ASEF Outlook Report 2016/2017
Internet users are individuals who have used the Internet (from any location) in the last 12 months. The Internet can be accessed on devices such as a computer, mobile phone, personal digital assistant, games machine or digital TV.
The data captures the penetration rate of Internet usage in ASEM countries. Developed European and Asian countries have the highest rates of Internet penetration, with access to either wired broadband or mobile broadband. Norway and Denmark top the list with 96.3 and 96.0 Internet users per 100 people respectively. Developing Asian countries are concentrated at the lower end, with penetration rates of below 50 per 100 people and as low as 2.1 per 100 people in Myanmar. China, with 49.3 Internet users per 100 people, ranks relatively low (40th out of 51 ASEM countries), but its total Internet user numbers top the global list, accounting for 21.97% of world Internet users.12
12 Internet Live Stats (2014) Internet Users by Country (2014). Available at: http://www.internetlivestats.com/internet-users/china/ [Accessed 15 February 2016].
CONNECTIVITY: Facts and Perspectives
Volume I: Data on Connectivity ASEF Outlook Report 2016/2017 15
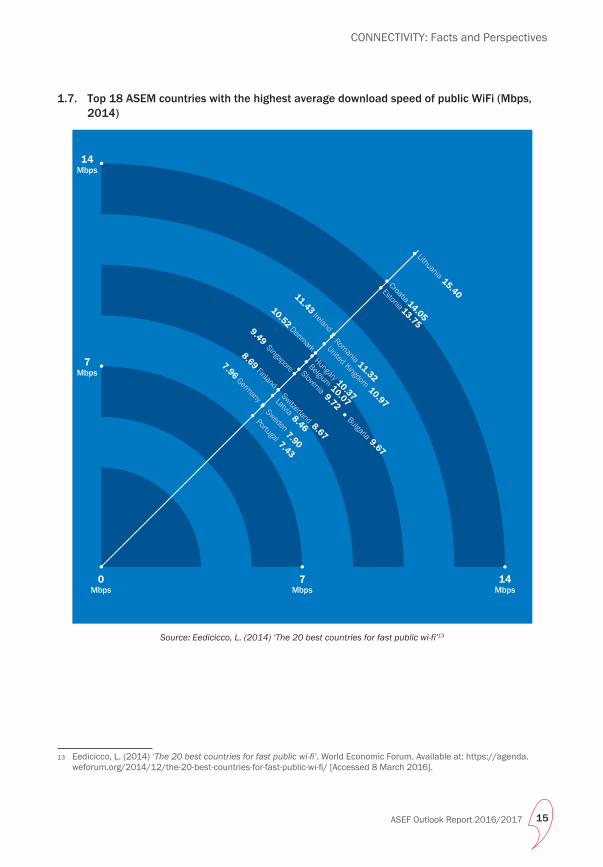
1.7. Top 18 ASEM countries with the highest average download speed of public WiFi (Mbps, 2014)
0Mbps
7Mbps
14Mbps
11.43Ireland
United Kingdom10.97
9.49Singapore
10.52Denmark
Belgium10.07
Slovenia9.72
Bulgaria 9.67
8.69Finland
8.67
Switzerland8.46
Latvia
Hungary 10.37
Estonia13.75
Croatia14.05
15.40
Lithuania
Romania 11.327.96
Germany
7.90
Sweden
7.43
Portugal
14Mbps
7Mbps
Source: Eedicicco, L. (2014) ‘The 20 best countries for fast public wi-fi’13
13 Eedicicco, L. (2014) ‘The 20 best countries for fast public wi-fi’. World Economic Forum. Available at: https://agenda.weforum.org/2014/12/the-20-best-countries-for-fast-public-wi-fi/ [Accessed 8 March 2016].

1. Digital Connectivity
Volume I: Data on Connectivity16 ASEF Outlook Report 2016/2017
The data presents the top 18 ASEM counties with the fastest public WiFi. Calculations were based on the average download speed of public WiFi in 2014.
Eastern European countries dominate the list of speediest WiFi connections. Lithuania (15.40 mbps), Croatia (14.05 mbps) and Estonia (13.75 mbps) have a reputation for good Internet connectivity thanks to government initiatives to install strong broadband infrastructure. Korea, China and Japan, typically recognised for their high speed of WiFi, were not featured in this list.
CONNECTIVITY: Facts and Perspectives
Volume I: Data on Connectivity ASEF Outlook Report 2016/2017 17
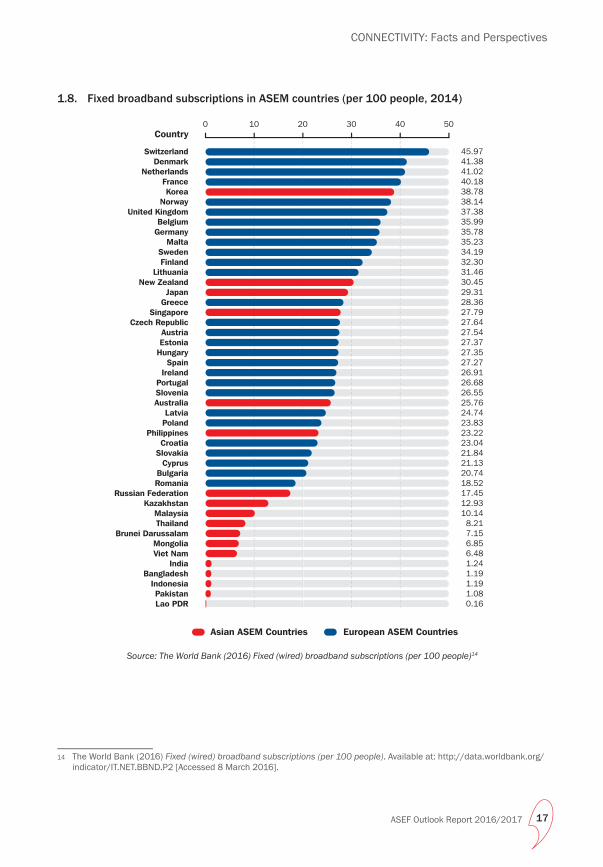
1.8. Fixed broadband subscriptions in ASEM countries (per 100 people, 2014)
Country0 5030 402010
SwitzerlandDenmark
NetherlandsFranceKorea
NorwayUnited Kingdom
BelgiumGermany
MaltaSwedenFinland
LithuaniaNew Zealand
JapanGreece
SingaporeCzech Republic
AustriaEstonia
HungarySpain
IrelandPortugalSloveniaAustralia
LatviaPoland
PhilippinesCroatia
SlovakiaCyprus
BulgariaRomania
Russian FederationKazakhstan
MalaysiaThailand
Brunei DarussalamMongoliaViet Nam
IndiaBangladesh
IndonesiaPakistanLao PDR
45.9741.3841.0240.1838.7838.1437.3835.9935.7835.2334.1932.3031.4630.4529.3128.3627.7927.6427.5427.3727.3527.2726.9126.6826.5525.7624.7423.8323.2223.0421.8421.1320.7418.5217.4512.9310.148.217.156.856.481.241.191.191.080.16
European ASEM CountriesAsian ASEM Countries
Source: The World Bank (2016) Fixed (wired) broadband subscriptions (per 100 people)14
14 The World Bank (2016) Fixed (wired) broadband subscriptions (per 100 people). Available at: http://data.worldbank.org/indicator/IT.NET.BBND.P2 [Accessed 8 March 2016].
1. Digital Connectivity
Volume I: Data on Connectivity18 ASEF Outlook Report 2016/2017
Fixed (wired) broadband subscriptions refer to subscriptions to high speed access to public Internet, at downstream speeds of 256 kbit/s or greater. This includes cable modem, DSL, fibre-to-the-home/building and other fixed (wired) broadband subscriptions. It excludes subscriptions that have access to data communications (including the Internet) via mobile-cellular networks and technologies listed under the wireless broadband category. It includes both residential and organisations’ subscriptions.
The data captures the number of fixed broadband subscriptions for every 100 people in 46 ASEM countries in 2014.15 The measure is indicative of the robustness of fixed Internet infrastructure in these countries. Developed ASEM countries with the most extensive and reliable Internet infrastructure see the greatest number of fixed broadband subscriptions per 100 people, while developing countries with weak, unreliable infrastructure and vast rural areas, see the least.
European countries dominate the upper percentile of the list. Switzerland ranks first with 45.97 subscriptions per 100 people. Korea with 38.78 subscriptions per 100 people, Japan with 29.31 subscriptions per 100 people and Singapore with 27.79 subscriptions per 100 people, pepper the mostly European group. Developing countries such as India (1.24 subscriptions per 100 people) and the Lao PDR (0.16 subscription per 100 people) are concentrated at the lower end. However, this is not to say that Asian nations are falling behind in digital connectivity. The entrance of affordable smart phones, and a rapidly growing middle class, saw Asia account for 48.4% of global internet users in 2015.16
15 Data available for 46 ASEM countries only. At the time of data extraction, data for Cambodia, China, Italy, Luxembourg and Myanmar were not available.
16 Internet Live Stats (2015) Internet Users in Asia November 2015. Available at: http://internetworldstats.com/stats3.htm [Accessed 13 February 2016].
CONNECTIVITY: Facts and Perspectives
Volume I: Data on Connectivity ASEF Outlook Report 2016/2017 19
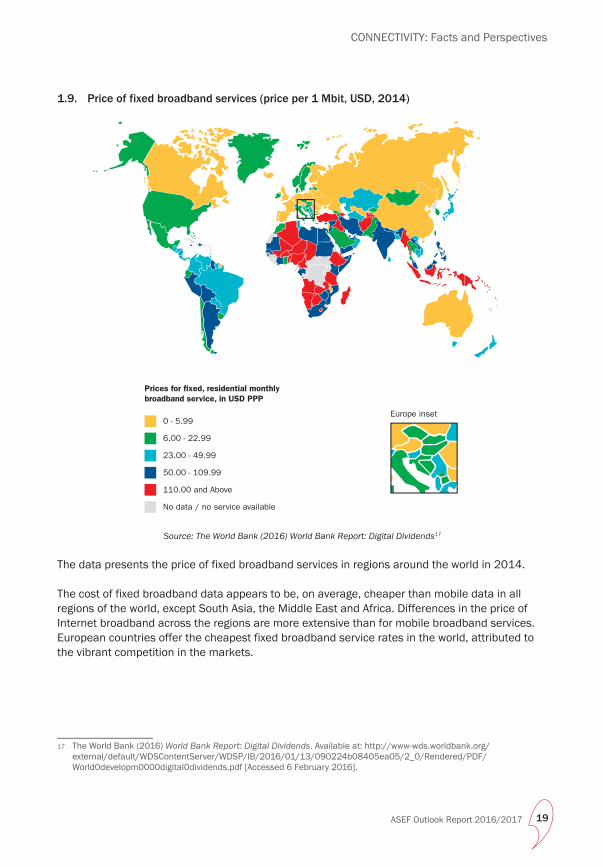
1.9. Price of fixed broadband services (price per 1 Mbit, USD, 2014)
No data / no service available
Prices for fixed, residential monthlybroadband service, in USD PPP
Europe inset
110.00 and Above
0 - 5.99
23.00 - 49.99
50.00 - 109.99
6.00 - 22.99
Source: The World Bank (2016) World Bank Report: Digital Dividends17
The data presents the price of fixed broadband services in regions around the world in 2014.
The cost of fixed broadband data appears to be, on average, cheaper than mobile data in all regions of the world, except South Asia, the Middle East and Africa. Differences in the price of Internet broadband across the regions are more extensive than for mobile broadband services. European countries offer the cheapest fixed broadband service rates in the world, attributed to the vibrant competition in the markets.
17 The World Bank (2016) World Bank Report: Digital Dividends. Available at: http://www-wds.worldbank.org/external/default/WDSContentServer/WDSP/IB/2016/01/13/090224b08405ea05/2_0/Rendered/PDF/World0developm0000digital0dividends.pdf [Accessed 6 February 2016].

1. Digital Connectivity
Volume I: Data on Connectivity20 ASEF Outlook Report 2016/2017
1.10. Time spent using the Internet (average hours per day, 2014)
EuropeanASEMCountries
Asian ASEMCountries
Access through laptop/desktop
Access through mobile deviceAccess through laptop/desktop
Access through mobile device
0
7
6.3
5.5
5.2
5.1
5.1
4.9
4.8
4.7
4.5
4.1
4.0
3.9
3.3
4.1
2.7
3.4
3.7
1.8
1.7
2.3
2.2
1.5
1.9
1.3
6
5
4
3
2
1
Philip
pines
Thail
and
Viet
Nam In
dia
Mala
ysia
Polan
d
Russia
n Fe
dera
tion
Sing
apor
eIta
ly
Austra
liaSp
ain
Franc
e
4.0
1.9
United
King
dom
3.7
1.9
German
y
3.9
2.6
China
3.4
3.1
1.8
1.0
Kore
aJa
pan
3.4
1.7
Nethe
rland
s
Indo
nesia
5.1
3.2
Source: Kemp, S. (2015) Digital, Social & Mobile in 201518
The data captures the average number of hours spent by Internet users per day (only including people with access to Internet) in selected ASEM countries19; it distinguishes between hours spent on the Internet accessed via personal computers and mobile devices.
The average Internet user spends around 4 hours and 25 minutes each day online, with Southeast Asian countries registering the highest average daily use. Filipino Internet users spend more than 6 hours per day online, with Thais, Vietnamese, Indonesians and Malaysians also all averaging more than 5 hours of use per day, while European countries range from at most 4.9 hours a day (Poland) to 3.4 hours a day (Netherlands). However, it is important to note that most people in emerging countries do not have Internet access. This group represents a minority of the population. What we do see, however, is that when people in the Philippines, for example, do get online Internet usage becomes a significant activity in their daily routine.
18 Kemp, S. (2015) Digital, Social & Mobile in 2015. Available at: http://wearesocial.sg/blog/2015/01/digital-social-mobile-2015/ [Accessed 8 March 2016].
19 Data available for 19 ASEM countries only.
CONNECTIVITY: Facts and Perspectives
Volume I: Data on Connectivity ASEF Outlook Report 2016/2017 21
European countries also significantly prefer to access the Internet via their personal computers, spending on average less than 2 hours on their mobile devices to connect to the Internet. Compare this to countries like Philippines, Thailand and Viet Nam where people spend on average 3.4 hours a day accessing the Internet on their phones. This could be due to the younger population demographics in Asia relative to the ageing population in Europe. Japan has the least time spent accessing the Internet through mobile devices.
1. Digital Connectivity
Volume I: Data on Connectivity22 ASEF Outlook Report 2016/2017
1.11. Top 10 languages used in the Internet (millions of users, 2015)
Asian Language
European Language
World Population for this Language (2015 Estimate)
441,052,395
375,241,253
263,260,385
126,919,659
146,267,288
286,937,168
385,389,434
114,963,827
103,147,691
98,915,747
97,729,532
95,324,47183,738,911
2,342,890,251734,013,009
256,787,878
168,176,008
131,903,391
Spanish
Arabic
Portuguese
Japanese
Russian
Malay
French
German
Rest of theLanguages
English 872,950,2661,398,283,969
704,484,3961,398,335,970
Chinese
Asian & European Language
Other Language
Source: Internet World Stats (2016) Internet World Users by Language20
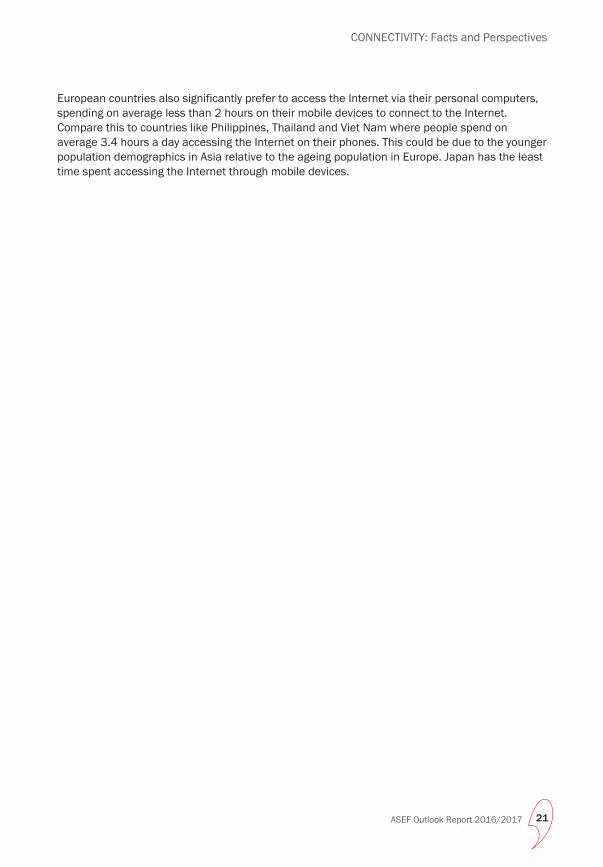
The data presents the 10 most widely used languages on the Internet in 2015. It features 4 European languages, 4 Asian languages, 1 Asian & European language and 1 other language. The 6 official languages of the United Nations (Arabic, Chinese, English, French, Russian and Spanish) are all included in the top 10.
20 Internet World Stats (2016) Internet World Users by Language. Available at: http://www.internetworldstats.com/stats7.htm [Accessed 8 March 2016].

CONNECTIVITY: Facts and Perspectives
Volume I: Data on Connectivity ASEF Outlook Report 2016/2017 23
English is the most widely used language on the Internet, followed by Chinese, Spanish, Arabic and Portuguese. While English remains the most pervasive language on the Internet, its users’ growth has been rather slow. In comparison, Arabic-speaking Internet users have experienced the steepest growth, followed by Russian and Chinese speakers. Meanwhile the population of users that has grown most slowly in the last 15 years are mostly European, with the exception of Japan. These populations also appear to have the highest rates of Internet penetration (90.6% for Japanese, 87.8% for German), suggesting a continued slow user growth to come, relative to the emerging ASEM countries with lower penetration rates (Arabic 44.8%, Chinese 50.4%, Malay 34.5%).
This information is insightful because, as more information is accessed online, Internet access becomes increasingly important for economic productivity and a well-informed citizenry.21 Where previously the dominance of European languages had limited the spread of Internet use by excluding those not fully literate in those languages, it appears that more Asian languages, particularly Chinese, are coming to the fore. With greater Internet adoption rates, more Internet content in these languages become available, which in turn fuels the Internet penetration rates in these countries.22 This has important implications for connectivity between Asia and Europe in the spirit of creating a global Internet and enhancing the spread of information and knowledge to support economic growth and greater people to people links.
21 Viard, V.B. and Economides, N. (2015) ‘The Effect of Content on Global Internet Adoption and the Global 'Digital Divide’, Management Science Articles in Advance, pp. 1-22. Available at: http://www.stern.nyu.edu/networks/The_Effect_of_Content_on_Global_Internet_Adoption.pdf [Accessed 30 January 2016].
22 Ibid.
1. Digital Connectivity
Volume I: Data on Connectivity24 ASEF Outlook Report 2016/2017
1.12. Internet users by language (% of total Internet users, 2015)
European Languages
Asian Languages Asian & European Languages
Other Languages
English
Chinese
SpanishArabic
Portuguese
Japanese
Russian
Malay
French
German
Rest of the Languages
25.9 %
20.9 %
%7.65.0 %
3.9 %
3.4 %
3.1 %
2.9 %
2.9 %
2.5 %
21.8 %
Source: Internet World Stats (2016) Internet World Users by Language23
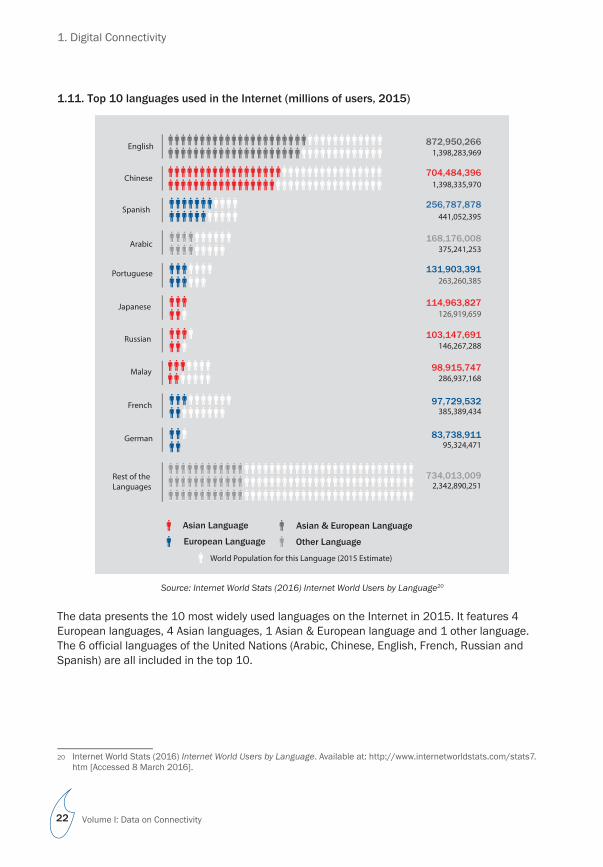
The data presents the 10 largest groups of Internet users by their language of use on the Internet in 2015.
The users of these 10 languages account for 78.2% of all Internet users. With rapidly increasing access to the Internet in developing countries, Arabic-, Russian- and Chinese-speaking Internet users are set to grow tremendously. If Chinese users keep pace with the current growth rate, they will likely overtake English speaking users as the biggest group of Internet users.
23 Internet World Stats (2016) Internet World Users by Language. Available at: http://www.internetworldstats.com/stats7.htm [Accessed 8 March 2016].
CONNECTIVITY: Facts and Perspectives
Volume I: Data on Connectivity ASEF Outlook Report 2016/2017 25
1.13. Dominating social media networks worldwide (2011)
No data
Mixi
VKontakte
QZone
Zing
Draugiem
Cloob
Odnoklassniki
Orkut
Source: Henrikson, J. H. (2011) The Growth of Social Media: An Infographic24
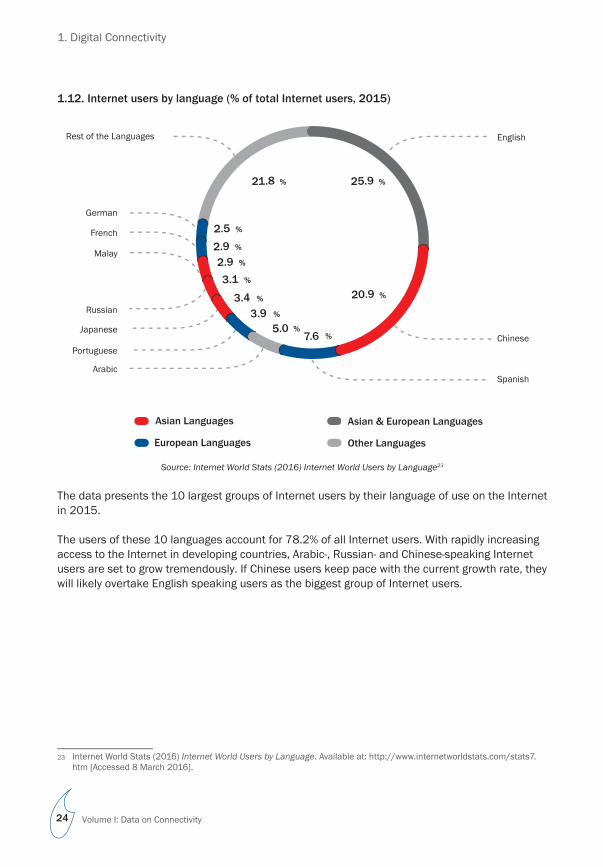
The infographic showcases the top social media networks worldwide. US-based Facebook, with near 1.6 billion monthly active users, is the dominant social network. As of 2016, Facebook is also the top social network in Europe with 323 million users and in a significant part of Asia with 540 million users.25
With social media platforms like Facebook and Twitter extending their reach across Asia and Europe, they serve as opportune platforms for connectivity, as they create large webs of people to people links, facilitate cultural exchanges, change the way news is distributed and even change how government bodies reach out to civil society.
24 Henrikson, J. H. (2011) The Growth of Social Media: An Infographic. Available at: http://www.searchenginejournal.com/the-growth-of-social-media-an-infographic/32788/ [Accessed 8 March 2016].
25 VincosBLog (2016) World Map of Social Networks. Available at: http://vincos.it/world-map-of-social-networks/ [Accessed 18 February 2016].

1. Digital Connectivity
Volume I: Data on Connectivity26 ASEF Outlook Report 2016/2017
1.14. Active accounts on the leading social network (% of population, 2014)
0%
100%
66 %
59 %
57 %
55 %
49 %
47 %
46 %
45 %
40 %
35 %
34 %
31 %
30 %
28 %
19 %
9 %
50%
Sing
apor
e
United
King
dom
Aust
ralia
Malays
ia
Thail
and
Spain Ita
ly
Fran
ce
Philip
pines
German
y
Polan
d
Viet N
amKo
rea
Indo
nesia
Japa
nIn
dia
46 %
China
European ASEM CountriesAsian ASEM Countries
45 %
Russia
n Fe
dera
tion
Source: Kemp, S. (2015) Digital, Social & Mobile in 201526
The data captures the number of active accounts on the respective leading social networks for 18 ASEM countries, as a percentage of their population.27 Facebook features as the top social platform for the majority of the countries, with the exception of Tencent in China and VKontakte in the Russian Federation.
The data reflects the penetration of social media as a frequent online activity among the population. The majority of the ASEM countries listed frequent social media above the global average (29% of global population have an active account on their respective country’s leading social network), highlighting the increasing presence of social media in many ASEM countries today.
26 Kemp, S. (2015) Digital, Social & Mobile in 2015. Available at: http://wearesocial.sg/blog/2015/01/digital-social-mobile-2015/ [Accessed 8 March 2016].
27 There may be slight discrepancies as the data for each social media platform was collected in different periods across 2014 and 2015.

CONNECTIVITY: Facts and Perspectives
Volume I: Data on Connectivity ASEF Outlook Report 2016/2017 27
There is some variation amongst the lowest performing countries. Indonesia and India’s low shares of active accounts on Facebook may be explained by the low rate of Internet penetration (17.1% and 18.0% respectively). Amongst those with access to social media, usage is high, with the average number of hours per day spent at 2.9 in Indonesia and 2.5 in India.
On the other hand Japan, with 19% active social media usage, has an Internet penetration rate of 90.6%. Compared to India and Indonesia, this suggests limited receptiveness to social media in Japan.

1. Digital Connectivity
Volume I: Data on Connectivity28 ASEF Outlook Report 2016/2017
1.15. Time spent on social media (average hours per day, 2014)
0
5.0
4.3
3.8
3.5
3.1
2.9
2.6
2.5 2.
52.
5
2.2
2.1
2.1
2.1
2.0
1.9
1.9
2.5
Philip
pines
Thail
and
Malays
ia
Viet N
am
Indo
nesia
Russia
n Fe
dera
tion
India Ita
ly
Sing
apor
e
United
King
dom
Aust
ralia
German
y
Polan
d
Fran
ce
Nethe
rland
sSp
ain
European ASEM CountriesAsian ASEM Countries
1.7
1.3
0.7
China
Kore
aJa
pan
Source: Kemp, S. (2015) Digital, Social & Mobile in 201528
The data captures the average number of hours spent using social media each day, based on people who use social media, excluding non-users, in selected ASEM countries.29 Social networking has become the most popular online activity worldwide, accounting for one in every four minutes online.30 While Internet users still make up a relatively small group of the population in developing countries, they tend to be more active compared to European users, with social media making up a large proportion of their time spent online. Compared to developed countries, where social media saturation point has been reached, developing countries use new social media sites at much higher rates.
28 Kemp, S. (2015) Digital, Social & Mobile in 2015. Available at: http://wearesocial.sg/blog/2015/01/digital-social-mobile-2015/ [Accessed 8 March 2016].
29 Data available for 19 ASEM countries only. 30 Global Web Index (2015) GWI Social Summary Q1 2015. Available at: https://www.globalwebindex.net/hs-fs/
hub/304927/file-2812772150-pdf/Reports/GWI_Social_Summary_Report_Q1_2015.pdf [Accessed 19 February 2016].
CONNECTIVITY: Facts and Perspectives
Volume I: Data on Connectivity ASEF Outlook Report 2016/2017 29
The age distribution of the country also carries some influence, with a larger younger demographic correlating to more time spent on social media, as in Southeast Asian countries such as Thailand and Indonesia. On the other hand, the ageing populations in Europe, as well as Korea and Japan, spend less than 2 hours a day on social media sites with Japan trailing behind at just 0.7 hours a day. In an analysis of the age distribution of social media users on top social media sites (Facebook, Twitter and LinkedIn), users aged 55 years and above made up less than 10% of all social media users, while the 16-34 age group accounted for more than half of all users.31
31 Statista (2014) Age Distribution of Active Social Media Users Worldwide as of 3rd Quarter 2014, by Platform. Available at: http://www.statista.com/statistics/274829/age-distribution-of-active-social-media-users-worldwide-by-platform/ [Accessed 19 February 2016].
1. Digital Connectivity
Volume I: Data on Connectivity30 ASEF Outlook Report 2016/2017
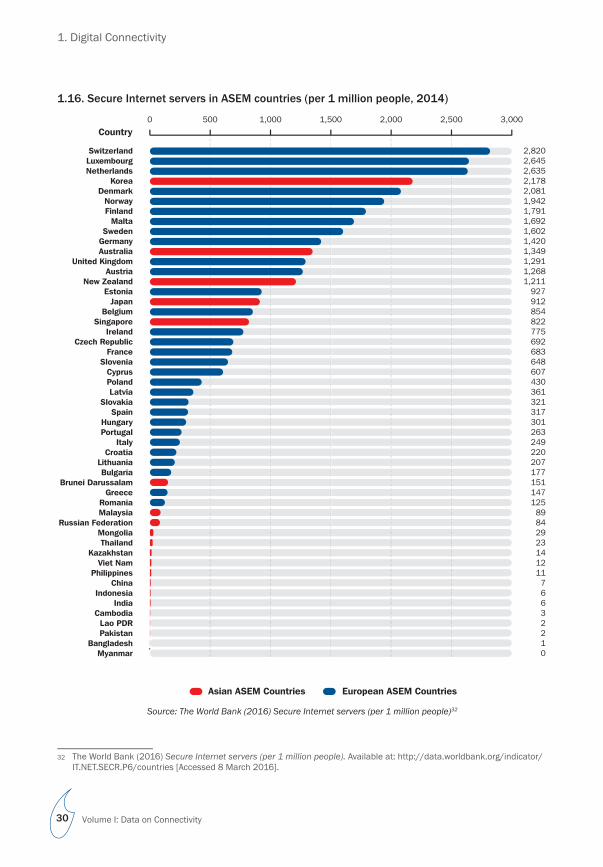
1.16. Secure Internet servers in ASEM countries (per 1 million people, 2014)
Country
SwitzerlandLuxembourgNetherlands
KoreaDenmark
NorwayFinland
MaltaSweden
GermanyAustralia
United KingdomAustria
New ZealandEstonia
JapanBelgium
SingaporeIreland
Czech RepublicFrance
SloveniaCyprusPolandLatvia
SlovakiaSpain
HungaryPortugal
ItalyCroatia
LithuaniaBulgaria
Brunei DarussalamGreece
RomaniaMalaysia
Russian FederationMongoliaThailand
KazakhstanViet Nam
PhilippinesChina
IndonesiaIndia
CambodiaLao PDRPakistan
BangladeshMyanmar
2,8202,6452,6352,1782,0811,9421,7911,6921,6021,4201,3491,2911,2681,211
9279128548227756926836486074303613213173012632492202071771511471258984292314121176632210
0 3,000500 1,000 1,500 2,000 2,500
European ASEM CountriesAsian ASEM Countries
Source: The World Bank (2016) Secure Internet servers (per 1 million people)32
32 The World Bank (2016) Secure Internet servers (per 1 million people). Available at: http://data.worldbank.org/indicator/IT.NET.SECR.P6/countries [Accessed 8 March 2016].

CONNECTIVITY: Facts and Perspectives
Volume I: Data on Connectivity ASEF Outlook Report 2016/2017 31
Secure Internet servers use encryption technology to protect data from unauthorised interception, guaranteeing secure online transactions. This is indicative of e-commerce in the country.
In the last two decades, developing countries have seen a surge in the number of subscriptions to fixed and mobile broadband, reducing the digital divide. However, there still exists a gap in more advanced ICT technologies. As captured in the data set, while developed European and Asian countries have more than 300 secure internet servers per 1 million people, with countries like Switzerland, Luxembourg and Netherlands exceeding the 2,500 per 1 million people mark, developing Asian countries have less than 30 secure internet servers per 1 million people.

1. Digital Connectivity
Volume I: Data on Connectivity32 ASEF Outlook Report 2016/2017
1.17. Global Cybersecurity Index (2015)
Country
AustraliaMalaysia
New ZealandNorwayEstonia
Germany India
Japan Korea
United KingdomAustria
HungaryNetherlands
SingaporeLatvia
SwedenFinland
Slovakia Denmark
FranceSpain
Italy Poland
Czech RepublicRussian Federation
IndonesiaLuxembourg
Romania BelgiumBulgaria
ChinaLithuania
Croatia MongoliaThailand
Brunei Darussalam Myanmar
MaltaPhilippines Switzerland
Viet NamBangladesh
Cyprus PortugalGreeceIreland
KazakhstanPakistanSlovenia
Cambodia Lao PDR
0.7650.7650.7350.7350.7060.7060.7060.7060.7060.7060.6760.6760.6760.6760.6470.6470.6180.6180.5880.5880.5880.5590.5290.5000.5000.4710.4710.4710.4410.4410.4410.4410.4120.4120.4120.3820.3820.3530.3530.3530.3240.2940.2940.2940.2060.2060.1760.1760.1760.1180.059
European ASEM CountriesAsian ASEM Countries
0 0.1 0.2 0.3 0.4 0.5 0.6 0.7 0.8
Source: International Telecommunication Union (2015) Global Cybersecurity Index & Cyberwellness Profiles33
33 International Telecommunication Union (2015) Global Cybersecurity Index & Cyberwellness Profi les. Available at: http://www.itu.int/dms_pub/itu-d/opb/str/D-STR-SECU-2015-PDF-E.pdf [Accessed 8 March 2016].
CONNECTIVITY: Facts and Perspectives
Volume I: Data on Connectivity ASEF Outlook Report 2016/2017 33
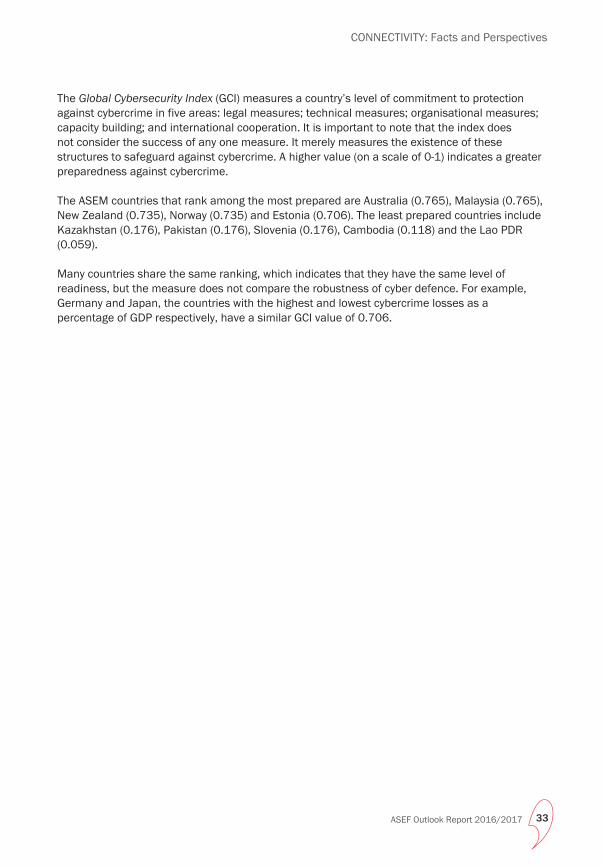
The Global Cybersecurity Index (GCI) measures a country’s level of commitment to protection against cybercrime in five areas: legal measures; technical measures; organisational measures; capacity building; and international cooperation. It is important to note that the index does not consider the success of any one measure. It merely measures the existence of these structures to safeguard against cybercrime. A higher value (on a scale of 0-1) indicates a greater preparedness against cybercrime.
The ASEM countries that rank among the most prepared are Australia (0.765), Malaysia (0.765), New Zealand (0.735), Norway (0.735) and Estonia (0.706). The least prepared countries include Kazakhstan (0.176), Pakistan (0.176), Slovenia (0.176), Cambodia (0.118) and the Lao PDR (0.059).
Many countries share the same ranking, which indicates that they have the same level of readiness, but the measure does not compare the robustness of cyber defence. For example, Germany and Japan, the countries with the highest and lowest cybercrime losses as a percentage of GDP respectively, have a similar GCI value of 0.706.

1. Digital Connectivity
Volume I: Data on Connectivity34 ASEF Outlook Report 2016/2017
1.18. Top 9 ASEM countries where hacker activities originate (2013)
255,777Australia
350,948Romania
133,908Japan
168,146China
2,402,722
RussianFederation
162,235Poland
780,425Germany
288,607Italy
367,966Hungary
Source: Go-Gulf (2013) Cyber Crime Statistics and Trends34
The data presents 9 ASEM countries where the highest number of hacker activities, detected in February 2013, originated. The exploitation of computer systems and technology dependent establishments and networks by hackers is understood as a hacker activity. Hackers use malicious code to mutate computer code and logic which, in turn, compromises data. It is one of many types of cybercrimes and is usually a precursor to other forms of cybercrimes, such as information and identity theft.35
The Russian Federation has the worst record, with 2,402,722 hacker activities in February 2013. Its position at the top may be explained by the level of technological proficiency in Russian cyber hackers.
34 Go-Gulf (2013) Cyber Crime Statistics and Trends. Available at: http://www.go-gulf.com/blog/cyber-crime/ [Accessed 8 March 2016].
35 Kim, Y., Kim, I., Park, N. (2014) ‘Analysis of Cyber Attacks and Security Intelligence’. In: Park, J.J.J.H., Adeli, H., Park, N., Woungang, I. ed(1). Mobile, Ubiquitous, and Intelligent Computing MUSIC 2013. Springer Berlin Heidelberg. Available at: http://link.springer.com/chapter/10.1007%2F978-3-642-40675-1_73 [Downloaded 3 March 2016]
CONNECTIVITY: Facts and Perspectives
Volume I: Data on Connectivity ASEF Outlook Report 2016/2017 35
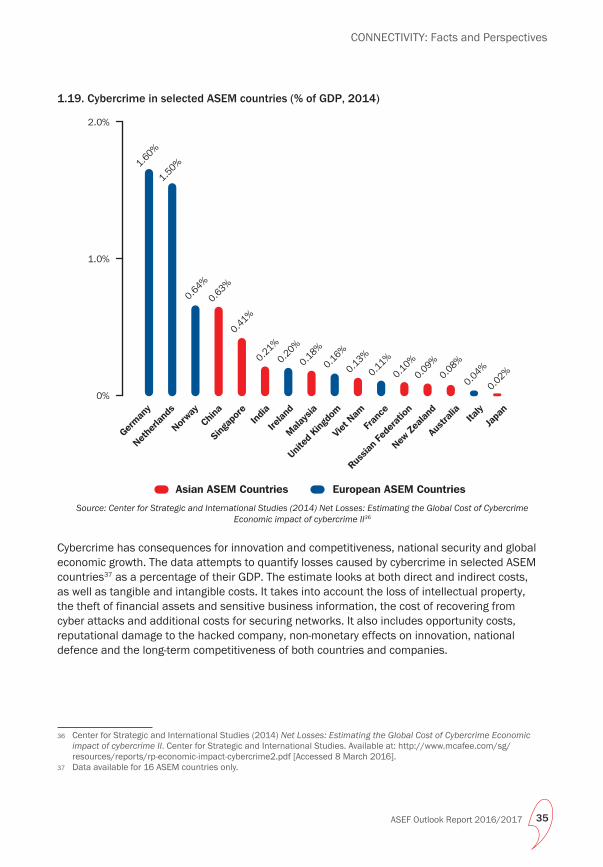
1.19. Cybercrime in selected ASEM countries (% of GDP, 2014)
0%
2.0%
1.60
%
1.50
%
0.64
%
0.63
%
0.41
%
0.21
%
0.20
%
0.18
%
0.16
%
0.13
%
0.11
%
0.10
%
0.09
%0.
08%
0.04
%
0.02
%
1.0%
German
y
Nethe
rland
s
Norway
China
Sing
apor
eIn
dia
Irelan
d
Malays
ia
United
King
dom
Viet N
am
Fran
ce
Russia
n Fe
dera
tion
New Z
ealan
d
Aust
ralia
Italy
Japa
n
European ASEM CountriesAsian ASEM Countries
Source: Center for Strategic and International Studies (2014) Net Losses: Estimating the Global Cost of Cybercrime Economic impact of cybercrime II36
Cybercrime has consequences for innovation and competitiveness, national security and global economic growth. The data attempts to quantify losses caused by cybercrime in selected ASEM countries37 as a percentage of their GDP. The estimate looks at both direct and indirect costs, as well as tangible and intangible costs. It takes into account the loss of intellectual property, the theft of financial assets and sensitive business information, the cost of recovering from cyber attacks and additional costs for securing networks. It also includes opportunity costs, reputational damage to the hacked company, non-monetary effects on innovation, national defence and the long-term competitiveness of both countries and companies.
36 Center for Strategic and International Studies (2014) Net Losses: Estimating the Global Cost of Cybercrime Economic impact of cybercrime II. Center for Strategic and International Studies. Available at: http://www.mcafee.com/sg/resources/reports/rp-economic-impact-cybercrime2.pdf [Accessed 8 March 2016].
37 Data available for 16 ASEM countries only.
ASEF Outlook Report 2016/2017
1. Digital Connectivity
Volume I: Data on Connectivity36
Most of the countries featured are high income countries, a prime target for cybercriminals. As well as offering greater ease of access to vital information through the transition to an electronic infrastructure (e.g. financial systems and social networks), developed countries also promise more profitable returns. There is wide variation in cybercrime losses within the group. Germany features the highest losses (1.60%) as a percentage of GDP, while Japan and Italy rank last with losses of 0.02% and 0.04% of GDP respectively. Japan’s language may act as a natural layer of defence against cybercrime, thus explaining its position at the bottom. Overall, differences in the thoroughness of national accounting could account for the variation amongst the countries, as their level of security defences and income levels do not diverge tremendously.
Developing countries are also becoming increasingly popular targets as their access to, and usage of, the Internet for commercial purposes continues to grow. While few developing countries were featured in the list, it could be that many developing countries see greater losses than are recorded, as they tend not to record cybercrime statistics.