1 director ownership, governance and performance sanjai - leeds
TRANSCRIPT
1
Director Ownership, Governance and Performance
Sanjai Bhagat*
Brian Bolton
September 2011 Keyword: Corporate governance, Sarbanes-Oxley G30
* Corresponding author. Bhagat, [email protected], University of Colorado at
Boulder, Leeds School of Business, UCB 419, Boulder, CO, 80309-0419, (303) 492-7821;
Bolton, [email protected], Portland State University, School of Business Administration, P.O.
Box 751, Portland, OR, 97207-0751, (503) 725-5933.We thank an anonymous referee, Andrew
Metrick and seminar participants at Harvard University, and American Finance Association
meetings for constructive comments on a previous draft of this paper.

2
Abstract
We study the impact of Sarbanes-Oxley Act on the relationship between corporate
governance and company performance. We consider five measures of corporate governance
during the period 1998-2007. We find a significant negative relationship between board
independence and operating performance during the pre-2002 period, but a positive and
significant relationship during the post-2002 period.
Our most important contribution is a proposal of a governance measure, namely – dollar
ownership of the board members – that is simple, intuitive, less prone to measurement error, and
not subject to the problem of weighting a multitude of governance provisions in constructing a
governance index.
3
I. Introduction
The corporate scandals of the early 2000s, including Enron, Worldcom, Tyco and others,
led to a wave of regulation aimed at improving the corporate governance environment. A
common feature of this was the implementation of guidelines concerning the independence of
the members of the board of directors. For example, the Sarbanes-Oxley Act of 2002 (SOX )
mandates that all members of a listed firm’s audit committee must be independent. Soon
thereafter, both the New York Stock Exchange and the NASDAQ Stock Market required all
listed companies to have a majority of independent directors.
The regulatory and institutional focus on board independence is surprising given that
most of the prior academic research found no statistical relationship, and, in many cases, found a
negative relationship, between board independence and firm performance. The above research,
however, focuses on time period prior to this recent wave of regulation aimed at increasing board
independence on boards and audit committees. Even those studies that do include some post-
2002 data mostly include pre-2002 data, so it is difficult to separate the findings into pre-
regulation and post-regulation relationships.
This paper fills the above gap in the literature: We study the relationships between
various measures of corporate governance – especially board independence – and firm
performance during the period 1998-2007. We explicitly separate the sample period into pre-
2002 and post-2002 sub-periods to focus on the effects of the regulation. While we confirm the
negative relationship between board independence and firm performance (that most prior
research has identified) for the pre-2002 period, this result is reversed for the post-2002 period.
During the years 2003-2007, greater board independence is positively correlated with operating
performance. In other tests, we find that this result is driven by firms that increase their number

4
of independent directors. An event study provides independent evidence supportive of the above
results – specifically, when a company goes from being non-compliant to being compliant with
SOX’s board independence requirement, the market response is significantly positive. The above
findings are consistent with and supportive of the event-study results of Chhaochharia and
Grinstein (2007) and DeFond, Hann, and Hu (2005). Chhaochharia and Grinstein find that firms
that were less compliant with the rules imposed by SOX and the Exchanges earned more positive
abnormal returns on the announcement of the rules. DeFond, Hann and Hu document a positive
stock market reaction when a director with accounting expertise is appointed to the audit
committee.
While SOX specifically affects board independence, perhaps the increased scrutiny of all
firms’ corporate governance environments forces firms to implement better corporate
governance practices, regardless of how those governance practices are measured.1 As such,
board independence is not the only measure of governance that we consider. We find that the
dollar value of director stock ownership is positively related to operating performance both pre-
2002 and post-2002. We also find that whether or not a firm’s CEO is also the board chair is
negatively related to operating performance throughout the sample period. These findings are
consistent with prior literature. We also consider two popular corporate governance indices: the
G-Index of Gompers, Ishii and Metrick (GIM, 2003) and the E-Index of Bebchuk, Cohen and
Ferrell (BCF, 2009). During 1998-2001, both the G-Index and the E-Index suggest a positive
and significant relation between good governance and performance; these findings are consistent
with the extant literature. However, during 2003-2007, the G-Index suggests a negative and
1 For example, Brochet (2010) finds that Section 403 of SOX has brought about more timeliness and transparency in
the communication of insider trading.

5
significant relation between good governance and performance. Also, during 2003-2007, the E-
Index suggests an inconsistent relation between good governance and performance.
As many prior studies note, the relationship between corporate governance and company
performance is plagued by endogeneity concerns. It is unclear whether performance causes
governance or whether governance causes performance. To account for this, we utilize a four-
equation system to allow for governance, performance, ownership, and capital structure to be
potentially endogenous. We adopt an instrumental variables approach to estimate the system of
equations, checking for the validity and strength of our instruments, and specification of the
system of equations. In addition, as a robustness check we consider alternative methodologies
less susceptible to the endogeneity concern – with consistent results.
Although most prior research has not found a positive relationship between board
independence and firm performance prior to 2002, some research has found support for board
independence in specific situations. Hermalin and Weisbach (2005) develop a model predicting
that board independence provides greater oversight of managerial actions. Bhagat and Bolton
(2008) find that firms with greater board independence are more likely to replace the CEO
following periods of bad performance. We extend this CEO turnover test to our sample period
and find this result persists in the post-2002 time period. In sum, these findings are consistent
with the notion that the wave of corporate governance regulation that occurred during 2002 may
have had some desired effect. Specifically, post-2002, companies whose boards are more
independent are positively correlated with better operating performance.
In addition to studying the changing nature of corporate governance across the pre-2002
and post-2002 sub-periods, we make five addition contributions to the literature. First, consistent
with the Efficient Market Hypothesis, we show that none of the governance measures are

6
correlated with current or future stock market performance, in contrast to the claims in papers
such as GIM and BCF. Second, we find that given poor firm performance, the probability of
disciplinary management turnover is positively correlated with stock ownership of board
members and board independence. However, given poor firm performance, the probability of
disciplinary management turnover is negatively correlated with better governance measures as
proposed by GIM and BCF. In other words, so called “better governed firms” as measured by
the GIM and BCF indices are less likely to experience disciplinary management turnover in spite
of their poor performance. Third, we find that firms with greater stock ownership of board
members and board independence are less likely to engage in a value-destroying activity,
namely, acquisitions. On the other hand, better governed firms as measured by the GIM and BCF
indices are more likely to engage in acquisitions. Fourth, we show that firms that are not
compliant with SOX have significantly higher abnormal returns upon becoming compliant than
do non-compliant firms that stay non-compliant; this is consistent with and supportive of the
results of Chhaochharia and Grinstein (2007) and DeFond, Hann, and Hu (2005). The most
important contribution of this paper is our proposal of a governance measure, namely – dollar
ownership of the board members – that is simple, intuitive, less prone to measurement error, and
not subject to the problem of weighting a multitude of governance provisions in constructing a
governance index. Consideration of this governance measure by future researchers would
enhance the comparability of research findings with more robust progress in governance
research.
The remainder of this paper is organized as follows. The next section discusses the
relevant literature. Section 3 introduces our model specification and sample. Section 4 presents
the results on the relationship between corporate governance and company performance. Section

7
5 discusses results of an event study where we focus on the announcement by sample firms of
the nomination of additional independent directors that would enable the firm to comply with
SOX’s board independence requirement for the audit committee. Section 6 considers the
relationship between corporate governance, company performance, and CEO turnover. Section 7
considers the relationship between corporate governance and M&A deals. Section 8 notes our
conclusions.
II. Corporate Governance and Board Independence
The relationship between board independence and firm performance is one of the most
studied relationships in the corporate governance literature. Hermalin and Weisbach (1991) find
no relationship between board composition and performance (using Tobin’s Q as the
performance measure). Agrawal and Knoeber (1996) study the interrelationships among seven
corporate governance mechanisms and find a negative relationship between independence and
firm performance (as measured by Tobin’s Q). Bhagat and Black (2002) document that firms
with more independent boards do not perform better, using a variety of performance measures.
They also find that poorly performing firms are more likely to increase the number of
independent directors, but that this does not improve performance. More recently, Bhagat and
Bolton (2008) find a negative relationship between board independence and operating
performance. The overwhelming majority of work finds that having a more independent board
of directors does not lead to better performance and may actually lead to worse performance.
Adams and Ferreira (2007) introduce a model that suggests CEOs may be reluctant to
share information with more independent boards, thereby decreasing shareholder value. This
suggests that the requirements of SOX and the stock exchanges for firms to increase director

8
independence may potentially be detrimental to firm value. Laux (2008) presents a model
considering CEO turnover and board independence, and shows that greater board independence
might be detrimental to the firm because independent boards might be too active in replacing the
CEO and in formulating CEO compensation. Raheja (2005) looks at the board’s monitoring role
with respect to investment projects. In her model, inside directors have more knowledge of the
firm’s investments, so the optimal board structure will depend on the project verification costs to
outsiders and private benefits from projects to insiders. This suggests greater board
independence can be beneficial in some firms while being detrimental in other firms. Similarly,
Coles, Daniel and Naveen’s (2008) work suggests that smaller and more independent boards may
not be superior in all cases. Using data from 1997-2000, Gillan, Hartzell and Starks (2007) show
that firms with more powerful boards (or more independent boards) also have higher G-Index
scores, suggesting that managers may become more entrenched to protect themselves from the
oversight of an independent board. Finally, Chhaochharia and Grinstein (2007) find that firms
that were less compliant with the rules imposed by SOX and the Exchanges earned positive
abnormal returns on the announcement of the rules, relative to firms that were more compliant.
One common feature of these studies is that they mostly focus on boards and
relationships prior to 2002. It is rare to see an exogenous shock to the corporate governance
landscape, but the increased regulation of 2002 may be just the kind of event to provide a
demarcation of corporate governance regimes. Section 301 of SOX mandates that the audit
committees of public firms comprise entirely of independent directors and that the audit
committee contain at least one ‘finance expert.’ While firms could meet the independence
requirement by removing affiliated directors from the board, some firms might have to add

9
independent directors in order to meet the ‘finance expert’ requirement.2 Further, it stipulates
that if a firm does not have a stand-alone audit committee, then the entire board functions as the
audit committee and it, therefore, must comprise entirely of outside directors. Subsequent to the
passage of SOX, the New York Stock Exchange and the NASDQ Stock Market simultaneously
instituted standards requiring listed companies to have a majority of independent directors. This
regulation did force firms to add independent directors, as fewer than 80% of firms had majority
of independent directors in 2003.3 Further, SOX and the listing standards impose new
responsibilities on firms’ directors, such as regular meetings of the independent directors,
approval of director nominations by independent directors, and approval of CEO compensation
by independent directors. As a consequence of these policies boards began including more
independent directors4, and, arguably the independent directors became more engaged in the
firm’s governance processes.
While the explicit objective of the SOX and exchange regulations is increasing and
improving board effectiveness through greater independence, it is possible that the firm’s entire
corporate governance environment changes, regardless of how corporate governance is
measured. There are many plausible proxies for corporate governance, but there is no agreed
upon “best” measure. As such, it is possible these other measures have also been impacted by
the new regulations. GIM create a Governance Index (G-Index) using 24 anti-takeover
provisions. They show that firms with strong shareholder rights outperform firms with weak
2 See Securities Exchange Act Release No. 47137 (January 8, 2003), 68 FR 2637, (January 17, 2003), or
http://www.sec.gov/rules/sro/34-48745.htm.
3 Firms could also meet the independence requirement by removing employee and affiliated directors from the board
and reducing the size of the board.
4 As shown in Table 1, the percentage of directors that are independent increased from 62% in 1998 to 72% in 2007.

10
shareholder rights by 8.50 percent per year during the 1990s. They further show that firms with
strong shareholder rights have higher firm value, higher profits and higher sales growth. Core,
Guay and Rusticus (2006) extend this work and show that firms with weaker governance as
measured by G-Index have lower operating performance (and that this is anticipated by the
market). BCF modify the G-Index using only six of the 24 provisions to create an Entrenchment
Index (E-Index), and find that firms with higher E-Index scores (associated with weaker
governance) have lower firm valuation.
Beyond looking at indices that comprise of various corporate governance components, a
substantial body of work considers individual firm characteristics as measures of corporate
governance. These studies focus on the relationship between one single firm governance
characteristic and firm performance. The literature on board independence and firm performance
is discussed above. Brickley, Coles and Jarrell (1997) study the benefits and costs of having the
CEO also serve as the board chair. Bhagat and Bolton (2008) and Bhagat and Tookes (2011)
consider the stock ownership of directors.
Can a single board characteristic be as effective a measure of corporate governance as
indices that include dozens of corporate charter and board characteristics?5 While, ultimately,
this is an empirical question, on both economic and econometric grounds it is possible. Bhagat,
Bolton, and Romano (2008) argue that since boards have the power to make (or at least ratify) all
important company decisions, it is plausible that board members with appropriate stock
ownership will have the incentive to provide effective monitoring and oversight of these
5 For example, Brown and Caylor’s (2006) Gov-Score index includes 51 factors, while commercial providers such
as RiskMetrics Group (formerly Institutional Shareholder Services), The Corporate Library, and Glass Lewis &
Company offer proprietary governance indices using, sometimes, several hundred governance characteristics.
11
important corporate decisions. Also, simple measures such as board independence and director
ownership can be a good proxy for overall good governance on econometric grounds: The
measurement error associated with a simple variable such as board independence can be much
less than the total measurement error in measuring a multitude of board processes, compensation
structures, and charter provisions. Further, construction of a governance index requires proper
weighting of these board characteristics, anti-takeover provisions, and compensation variables; if
the weights in the index are not the same as the (unobservable) weights used by informed market
participants in assessing the governance and performance relationship then incorrect inferences
would be made.
This paper is closest in spirit to Bhagat and Bolton (2008) (BB); however, we extend that
work in three ways: First, BB consider governance-performance relationships only during the
pre-SOX period of 1998-2002; we consider both pre-SOX (1998-2001) and post-SOX periods
(2003-2007). Given the scope of Sarbanes-Oxley and that it was the first such significant
corporate governance related regulation in decades, it is important to consider the extent to
which governance-performance relationships changed subsequent to the passage of SOX. For
example, board independence is negatively correlated with performance pre-SOX, but positively
correlated with performance post-SOX. Second, this study documents that firms which are not
compliant with SOX regarding audit committee independence have significantly higher
abnormal returns upon becoming compliant than do non-compliant firms that stay non-
compliant; BB do not consider any market responses to changes in board structure. Finally, BB
consider governance-performance relationships during 1998-2002 and propose a new
governance measure – namely, dollar ownership of board directors. This study corroborates the
statistical and economic significance of their governance measure with out-of-sample data.
12
III. Data Description and Model Specification
A. Data
Our primary source of corporate governance data is the RiskMetrics directors and
governance databases (formerly the Investor Responsibility Research Center, IRRC). In
addition, we use the Compustat Industrial Annual database for financial statement information,
the Center for Research in Security Prices (CRSP) database for stock market data, and the
Compustat Executive Compensation (Execucomp) database for CEO ownership and turnover
information. The SEC’s EDGAR database of SEC filings is also used to obtain specific
information from proxy statements.
The RiskMetrics databases track governance and director information for approximately
1,500 large U.S. companies from 1990 to 2007. The governance database provides corporate
anti-takeover provisions on these companies, plus the G-Index score used in Gompers, Ishii and
Metrick (2003). This database provides updates for 1990, 1993, 1995, 1998, 2000, 2002, 2004
and 2007. The director database provides detailed director information annually from 1996 to
2007. However, the director ownership data is not tracked consistently until 1998, so our
primary sample is for 1998 to 2007. The Execucomp database provides compensation and
ownership data on approximately 1,500 large U.S. firms annually from 1992-2007. There is
considerable overlap across these sources which: the final merged sample has 1,000 to 1,400
firms per year. The final sample is an unbalanced panel with 10 years of data from 1998 to
2007 and a total of over 13,000 firm-year observations.
B. Governance Variables

13
This study considers the following five measures of corporate governance6:
Independence – Board independence is measured as the percentage of directors who are
unaffiliated with the sample firm. This includes directors who are neither employees of the firm
and directors who do not have any identifiable relationship with the sample firm.
DirectorOwn – Director ownership is measured as the natural log of the dollar value of
common stock owned by the median director. We focus on the dollar value rather than
percentage of ownership because it serves as a more direct measure of director incentives.
Consistent with the political economy literature, we focus on the median director because they
have the ability to cast the deciding vote on board issues; see Shleifer and Murphy (2004) and
Milavonic (2004).
CEO-Duality – CEO-Chair duality is an indicator variable taking the value of 1 if the
CEO of the sample firm is also the board chair, and 0 otherwise.
G-Index – From GIM, the G- Index is the compilation of anti-takeover provisions in the
firm’s bylaws. The Index is comprised of 24 corporate charter provisions, with a possible Index
value ranging from 0 to 24. Consistent with GIM, higher Index values represent weaker
corporate governance while lower Index values represent stronger corporate governance.
E-Index – From BCF, the E-Index is a subset of the G-Index. It includes only 6 of the 24
corporate charter provisions believed consistent with entrenching management, thus taking a
6 In supplementary tests, we consider two other measures of corporate governance. BusyBoards is the percentage of
directors who serve on more than 3 corporate boards; our results are consistent with that of Fich and Shivdasani
(2006). IndepInsider is the number of sample firm’s executives on the board who hold at least one additional
outside directorship; our results are supportive of Masulis and Mobbs (2009).
14
value of 0 to 6.7 Again, higher Index values represent weaker corporate governance.
C. Performance Variables
Consistent with Barber and Lyon (1996) and Core, Guay and Rusticus (2006), we
consider Return on Assets (ROA) as our primary measure of firm operating performance. In
supplementary tests, we also use stock return (Return) and Tobin’s Q (TobinsQ) as alternative
measures of firm performance. Industry-adjusted performance is obtained by subtracting the
average performance of the sample firm’s 4-digit SIC code from the sample firm’s performance
measure.
D. Other Endogenous and Control Variables
In addition to governance and performance, ownership and capital structure are also
presumed to be endogenously determined. We consider CEOOwn% as the percentage of stock
owned by the CEO. Leverage is the capital structure measure, calculated as the long-term debt-
to-assets ratio.
Regarding the control variables: Prior literature, for example, Core, Holthausen and
Larcker (1999), Gillan, Hartzell and Starks (2003), and Core, Guay and Rusticus (2006),
suggests that industry performance, return volatility, growth opportunities and firm size are
important determinants of firm performance. Yermack (1996) documents a relation between
board size and performance. Demsetz (1983) suggests that small firms are more likely to be
closely-held suggesting a different governance structure than large firms. Theoretical work on
board independence (Hermalin and Weisbach (1998), Raheja (2005), Adams and Ferreira (2007),
and Harris and Raviv (2008)) suggests that more independent boards are not necessarily value-
7 The six provisions are staggered boards, limits to shareholder bylaw amendments, supermajority requirements for
mergers, supermajority requirements for charter amendments, poison pills, and golden parachutes.

15
enhancing, rather there is an optimal level of board independence depending on the information
cost that outside directors incur in becoming effective monitors. We consider the information
cost (InfoCost) variables as developed in Krishnaswami and Subramanian (1999) as a
determinant of board independence; specifically we consider the standard deviation of monthly
stock returns, and the standard deviation of analyst forecasts.
FirmSize is the natural log of assets for the firm. R&DAdvExp is the ratio of research and
development plus advertising expenses to assets; if the data are missing they are presumed to be
zero. MktBook is the ratio of market to book value of equity. BoardSize is the number of
directors on the board.
We adopt an instrumental variables approach to dealing with the potential endogeneity
among governance, performance, ownership and capital structure. We identify the following
primary instrumental variables used in the first-stage fitted regressions. We utilize three
instruments for the governance variables. Dir%Own is the average percentage of common stock
owned by all directors (this is different from DirectorOwn which is the natural log of the dollar
value of common stock owned by the median director). We use this variable as an instrument for
all five governance variables. Dir%CEOs is the percentage of directors who are CEOs; this
variable is used as an instrument for Independence, DirectorOwn and CEO-Duality. Hallock
(1997) and Westphal and Khanna (2003) emphasize the role of networks among CEOs that serve
on boards, and the adverse impact on the governance of such firms. Dir%15Ten is the
percentage of directors who have served on the board for at least 15 years; this variable is used as
an instrument for G-Index and E-Index. TreasStock is the ratio of treasury stock to assets, which
we use as the primary instrument for performance (as in Palia (2001)). CEOTenAge is the ratio
of CEO tenure to CEO age; this variable is used as the instrument for ownership. A CEO who

16
has had five years of tenure at age 65 is likely to be of different quality and have a different
equity ownership than a CEO that has had five years of tenure at age 50. These CEOs likely
have different incentive, reputation, and career concerns. Gibbons and Murphy (1992) provide
evidence on this. Therefore, we use the ratio of CEO tenure to CEO age as a measure of CEO
quality, which will serve as an instrument for CEO ownership. ZScore is the modified Altman’s
Z-Score (1968); this variable is used as the instrument for leverage.8 9
E. Model Specification
The main relationship analyzed in this study is the effect that corporate governance has
on firm performance. We note above the potential endogeneity between governance and
performance. Bhagat and Jefferis (2002) highlight the reasons for focusing on the
interrelationships between performance, governance, ownership and capital structure. Therefore,
we specify the following four-equation system of equations allowing for these
interdependencies:
8 Our choice of the instrument variables is motivated by the extant literature. However, it is difficult for us to argue
that the instruments are uncorrelated with the regression error terms. A vast body of theoretical and empirical
literature has focused on the interrelationships between performance, governance, ownership and capital structure;
see Bhagat and Jefferis (2002). In light of the above interrelationships, and the model we are trying to estimate
(equations 1a, 1b, 1c, and 1d as noted below), it is close to impossible - we think -to propose instruments that are in
theory uncorrelated with the error terms. From an econometric perspective, validity of instruments is a matter of
degree not kind; see Berkowitz, Caner and Fang (2008) and Chao and Swanson (2005). Ashbaugh-Skaife, Collins,
and Lafond (2006) make a similar point in their study of the effects of corporate governance on firms’ credit ratings.
We implement a battery of tests checking for the validity and strength of our instruments, and specification of the
system of equations; please see section IV and Appendix.
9 We consider alternative instruments for leverage such as Graham’s (1996) marginal tax rate; ZScore is more
appropriate based on our diagnostic tests.
17
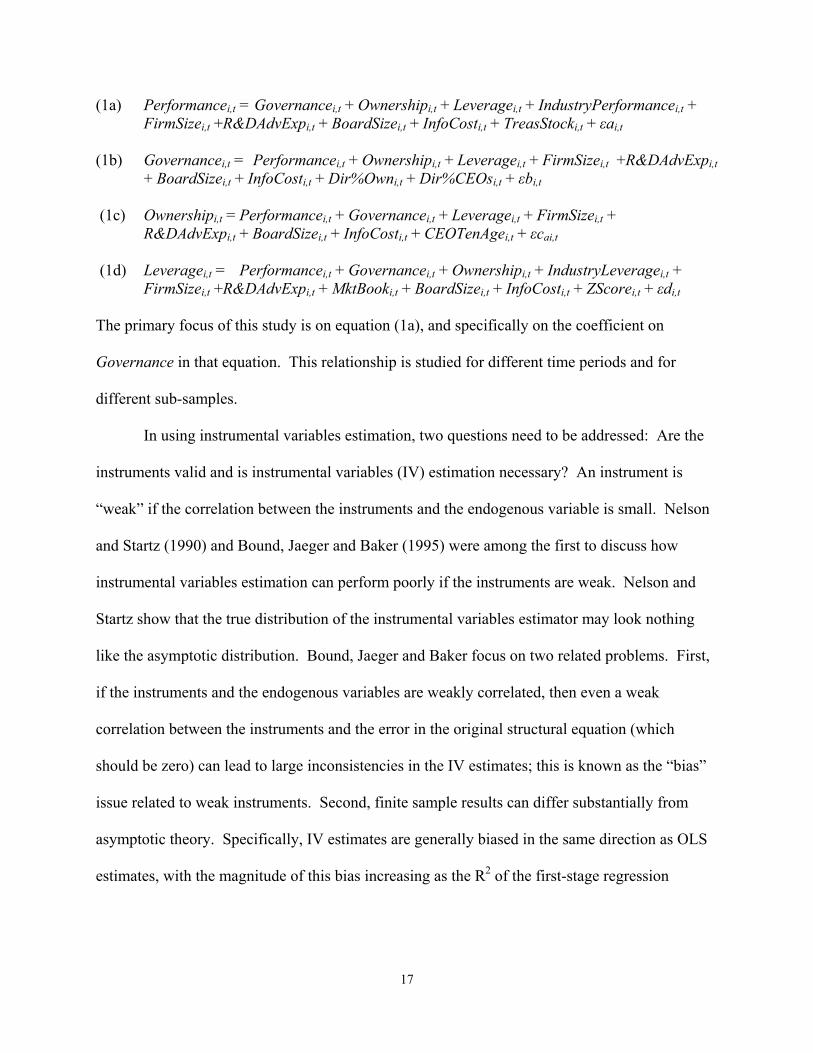
(1a) Performancei,t = Governancei,t + Ownershipi,t + Leveragei,t + IndustryPerformancei,t + FirmSizei,t +R&DAdvExpi,t + BoardSizei,t + InfoCosti,t + TreasStocki,t + εai,t
(1b) Governancei,t = Performancei,t + Ownershipi,t + Leveragei,t + FirmSizei,t +R&DAdvExpi,t + BoardSizei,t + InfoCosti,t + Dir%Owni,t + Dir%CEOsi,t + εbi,t
(1c) Ownershipi,t = Performancei,t + Governancei,t + Leveragei,t + FirmSizei,t + R&DAdvExpi,t + BoardSizei,t + InfoCosti,t + CEOTenAgei,t + εcai,t
(1d) Leveragei,t = Performancei,t + Governancei,t + Ownershipi,t + IndustryLeveragei,t + FirmSizei,t +R&DAdvExpi,t + MktBooki,t + BoardSizei,t + InfoCosti,t + ZScorei,t + εdi,t
The primary focus of this study is on equation (1a), and specifically on the coefficient on
Governance in that equation. This relationship is studied for different time periods and for
different sub-samples.
In using instrumental variables estimation, two questions need to be addressed: Are the
instruments valid and is instrumental variables (IV) estimation necessary? An instrument is
“weak” if the correlation between the instruments and the endogenous variable is small. Nelson
and Startz (1990) and Bound, Jaeger and Baker (1995) were among the first to discuss how
instrumental variables estimation can perform poorly if the instruments are weak. Nelson and
Startz show that the true distribution of the instrumental variables estimator may look nothing
like the asymptotic distribution. Bound, Jaeger and Baker focus on two related problems. First,
if the instruments and the endogenous variables are weakly correlated, then even a weak
correlation between the instruments and the error in the original structural equation (which
should be zero) can lead to large inconsistencies in the IV estimates; this is known as the “bias”
issue related to weak instruments. Second, finite sample results can differ substantially from
asymptotic theory. Specifically, IV estimates are generally biased in the same direction as OLS
estimates, with the magnitude of this bias increasing as the R2 of the first-stage regression

18
between the instruments and the endogenous variable approaches zero; this is known as the
“size” issue related to weak instruments.
More recently, Stock and Yogo (2004) formalize the definitions and provide tests to
determine if instruments are weak. They introduce two alternative definitions of weak
instruments. First, a set of instruments is weak if the bias of the instrumental variables estimator,
relative to the bias of the OLS estimator, exceeds a certain limit b. Second, the set of
instruments is weak if the conventional �-level Wald test based on instrumental variables
statistics has a size that could exceed a certain threshold r. These two definitions correspond to
the “bias” and “size” problems mentioned earlier.
Consistent with the recommendations of Chenhall and Moers (2007), we use the Stock
and Yogo (2004) test for weak instruments and the Hahn and Hausman (2002) test for the
validity of the instruments. We also use the Durbin-Wu-Hausman specification test based on
Hausman (1978) to test for differences between the OLS and 2SLS results and to determine
which estimation method is more appropriate for statistical inference. 10
IV. Corporate Governance and Firm Performance
A. Descriptive Statistics
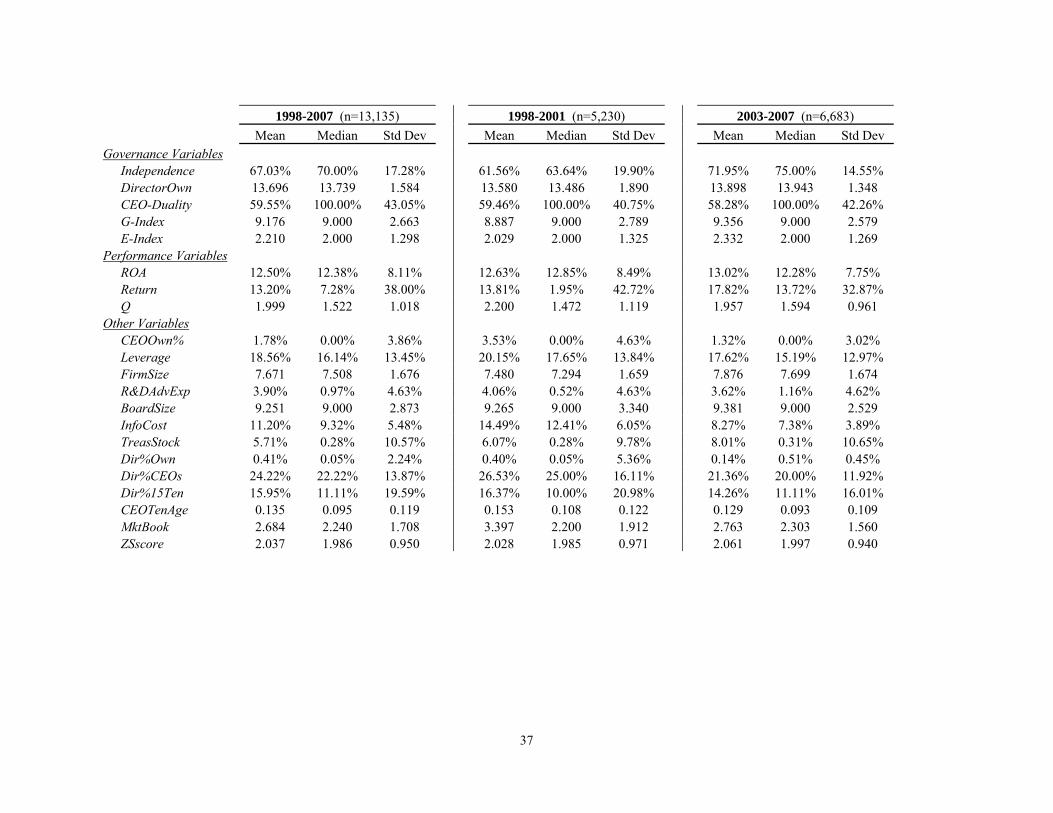
Table 1 presents the descriptive statistics for the main governance, performance, and
other variables, for the entire sample and for the pre-2002 and post-2002 subsamples. In general,
the summary statistics for the entire sample period are similar to prior literature. The average
10 In addition to 2SLS we also consider 3SLS, which allows for cross-correlation in the errors of the equations in the
system. There is qualitatively very little difference between the 2SLS and 3SLS results so we only report the 2SLS
results.
19
board has 9.3 directors, 67% of whom are outsiders. The average G-Index is 9.2 and the average
E-Index is 2.2. The median director owns about $887,000 worth of company stock, and the CEO
is also the board chair in about 60% of the firms.
Some notable differences are seen when we compare the pre-2002 and post-2002
subsamples. We note that boards have become more independent, directors own more stock,
boards have become more entrenched (with G-Index increasing from 8.9 to 9.4 and E-Index
increasing from 2.0 to 2.3), but slightly fewer CEOs are serving as board chair. Fewer directors
are active CEOs. The size of the board has remained relatively constant, but Independence has
increased from 61.6% before 2002 to 72.0% after 2002. Median director ownership has
significantly increased from about $790,000 before 2002 to about $1,100,000 after 2002.
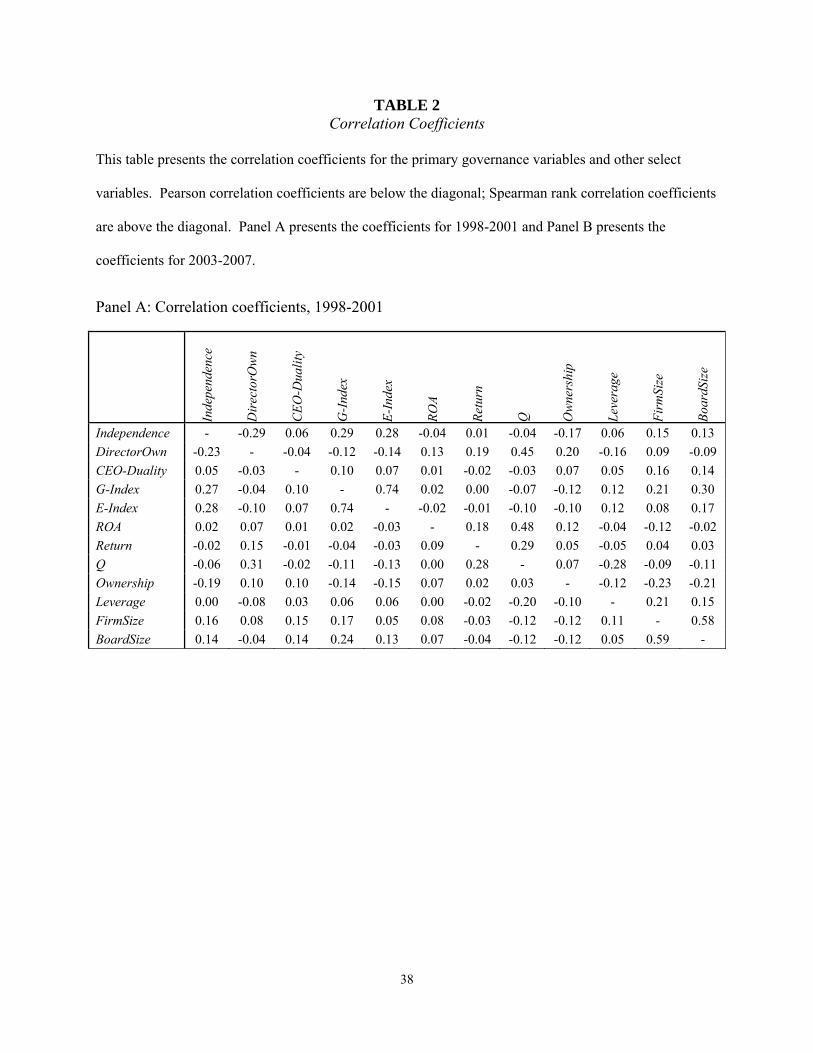
Table 2 presents the correlation coefficients for select governance and other variables.
For the most part, the governance variables are not highly correlated, with the exception of G-
Index and E-Index. Independence and G-Index are moderately highly correlated, consistent with
Gillan, Hartzell and Starks (2007).
B. Governance and Performance, Pre-2002 and Post-2002 Periods
2002 was a seminal year in terms of corporate governance regulation, and specifically
with respect to board independence. We use 2002 as the break-point for our two sub-periods
since SOX was enacted in 2002; for this reason, we exclude 2002 from our analysis.11
We find the most interesting result when we consider the relationship between
Independence and ROA during the pre-2002 and post-2002 periods. Consistent with the extant
literature, we find Independence is negatively related to ROA during the 1998-2001 period; see
11 The results are robust to excluding both 2002 and 2003 from the analysis. We choose to include 2003 because
many firms were compliant with SOX by 2003.

20
Table 3, Panel B.12 However, during the 2003-2007 period, we find that Independence is
positively and significantly related to ROA; see Table 3, Panel D. Boards have become more
independent, and now this independence is positively correlated with better operating
performance.
A second interesting result in Table 3 is that the relationship between ROA and G-Index
is negative and significant in the pre-2002 period (panel B), but positive and significant during
the post-2002 period (panel D). The other three governance variables – DirectorOwn, CEO-
Duality, and E-Index – all have similar signs and significance pre- and post-2002. Director
ownership is positively related to operating performance, whereas CEO-Duality and E-Index are
negatively related. (Recall that lower values of the E-Index and CEO-Duality are associated with
better governance.)
Table 3 also summarizes the relationship between various governance measures and
stock market based measures of performance, Return and TobinsQ. Consistent with the Efficient
Market Hypothesis, we do not find any consistent significant relation between any measure of
governance (including those proposed by GIM and BCF) and stock market based measures of
performance. This evidence is consistent with a growing body of evidence that does not find a
consistent and significant relationship between governance measures proposed by GIM and BCF
and stock market based measures of performance; for example, see Johnson, Moorman and
Sorescu (2009), Core Guay and Rusticus (2006), Lehn, Patro and Zhao (2007), and Cremers and
Martijn (2005).
12 In Table 3, Panels A and C, we report OLS and 2SLS results for completeness. However, the Hausman (1978) test
indicates that the 2SLS estimates are more appropriate for inference; see Appendix A.

21
Table 4 summarizes the relationship between various governance measures and future
firm performance. In general, these results are consistent with those discussed above. One
exception to this is the relationship between ROA in the next two years and E-Index, which
reverses from negative prior to 2002 to positive after 2002.
We next try to better characterize and understand the surprising significant positive
relation between board independence and operating performance for the period 2003-2007.
Using the sample of 13,135 firm-year observations, we determine the year-to-year change in the
number of independent directors for each firm-year. An increase in the number of independent
directors from the previous year is observed for only about one-third of these observations. In
Table 5, Panel A, we observe a significant positive relation between board independence and
contemporaneous operating performance for the period 2003-2007 for those observations where
there is an increase in the number of independent directors from the previous year; in contrast to
the negative relation for the period 1998-2001. In Table 5, Panel B, we consider observations
where there is no increase in the number of independent directors from the previous year: we do
not observe a significant relation between board independence and contemporaneous operating
performance for the period 2003-2007. Hence, the positive relation between board independence
and operating performance for the period 2003-2007 appears to be driven by those companies
that increase their number of independent directors from the previous year. This is consistent
with and supportive of the event-study results of Chhaochharia and Grinstein (2007) who find
that firms that were less compliant with the rules imposed by SOX and the exchanges earned
positive abnormal returns on the announcement of the rules.
We document above that director ownership is positively correlated with operating
performance. It is possible that the positive relation between board independence and operating

22
performance for the period 2003-2007 might be due to an increase in director ownership over the
period 2003-2007. We examine this possibility in Table 6 by including both director ownership
and board independence along with the other variables in equation (1a). This involves adding a
fifth equation to the system, and using all three governance instrumental variables. Consistent
with the evidence in Tables 3 and 4, we document a significant positive relation between board
independence and contemporaneous operating performance for the period 2003-2007; this is in
contrast to the negative relation for the period 1998-2001. Director ownership is positively
associated with firm performance during both the sub-sample periods. This indicates that the
reversal of the relationship between board independence and operating performance after SOX is
independent of the governance effects of director ownership.
C. Robustness Checks
We perform eleven different robustness checks to increase our confidence in the
performance-governance results noted in Tables 3 and 4. For example, we conduct the Stock and
Yogo (2004) test to ensure that our instruments are strong. We also perform the Hansen-Sargan
overidentification test and the Cragg-Donald test for model identification. We estimate the
performance-governance relationship using the fixed effects estimator including firm and year
fixed effects, and clustered (Rogers) standard errors. We include market-to-book in our system
of equations. We consider alternative measures of operating performance. Finally, following
Duchin, Matsusaka and Ozbas (2010) we construct an Information Cost index and evaluate its
impact on the performance-governance relationship. Detailed results of these and other
robustness checks are in the Appendix. Briefly, the performance-governance results obtained
after performing these robustness checks are entirely consistent with the performance-
governance results noted in Tables 3 and 4.

23
V. Market Response to Firms’ Announcement of Compliance
The focus of this paper is on the impact of SOX on the performance-governance relation.
We find a negative and significant relationship between board independence and operating
performance during 1998-2001, but a positive and significant relationship during 2003-2007.
Also, we find that this result is driven by firms that increase their number of independent
directors. Given that SOX attempts to increase the number and role of independent board
members, the above evidence suggests a positive correlation between SOX’s board independence
requirements and company performance. However, correlation is not causation – other economic
events during 2003-2007 could lead to the above observed correlation; for example, increased
shareholder activism and corporate scandals in that period.
To get additional insight on the impact of SOX on the relation between board
independence and company performance, we conduct an event study. We focus on the
announcement by sample firms of the nomination of additional independent directors that would
enable the firm to comply with SOX’s board independence requirements for the audit
committee.13 We use the filing of the firm’s annual proxy statement as the event date. Table 7
summarizes the stock market’s response to these announcements. When a company goes from
being non-compliant to being compliant with SOX’s board independence requirement, the
market response (market adjusted cumulative abnormal return, CAR) is significantly positive for
the post-SOX period (July 22, 2002 through December 31, 2007) using a three-day event
13 Section III, subsection 301 of SOX required that all audit committee members of the board be independent. 69.9%
of our sample firms were SOX compliant in 2002; 76.9% in 2003, 82.9% in 2004, 85.8% in 2005, 84.6% in 2006,
and 96.8% in 2007. In practice, firms become compliant by removing affiliated directors from the board, or when
the nature of an affiliated relationship changes.
24
window from day -1 to day +1.14 Also, the market response is positive for each of the years
2002, 2003, 2004, 2005, 2006 and 2007. Similar results are obtained using longer event
windows. The above findings are consistent with and supportive of the event-study results of
Chhaochharia and Grinstein (2007) and DeFond, Hann, and Hu (2005). Chhaochharia and
Grinstein find that firms that were less compliant with the rules imposed by SOX and the
Exchanges earned more positive abnormal returns on the announcement of the rules. DeFond,
Hann and Hu document a positive stock market reaction when a director with accounting
expertise is appointed to the audit committee.
Table 7 also summarizes the stock market’s response to announcements of annual board
elections by firms that continue being non-compliant with SOX’s board independence
requirements during 2002-2007. The market response is insignificantly different from zero. Also,
the difference in CARs of firms that go from being non-compliant to compliant and firms that
stay non-compliant is significantly positive for the post-SOX period, and for each of the years
2002, 2003, 2005, 2006 and 2007. The above evidence is consistent with the argument that
SOX’s board independence requirement perhaps played a positive role in enhancing firm
performance.
Table 7 also compares the pre-SOX and post-SOX announcement returns to the addition
of independent directors to the audit committee or removal of inside directors from the audit
committee. The above announcements will be better anticipated post-SOX compared to the pre-
SOX period, since SOX mandated the independence requirement for audit committee members.
14 Value weighted market from CRSP (Center for Research in Security Prices) is used as the market index. We also
estimated the CARs based on the market model with similar results. See MacKinlay (1977) for a discussion of event
studies.

25
Consistent with the above arguments, the pre-SOX announcement returns are significantly
greater than post-SOX returns.
VI. Corporate Governance and CEO Turnover
The preceding analysis focuses on the relation between governance and performance
generally and in the specific case of SOX compliance. However, governance scholars and
commentators suggest that governance is especially critical in imposing discipline and providing
fresh leadership when the corporation is performing particularly poorly. For this reason, we
study the relationship between governance, performance, and CEO turnover.
Using Compustat’s Execucomp database, we identify 1,951 CEO changes from 1998 to
2007. We hand-collect information from company press releases and press articles to determine
whether the CEO departure was disciplinary or not. Table 8 documents the number of
disciplinary and non-disciplinary CEO turnovers during this period. Our criteria for classifying
CEO turnover as disciplinary or non-disciplinary is similar to that of Weisbach (1988), Gilson
(1989), Huson, Parrino, and Starks (2001), and Farrell and Whidbee (2003). CEO turnover is
classified as “non-disciplinary” if the CEO died, if the CEO was older than 63, if the change was
the result of an announced transition plan, or if the CEO stayed on as chairman of the board for
more than a year. CEO turnover is classified as “disciplinary” if the CEO resigned to pursue
other interests, if the CEO was terminated, or if no specific reason is given. 15
15 For our purposes, distinguishing between the different sub-categories within the “disciplinary” and “non-
disciplinary” groups is not essential. There may be situations where a 65 year-old CEO leaves as part of a
succession plan and stays on as board chair for 12 months. This is a “non-disciplinary” turnover, regardless of
which sub-category it gets classified in.

26
We consider a multinomial logit regression, with three independent categories: no
turnover, disciplinary turnover, and non-disciplinary turnover.16 The dependent variable is equal
to 0 if no turnover occurred in a firm-year, 1 if the turnover was disciplinary, and 2 if the
turnover was non-disciplinary. We consider the past two years’ stock return as the performance
measure. We estimate the following baseline equation:
(2a) Type of CEO Turnoveri,t = Last 2 Years’ Returni,t + Last 2 Years’ Industry Returni,t + CEOOwn%i,t + FirmSizei,t + CEO Agei,t +CEOTenurei,t + εai,t
The control variables are motivated by a substantial extant literature on performance and CEO
turnover; for example, see Huson, Parrino, and Starks (2001), Farrell and Whidbee (2003), and
Engel, Hayes and Wang (2003). To determine the role that governance plays in CEO turnover,
we create an interactive variable that is equal to (Past 2 years’ stock return x Governance). The
reason behind this is that if the firm is performing adequately, good governance per se should
not lead to CEO turnover; only when performance is poor do we expect better governed firms to
be more likely to replace the CEO. To measure this effect, we estimate the following modified
version of equation (2a):
(2b) Type of CEO Turnoveri,t = Last 2 Years’ Returni,t + Last 2 Years’ Industry Returni,t + Governanceii,t + (Governanceit x Last 2 Years Returnit) + CEOOwn%i,t + FirmSizei,t + CEO Agei,t +CEOTenurei,t + εai,t
Table 9 highlights the relation between different measures of governance and disciplinary
CEO turnover. Table 9, Panel A, details the multinomial logit regression results for the
determinants of disciplinary CEO turnover for the pre-2002 period. Consider first the baseline
16 We also considered a fixed effects logit estimator model. However, there are concerns regarding the bias of such
an estimator. Greene (2004) documents that when the time periods in panel data are five or less (as is the case in
this study), nonlinear estimation may produce coefficients that can be biased in the range of 32% to 68%.
27
results without governance variables in the regression. The baseline results indicate that a firm’s
stock market returns during the previous two years, CEO stock ownership, and CEO tenure are
significantly negatively related to disciplinary CEO turnover; these findings are consistent with
the prior literature noted above.
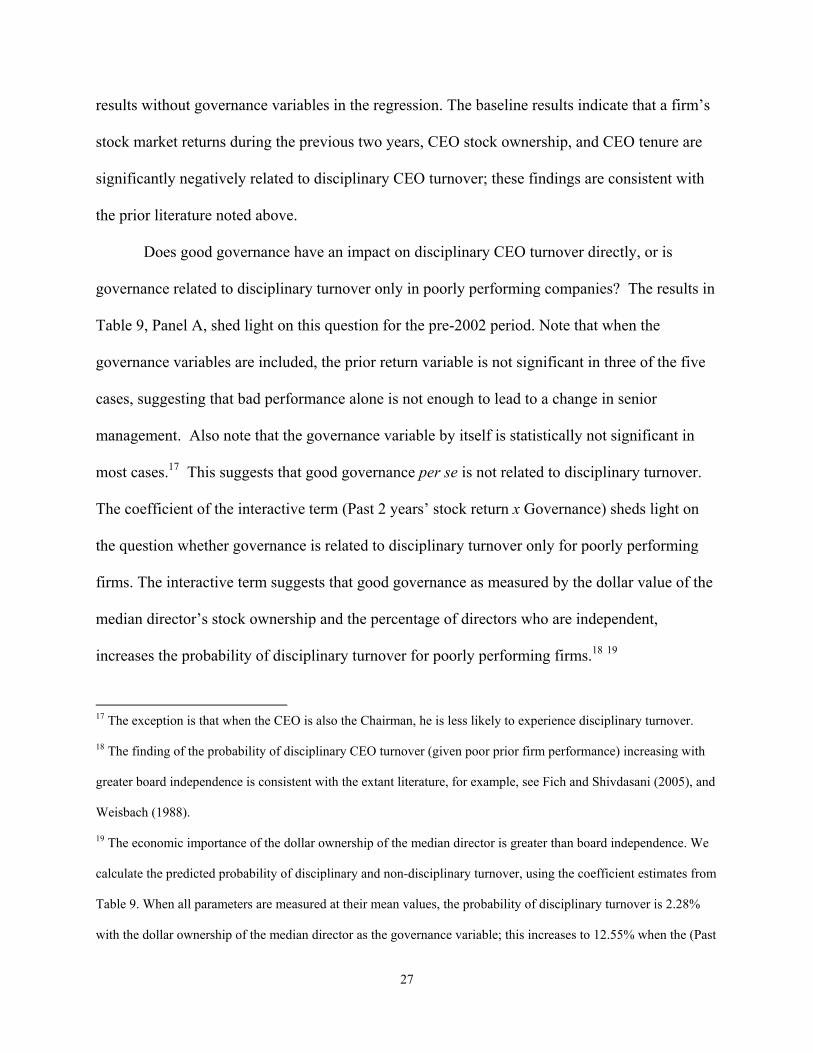
Does good governance have an impact on disciplinary CEO turnover directly, or is
governance related to disciplinary turnover only in poorly performing companies? The results in
Table 9, Panel A, shed light on this question for the pre-2002 period. Note that when the
governance variables are included, the prior return variable is not significant in three of the five
cases, suggesting that bad performance alone is not enough to lead to a change in senior
management. Also note that the governance variable by itself is statistically not significant in
most cases.17 This suggests that good governance per se is not related to disciplinary turnover.
The coefficient of the interactive term (Past 2 years’ stock return x Governance) sheds light on
the question whether governance is related to disciplinary turnover only for poorly performing
firms. The interactive term suggests that good governance as measured by the dollar value of the
median director’s stock ownership and the percentage of directors who are independent,
increases the probability of disciplinary turnover for poorly performing firms.18 19
17 The exception is that when the CEO is also the Chairman, he is less likely to experience disciplinary turnover.
18 The finding of the probability of disciplinary CEO turnover (given poor prior firm performance) increasing with
greater board independence is consistent with the extant literature, for example, see Fich and Shivdasani (2005), and
Weisbach (1988).
19 The economic importance of the dollar ownership of the median director is greater than board independence. We
calculate the predicted probability of disciplinary and non-disciplinary turnover, using the coefficient estimates from
Table 9. When all parameters are measured at their mean values, the probability of disciplinary turnover is 2.28%
with the dollar ownership of the median director as the governance variable; this increases to 12.55% when the (Past

28
Table 9, Panels B shows the results for disciplinary turnover in the post-2002 period.
The results in the 2003-2007 period are qualitatively unchanged from the results in the 1998-
2001, with the following exception. Both the GIM and BCF measures of good governance are
negatively related to the probability of disciplinary turnover for poorly performing firms. This
suggests that better governed firms as measured by the GIM and BCF indices are less likely to
experience disciplinary management turnover in spite of their poor performance. With respect to
disciplining CEOs following poor firm performance, board independence appears to be an
effective monitoring mechanism both before SOX and after SOX. It is important to note that we
do not see the reversal post-SOX of the disciplining effect of board independence – in contrast to
the performance-independence relation discussed above in Section IV.20
Table 9, Panel C, compares the coefficients of the interactive term (Past 2 years’ stock
return x Governance) post-SOX to pre-SOX for the different governance measures. The
sensitivity of board independence to disciplinary turnover and board ownership to disciplinary
turnover has increased significantly in the post-SOX period compared to the pre-SOX period –
Return x Director $ Ownership) interaction term decreases by one standard deviation. The corresponding
probabilities are 2.90% and 7.96% for board independence.
20 Similar to footnote 19, we again consider the economic importance of the dollar ownership of the median director,
and board independence in disciplining CEOs of poorly performing firms. We calculate the predicted probability of
disciplinary turnover, using the coefficient estimates from Table 9. We find a significant increase in the predicted
probability of disciplinary turnover for both governance measures (dollar ownership of the median director and
board independence). This suggests that the disciplinary role of independent directors and board holdings has
increased subsequent to passage of SOX. The increased disciplinary role of independent directors subsequent to
SOX is a potential explanation for the positive stock market response to companies becoming compliant to SOX’s
board independence requirement as noted above in Section V.

29
suggesting that independent directors and directors that own more stock are more likely to
discipline the CEO of a poorly-performing firm in the post-SOX period.
We also study the determinants of non-disciplinary CEO turnover. We do not expect any
relation between good governance and non-disciplinary CEO turnover both unconditionally, and
conditional on poor prior performance; untabulated results are consistent with this.
VII. Corporate Governance and M&A Deals
We find that given poor firm performance, the probability of disciplinary management
turnover is positively correlated with stock ownership of board members and board
independence. Do governance mechanisms affect operational performance in other ways?21 For
example, previous studies have found that board independence affects corporate mergers and
acquisitions (see Byrd and Hickman (1992), and Cotter, Shivdasani and Zenner (1997)).
Using the SDC database, we identify whether or not each of our sample firms made an
acquisition in a given firm year. We consider a logit model where the dependent variable is
equal to 1 if the sample firm makes an acquisition in a year, and it is equal to 0 otherwise. Table
10 highlights the relation between different measures of governance and corporate acquisitions.
Table 10, Panel A, details the logit regression results for the determinants of corporate
acquisitions for the pre-SOX period. The key explanatory variable of interest is the Governance
variable. We consider the five governance variables separately: Board Independence, Director
Ownership, CEO Duality, GIM G-Index and BCF E-Index. We include year and industry fixed
effects. The results show that firms with greater board independence and greater director
ownership are less likely to make acquisitions. Since public acquisitions are associated with
21 We are indebted to an anonymous referee for suggesting this to us, and with help in developing this section.

30
negative returns for acquiring shareholders (for example, see Moeller, Schlingemann, and Stulz,
2005), this suggests another channel by which greater board independence and director
ownership positively impact a firm’s operational performance.22 With regard to the GIM and
BCF governance measures: the negative coefficient implies that GIM and BCF measures of good
governance are positively related to the probability of a value-destroying activity, namely,
acquisitions. (Recall that lower values of the GIM and GCF indices are associated with better
governance.)
Table 10, Panel B, details the logit regression results for the determinants of corporate
acquisitions for the post-SOX period. Again, the results show that firms with greater board
independence and greater director ownership are less likely to make acquisitions. With regard to
the GIM and BCF governance measures: the negative coefficient again implies that GIM and
BCF measures of good governance are positively related to the probability of a value-destroying
activity, namely, acquisitions, in the post-SOX period.
Table 10, Panel C, summarizes the difference in implied acquisition probabilities pre-
SOX and post-SOX for the different governance measures. Board independence and director
ownership are associated with a statistically and economically significant decrease in acquisition
probabilities in the post-SOX period compared to the pre-SOX period.
VIII. Conclusions
22 Table 10, Panel D summarizes the market adjusted cumulative abnormal returns (CAR) surrounding the
acquisition announcement date for different event windows for the sample firms in this study. Consistent with prior
literature, the CAR in our sample are significantly negative, suggesting that these acquisitions are viewed negatively
by investors.

31
We study the impact of SOX on the relationship between corporate governance and
company performance. A significant part of SOX and other exchange requirements increase the
role of independent board members. Given that prior academic research suggests there is no
positive relationship between board independence and firm performance, the above regulatory
efforts are especially notable.
We find a shift in the relationship between board independence and firm performance
after 2002. Prior to 2002, we document a negative relationship between board independence and
operating performance. After 2002, we find a positive relationship between independence and
operating performance. We find this result is driven by firms that increase their number of
independent directors. An event study provides independent evidence supportive of the above
results – specifically, when a company goes from being non-compliant to being compliant with
SOX’s board independence requirement, the market response is significantly positive. Why
might SOX be related to this positive performance. SOX and the listing standards impose new
responsibilities on firms’ directors, such as regular meetings of the independent directors,
approval of director nominations by independent directors, and approval of CEO compensation
by independent directors. As a consequence of these policies boards began including more
independent directors, and, perhaps the independent directors became more engaged in the firm’s
governance processes. For example, we find that firms with greater board independence (and
stock ownership of board members) are less likely to engage in a value-destroying activity,
namely, acquisitions.
We find a consistent positive performance-governance relationship for director
ownership. On average, the median director’s stock ownership is 45 percent greater in 2003-
2007 than it was in 1998-2001 – and the relationship between director ownership and firm
32
performance is consistently positive for both sub-periods; this relationship is robust to a battery
of specification tests. Hence, this study proposes a governance measure, namely – dollar
ownership of the board members – that is simple, intuitive, less prone to measurement error, and
not subject to the problem of weighting a multitude of governance provisions in constructing a
governance index. Consideration of this governance measure by future researchers would
enhance the comparability of research findings with more robust progress in governance
research.
REFERENCES
Adams, R. and D. Ferreira. “A Theory of Friendly Boards.” Journal of Finance, 62 (2007), 217-250. Agrawal, A. and C. R. Knoeber. “Firm Performance and Mechanisms to Control Agency Problems between
Managers and Shareholders.” Journal of Financial and Quantitative Analysis, 31 (1996), 377-397. Alvarez, R. and G. Glasgow. “Two-Stage Estimation of Non-Recursive Choice Models.” Political Analysis, 8
(2000), 147-165. Angrist, J. “Estimation of Limited Dependent Variable Models with Dummy Endogenous Regressors: Simple
Strategies for Empirical Practice.” Journal of Business and Economic Statistics, 19 (2001), 2-16. Ashbaugh-Skaife, H., D. W. Collins and R. LaFond. “The Effects of Corporate Governance on Firms’ Credit
Ratings.” Journal of Accounting and Economics, 42 (2006), 203-243. Barber, B. and J. Lyon. “Detecting Abnormal Operating Performance: The Empirical Power and Specification of
Test Statistics.” Journal of Financial Economics, 41 (1996), 359-400. Bebchuk, L., A. Cohen, and A. Ferrell. “What Matters in Corporate Governance?” Review of Financial Studies, 22
(2009), 783-827. Bebchuk, L. and A. Cohen. “The Costs of Entrenched Boards.” Journal of Financial Economics, 78 (2005), 409-
433. Berkowitz, D., M. Caner and Y. Fang. "Are ‘Nearly Exogenous Instruments’ Reliable?" Economics Letters, 2008,
101 (2008), 20-23. Bhagat, S. and B. Black. “The Non-Correlation between Board Independence and Long Term Firm Performance.”
Journal of Corporation Law, 27 (2002), 231-274. Bhagat, S. and B. Bolton. “Corporate Governance and Firm Performance.” Journal of Corporate Finance, 14
(2008), 257-273, Bhagat, S., B. Bolton and R. Romano. “The Promise and Peril of Corporate Governance Indices.” Columbia Law
Review, 108 (2008), 1803-1882, Bhagat, S. and R. Jefferis, Jr. The Econometrics of Corporate Governance Studies, MIT Press, Cambridge, MA,
2002. Bhagat, S. and H. Tookes. “Voluntary and Mandatory Skin in the Game: Understanding Outside Directors’ Stock
Holdings.” European Journal of Finance, forthcoming 2011. Brickley, J. A., J. L. Coles, and G. Jarrell. “Leadership Structure: Separating the CEO and Chairman of the Board.”
Journal of Corporate Finance, 3 (1997), 189-220. Brochet, F. “Information Content of Insider Trades Before and After the Sarbanes-Oxley Act.” The Accounting
Review, 85 (2010), 419-446. Bound, J., D. A. Jaeger, and R. M. Baker. “Problems with Instrumental Variables Estimation when the Correlation
Between the Instruments and the Endogenous Explanatory Variable is Weak.” Journal of the American Statistical Association, 90 (1995), 443-450.
Brown, L. D. and M. L. Caylor. “Corporate Governance and Firm Valuation.” Journal of Accounting and Public Policy, 25 (2006), 409-434.

33
Byrd, J. and K. Hickman. “Do Outside Directors Monitor Managers?” Journal of Financial Economics, 32 (1992), 195-221.
Chao, J. C. and N. R. Swanson. "Consistent Estimation With Large Number Of Weak Instruments." Econometrica, 2005, 73 (2005), 1673-1692.
Chenhall, R. H. and F. Moers. “The Issue of Endogeneity Within Theory-Based, Quantitative Management Accounting Research.” European Accounting Review, 16 (2007), 173-195.
Chhaochharia, V. and Y. Grinstein. “Corporate Governance and Firm Value: The Impact of the 2002 Governance Rules.” Journal of Finance, 62 (2007), 1789-1825.
Cohen, D. A., A. Dey and T. Z. Lys. Trends in Earnings Management and Informativeness of Earnings Announcements in the Pre- and Post-Sarbanes Oxley Periods.” Northwestern University working paper 2005.
Cohen, D. A., A. Dey and T. Z. Lys. “Real and Accrual-Based Earnings Management in the Pre- and Post-Sarbanes-Oxley Periods.” The Accounting Review, 83 (2008), 757-787.
Coles, J. L., N. D. Daniel, and L. Naveen. “Boards: Does One Size Fit All?” Journal of Financial Economics, 79 (2008), 329-356.
Core, J. E., W. R. Guay, T. O. Rusticus. “Does Weak Governance Cause Weak Stock Returns? An Examination of Firm Operating Performance and Investors’ Expectations.” Journal of Finance, 61 (2006), 655-687.
Core, J. E., R. W. Holthausen, and D. F. Larcker. “Corporate Governance, Chief Executive Officer Compensation, and Firm Performance.” Journal of Financial Economics, 51 (1999), 371-406.
Cotter, J., A. Shivdasani and M. Zenner. “Do Independent Directors Enhance Target Shareholder Wealth During Tender Offers?” Journal of Financial Economics, 43 (1997), 195-218.
Cragg, J. G. and S. G. Donald. “Testing Identifiability and Specification in Instrumental Variable Models.” Econometric Theory, 9 (1993), 222-240.
Cremers, K. J. M., and V. B. Nair. “Governance Mechanisms and Equity Prices.” Journal of Finance, 60 (2005), 2859-2894.
Davidson, R., and J. G. MacKinnon. Estimation and Inference in Econometrics, Oxford University Press, New York, NY, 2004.
Defond, M. L., R. N. Hann and X. Hu. “Does The Market Value Financial Expertise On Audit Committees of Boards of Directors?” Journal of Accounting Research. 43 (2005), 153-173.
Demsetz, H. “The Structure of Ownership and the Theory of the Firm.” Journal of Law and Economics, 26 (1983), 375-390.
Demsetz, H. and K. Lehn. “The Structure of Corporate Ownership: Causes and Consequences.” Journal of Political Economy, 33 (1985), 3-53.
Duchin, R., J. G. Matsusaka and O. Ozbas. “When Are Outside Directors Effective?” Journal of Financial Economics. 96 (2010), 195-214
Dufour, J. “Some Impossibility Theorems in Econometrics, with Applications to Structural and Dynamic Models.” Econometrica, 65 (1997), 1365-1389.
Engel, E., R. M. Hayes, and X. Wang. “CEO Turnover and Properties of Accounting Information.” Journal of Accounting and Economics, 36 (2003), 197-226.
Farell, K.A. and Whidbee, D.A. “The Impact of Firm Performance Expectations on CEO Turnover and Replacement Decisions.” Journal of Accounting and Economics, 36 (2003), 165-196.
Fich, E. M. and A. Shivdasani. “Are Busy Boards Effective Monitors?” Journal of Finance, 61 (2006), 689-724. Gillan, S. L., J. C. Hartzell, L. T. Starks. “Explaining Corporate Governance: Boards, Bylaws, and Charter
Provisions.” Working paper 2003. Gompers, P. A., J. L. Ishii, and A. Metrick. “Corporate Governance and Equity Prices.” Quarterly Journal of
Economics, 118 (2003), 107-155. Gibbons, R. and K. J. Murphy. “Optimal Incentive Contracts in the Presence of Career Concerns: Theory and
Evidence." Journal of Political Economy, 100 (1992), 468-505. Gilson, S. C. “Management Turnover and Financial Distress.” Journal of Financial Economics, 25 (1989), 241-262. Greene, W. H. “The Behavior of the Fixed Effects Estimator in Nonlinear Models.” The Econometrics Journal, 7
(2004), 98-119. Guggenberger, P. “Finite-Sample Evidence Suggesting a Heavy Tail Problem of the Generalized Empirical
Likelihood Estimator.” UCLA Department of Economics working paper 2005. Hahn, J. and J. A. Hausman. “A New Specification Test for the Validity of Instrumental Variables.” Econometrica,
70 (2002), 163-189.

34
Hall, A., G. Rudebusch and D. Wilcox. “Judging Instrument Relevance in Instrumental Variables Estimation.” International Economic Review, 37 (1996), 283-298.
Hallock, K. F. “Reciprocally Interlocking Boards of Directors and Executive Compensation.” Journal of Financial and Quantitative Analysis, 32 (1997), 331-344.
Harris, M., and A. Raviv. “A Theory of Board Control and Size.” Review of Financial Studies, 21 (2008), 1797-1832.
Hausman, J. A. “Specification Tests in Econometrics.” Econometrica, 46 (1978), 1251-1271. Hermalin, B. E. “Trends in Corporate Governance.” The Journal of Finance, 60 (2005), 2351-2384. Hermalin, B. E. and M. S. Weisbach. “The Effects of Board Composition and Direct Incentives on Firm
Performance.” Financial Management, 20 (1991), 101-112. Hermalin, B. E. and M. S. Weisbach. “Endogenously Chosen Boards of Directors and Their Monitoring of the
CEO.” American Economic Review, 88 (1998), 96-118. Hermalin, B. E. and M. S. Weisbach. “Boards of Directors as an Endogenously Determined Institution: A Survey of
the Economic Evidence.” Economic Policy Review, 9 (2003), 7-26. Himmelberg, C.P., R.G. Hubbard and D. Palia. “Understanding the Determinants Of Managerial Ownership and the
Link Between Ownership And Performance.” Journal of Financial Economics, 53 (1999), 353-384. Huson, M. R., R. Parrino and L. T. Starks. “Internal Monitoring Mechanisms and CEO Turnover: A Long-Term
Perspective.” Journal of Finance, 54 (2001), 2265-2297. Huson, M. R., P. H. Malatesta and R. Parrino. “Managerial Succession and Firm Performance.” Journal of Financial
Economics, 74 (2004), 237-275. Johnson, S., T. C. Moorman and S. Sorescu. “A Reexamination of Corporate Governance and Equity Prices.”
Review of Financial Studies, 22 (2009), 4753-4786. Johnston, J. and J. DiNardo. Econometric Methods, Fourth edition, The McGraw-Hill Companies, New York, NY,
1997. Kennedy, P. A Guide to Econometrics, Fifth Edition, MIT Press, Cambridge, MA, 2003. Krishnaswami, S. and V. Subramanian. “Information Asymmetry, Valuation, and the Corporate Spin-Off Decision.”
Journal of Financial Economics, 53 (1999), 73-112. Larcker, D. F. and S. A. Richardson. “Fees Paid to Audit Firms, Accrual Choices, and Corporate Governance.”
Journal of Accounting Research, 42 (2004), 625-658. Larcker, D. F. and T. O. Rusticus. “On the Use of Instrumental Variables in Accounting Research.” Journal of
Accounting and Economics, 49 (2010), 186-205. Laux, V. “Board Independence and CEO Turnover.” Journal of Accounting Research, 46 (2008), 137-171. Lehn, K., S. Patro and M. Zhao. “Governance Indices and Valuation Multiples: Which Causes Which?” Journal of
Corporate Finance, 13 (2007), 907-928. Linck, J. S., J. M. Netter and T. Yang. “The Determinants of Board Structure.” Journal of Financial Economics, 87
(2008), 308-328. Linck, J. S., J. M. Netter and T. Yang. “The Effects and Unintended Consequences of the Sarbanes-Oxley Act on
Corporate Boards.” Review of Financial Studies, 22 (2009), 3287-3328. MacKinlay, A. C. “Event Studies in Economics and Finance.” Journal of Economic Literature, 35 (1997), 13-39. Masulis, R. W., and S. Mobbs. “Are All Inside Directors the Same? Evidence from the External Directorship
Market.” Journal of Finance, 66 (2011), 823-872. Milanovic, B. “Do More Unequal Countries Redistribute More? Does the Median Voter Hypothesis Hold?” World
Bank policy research working paper series, Carnegie Endowment for International Peace, 2004 Moeller, S.B., F. P. Schlingemann, and R.M. Stulz. “Wealth Destruction on a Massive Scale? A Study of Acquiring-
Firm Returns in the Recent Merger Wave.” Journal of Finance, 60 (2005), 757-782. Nelson, C. R. and R. Startz. “Some Further Results on the Exact Small Sample Properties of the Instrumental
Variables Estimator.” Econometrica, 58 (1990), 967-976. Palia, D. “The Endogeneity of Managerial Compensation in Firm Valuation: A Solution.” Review of Financial
Studies, 14 (2001), 735-764. Petersen, M. A. “Estimating Standard Errors in Finance Panel Data Sets: Comparing Approaches.” Review of
Financial Studies, 22 (2009), 435-480. Raheja, C. G. “Determinants of Board Size and Composition: A Theory of Corporate Boards.” Journal of Financial
and Quantitative Analysis, 40 (2005), 283-306. Shea, J. “Instrument Relevance in Multivariate Linear Models: A Simple Measure.” Review of Economics and
Statistics, 79 (1997), 348 – 352. Shleifer, A. and R. W. Vishny. “A Survey of Corporate Governance.” Journal of Finance, 52 (1997), 737-783.
35
Shleifer, A. and K. M. Murphy. “Persuasion in Politics.” American Economic Association Papers and Proceedings, 94 (2004), 435-439.
Staiger, D. and J. H. Stock. “Instrumental Variables Regression with Weak Instruments.” Econometrica, 65 (1997), 557-586.
Stock, J. H., and M. Yogo. “Testing for Weak Instruments in Linear IV Regression.” In D.W.K. Andrews and J.H. Stock, eds., Identification and Inference for Econometric Models: Essays in Honor of Thomas J. Rothenberg. Cambridge University Press, Cambridge, UK, 2004.
Stock, J. H., J. Wright and M. Yogo. “A Survey of Weak Instruments and Weak Identification in Generalized Method of Moments.” Journal of Business and Economic Statistics, 20 (2002), 518-529.
Weisbach, M. S. “Outside Directors and CEO Turnover.” Journal of Financial Economics, 20 (1988), 432-460. Westphal, J. D. and P. Khanna. “Keeping Directors in Line: Social Distancing as a Control Mechanism in the
Corporate Elite.” Administrative Science Quarterly, 48 (2003), 361-398. Wooldridge, J.M. Econometric Analysis of Cross Section and Panel Data, MIT Press, Cambridge, MA, 2002. Yermack, D. “Higher Market Valuation for Firms with a Small Board of Directors.” Journal of Financial
Economics, 40 (1996), 185-211.

36
TABLE 1 Descriptive Statistics
This table presents the mean, median and standard deviation for the primary governance, performance and other variables. The statistics are
presented for three time periods: the full sample 1998-2007 and the two subsamples, 1998-2001 and 2003-2007. The variables are as defined in
the text. The number of observations refers to observations with Independence only; the other governance variables may have slightly more or
less observations depending on availability.
37
1998-2007 (n=13,135) 1998-2001 (n=5,230) 2003-2007 (n=6,683)
Mean Median Std Dev Mean Median Std Dev Mean Median Std Dev Governance Variables Independence 67.03% 70.00% 17.28% 61.56% 63.64% 19.90% 71.95% 75.00% 14.55% DirectorOwn 13.696 13.739 1.584 13.580 13.486 1.890 13.898 13.943 1.348 CEO-Duality 59.55% 100.00% 43.05% 59.46% 100.00% 40.75% 58.28% 100.00% 42.26% G-Index 9.176 9.000 2.663 8.887 9.000 2.789 9.356 9.000 2.579 E-Index 2.210 2.000 1.298 2.029 2.000 1.325 2.332 2.000 1.269 Performance Variables ROA 12.50% 12.38% 8.11% 12.63% 12.85% 8.49% 13.02% 12.28% 7.75% Return 13.20% 7.28% 38.00% 13.81% 1.95% 42.72% 17.82% 13.72% 32.87% Q 1.999 1.522 1.018 2.200 1.472 1.119 1.957 1.594 0.961 Other Variables CEOOwn% 1.78% 0.00% 3.86% 3.53% 0.00% 4.63% 1.32% 0.00% 3.02% Leverage 18.56% 16.14% 13.45% 20.15% 17.65% 13.84% 17.62% 15.19% 12.97% FirmSize 7.671 7.508 1.676 7.480 7.294 1.659 7.876 7.699 1.674 R&DAdvExp 3.90% 0.97% 4.63% 4.06% 0.52% 4.63% 3.62% 1.16% 4.62% BoardSize 9.251 9.000 2.873 9.265 9.000 3.340 9.381 9.000 2.529 InfoCost 11.20% 9.32% 5.48% 14.49% 12.41% 6.05% 8.27% 7.38% 3.89% TreasStock 5.71% 0.28% 10.57% 6.07% 0.28% 9.78% 8.01% 0.31% 10.65% Dir%Own 0.41% 0.05% 2.24% 0.40% 0.05% 5.36% 0.14% 0.51% 0.45% Dir%CEOs 24.22% 22.22% 13.87% 26.53% 25.00% 16.11% 21.36% 20.00% 11.92% Dir%15Ten 15.95% 11.11% 19.59% 16.37% 10.00% 20.98% 14.26% 11.11% 16.01% CEOTenAge 0.135 0.095 0.119 0.153 0.108 0.122 0.129 0.093 0.109 MktBook 2.684 2.240 1.708 3.397 2.200 1.912 2.763 2.303 1.560 ZSscore 2.037 1.986 0.950 2.028 1.985 0.971 2.061 1.997 0.940
38
TABLE 2 Correlation Coefficients
This table presents the correlation coefficients for the primary governance variables and other select
variables. Pearson correlation coefficients are below the diagonal; Spearman rank correlation coefficients
are above the diagonal. Panel A presents the coefficients for 1998-2001 and Panel B presents the
coefficients for 2003-2007.
Panel A: Correlation coefficients, 1998-2001
Inde
pend
ence
Dir
ecto
rOw
n
CE
O-D
uali
ty
G-I
ndex
E-I
ndex
RO
A
Ret
urn
Q
Ow
ners
hip
Lev
erag
e
Fir
mSi
ze
Boa
rdSi
ze
Independence - -0.29 0.06 0.29 0.28 -0.04 0.01 -0.04 -0.17 0.06 0.15 0.13
DirectorOwn -0.23 - -0.04 -0.12 -0.14 0.13 0.19 0.45 0.20 -0.16 0.09 -0.09
CEO-Duality 0.05 -0.03 - 0.10 0.07 0.01 -0.02 -0.03 0.07 0.05 0.16 0.14
G-Index 0.27 -0.04 0.10 - 0.74 0.02 0.00 -0.07 -0.12 0.12 0.21 0.30
E-Index 0.28 -0.10 0.07 0.74 - -0.02 -0.01 -0.10 -0.10 0.12 0.08 0.17
ROA 0.02 0.07 0.01 0.02 -0.03 - 0.18 0.48 0.12 -0.04 -0.12 -0.02
Return -0.02 0.15 -0.01 -0.04 -0.03 0.09 - 0.29 0.05 -0.05 0.04 0.03
Q -0.06 0.31 -0.02 -0.11 -0.13 0.00 0.28 - 0.07 -0.28 -0.09 -0.11
Ownership -0.19 0.10 0.10 -0.14 -0.15 0.07 0.02 0.03 - -0.12 -0.23 -0.21
Leverage 0.00 -0.08 0.03 0.06 0.06 0.00 -0.02 -0.20 -0.10 - 0.21 0.15
FirmSize 0.16 0.08 0.15 0.17 0.05 0.08 -0.03 -0.12 -0.12 0.11 - 0.58
BoardSize 0.14 -0.04 0.14 0.24 0.13 0.07 -0.04 -0.12 -0.12 0.05 0.59 -
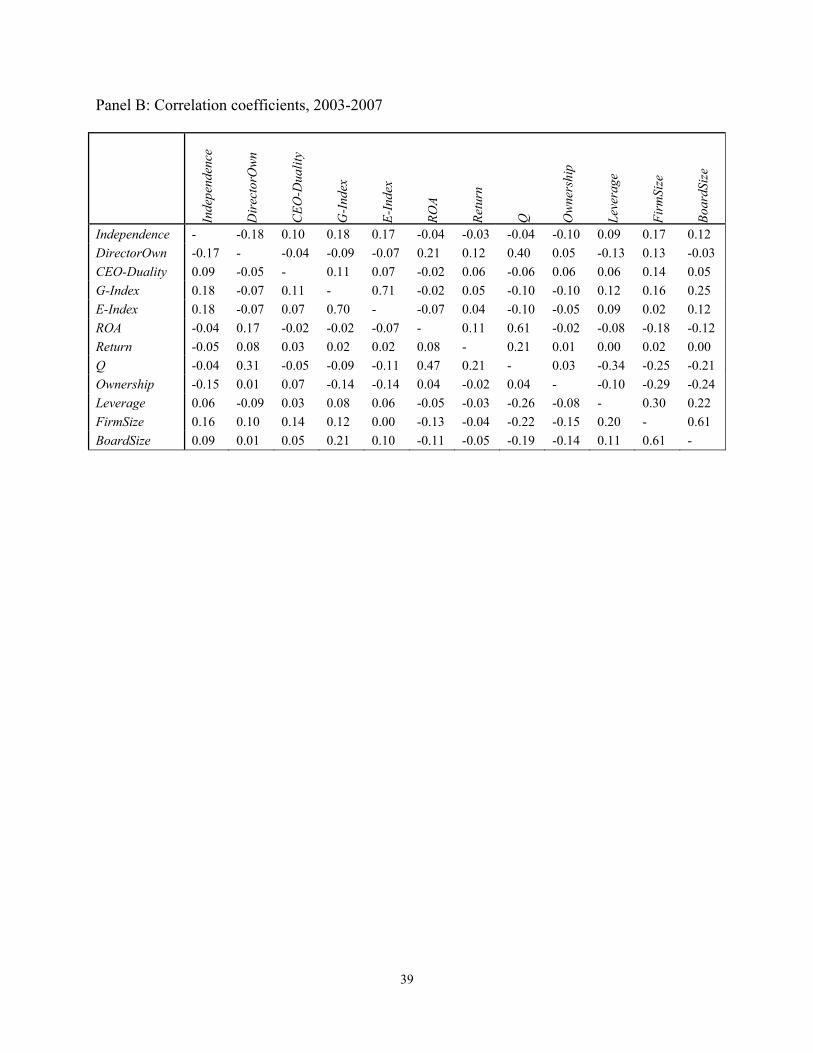
39
Panel B: Correlation coefficients, 2003-2007
Inde
pend
ence
Dir
ecto
rOw
n
CE
O-D
uali
ty
G-I
ndex
E-I
ndex
RO
A
Ret
urn
Q
Ow
ners
hip
Lev
erag
e
Fir
mSi
ze
Boa
rdSi
ze
Independence - -0.18 0.10 0.18 0.17 -0.04 -0.03 -0.04 -0.10 0.09 0.17 0.12
DirectorOwn -0.17 - -0.04 -0.09 -0.07 0.21 0.12 0.40 0.05 -0.13 0.13 -0.03
CEO-Duality 0.09 -0.05 - 0.11 0.07 -0.02 0.06 -0.06 0.06 0.06 0.14 0.05
G-Index 0.18 -0.07 0.11 - 0.71 -0.02 0.05 -0.10 -0.10 0.12 0.16 0.25
E-Index 0.18 -0.07 0.07 0.70 - -0.07 0.04 -0.10 -0.05 0.09 0.02 0.12
ROA -0.04 0.17 -0.02 -0.02 -0.07 - 0.11 0.61 -0.02 -0.08 -0.18 -0.12
Return -0.05 0.08 0.03 0.02 0.02 0.08 - 0.21 0.01 0.00 0.02 0.00
Q -0.04 0.31 -0.05 -0.09 -0.11 0.47 0.21 - 0.03 -0.34 -0.25 -0.21
Ownership -0.15 0.01 0.07 -0.14 -0.14 0.04 -0.02 0.04 - -0.10 -0.29 -0.24
Leverage 0.06 -0.09 0.03 0.08 0.06 -0.05 -0.03 -0.26 -0.08 - 0.30 0.22
FirmSize 0.16 0.10 0.14 0.12 0.00 -0.13 -0.04 -0.22 -0.15 0.20 - 0.61
BoardSize 0.09 0.01 0.05 0.21 0.10 -0.11 -0.05 -0.19 -0.14 0.11 0.61 -
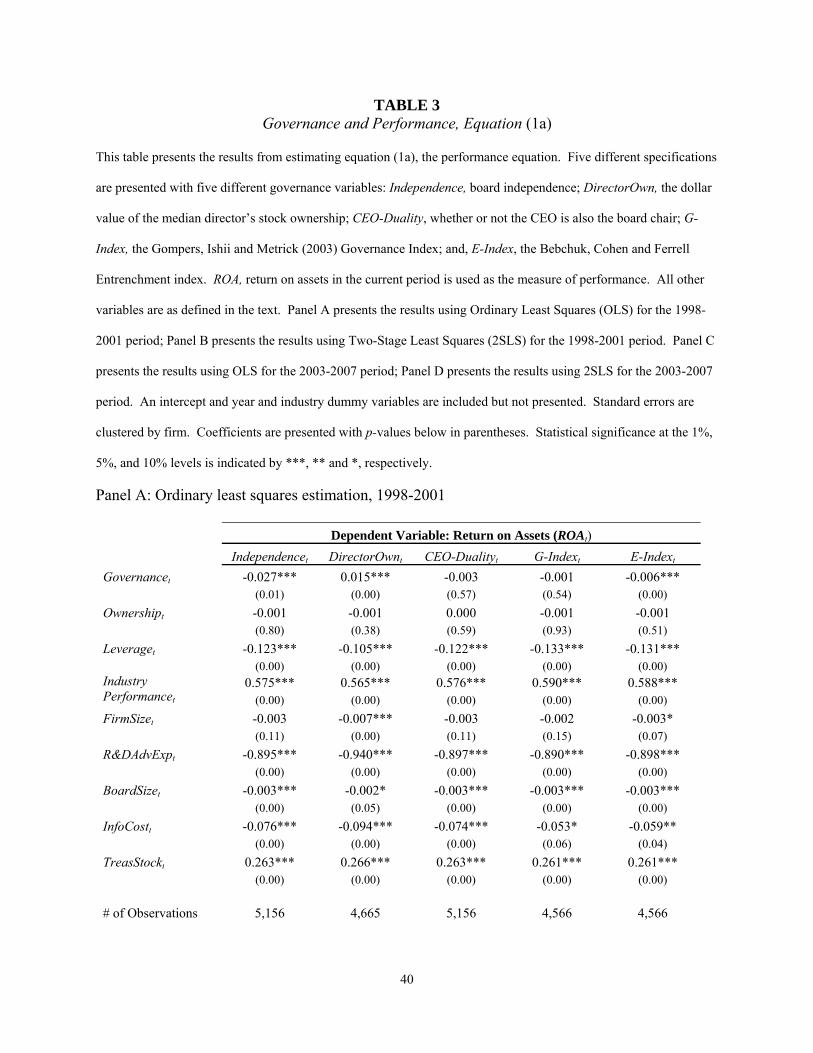
40
TABLE 3 Governance and Performance, Equation (1a)
This table presents the results from estimating equation (1a), the performance equation. Five different specifications
are presented with five different governance variables: Independence, board independence; DirectorOwn, the dollar
value of the median director’s stock ownership; CEO-Duality, whether or not the CEO is also the board chair; G-
Index, the Gompers, Ishii and Metrick (2003) Governance Index; and, E-Index, the Bebchuk, Cohen and Ferrell
Entrenchment index. ROA, return on assets in the current period is used as the measure of performance. All other
variables are as defined in the text. Panel A presents the results using Ordinary Least Squares (OLS) for the 1998-
2001 period; Panel B presents the results using Two-Stage Least Squares (2SLS) for the 1998-2001 period. Panel C
presents the results using OLS for the 2003-2007 period; Panel D presents the results using 2SLS for the 2003-2007
period. An intercept and year and industry dummy variables are included but not presented. Standard errors are
clustered by firm. Coefficients are presented with p-values below in parentheses. Statistical significance at the 1%,
5%, and 10% levels is indicated by ***, ** and *, respectively.
Panel A: Ordinary least squares estimation, 1998-2001
Dependent Variable: Return on Assets (ROAt)
Independencet DirectorOwnt CEO-Dualityt G-Indext E-Indext
Governancet -0.027*** 0.015*** -0.003 -0.001 -0.006*** (0.01) (0.00) (0.57) (0.54) (0.00)
Ownershipt -0.001 -0.001 0.000 -0.001 -0.001 (0.80) (0.38) (0.59) (0.93) (0.51)
Leveraget -0.123*** -0.105*** -0.122*** -0.133*** -0.131*** (0.00) (0.00) (0.00) (0.00) (0.00) Industry Performancet
0.575*** 0.565*** 0.576*** 0.590*** 0.588*** (0.00) (0.00) (0.00) (0.00) (0.00)
FirmSizet -0.003 -0.007*** -0.003 -0.002 -0.003* (0.11) (0.00) (0.11) (0.15) (0.07)
R&DAdvExpt -0.895*** -0.940*** -0.897*** -0.890*** -0.898*** (0.00) (0.00) (0.00) (0.00) (0.00)
BoardSizet -0.003*** -0.002* -0.003*** -0.003*** -0.003*** (0.00) (0.05) (0.00) (0.00) (0.00)
InfoCostt -0.076*** -0.094*** -0.074*** -0.053* -0.059** (0.00) (0.00) (0.00) (0.06) (0.04)
TreasStockt 0.263*** 0.266*** 0.263*** 0.261*** 0.261*** (0.00) (0.00) (0.00) (0.00) (0.00)
# of Observations 5,156 4,665 5,156 4,566 4,566

41
Panel B: Two-stage least squares estimation, 1998-2001
Dependent Variable: Return on Assets (ROAt)
Independencet DirectorOwnt CEO-Dualityt G-Indext E-Indext
Governancet -0.739*** 0.028** -0.167*** -0.097*** -0.196*** (0.00) (0.02) (0.00) (0.00) (0.00)
Ownershipt -0.014*** -0.008*** -0.001* -0.016*** -0.014*** (0.00) (0.01) (0.10) (0.00) (0.00)
Leveraget -0.205*** -0.200*** -0.202*** -0.213*** -0.274*** (0.00) (0.00) (0.00) (0.00) (0.00) Industry Performancet
0.714*** 0.694*** 0.694*** 0.791*** 0.708*** (0.00) (0.00) (0.00) (0.00) (0.00)
FirmSizet 0.015*** 0.006 0.002*** 0.006 -0.003 (0.00) (0.33) (0.00) (0.30) (0.67)
R&DAdvExpt -0.689*** -0.753*** -0.658*** -0.910*** -0.795*** (0.00) (0.00) (0.00) (0.00) (0.00)
BoardSizet -0.008*** -0.006** -0.005** 0.002 -0.004 (0.00) (0.01) (0.04) (0.68) (0.20)
InfoCostt -0.226*** -0.198*** -0.190** -0.390*** -0.251** (0.00) (0.01) (0.01) (0.00) (0.01)
TreasStockt 0.367*** 0.364*** 0.389*** 0.368*** 0.329*** (0.00) (0.00) (0.00) (0.00) (0.00)
# of Observations 5,156 4,665 5,156 4,566 4,566
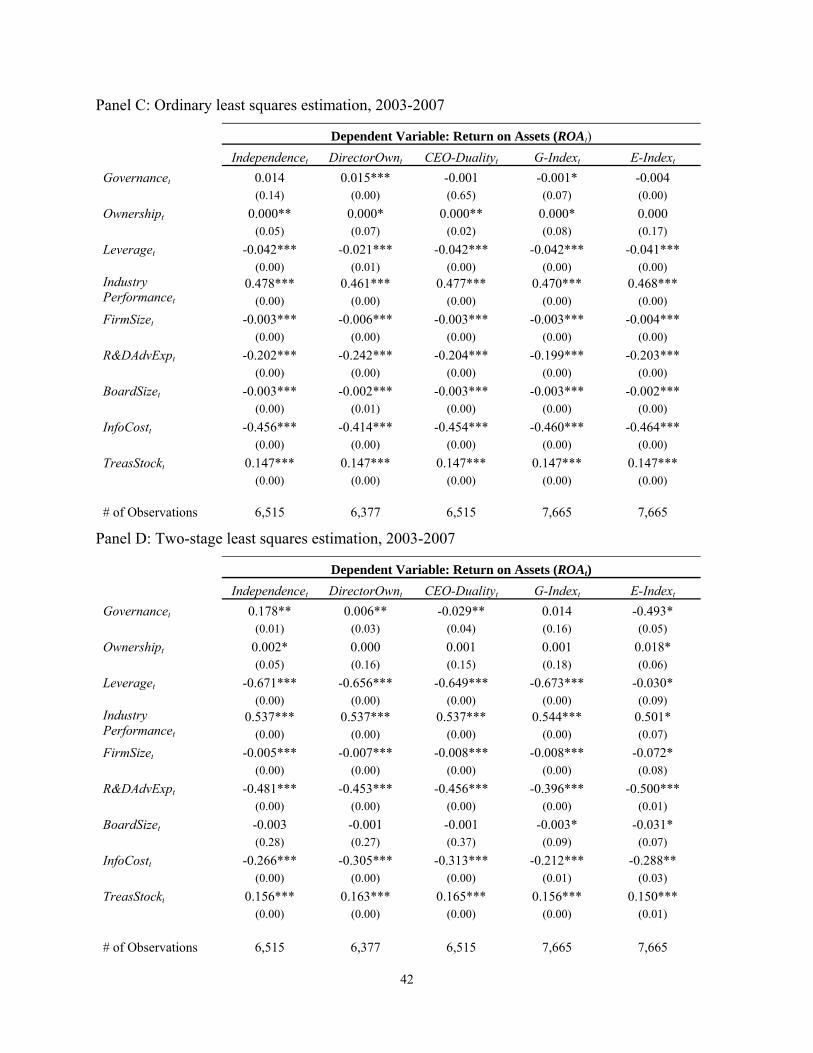
42
Panel C: Ordinary least squares estimation, 2003-2007
Dependent Variable: Return on Assets (ROAt)
Independencet DirectorOwnt CEO-Dualityt G-Indext E-Indext
Governancet 0.014 0.015*** -0.001 -0.001* -0.004 (0.14) (0.00) (0.65) (0.07) (0.00)
Ownershipt 0.000** 0.000* 0.000** 0.000* 0.000 (0.05) (0.07) (0.02) (0.08) (0.17)
Leveraget -0.042*** -0.021*** -0.042*** -0.042*** -0.041*** (0.00) (0.01) (0.00) (0.00) (0.00) Industry Performancet
0.478*** 0.461*** 0.477*** 0.470*** 0.468*** (0.00) (0.00) (0.00) (0.00) (0.00)
FirmSizet -0.003*** -0.006*** -0.003*** -0.003*** -0.004*** (0.00) (0.00) (0.00) (0.00) (0.00)
R&DAdvExpt -0.202*** -0.242*** -0.204*** -0.199*** -0.203*** (0.00) (0.00) (0.00) (0.00) (0.00)
BoardSizet -0.003*** -0.002*** -0.003*** -0.003*** -0.002*** (0.00) (0.01) (0.00) (0.00) (0.00)
InfoCostt -0.456*** -0.414*** -0.454*** -0.460*** -0.464*** (0.00) (0.00) (0.00) (0.00) (0.00)
TreasStockt 0.147*** 0.147*** 0.147*** 0.147*** 0.147*** (0.00) (0.00) (0.00) (0.00) (0.00) # of Observations 6,515 6,377 6,515 7,665 7,665
Panel D: Two-stage least squares estimation, 2003-2007
Dependent Variable: Return on Assets (ROAt)
Independencet DirectorOwnt CEO-Dualityt G-Indext E-Indext
Governancet 0.178** 0.006** -0.029** 0.014 -0.493* (0.01) (0.03) (0.04) (0.16) (0.05)
Ownershipt 0.002* 0.000 0.001 0.001 0.018* (0.05) (0.16) (0.15) (0.18) (0.06)
Leveraget -0.671*** -0.656*** -0.649*** -0.673*** -0.030* (0.00) (0.00) (0.00) (0.00) (0.09) Industry Performancet
0.537*** 0.537*** 0.537*** 0.544*** 0.501* (0.00) (0.00) (0.00) (0.00) (0.07)
FirmSizet -0.005*** -0.007*** -0.008*** -0.008*** -0.072* (0.00) (0.00) (0.00) (0.00) (0.08)
R&DAdvExpt -0.481*** -0.453*** -0.456*** -0.396*** -0.500*** (0.00) (0.00) (0.00) (0.00) (0.01)
BoardSizet -0.003 -0.001 -0.001 -0.003* -0.031* (0.28) (0.27) (0.37) (0.09) (0.07)
InfoCostt -0.266*** -0.305*** -0.313*** -0.212*** -0.288** (0.00) (0.00) (0.00) (0.01) (0.03)
TreasStockt 0.156*** 0.163*** 0.165*** 0.156*** 0.150*** (0.00) (0.00) (0.00) (0.00) (0.01)
# of Observations 6,515 6,377 6,515 7,665 7,665
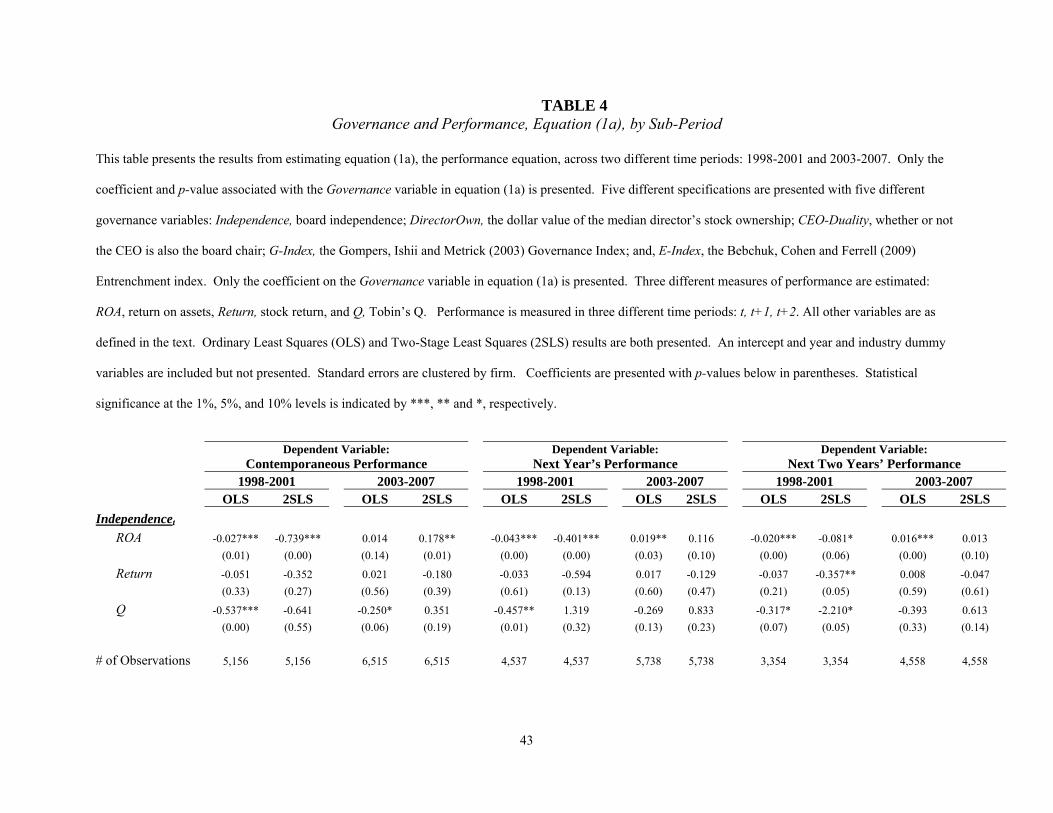
43
TABLE 4 Governance and Performance, Equation (1a), by Sub-Period
This table presents the results from estimating equation (1a), the performance equation, across two different time periods: 1998-2001 and 2003-2007. Only the
coefficient and p-value associated with the Governance variable in equation (1a) is presented. Five different specifications are presented with five different
governance variables: Independence, board independence; DirectorOwn, the dollar value of the median director’s stock ownership; CEO-Duality, whether or not
the CEO is also the board chair; G-Index, the Gompers, Ishii and Metrick (2003) Governance Index; and, E-Index, the Bebchuk, Cohen and Ferrell (2009)
Entrenchment index. Only the coefficient on the Governance variable in equation (1a) is presented. Three different measures of performance are estimated:
ROA, return on assets, Return, stock return, and Q, Tobin’s Q. Performance is measured in three different time periods: t, t+1, t+2. All other variables are as
defined in the text. Ordinary Least Squares (OLS) and Two-Stage Least Squares (2SLS) results are both presented. An intercept and year and industry dummy
variables are included but not presented. Standard errors are clustered by firm. Coefficients are presented with p-values below in parentheses. Statistical
significance at the 1%, 5%, and 10% levels is indicated by ***, ** and *, respectively.
Dependent Variable:
Contemporaneous Performance Dependent Variable:
Next Year’s Performance Dependent Variable:
Next Two Years’ Performance 1998-2001 2003-2007 1998-2001 2003-2007 1998-2001 2003-2007 OLS 2SLS OLS 2SLS OLS 2SLS OLS 2SLS OLS 2SLS OLS 2SLS
Independencet
ROA -0.027*** -0.739*** 0.014 0.178** -0.043*** -0.401*** 0.019** 0.116 -0.020*** -0.081* 0.016*** 0.013
(0.01) (0.00) (0.14) (0.01) (0.00) (0.00) (0.03) (0.10) (0.00) (0.06) (0.00) (0.10)
Return -0.051 -0.352 0.021 -0.180 -0.033 -0.594 0.017 -0.129 -0.037 -0.357** 0.008 -0.047
(0.33) (0.27) (0.56) (0.39) (0.61) (0.13) (0.60) (0.47) (0.21) (0.05) (0.59) (0.61)
Q -0.537*** -0.641 -0.250* 0.351 -0.457** 1.319 -0.269 0.833 -0.317* -2.210* -0.393 0.613
(0.00) (0.55) (0.06) (0.19) (0.01) (0.32) (0.13) (0.23) (0.07) (0.05) (0.33) (0.14)
# of Observations 5,156 5,156 6,515 6,515 4,537 4,537 5,738 5,738 3,354 3,354 4,558 4,558

44
DirectorOwnt
ROA 0.015*** 0.028** 0.015*** 0.006** 0.008*** 0.034*** 0.012*** 0.004 0.004*** 0.010*** 0.003*** 0.003*
(0.00) (0.02) (0.00) (0.03) (0.00) (0.00) (0.00) (0.13) (0.00) (0.00) (0.00) (0.07)
Return 0.061*** 0.046** 0.025*** 0.021* 0.006 0.073*** 0.018 0.012 0.003 0.029* 0.009 0.003
(0.00) (0.03) (0.00) (0.10) (0.41) (0.00) (0.28) (0.28) (0.35) (0.09) (0.11) (0.26)
Q 0.417*** 0.345*** 0.286*** -0.033 0.308*** 0.452*** 0.234*** 0.015 0.174*** 0.250 0.142 0.142
(0.00) (0.00) (0.00) (0.54) (0.00) (0.00) (0.00) (0.44) (0.00) (0.18) (0.12) (0.18)
# of Observations 4,665 4,665 6,377 6,377 4,537 4,537 5,738 5,738 2,976 2,976 4,300 4,300
CEO-Dualityt
ROA -0.003 -0.167*** -0.001 -0.029** -0.003 -0.094*** -0.003 -0.024 -0.003 -0.023** -0.003* -0.005
(0.57) (0.00) (0.65) (0.04) (0.43) (0.00) (0.41) (0.12) (0.30) (0.02) (0.06) (0.37)
Return -0.034 -0.088 -0.009 -0.019 -0.024 -0.193** -0.007 -0.027 -0.021 -0.950** -0.007 -0.012
(0.18) (0.22) (0.46) (0.61) (0.45) (0.03) (0.58) (0.50) (0.15) (0.02) (0.28) (0.56)
Q -0.077 -0.243 -0.062 0.028 -0.121 -0.297 -0.082* 0.091 0.058 -0.199 -0.048 -0.409
(0.28) (0.27) (0.18) (0.86) (0.17) (0.28) (0.09) (0.59) (0.50) (0.45) (0.50) (0.21)
# of Observations 5,156 5,156 6,515 6,515 4,537 4,537 5,738 5,738 3,354 3,354 4,558 4,558
G-Indext
ROA -0.001 -0.097*** -0.001* 0.014 0.002*** -0.040** -0.007 0.035*** -0.001** -0.019** -0.001 0.014
(0.54) (0.00) (0.07) (0.16) (0.00) (0.04) (0.15) (0.00) (0.01) (0.03) (0.30) (0.39)
Return -0.001 -0.049 0.003 -0.015 0.006 -0.106** -0.003* -0.006 -0.003 -0.073* 0.001 0.007
(0.82) (0.28) (0.11) (0.52) (0.13) (0.05) (0.06) (0.72) (0.23) (0.06) (0.25) (0.53)
Q -0.047*** -0.583*** -0.027*** 0.138 -0.031*** -0.248** -0.020*** 0.144* -0.016 -0.150 -0.011 0.018
(0.00) (0.00) (0.00) (0.18) (0.00) (0.05) (0.00) (0.08) (0.19) (0.39) (0.40) (0.90)
# of Observations 4,566 4,566 7,665 7,665 3,758 3,758 6,733 6,733 2,909 2,909 5,479 5,479
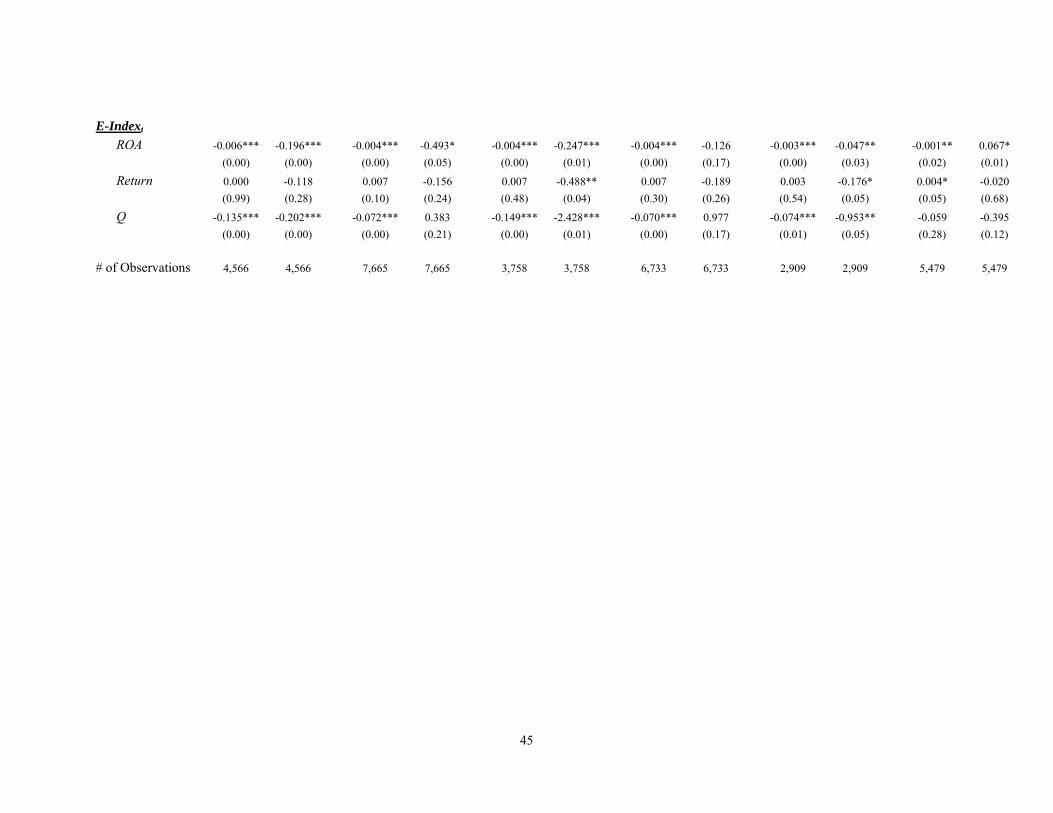
45
E-Indext
ROA -0.006*** -0.196*** -0.004*** -0.493* -0.004*** -0.247*** -0.004*** -0.126 -0.003*** -0.047** -0.001** 0.067*
(0.00) (0.00) (0.00) (0.05) (0.00) (0.01) (0.00) (0.17) (0.00) (0.03) (0.02) (0.01)
Return 0.000 -0.118 0.007 -0.156 0.007 -0.488** 0.007 -0.189 0.003 -0.176* 0.004* -0.020
(0.99) (0.28) (0.10) (0.24) (0.48) (0.04) (0.30) (0.26) (0.54) (0.05) (0.05) (0.68)
Q -0.135*** -0.202*** -0.072*** 0.383 -0.149*** -2.428*** -0.070*** 0.977 -0.074*** -0.953** -0.059 -0.395
(0.00) (0.00) (0.00) (0.21) (0.00) (0.01) (0.00) (0.17) (0.01) (0.05) (0.28) (0.12)
# of Observations 4,566 4,566 7,665 7,665 3,758 3,758 6,733 6,733 2,909 2,909 5,479 5,479

46
TABLE 5 Governance and Performance, Equation (1a), by Change in Independent Directors
This table presents the results from estimating equation (1a), the performance equation, across the two different time periods, 1998-2001 and 2003-2007, for two
unique sub-samples: those firms that increased their number of independent directors and those that did not. Five different specifications are presented with five
different governance variables: Independence, board independence; DirectorOwn, the dollar value of the median director’s stock ownership; CEO-Duality,
whether or not the CEO is also the board chair; G-Index, the Gompers, Ishii and Metrick (2003) Governance Index; and, E-Index, the Bebchuk, Cohen and
Ferrell Entrenchment index. Only the coefficient on the Governance variable in equation (1a) is presented. Return on assets, ROA, is the measure of
performance. Panel A shows the results for the subsample of firms that increased the number of independent directors on its board; Panel B shows the results
for the subsample of firms that did not increase the number of independent directors on its board. All other variables are as defined in the text. Only Two-Stage
Least Squares (2SLS) results are presented. An intercept and year and industry dummy variables are included but not presented. Standard errors are clustered by
firm. Coefficients are presented with p-values below in parentheses. Statistical significance at the 1%, 5%, and 10% levels is indicated by ***, ** and *,
respectively.

47
Panel A: Increase in number of independent directors
Dependent Variable:
Contemporaneous ROA Dependent Variable: Next Year’s ROA
Dependent Variable: Next Two Years’ ROA
1998-2001 2003-2007 1998-2001 2003-2007 1998-2001 2003-2007 Independencet -0.412* 0.509*** -0.583*** 0.114* -0.052 0.177** (0.10) (0.00) (0.00) (0.10) (0.29) (0.03)
# of Observations 1,344 2,066 1,187 1,982 887 1,588
DirectorOwnt 0.018** 0.001*** 0.017*** 0.009*** 0.011 0.007** (0.03) (0.01) (0.00) (0.00) (0.12) (0.02)
# of Observations 1,283 1,967 1,160 1,871 863 1,454
CEO-Dualityt -0.087 -0.004 -0.092*** 0.000 -0.012 -0.075*** (0.18) (0.84) (0.01) (0.98) (0.52) (0.00)
# of Observations 1,344 2,066 1,187 1,982 887 1,588
G-Indext -0.053 0.040* 0.010 -0.047*** 0.005 -0.033*** (0.13) (0.08) (0.27) (0.00) (0.56) (0.01)
# of Observations 1,208 2,015 1,085 1,958 793 1,621
E-Indext -0.063 -0.567 -0.169*** -0.004*** -0.008 -0.071** (0.32) (0.27) (0.00) (0.00) (0.58) (0.03)
# of Observations 1,208 2,015 1,085 1,958 793 1,621
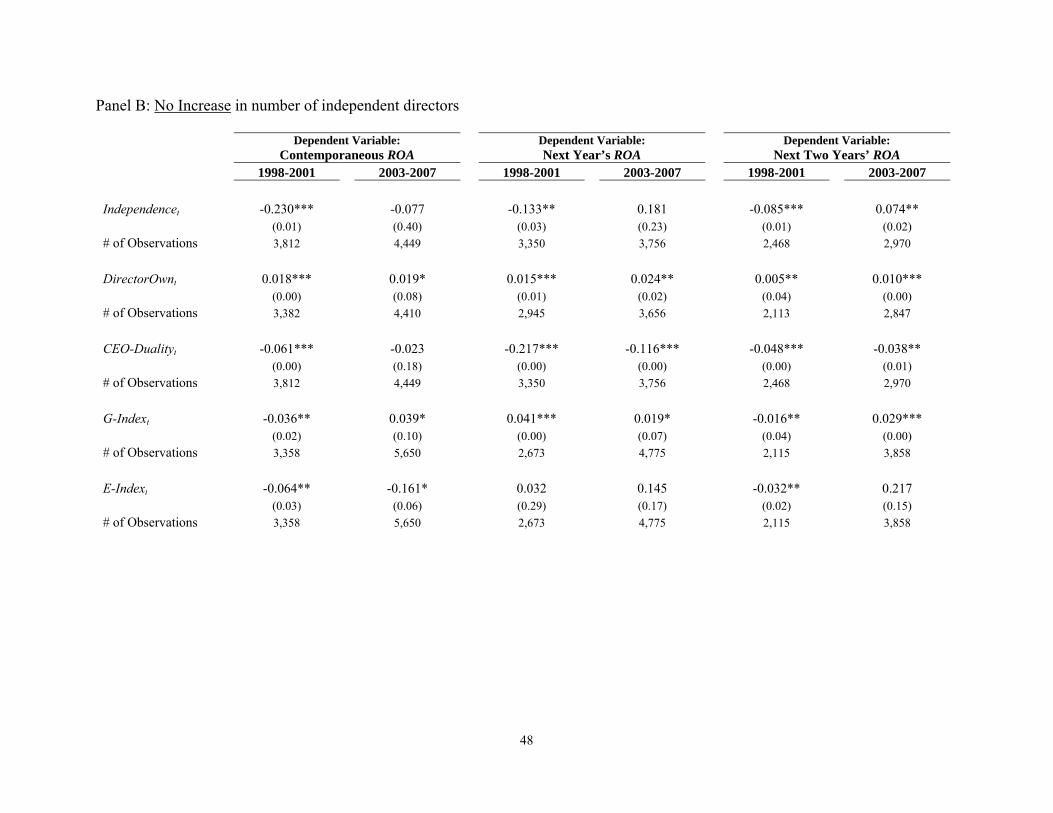
48
Panel B: No Increase in number of independent directors
Dependent Variable:
Contemporaneous ROA Dependent Variable: Next Year’s ROA
Dependent Variable: Next Two Years’ ROA
1998-2001 2003-2007 1998-2001 2003-2007 1998-2001 2003-2007
Independencet -0.230*** -0.077 -0.133** 0.181 -0.085*** 0.074** (0.01) (0.40) (0.03) (0.23) (0.01) (0.02)
# of Observations 3,812 4,449 3,350 3,756 2,468 2,970
DirectorOwnt 0.018*** 0.019* 0.015*** 0.024** 0.005** 0.010*** (0.00) (0.08) (0.01) (0.02) (0.04) (0.00)
# of Observations 3,382 4,410 2,945 3,656 2,113 2,847
CEO-Dualityt -0.061*** -0.023 -0.217*** -0.116*** -0.048*** -0.038** (0.00) (0.18) (0.00) (0.00) (0.00) (0.01)
# of Observations 3,812 4,449 3,350 3,756 2,468 2,970
G-Indext -0.036** 0.039* 0.041*** 0.019* -0.016** 0.029*** (0.02) (0.10) (0.00) (0.07) (0.04) (0.00)
# of Observations 3,358 5,650 2,673 4,775 2,115 3,858
E-Indext -0.064** -0.161* 0.032 0.145 -0.032** 0.217 (0.03) (0.06) (0.29) (0.17) (0.02) (0.15)
# of Observations 3,358 5,650 2,673 4,775 2,115 3,858
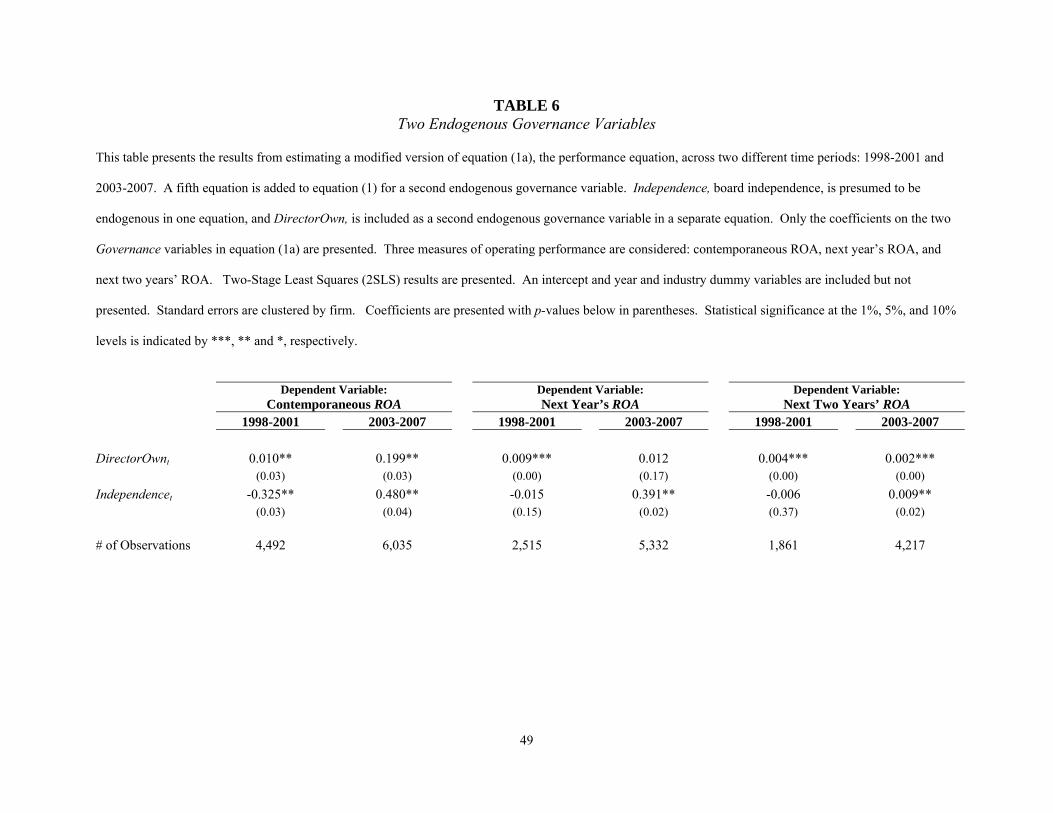
49
TABLE 6 Two Endogenous Governance Variables
This table presents the results from estimating a modified version of equation (1a), the performance equation, across two different time periods: 1998-2001 and
2003-2007. A fifth equation is added to equation (1) for a second endogenous governance variable. Independence, board independence, is presumed to be
endogenous in one equation, and DirectorOwn, is included as a second endogenous governance variable in a separate equation. Only the coefficients on the two
Governance variables in equation (1a) are presented. Three measures of operating performance are considered: contemporaneous ROA, next year’s ROA, and
next two years’ ROA. Two-Stage Least Squares (2SLS) results are presented. An intercept and year and industry dummy variables are included but not
presented. Standard errors are clustered by firm. Coefficients are presented with p-values below in parentheses. Statistical significance at the 1%, 5%, and 10%
levels is indicated by ***, ** and *, respectively.
Dependent Variable:
Contemporaneous ROA Dependent Variable: Next Year’s ROA
Dependent Variable: Next Two Years’ ROA
1998-2001 2003-2007 1998-2001 2003-2007 1998-2001 2003-2007
DirectorOwnt 0.010** 0.199** 0.009*** 0.012 0.004*** 0.002*** (0.03) (0.03) (0.00) (0.17) (0.00) (0.00)
Independencet -0.325** 0.480** -0.015 0.391** -0.006 0.009** (0.03) (0.04) (0.15) (0.02) (0.37) (0.02)
# of Observations 4,492 6,035 2,515 5,332 1,861 4,217
50
TABLE 7 Event Study Results
This table presents the results from event studies performed on a sample of firms that were not compliant with Section 301 of SOX in year t-1. Section 301
requires that all members of a firm’s audit committee be independent. Market Adjusted Cumulative Abnormal Returns (CAR) are calculated for days -1, 0 and
+1 for years 2002 and 2003; day 0 being the proxy mailing date in year t. The value weighted market is used as the market index. Two sub-samples are
considered: (a) firms that were not compliant in year t-1and became compliant in year t in columns (1) to (5); and, (b) firms that were not compliant in both year
t-1 and year t in columns (6) to (10). Firms audit committees consisting only of independent directors are denoted as “Compliant.” Firms whose audit
committees do not consist only of independent directors are denoted as “Not Compliant.” Panel A presents results from only firms that became SOX compliant
and added independent directors to the board; Panel B presents the results from all firms that became SOX compliant. The non-parametric test is the Wilcoxon
signed-rank test. The “Difference in means” in the last column tests for the difference in CAR between columns (1) and (6).
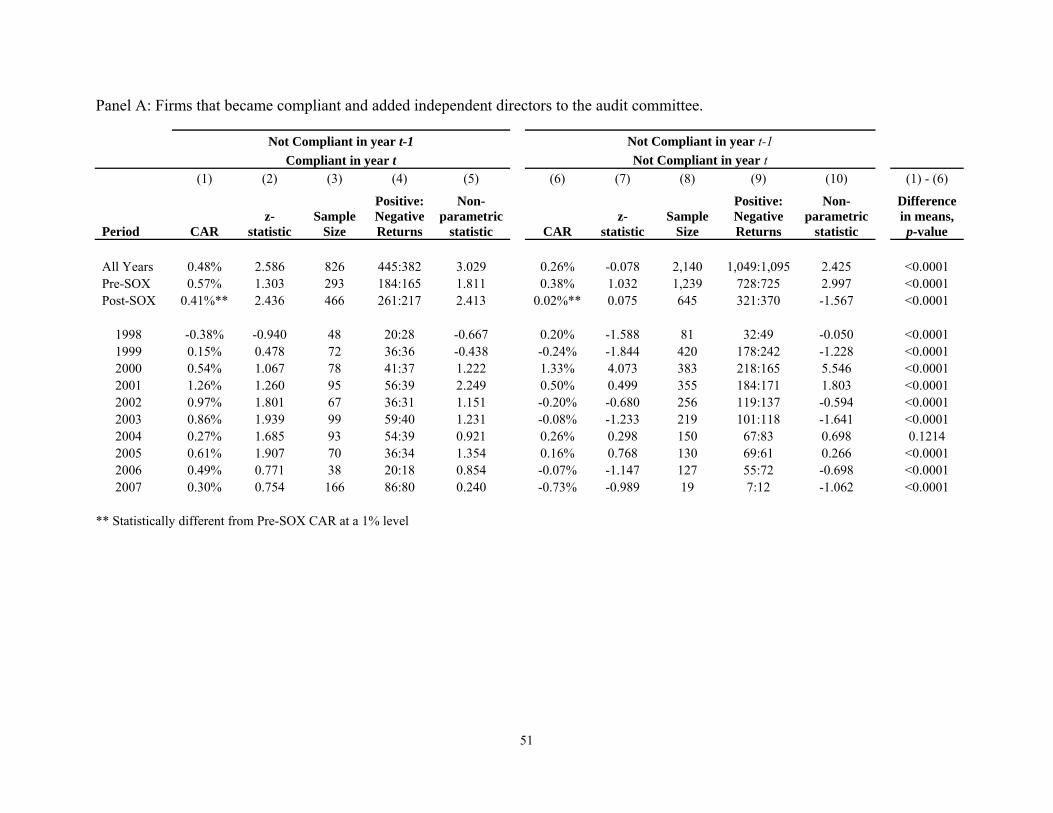
51
Panel A: Firms that became compliant and added independent directors to the audit committee.
Not Compliant in year t-1 Not Compliant in year t-1
Compliant in year t Not Compliant in year t (1) (2) (3) (4) (5) (6) (7) (8) (9) (10) (1) - (6)
Period CAR z-
statistic Sample
Size
Positive: Negative Returns
Non-parametric
statistic CAR z-
statistic Sample
Size
Positive: Negative Returns
Non-parametric
statistic
Difference in means, p-value
All Years 0.48% 2.586 826 445:382 3.029 0.26% -0.078 2,140 1,049:1,095 2.425 <0.0001 Pre-SOX 0.57% 1.303 293 184:165 1.811 0.38% 1.032 1,239 728:725 2.997 <0.0001 Post-SOX 0.41%** 2.436 466 261:217 2.413 0.02%** 0.075 645 321:370 -1.567 <0.0001
1998 -0.38% -0.940 48 20:28 -0.667 0.20% -1.588 81 32:49 -0.050 <0.0001 1999 0.15% 0.478 72 36:36 -0.438 -0.24% -1.844 420 178:242 -1.228 <0.0001 2000 0.54% 1.067 78 41:37 1.222 1.33% 4.073 383 218:165 5.546 <0.0001 2001 1.26% 1.260 95 56:39 2.249 0.50% 0.499 355 184:171 1.803 <0.0001 2002 0.97% 1.801 67 36:31 1.151 -0.20% -0.680 256 119:137 -0.594 <0.0001 2003 0.86% 1.939 99 59:40 1.231 -0.08% -1.233 219 101:118 -1.641 <0.0001 2004 0.27% 1.685 93 54:39 0.921 0.26% 0.298 150 67:83 0.698 0.1214 2005 0.61% 1.907 70 36:34 1.354 0.16% 0.768 130 69:61 0.266 <0.0001 2006 0.49% 0.771 38 20:18 0.854 -0.07% -1.147 127 55:72 -0.698 <0.0001 2007 0.30% 0.754 166 86:80 0.240 -0.73% -0.989 19 7:12 -1.062 <0.0001
** Statistically different from Pre-SOX CAR at a 1% level

52
Panel B: Firms that became compliant by adding independent directors to the audit committee, or removing inside directors from the audit committee.
Not Compliant in year t-1 Not Compliant in year t-1
Compliant in year t Not Compliant in year t (1) (2) (3) (4) (5) (6) (7) (8) (9) (10) (1) - (6)
Period CAR z-
statistic Sample
Size
Positive: Negative Returns
Non-parametric
statistic CAR z-
statistic Sample
Size
Positive: Negative Returns
Non-parametric
statistic
Difference in means, p-value
All Years 0.55% 3.813 1,265 689:576 4.306 0.26% -0.078 2,140 1,049:1,095 2.425 <0.0001 Pre-SOX 0.77% 2.563 521 322:272 3.265 0.38% 1.032 1,239 728:725 2.997 <0.0001 Post-SOX 0.36%** 2.841 655 367:304 2.386 0.02%** 0.075 645 321:370 -1.567 <0.0001
1998 0.06% 0.325 94 47:47 0.371 0.20% -1.588 81 32:49 -0.050 <0.0001 1999 0.07% 0.113 118 56:62 -0.637 -0.24% -1.844 420 178:242 -1.228 <0.0001 2000 0.95% 1.454 151 79:72 2.733 1.33% 4.073 383 218:165 5.546 <0.0001 2001 1.49% 2.451 158 98:60 3.113 0.50% 0.499 355 184:171 1.803 <0.0001 2002 1.03% 1.725 89 50:39 1.137 -0.20% -0.680 256 119:137 -0.594 <0.0001 2003 0.56% 2.087 158 92:66 1.612 -0.08% -1.233 219 101:118 -1.641 <0.0001 2004 0.24% 2.269 149 87:62 1.876 0.26% 0.298 150 67:83 0.698 0.3716 2005 0.26% 1.255 97 50:47 1.299 0.16% 0.768 130 69:61 0.266 0.0008 2006 0.69% 1.646 57 32:25 0.602 -0.07% -1.147 127 55:72 -0.698 <0.0001 2007 0.13% 0.781 194 100:94 0.005 -0.73% -0.989 19 7:12 -1.062 <0.0001
** Statistically different from Pre-SOX CAR at a 1% level

53
TABLE 8 Reasons for CEO Turnover
This table presents the classifications for reasons why CEO turnover occurred in a specific year. Lexis-Nexis archives
were reviewed to determine the stated reason for why a CEO left the firm. CEO turnover data was obtained from
Compustat’s Execucomp database. CEO Turnover is classified as “Non-disciplinary” if the CEO died, if the CEO
was older than 63, if the change was the result of an announced transition plan, or if the CEO stayed on as chairman
of the board. CEO Turnover is classified as “Disciplinary” if the CEO resigned to pursue other interests, if the CEO
was fired, or if no specific reason is given.
Reasons for CEO Turnover: 1998 - 2007
Disciplinary Non-Disciplinary Other Total 1998 65 118 18 201
1999 66 127 5 198
2000 92 143 9 244
2001 86 162 7 255
2002 81 100 1 182
2003 82 94 3 179
2004 49 122 3 174
2005 73 135 2 210
2006 61 126 0 187
2007 46 73 2 121
Total 701 1,200 50 1,951
% of Total 35.9% 61.5% 2.6% 100%

54
TABLE 9 CEO Turnover-Governance Relation
This table presents the results from multinomial logistic regressions estimating the probability of CEO Turnover. The dependent variables are type of CEO
turnover: 1 = Disciplinary turnover, 2 = Non-disciplinary turnover, 0 = no turnover. Baseline results without governance are presented in the first column; all
other columns present results including Governance and (Performance x Governance) variables. The other control variables are described in the text 1. Year
dummy variables are included but are not shown. Panel A presents the results for disciplinary turnover for 1998-2001; Panel B presents the results for disciplinary
turnover for 2003-2007. Panel C compares the Returnt-2 to t-1 x Governancet interactive terms from Panels A and B across the two time periods, pre-SOX to post-
SOX. Sample size refers to the entire sample for the particular period, and not just to cases of disciplinary turnover and non-disciplinary turnover. In panels A and
B, statistical significance at the 1%, 5%, and 10% levels is indicated by ***, ** and *, respectively.
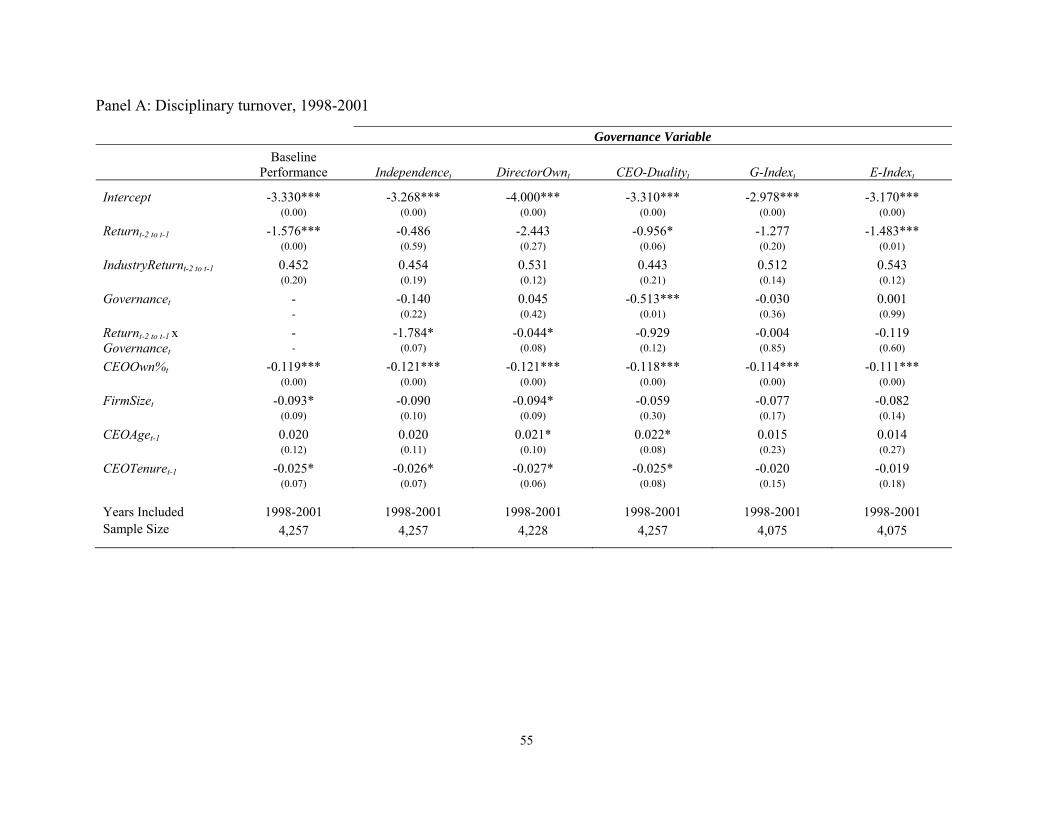
55
Panel A: Disciplinary turnover, 1998-2001
Governance Variable
Baseline
Performance Independencet DirectorOwnt CEO-Dualityt G-Indext E-Indext
Intercept -3.330*** -3.268*** -4.000*** -3.310*** -2.978*** -3.170*** (0.00) (0.00) (0.00) (0.00) (0.00) (0.00)
Returnt-2 to t-1 -1.576*** -0.486 -2.443 -0.956* -1.277 -1.483*** (0.00) (0.59) (0.27) (0.06) (0.20) (0.01)
IndustryReturnt-2 to t-1 0.452 0.454 0.531 0.443 0.512 0.543 (0.20) (0.19) (0.12) (0.21) (0.14) (0.12)
Governancet - -0.140 0.045 -0.513*** -0.030 0.001 - (0.22) (0.42) (0.01) (0.36) (0.99)
Returnt-2 to t-1 x Governancet
- -1.784* -0.044* -0.929 -0.004 -0.119 - (0.07) (0.08) (0.12) (0.85) (0.60)
CEOOwn%t -0.119*** -0.121*** -0.121*** -0.118*** -0.114*** -0.111*** (0.00) (0.00) (0.00) (0.00) (0.00) (0.00)
FirmSizet -0.093* -0.090 -0.094* -0.059 -0.077 -0.082 (0.09) (0.10) (0.09) (0.30) (0.17) (0.14)
CEOAget-1 0.020 0.020 0.021* 0.022* 0.015 0.014 (0.12) (0.11) (0.10) (0.08) (0.23) (0.27)
CEOTenuret-1 -0.025* -0.026* -0.027* -0.025* -0.020 -0.019 (0.07) (0.07) (0.06) (0.08) (0.15) (0.18)
Years Included 1998-2001 1998-2001 1998-2001 1998-2001 1998-2001 1998-2001 Sample Size 4,257 4,257 4,228 4,257 4,075 4,075

56
Panel B: Disciplinary turnover, 2003-2007
Governance Variable
Baseline
Performance Independencet DirectorOwnt CEO-Dualityt G-Indext E-Indext
Intercept -0.978 -14.468 -11.677 -13.555 -12.921 -12.879 (0.98) (0.87) (0.90) (0.88) (0.88) (0.88)
Returnt-2 to t-1 -3.510*** -0.712 -0.161 -2.942*** 0.628 -2.194** (0.00) (0.83) (0.92) (0.00) (0.72) (0.03)
IndustryReturnt-2 to t-1 0.344** 0.456 0.542 0.491 0.337 0.309 (0.05) (0.49) (0.41) (0.46) (0.58) (0.61)
Governancet - 1.935 -0.121 -0.948 -0.009 -0.025 - (0.14) (0.26) (0.10) (0.83) (0.76)
Returnt-2 to t-1 x Governancet
- -3.726* -0.248** -1.407 -0.519*** -0.777** - (0.09) (0.05) (0.21) (0.01) (0.03)
CEOOwn%t -0.205** -0.230* -0.221* -0.206 -0.289** -0.285** (0.04) (0.08) (0.09) (0.11) (0.03) (0.04)
FirmSizet 0.079 0.074 0.101 0.145** 0.103* 0.105* (0.14) (0.23) (0.10) (0.02) (0.06) (0.06)
CEOAget-1 0.056*** 0.068*** 0.067*** 0.078*** 0.059*** 0.058*** (0.00) (0.00) (0.00) (0.00) (0.00) (0.00)
CEOTenuret-1 -0.030* -0.036* -0.039** -0.029 -0.035* -0.034* (0.07) (0.07) (0.04) (0.12) (0.05) (0.05)
Years Included 2003-2007 2003-2007 2003-2007 2003-2007 2003-2007 2003-2007 Sample Size 6,410 5,547 5,501 5,547 5,876 5,876
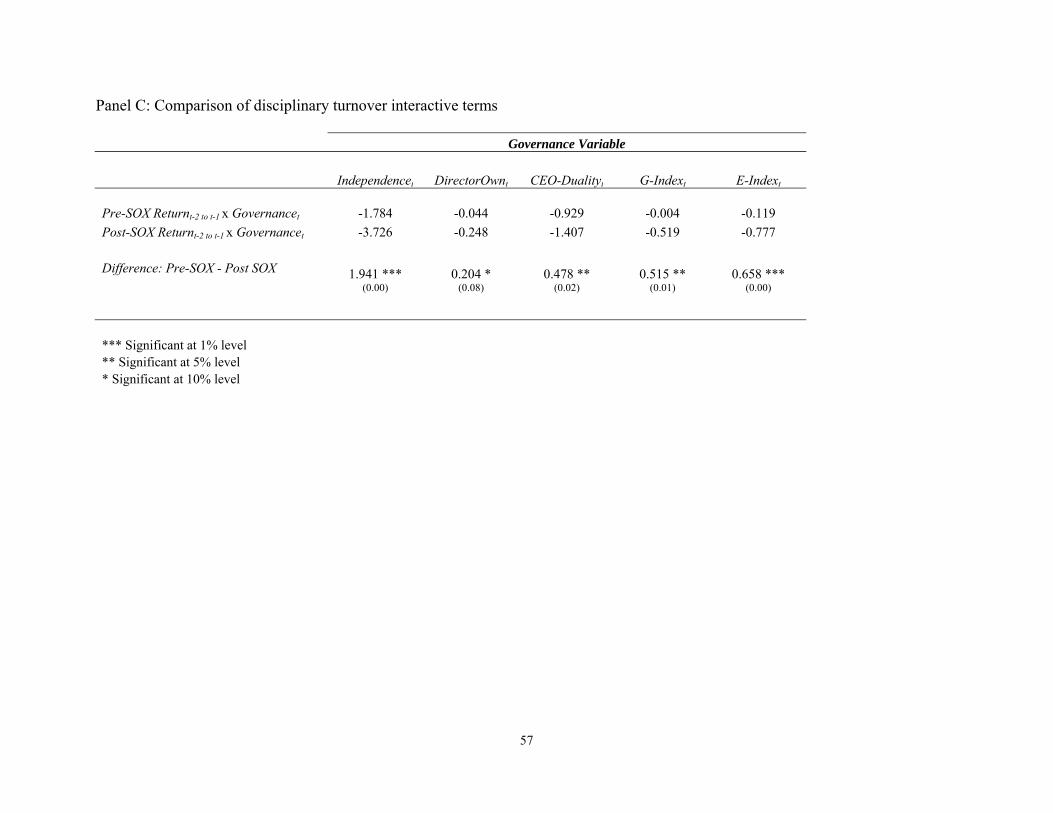
57
Panel C: Comparison of disciplinary turnover interactive terms
Governance Variable
Independencet DirectorOwnt CEO-Dualityt G-Indext E-Indext
Pre-SOX Returnt-2 to t-1 x Governancet -1.784 -0.044 -0.929 -0.004 -0.119
Post-SOX Returnt-2 to t-1 x Governancet -3.726 -0.248 -1.407 -0.519 -0.777
Difference: Pre-SOX - Post SOX 1.941 *** 0.204 * 0.478 ** 0.515 ** 0.658 ***
(0.00) (0.08) (0.02) (0.01) (0.00)
*** Significant at 1% level ** Significant at 5% level * Significant at 10% level

58
TABLE 10 Impact of Corporate Governance on Making Acquisitions
Using the full sample of firms, this table presents the results from a logit model estimating the probability of a firm making an acquisition relative to not making
an acquisition. SDC data is used to identify whether or not a sample firm made an acquisition in a given year. The dependent variable is equal to 1 if the firm
makes an acquisition and 0 otherwise. Baseline results without governance are presented in the first column; all other columns present results including
Governance variables. The other control variables are described in the text 1. Year dummy variables are included but are not shown. Intercepts and year and
industry dummies are included but not presented. Panel A presents the results for 1998-2001; Panel B presents the results for disciplinary turnover for 2003-
2007; Panel C presents the implied probabilities of acquisition for both sample periods and compares these probabilities across sample periods; and, Panel D
presents an event study of the Cumulative Abnormal Returns (CAR) surrounding the acquisition announcement date within sample. In panels A and B, statistical
significance at the 1%, 5%, and 10% levels is indicated by ***, ** and *, respectively.

59
Panel A: Pre-SOX, 1998-2001
Baseline Independence DirectorOwn CEO-Duality GIM G-Index BCF E-Index Past 2 years return 0.469*** 0.471*** 0.396*** 0.467*** 0.490*** 0.483***
(0.00) (0.00) (0.00) (0.00) (0.00) (0.00)
Past 2 years industry return
0.469*** 0.470*** 0.471*** 0.472*** 0.463** 0.454** (0.01) (0.01) (0.01) (0.01) (0.01) (0.01)
Governance - -0.111* -0.084*** -0.057** -0.008* -0.016* - (0.06) (0.00) (0.05) (0.06) (0.06)
CEO Ownership -0.011 -0.010 -0.013* -0.011* -0.007 -0.007 (0.11) (0.14) (0.06) (0.09) (0.34) (0.28)
Size (Assets) 0.292*** 0.290*** 0.283*** 0.289*** 0.300*** 0.301*** (0.00) (0.00) (0.00) (0.00) (0.00) (0.00)
Leverage 0.088 0.092 0.199 0.084 0.252 0.260 (0.70) (0.69) (0.39) (0.71) (0.29) (0.27)
Market-to-Book 0.006 0.006 0.005 0.006 0.006 0.006 (0.11) (0.11) (0.21) (0.11) (0.12) (0.12)
CEO Age -0.014** -0.014** -0.012** -0.014** -0.015*** -0.015** (0.01) (0.01) (0.04) (0.01) (0.01) (0.01)
CEO Tenure 0.000 0.000 -0.002 0.000 0.001 0.001 (0.99) (0.95) (0.72) (0.97) (0.83) (0.89)
Observations 4,510 4,510 4,510 4,510 4,278 4,278

60
Panel B: Post-SOX, 2003-2007
Baseline Independence DirectorOwn CEO-Duality GIM G-Index BCF E-Index Past 2 years return 0.343** 0.340** 0.261* 0.339** 0.347** 0.345**
(0.03) (0.03) (0.10) (0.04) (0.03) (0.03)
Past 2 years industry return
0.246 0.254 0.239 0.258 0.260 0.259 (0.22) (0.20) (0.23) (0.20) (0.20) (0.20)
Governance - -0.428* -0.138*** -0.206*** -0.002* -0.002 - (0.08) (0.00) (0.01) (0.09) (0.19)
CEO Ownership -0.018* -0.019* -0.018* -0.019 -0.016 -0.016 (0.09) (0.07) (0.10) (0.10) (0.13) (0.14)
Size (Assets) 0.204*** 0.209*** 0.190*** 0.211*** 0.200*** 0.200*** (0.00) (0.00) (0.00) (0.00) (0.00) (0.00)
Leverage 0.109 0.113 0.254 0.134 0.089 0.088 (0.62) (0.61) (0.25) (0.56) (0.69) (0.70)
Market-to-Book -0.004 -0.004 -0.006 -0.004 -0.004 -0.004 (0.30) (0.31) (0.19) (0.35) (0.31) (0.31)
CEO Age -0.024*** -0.023*** -0.021*** -0.021*** -0.019*** -0.019*** (0.00) (0.00) (0.00) (0.00) (0.00) (0.00)
CEO Tenure 0.010* 0.008 0.006 0.011** 0.008 0.008 (0.06) (0.12) (0.28) (0.04) (0.14) (0.14)
Observations 5,059 5,059 5,059 5,059 4,923 4,923
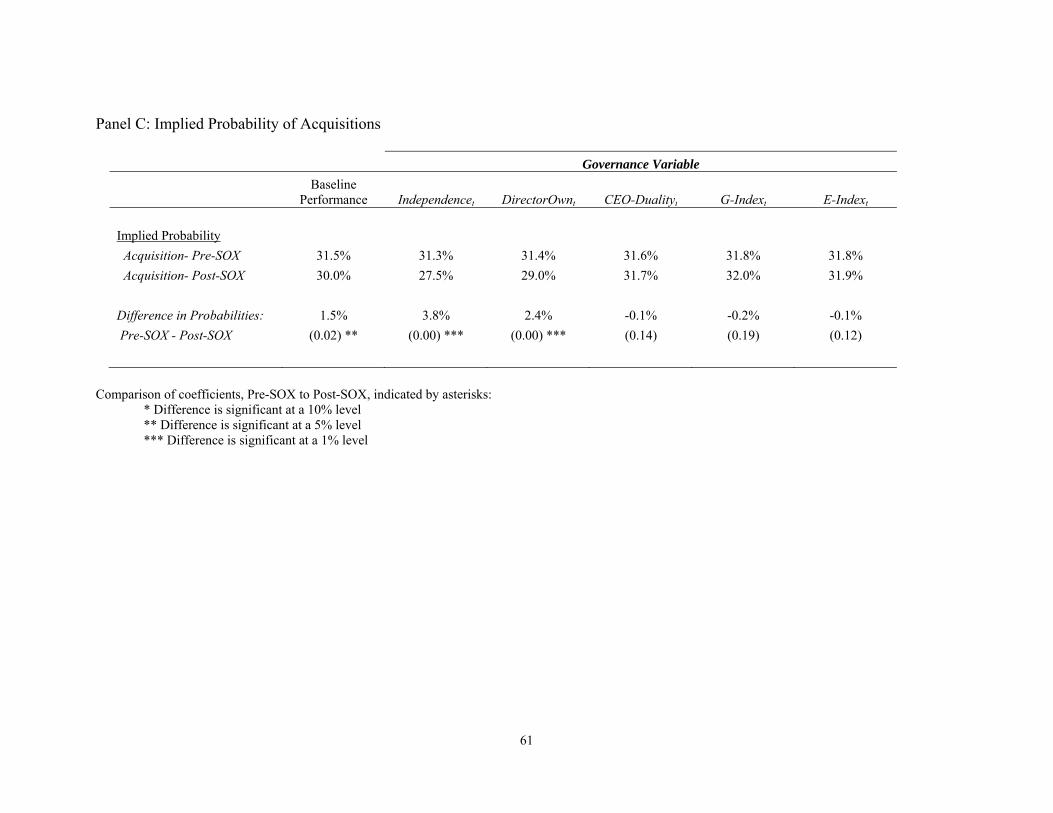
61
Panel C: Implied Probability of Acquisitions
Governance Variable
Baseline
Performance Independencet DirectorOwnt CEO-Dualityt G-Indext E-Indext
Implied Probability
Acquisition- Pre-SOX 31.5% 31.3% 31.4% 31.6% 31.8% 31.8%
Acquisition- Post-SOX 30.0% 27.5% 29.0% 31.7% 32.0% 31.9%
Difference in Probabilities: 1.5% 3.8% 2.4% -0.1% -0.2% -0.1%
Pre-SOX - Post-SOX (0.02) ** (0.00) *** (0.00) *** (0.14) (0.19) (0.12)
Comparison of coefficients, Pre-SOX to Post-SOX, indicated by asterisks:
* Difference is significant at a 10% level ** Difference is significant at a 5% level *** Difference is significant at a 1% level
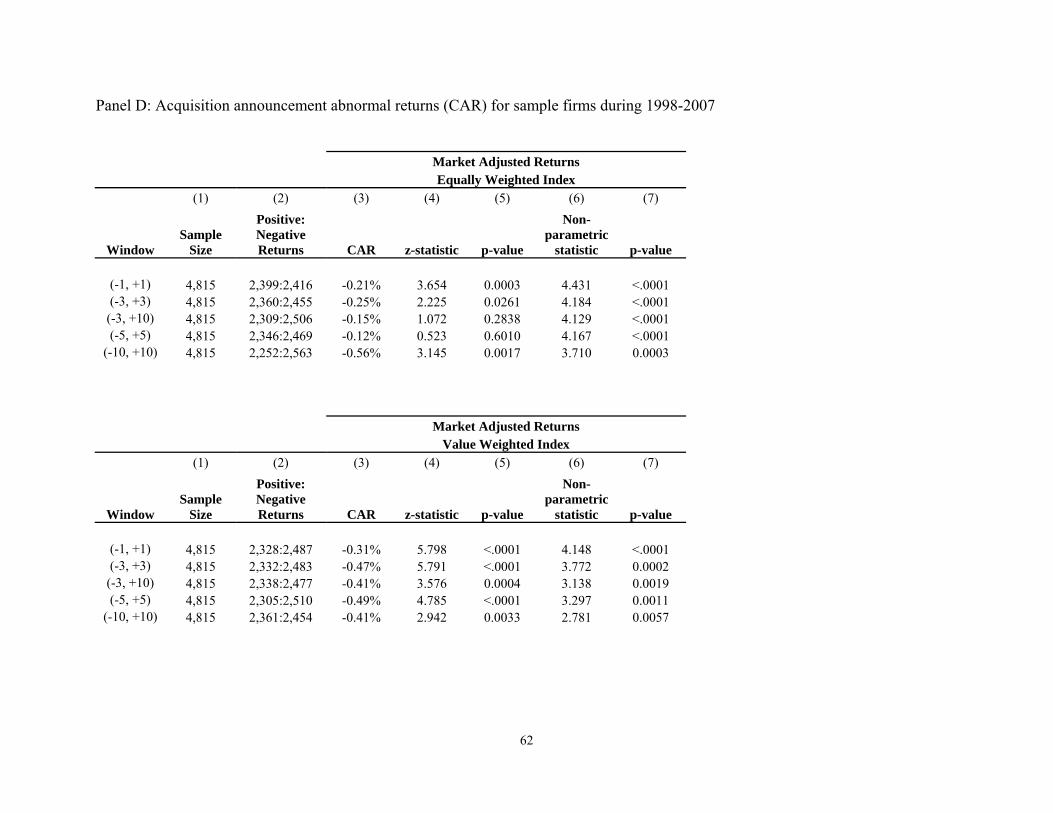
62
Panel D: Acquisition announcement abnormal returns (CAR) for sample firms during 1998-2007
Market Adjusted Returns Equally Weighted Index
(1) (2) (3) (4) (5) (6) (7)
Window Sample
Size
Positive: Negative Returns CAR z-statistic p-value
Non-parametric
statistic p-value
(-1, +1) 4,815 2,399:2,416 -0.21% 3.654 0.0003 4.431 <.0001 (-3, +3) 4,815 2,360:2,455 -0.25% 2.225 0.0261 4.184 <.0001
(-3, +10) 4,815 2,309:2,506 -0.15% 1.072 0.2838 4.129 <.0001 (-5, +5) 4,815 2,346:2,469 -0.12% 0.523 0.6010 4.167 <.0001
(-10, +10) 4,815 2,252:2,563 -0.56% 3.145 0.0017 3.710 0.0003
Market Adjusted Returns Value Weighted Index
(1) (2) (3) (4) (5) (6) (7)
Window Sample
Size
Positive: Negative Returns CAR z-statistic p-value
Non-parametric
statistic p-value
(-1, +1) 4,815 2,328:2,487 -0.31% 5.798 <.0001 4.148 <.0001 (-3, +3) 4,815 2,332:2,483 -0.47% 5.791 <.0001 3.772 0.0002
(-3, +10) 4,815 2,338:2,477 -0.41% 3.576 0.0004 3.138 0.0019 (-5, +5) 4,815 2,305:2,510 -0.49% 4.785 <.0001 3.297 0.0011
(-10, +10) 4,815 2,361:2,454 -0.41% 2.942 0.0033 2.781 0.0057

63
Appendix: (To be posted on the JFQA website. Not for publication)
Robustness Checks
Validity and Strength of Instruments
We conduct the Stock and Yogo (2004) test to ensure that our instruments are strong. We
also perform the Hahn and Hausman (2002) weak instrument test, and the Hansen-Sargan
overidentification test as discussed in Davidson and Mackinnon (2004); inferences from these
tests are consistent with the reported Stock and Yogo test results. Detailed results are noted in
Appendix A.
Second, following the suggestion of Larcker and Rusticus (2009), we consider an
alternate set of instruments in addition to the instruments noted above. Specifically, we consider
(one year) lagged performance for performance, lagged ownership for ownership, and lagged
leverage for leverage.23 Results using these instruments are consistent with the results reported
above in Table 4.
Third, following the suggestions of Stock, Wright and Yogo (2002) and Hall, Rudebusch
and Wilcox (1996) we perform the Cragg-Donald test for model identification. The Cragg-
Donald test indicates that our system of equations is well-specified.
Fourth, we perform the Anderson-Rubin test suggested by Dufour (1997) to test the joint
significance of the set of endogenous variables in our system of equations. The Anderson-Rubin
test supports the joint significance of our set of endogenous variables.
23 Kennedy (2003) notes, “It may be possible to use as an instrument the lagged value of the independent variable in
question; it is usually correlated with the original independent variable, and, although it is correlated with the
disturbance vector, because it is lagged it is not contemporaneously correlated with the disturbance (assuming the
disturbance is not autocorrelated).” We also conduct the Stock and Yogo (2004) and the Hahn and Hausman (2002)
weak instrument tests on these lagged instruments.

64
Fixed Effects Estimator
While we have tried to control for differences across sample firms, unobserved
heterogeneity across the sample firms can confound our estimated governance-performance
relation. A similar problem arises if we omit yearly variables that impact firms similarly but
differently across years. To address these concerns, we estimate the performance-governance
relationship using OLS with fixed effects estimator including firm and year fixed effects, and
clustered (Rogers) standard errors. These results are noted in Appendix B and are consistent with
those reported in Table 4.
k-class Estimator
In the case of simultaneously determined variables, 2SLS can address this problem by
using instrumental variables. There are estimators other than the 2SLS estimator, such as the k-
class estimator that can address the endogeneity problem; see Kennedy (2003) and Guggenberger
(2005). The results for k-class estimators and next year’s operating performance, next two years’
operating performance, stock return and Tobin’s Q (for contemporaneous and for the two
additional time periods) as the performance measures are consistent with the results reported in
Table 4.
Estimation of Standard Errors
Petersen (2009) and Wooldridge (2002) provide a careful analysis of the impact of
correlated residuals on the bias in standard errors in panel data. While Petersen’s work is quite
helpful in understanding the standard error estimates for a single equation model, it is unclear
how his conclusions might apply to a system of simultaneous equations. Note that both the
economics and econometrics of the performance-governance relationship as analyzed above
strongly suggest that this relationship needs to be estimated as a system of simultaneous

65
equations. We estimate the performance-governance relationship using 2SLS and
heteroscedasticity adjusted White and clustered (Rogers) standard errors. These results are
consistent with those reported earlier.
Market-to-book in Governance and Ownership Equations
Market-to-book has been documented as a determinant of ownership structure and board
structure by Himmelberg, Hubbard and Palia (1999) and Linck, Netter and Yang (2008),
respectively. We include market-to-book in equations (1b) and (1c) above and re-estimate
equations (1a) – (1d). The results are consistent with those reported in Table 4; see Appendix C.
Accounting Performance Measurement Issue
One of the main aims of SOX was stronger scrutiny over financial reporting, especially
with respect to revenue recognition.24 Cohen, Dey and Lys (2005, 2008) document a significant
change in reporting practices subsequent to the passage of SOX. Changes in reporting practices
can have a significant effect on ROA. As a robustness check, we control for the changes in
reporting practices when we consider ROA as the performance measure in equation (1a). We
measure reporting practices by the level of discretionary accruals, and use the Larcker and
Richardson (2004) model to estimate discretionary accruals.
Two separate analyses utilizing the abnormal accruals measure are performed. In the
baseline model, the Accruals variable is simply added to equation (1a). Then, the sample is split
into low accrual and high-accrual samples, for both pre-SOX and post-SOX periods, using the
median value of Accruals as the dividing point. For conciseness, only the 2SLS results are
presented. Also for conciseness, only the coefficients on the Governance and Accruals variables
24 We are indebted to an anonymous referee for helping us develop and focus our analysis here.
66
are presented. Intercepts, year dummies, industry dummies, and all other explanatory variables
in equation (1) are included but not tabulated.
Appendix D, Panel A1 (A2) presents the results for all firms for the pre-SOX (post-SOX)
period. Appendix D, Panel B1 (B2) presents the results for Low Accrual firms for the pre-SOX
(post-SOX) period. Appendix D, Panel C1 (C2) presents the results for High Accrual firms for
the pre-SOX (post-SOX) period. These tables provide evidence that performance-governance
relationships noted in Table 4 are robust to consideration of accruals as a control variable.
Alternative ROA Estimates
Core, Guay and Rusticus (2006) note "to the extent that governance affects firm
performance through capital expenditure programs, depreciation expense is an important
component of a firm's governance." For this reason, we also consider operating income after
depreciation in estimating ROA. The results are consistent with the results in Table 4.
Director Independence Measurement Issue
It is possible that firms responded to the new SOX-related director independence rule by
being more lenient about their definition of director independence.25 Approximately 2.9% of the
director-years involve a classification change (from “Affiliated” to “Independent,” or vice-
versa). This results in 1,113 firms-years containing a director classification change. For
conciseness, only the 2SLS results and the coefficients on Governance are presented. Intercepts,
year dummies, industry dummies, and all other explanatory variables in equation (1) are included
but not tabulated. In Appendix E, Panels A and B, equation (1) is estimated on only those firms
that contain a director classification change in the Pre-SOX and Post-SOX periods. In Appendix
E, Panels C and D, equation (1) is estimated on only those firms that do not contain a director
25 We are indebted to an anonymous referee for helping us develop this analysis.

67
classification change in the Pre-SOX and Post-SOX periods. The performance-governance
relationships are consistent with those reported in Table 4.
Firm Size and the Performance-Governance Relation
The performance-governance relationship could be sensitive to firm size for two reasons.
First, SOX exempts firms with market capitalization less than $75 million. Second, Linck, Netter
and Yang (2008) find that board structure determinants vary cross-sectionally with firm size. The
first concern is not quite relevant for this study since less than 0.8% of sample firms have market
capitalization less than $75 million in 2002; in 2006 all sample firms have market capitalization
greater than $75 million. To address the second concern we estimate the system for five sub-
samples categorized by size. During 1998-2001 (2003-2007) board independence is consistently
negatively (positively) related to performance for all size quintiles; see Appendix F.
Information Cost and the Performance-Governance Relation
In a recent paper, Duchin, Matsusaka and Ozbas (2010) argue that increasing board
independence does not improve performance when the high cost of obtaining useful information
about the firm precludes efficient monitoring.26 When the cost of information is low, firm
performance is positively related to board independence. Following Duchin, Matsusaka and
Ozbas, we construct an Information Cost index – “IC_Index”. We gather data on number of
analysts following each firm (number of unique analysts’ forecasts), on the dispersion in
analysts’ forecasts (standard deviation of forecasts, divided by assets), and on the analyst
forecast error (absolute difference between the mean analyst earnings forecast and the actual
earnings, divided by assets). Firms are ranked from ‘best’ to ‘worst’ on each measure (high
number of analysts, low dispersion and low error are considered ‘best’). Each firm’s percentile
26 We are indebted to an anonymous referee for helping us develop this insight.
68
ranking on each measure are averaged and scaled between zero and one, with one representing
the highest amount of information. For conciseness, only the 2SLS results are presented.
Further, only the 2 primary variables of interest are presented: the Governance variable, and the
interactive Governance x IC_Index variable. Intercepts, year dummies, industry dummies, and
all other explanatory variables in equation (1) are included but not tabulated. Appendix G, Panel
A presents the results for the pre-SOX period, 1998-2001, and Panel B presents the results for
the post-SOX period, 2003-2007.
Including the Governance x IC_Index interactive term does not change the tenor of any of
our results. The interactive term – for all variables and for both periods – shows that low
information costs and improvements in governance are associated with superior firm
performance.27
R&D Heterogeneity and the Performance-Governance Relation
Coles, Daniel & Naveen (2008) suggest that R&D intensive firms benefit more from
boards that include less independent directors (and correspondingly, more inside directors).
In Appendix H, Panel A we analyze firms with below median R&D intensity and in Panel B we
analyze firms with above median R&D intensity (R&D intensity measured by R&D expenses
divided by assets). For conciseness, only the results from the 2SLS analyses are presented. Also
for conciseness, only the coefficients on the Governance variable from equation (1a) are
27 Duchin, Matsusaka and Ozbas (2010) consider the period 2000-2005, and do not find a significant relation
between board independence and firm performance. When we consider the period 2000-2005 for our sample, we
also estimate an insignificant relation between board independence and firm performance; see Appendix G, Panel C.
Perhaps the insignificant result for 2000-2005 can be attributed to combining the negative independence-
performance relation in the pre-SOX period and the positive independence-performance relation in the post-SOX
period.

69
presented, with p-values below in parentheses. The governance-performance relationships noted
in Appendix H are consistent with those reported in Table 4. Additionally, the evidence supports
the arguments in Coles, Daniel and Naveen (2008), that R&D intensive firms benefit more from
boards that include less independent directors.
70
Appendix A: Endogeneity and Instrument Validity Tests
Hausman (1978) test for endogeneity – This tests for differences between the OLS and IV estimates. The test statistic normalizes the differences in coefficients by the differences in standard errors. Large differences between OLS and IV will result in large test statistics and low p-values, suggesting that endogeneity is a problem and that the IV results are more consistent than OLS results.
Stock and Yogo (2004) test for weak instruments – This test evaluates the strength of the first stage regression by considering the F-statistic of the reduced form first stage regression of excluded instruments. High F-statistics and low p-values suggest strong instruments.
Hahn and Hausman (2002) test for instrument validity – This test is a variation of the Hausman (1978) test for endogeneity, applied to the instruments rather than the specification. This test compares the ‘forward’ and ‘reverse’ IV estimates. If the instruments are valid, the difference between the ‘forward’ and the inverse of the ‘reverse’ estimates should be small, leading to large test statistics and small p-values.
Cragg-Donald (1993) – This is a test of underidentification. The Stock and Yogo (2004) test was, in part, derived from this test. If the Cragg-Donald F-statistic is below the critical value, or the p-value is high, the instruments are deemed to be weak.
Hansen-Sargan – This is a test for overidentifying restrictions, testing the joint significance of the set of endogenous variables in the system of equations. It has a Chi-square distribution (with degrees of freedom equal to the number of instruments minus the number of parameters), and the null hypothesis is that the instruments are valid. Large p-values suggest that the instruments are valid.
Anderson-Rubin – This is a test of the joint significance of a set of endogenous variables in a system of equations. It tests for the joint significance of the excluded instruments by essentially substituting the first-stage reduced-form equations into the second-stage structural equations. The test statistic has a Chi-square distribution; large test statistics and small p-values suggest instrument validity and joint significance of the system.
Shea (1997) Partial R2 – This test provides the partial R2 for the excluded instruments on the fitted value of the endogenous regressors. Higher partial R2 values are deemed to represent valid instruments, although there is no formal test statistic. Instruments: For each governance variable, we utilize two of three instruments for our governance variables. Dir%Own is the average percentage of common stock owned by all directors. Dir%CEOs is the percentage of directors who are CEOs. Dir%15Ten is the percentage of directors who have served on the board form at least 15 years. Dir%Own is used as an instrument for all governance variables. Dir%CEOs is used as an instrument for Independence, DirectorOwn, and CEO-Duality; Dir%15Ten is used as an instrument for G-Index and E-Index.
TreasStock is the ratio of treasury stock to assets, which we use as the instrument for performance. CEOTenAge is the ratio of CEO tenure to CEO age; this variable is used as the instrument for ownership. ZScore is the modified Altman’s Z-Score; this variable is used as the instrument for leverage.
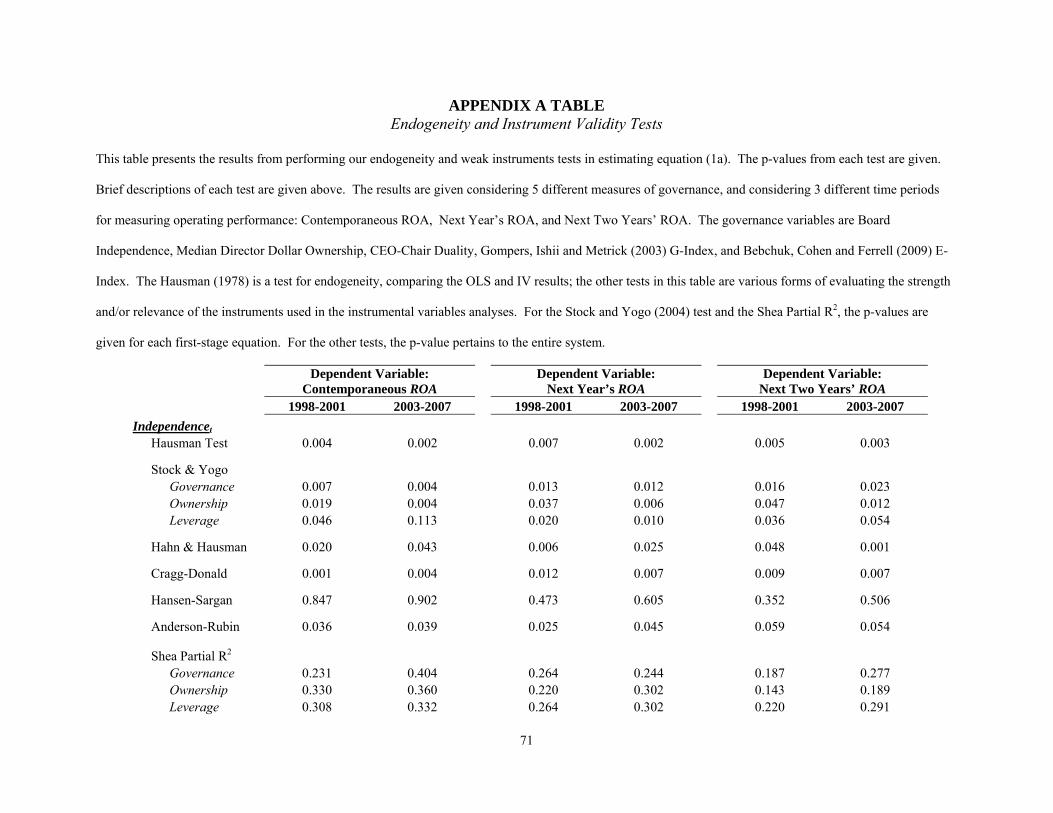
71
APPENDIX A TABLE Endogeneity and Instrument Validity Tests
This table presents the results from performing our endogeneity and weak instruments tests in estimating equation (1a). The p-values from each test are given.
Brief descriptions of each test are given above. The results are given considering 5 different measures of governance, and considering 3 different time periods
for measuring operating performance: Contemporaneous ROA, Next Year’s ROA, and Next Two Years’ ROA. The governance variables are Board
Independence, Median Director Dollar Ownership, CEO-Chair Duality, Gompers, Ishii and Metrick (2003) G-Index, and Bebchuk, Cohen and Ferrell (2009) E-
Index. The Hausman (1978) is a test for endogeneity, comparing the OLS and IV results; the other tests in this table are various forms of evaluating the strength
and/or relevance of the instruments used in the instrumental variables analyses. For the Stock and Yogo (2004) test and the Shea Partial R2, the p-values are
given for each first-stage equation. For the other tests, the p-value pertains to the entire system.
Dependent Variable:
Contemporaneous ROA Dependent Variable:
Next Year’s ROA Dependent Variable:
Next Two Years’ ROA 1998-2001 2003-2007 1998-2001 2003-2007 1998-2001 2003-2007
Independencet Hausman Test 0.004 0.002 0.007 0.002 0.005 0.003
Stock & Yogo Governance 0.007 0.004 0.013 0.012 0.016 0.023 Ownership 0.019 0.004 0.037 0.006 0.047 0.012 Leverage 0.046 0.113 0.020 0.010 0.036 0.054
Hahn & Hausman 0.020 0.043 0.006 0.025 0.048 0.001
Cragg-Donald 0.001 0.004 0.012 0.007 0.009 0.007
Hansen-Sargan 0.847 0.902 0.473 0.605 0.352 0.506
Anderson-Rubin 0.036 0.039 0.025 0.045 0.059 0.054
Shea Partial R2 Governance 0.231 0.404 0.264 0.244 0.187 0.277 Ownership 0.330 0.360 0.220 0.302 0.143 0.189 Leverage 0.308 0.332 0.264 0.302 0.220 0.291

72
Dependent Variable:
Contemporaneous ROA Dependent Variable:
Next Year’s ROA Dependent Variable:
Next Two Years’ ROA 1998-2001 2003-2007 1998-2001 2003-2007 1998-2001 2003-2007
DirectorOwnt Hausman Test 0.001 0.004 0.002 0.001 0.006 0.007 Stock & Yogo Governance 0.002 0.003 0.015 0.004 0.007 0.011 Ownership 0.004 0.023 0.028 0.031 0.003 0.018 Leverage 0.004 0.045 0.029 0.095 0.148 0.130 Hahn & Hausman 0.074 0.046 0.008 0.020 0.034 0.064 Cragg-Donald 0.002 0.000 0.008 0.004 0.006 0.004 Hansen-Sargan 0.737 0.671 0.253 0.616 0.209 0.220 Anderson-Rubin 0.060 0.033 0.024 0.016 0.083 0.026
Shea Partial R2 Governance 0.264 0.288 0.231 0.230 0.154 0.175 Ownership 0.297 0.432 0.220 0.273 0.220 0.248 Leverage 0.308 0.346 0.187 0.359 0.198 0.204
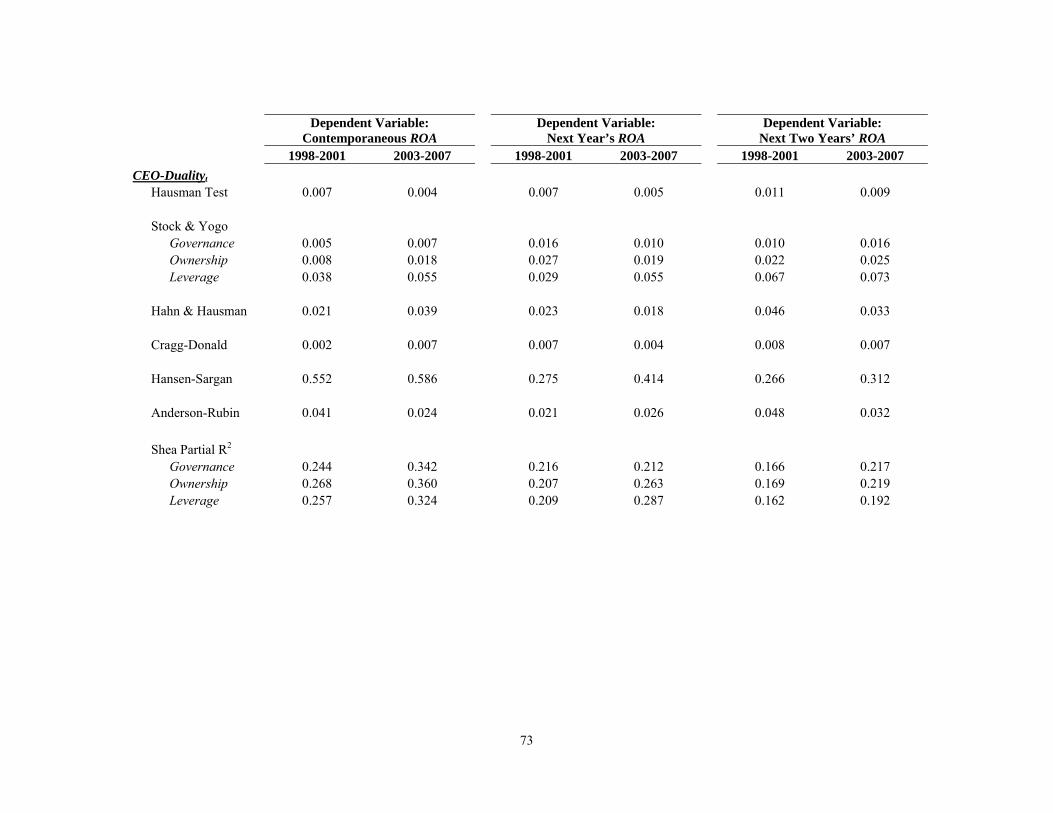
73
Dependent Variable:
Contemporaneous ROA Dependent Variable:
Next Year’s ROA Dependent Variable:
Next Two Years’ ROA 1998-2001 2003-2007 1998-2001 2003-2007 1998-2001 2003-2007
CEO-Dualityt Hausman Test 0.007 0.004 0.007 0.005 0.011 0.009 Stock & Yogo Governance 0.005 0.007 0.016 0.010 0.010 0.016 Ownership 0.008 0.018 0.027 0.019 0.022 0.025 Leverage 0.038 0.055 0.029 0.055 0.067 0.073 Hahn & Hausman 0.021 0.039 0.023 0.018 0.046 0.033 Cragg-Donald 0.002 0.007 0.007 0.004 0.008 0.007 Hansen-Sargan 0.552 0.586 0.275 0.414 0.266 0.312 Anderson-Rubin 0.041 0.024 0.021 0.026 0.048 0.032
Shea Partial R2 Governance 0.244 0.342 0.216 0.212 0.166 0.217 Ownership 0.268 0.360 0.207 0.263 0.169 0.219 Leverage 0.257 0.324 0.209 0.287 0.162 0.192
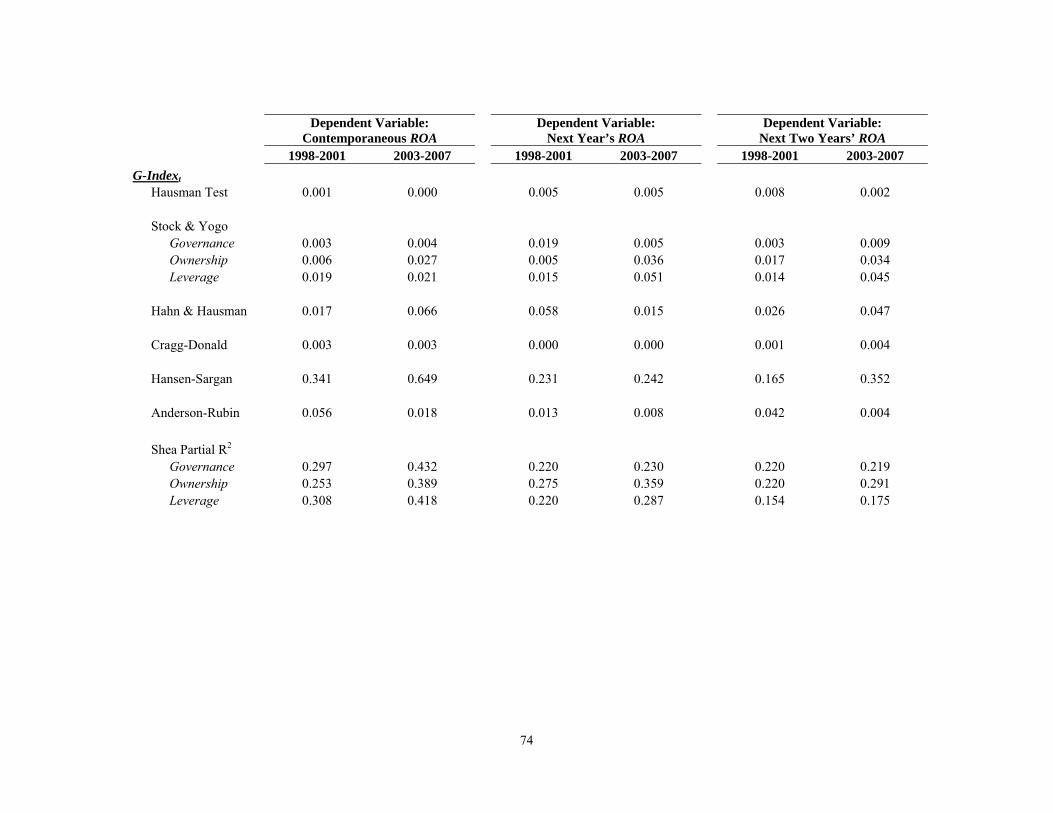
74
Dependent Variable:
Contemporaneous ROA Dependent Variable:
Next Year’s ROA Dependent Variable:
Next Two Years’ ROA 1998-2001 2003-2007 1998-2001 2003-2007 1998-2001 2003-2007
G-Indext Hausman Test 0.001 0.000 0.005 0.005 0.008 0.002 Stock & Yogo Governance 0.003 0.004 0.019 0.005 0.003 0.009 Ownership 0.006 0.027 0.005 0.036 0.017 0.034 Leverage 0.019 0.021 0.015 0.051 0.014 0.045 Hahn & Hausman 0.017 0.066 0.058 0.015 0.026 0.047 Cragg-Donald 0.003 0.003 0.000 0.000 0.001 0.004 Hansen-Sargan 0.341 0.649 0.231 0.242 0.165 0.352 Anderson-Rubin 0.056 0.018 0.013 0.008 0.042 0.004
Shea Partial R2 Governance 0.297 0.432 0.220 0.230 0.220 0.219 Ownership 0.253 0.389 0.275 0.359 0.220 0.291 Leverage 0.308 0.418 0.220 0.287 0.154 0.175

75
Dependent Variable:
Contemporaneous ROA Dependent Variable:
Next Year’s ROA Dependent Variable:
Next Two Years’ ROA 1998-2001 2003-2007 1998-2001 2003-2007 1998-2001 2003-2007
E-Indext Hausman Test 0.002 0.005 0.008 0.008 0.007 0.007 Stock & Yogo Governance 0.008 0.009 0.013 0.016 0.015 0.024 Ownership 0.001 0.014 0.033 0.010 0.030 0.048 Leverage 0.086 0.052 0.049 0.082 0.080 0.084 Hahn & Hausman 0.002 0.007 0.022 0.012 0.079 0.026 Cragg-Donald 0.001 0.006 0.007 0.002 0.004 0.004 Hansen-Sargan 0.550 0.418 0.264 0.385 0.451 0.308 Anderson-Rubin 0.017 0.012 0.016 0.038 0.030 0.051
Shea Partial R2 Governance 0.286 0.418 0.242 0.244 0.176 0.291 Ownership 0.319 0.432 0.198 0.230 0.165 0.248 Leverage 0.231 0.346 0.264 0.345 0.143 0.189

76
APPENDIX B TABLE Fixed Effects Estimation
This table presents the results from estimating equation (1a), the performance equation, using fixed effects estimation. Specifications are presented with five
different governance variables: Independence, board independence; DirectorOwn, the dollar value of the median director’s stock ownership; CEO-Duality,
whether or not the CEO is also the board chair; G-Index, the Gompers, Ishii and Metrick (2003) Governance Index; and, E-Index, the Bebchuk, Cohen and
Ferrell Entrenchment index. ROA, return on assets in the current period is used as the measure of performance. Only the coefficient and corresponding p-value
for the Governance variable in equation (1a) is presented. All other variables in equation (1a) are as defined in the text, and are included in the estimation but not
shown in the Table. Panel A presents the results for the 1998-2001 period; Panel B presents the results for the 1998-2001 period. An intercept and year and firm
fixed effects are also included but not presented. Standard errors are clustered by firm. Coefficients are presented with p-values below in parentheses. Statistical
significance at the 1%, 5%, and 10% levels is indicated by ***, ** and *, respectively.
Panel A: 1998-2001
Fixed Effects Estimation
Dependent Variable: Return on Assets (ROAt)
Independencet DirectorOwnt CEO-Dualityt G-Indext E-Indext
Governancet -0.009** 0.004*** -0.002* -0.001* -0.004 (0.04) (0.00) (0.06) (0.06) (0.20)
# of Observations 5,156 4,665 5,156 4,566 4,566
Panel B: 2003-2007
Fixed Effects Estimation
Dependent Variable: Return on Assets (ROAt)
Independencet DirectorOwnt CEO-Dualityt G-Indext E-Indext
Governancet 0.020*** 0.005*** 0.003 -0.002 -0.002** (0.01) (0.00) (0.90) (0.11) (0.02)
# of Observations 6,515 6,377 6,515 7,665 7,665

77
APPENDIX C TABLE
Market-to-Book in Governance and Ownership Equations This table presents the results from estimating equation (1a), the performance equation, including Market-to-book in governance and ownership equations.
Specifications are presented with five different governance variables: Independence, board independence; DirectorOwn, the dollar value of the median director’s
stock ownership; CEO-Duality, whether or not the CEO is also the board chair; G-Index, the Gompers, Ishii and Metrick (2003) Governance Index; and, E-Index,
the Bebchuk, Cohen and Ferrell Entrenchment index. ROA, return on assets in the current period is used as the measure of performance. Only the coefficient
and corresponding p-value for the Governance variable in equation (1a) is presented. All other variables in equation (1a) are as defined in the text, and are
included in the estimation but not shown in the Table. Panel A presents the results for the 1998-2001 period; Panel B presents the results for the 1998-2001
period. An intercept and year and firm fixed effects are also included but not presented. Standard errors are clustered by firm. Coefficients are presented with p-
values below in parentheses. Statistical significance at the 1%, 5%, and 10% levels is indicated by ***, ** and *, respectively.
Panel A: 1998-2001 2SLS Estimation
Dependent Variable: Return on Assets (ROAt)
Independencet DirectorOwnt CEO-Dualityt G-Indext E-Indext
Governancet -0.441** 0.022*** -0.199*** -0.078** -0.145* (0.02) (0.01) (0.00) (0.01) (0.07)
Panel B: 2003-2007 2SLS Estimation
Dependent Variable: Return on Assets (ROAt)
Independencet DirectorOwnt CEO-Dualityt G-Indext E-Indext
Governancet 0.209*** 0.006** -0.106** 0.028 -0.192 (0.00) (0.02) (0.02) (0.12) (0.20)

78
APPENDIX D TABLE Accruals and Measurement of Accounting Performance
This table presents the results from estimating equation (1a), the performance equation, adding a measure of
discretionary accruals, Accruals. Specifications are presented with the five different governance variables. ROA,
return on assets in the current period is used as the measure of performance. Only the coefficients and
corresponding p-values for the Governance and Accruals variables in equation (1a) are presented for conciseness.
All other variables in equation (1a) are as defined in the text, and are included in the estimation but not shown in the
Tables. Panels A1 and A2 present the results for all firms in the Pre-SOX and Post-SOX periods. Panels B1 and B2
present the results for firms with an Accruals value less than the sample median in the Pre-SOX and Post-SOX
periods. Panels C1 and C2 present the results for firms with and Accruals value greater than the sample median in
the Pre-SOX and Post-SOX periods. Standard errors are clustered by firm. Statistical significance at the 1%, 5%,
and 10% levels is indicated by ***, ** and *, respectively.
Panel A1: All firms, pre-SOX 1998-2001
Dependent Variable: Return on Assets (ROAt)
Independencet DirectorOwnt CEO-Dualityt G-Indext E-Indext
Governancet -0.369*** 0.015** -0.138*** -0.057*** -0.120** (0.00) (0.04) (0.00) (0.01) (0.02)
Accrualst -0.036 -0.026 -0.031 -0.024 -0.014 (0.15) (0.28) (0.21) (0.44) (0.63)
# of Observations 3,558 3,558 3,558 3,313 3,313 Panel A2: All firms, post-SOX 2003-2007
Dependent Variable: Return on Assets (ROAt)
Independencet DirectorOwnt CEO-Dualityt G-Indext E-Indext
Governancet 0.367*** 0.092** -0.118*** 0.0368** -0.070** (0.00) (0.05) (0.00) (0.01) (0.05)
Accrualst 0.030*** 0.032** 0.039** 0.045** 0.041* (0.07) (0.01) (0.03) (0.03) (0.10)
# of Observations 3,495 3,495 3,495 3,359 3,359
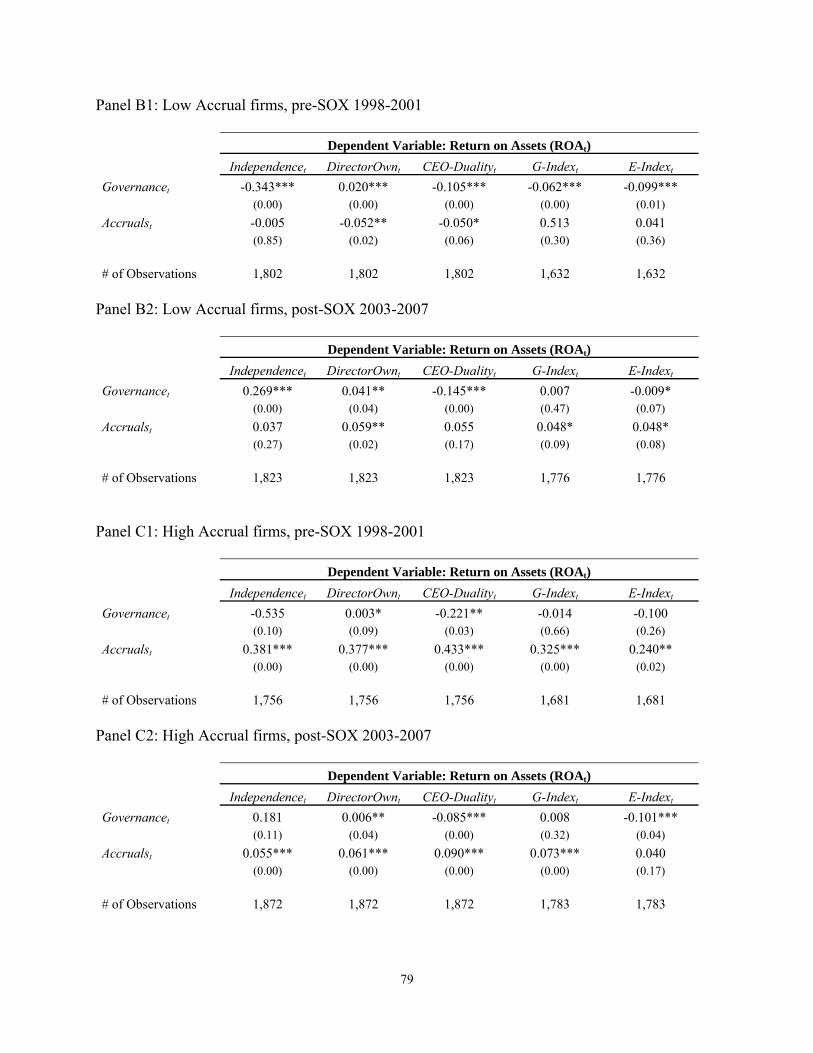
79
Panel B1: Low Accrual firms, pre-SOX 1998-2001
Dependent Variable: Return on Assets (ROAt)
Independencet DirectorOwnt CEO-Dualityt G-Indext E-Indext
Governancet -0.343*** 0.020*** -0.105*** -0.062*** -0.099*** (0.00) (0.00) (0.00) (0.00) (0.01)
Accrualst -0.005 -0.052** -0.050* 0.513 0.041 (0.85) (0.02) (0.06) (0.30) (0.36)
# of Observations 1,802 1,802 1,802 1,632 1,632 Panel B2: Low Accrual firms, post-SOX 2003-2007
Dependent Variable: Return on Assets (ROAt)
Independencet DirectorOwnt CEO-Dualityt G-Indext E-Indext
Governancet 0.269*** 0.041** -0.145*** 0.007 -0.009* (0.00) (0.04) (0.00) (0.47) (0.07)
Accrualst 0.037 0.059** 0.055 0.048* 0.048* (0.27) (0.02) (0.17) (0.09) (0.08)
# of Observations 1,823 1,823 1,823 1,776 1,776 Panel C1: High Accrual firms, pre-SOX 1998-2001
Dependent Variable: Return on Assets (ROAt)
Independencet DirectorOwnt CEO-Dualityt G-Indext E-Indext
Governancet -0.535 0.003* -0.221** -0.014 -0.100 (0.10) (0.09) (0.03) (0.66) (0.26)
Accrualst 0.381*** 0.377*** 0.433*** 0.325*** 0.240** (0.00) (0.00) (0.00) (0.00) (0.02)
# of Observations 1,756 1,756 1,756 1,681 1,681 Panel C2: High Accrual firms, post-SOX 2003-2007
Dependent Variable: Return on Assets (ROAt)
Independencet DirectorOwnt CEO-Dualityt G-Indext E-Indext
Governancet 0.181 0.006** -0.085*** 0.008 -0.101*** (0.11) (0.04) (0.00) (0.32) (0.04)
Accrualst 0.055*** 0.061*** 0.090*** 0.073*** 0.040 (0.00) (0.00) (0.00) (0.00) (0.17)
# of Observations 1,872 1,872 1,872 1,783 1,783

80
APPENDIX E TABLE Governance and Performance, Equation (1a), by Director Classification
This table presents the results from estimating equation (1a), the performance equation, on two different sub-
samples: those firms which had an individual director’s classification change from year-to-year and those firms
which did not have such a director classification change. A director classification change would be a director
changing from Independent to Affiliated, or vice versa. Specifications are presented with the five different
governance variables. ROA, return on assets in the current period is used as the measure of performance. Only
the coefficient and corresponding p-value for the Governance variable in equation (1a) is presented. All other
variables in equation (1a) are as defined in the text, and are included in the estimation but not shown in the
Table. Panel A presents the results for the firms that did have a director change during the 1998-2001 period;
Panel B presents the results for the firms that did have a director change during the 1998-2001 period; Panel C
presents the results for the firms that did not have a director change during the 1998-2001 period; Panel D
presents the results for the firms that did not have a director change during the 1998-2001 period. An intercept
and year and firm fixed effects are also included but not presented. Standard errors are clustered by firm.
Coefficients are presented with p-values below in parentheses. Statistical significance at the 1%, 5%, and 10%
levels is indicated by ***, ** and *, respectively.
Panel A: Firms with Director Classification Changes, Pre-SOX, 1998-2001
Independencet DirectorOwnt CEO-Dualityt G-Indext E-Indext
Governancet -0.227* 0.020* 0.066 -0.031 -0.067** (0.06) (0.07) (0.33) (0.14) (0.01)
Panel B: Firms with Director Classification Changes, Post-SOX, 2003-2007
Independencet DirectorOwnt CEO-Dualityt G-Indext E-Indext
Governancet 0.171 0.010* -0.377 0.023 -0.063* (0.19) (0.06) (0.45) (0.24) (0.07)
Panel C: Firms with NO Classification Changes, Pre-SOX, 1998-2001
Independencet DirectorOwnt CEO-Dualityt G-Indext E-Indext
Governancet -0.437** 0.018** -0.210*** -0.088*** -0.201** (0.03) (0.04) (0.00) (0.01) (0.02)

81
Panel D: Firms with NO Classification Changes, Post-SOX, 2003-2007
Independencet DirectorOwnt CEO-Dualityt G-Indext E-Indext
Governancet 0.266*** 0.011* -0.117*** 0.045** -0.221 (0.00) (0.06) (0.00) (0.01) (0.31)
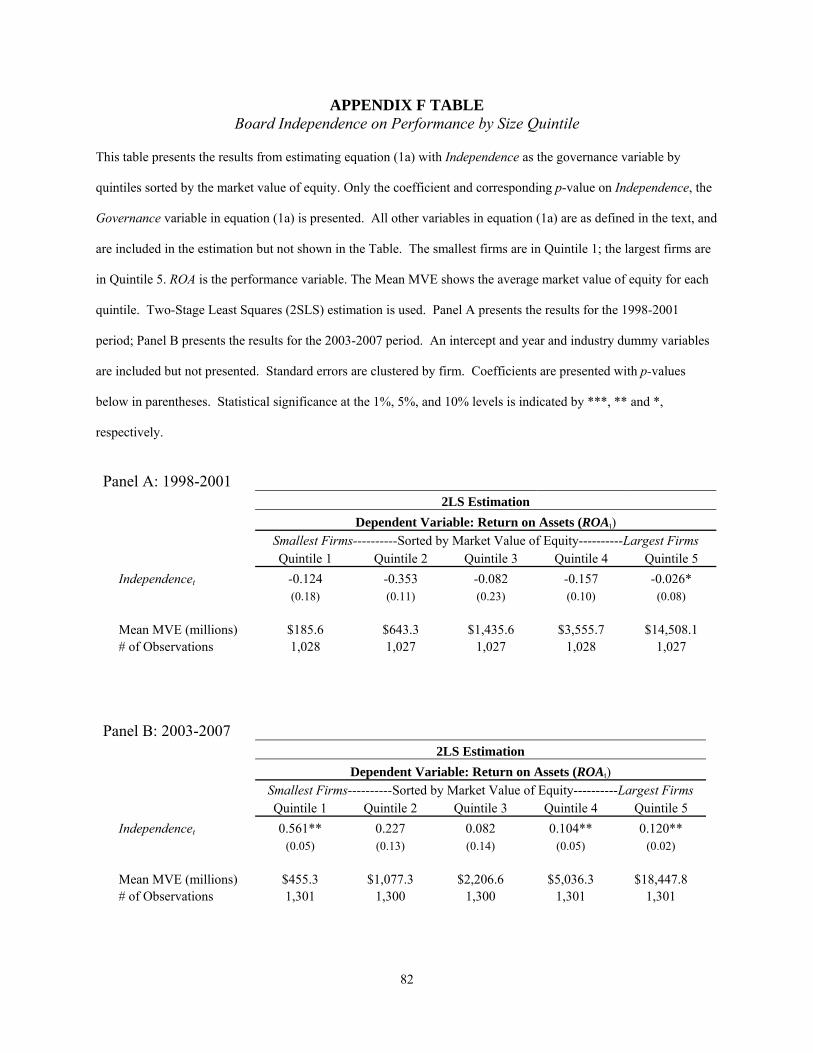
82
APPENDIX F TABLE Board Independence on Performance by Size Quintile
This table presents the results from estimating equation (1a) with Independence as the governance variable by
quintiles sorted by the market value of equity. Only the coefficient and corresponding p-value on Independence, the
Governance variable in equation (1a) is presented. All other variables in equation (1a) are as defined in the text, and
are included in the estimation but not shown in the Table. The smallest firms are in Quintile 1; the largest firms are
in Quintile 5. ROA is the performance variable. The Mean MVE shows the average market value of equity for each
quintile. Two-Stage Least Squares (2SLS) estimation is used. Panel A presents the results for the 1998-2001
period; Panel B presents the results for the 2003-2007 period. An intercept and year and industry dummy variables
are included but not presented. Standard errors are clustered by firm. Coefficients are presented with p-values
below in parentheses. Statistical significance at the 1%, 5%, and 10% levels is indicated by ***, ** and *,
respectively.
Panel A: 1998-2001
2LS Estimation
Dependent Variable: Return on Assets (ROAt) Smallest Firms----------Sorted by Market Value of Equity----------Largest Firms Quintile 1 Quintile 2 Quintile 3 Quintile 4 Quintile 5
Independencet -0.124 -0.353 -0.082 -0.157 -0.026* (0.18) (0.11) (0.23) (0.10) (0.08)
Mean MVE (millions) $185.6 $643.3 $1,435.6 $3,555.7 $14,508.1 # of Observations 1,028 1,027 1,027 1,028 1,027
Panel B: 2003-2007
2LS Estimation
Dependent Variable: Return on Assets (ROAt) Smallest Firms----------Sorted by Market Value of Equity----------Largest Firms Quintile 1 Quintile 2 Quintile 3 Quintile 4 Quintile 5
Independencet 0.561** 0.227 0.082 0.104** 0.120** (0.05) (0.13) (0.14) (0.05) (0.02)
Mean MVE (millions) $455.3 $1,077.3 $2,206.6 $5,036.3 $18,447.8 # of Observations 1,301 1,300 1,300 1,301 1,301
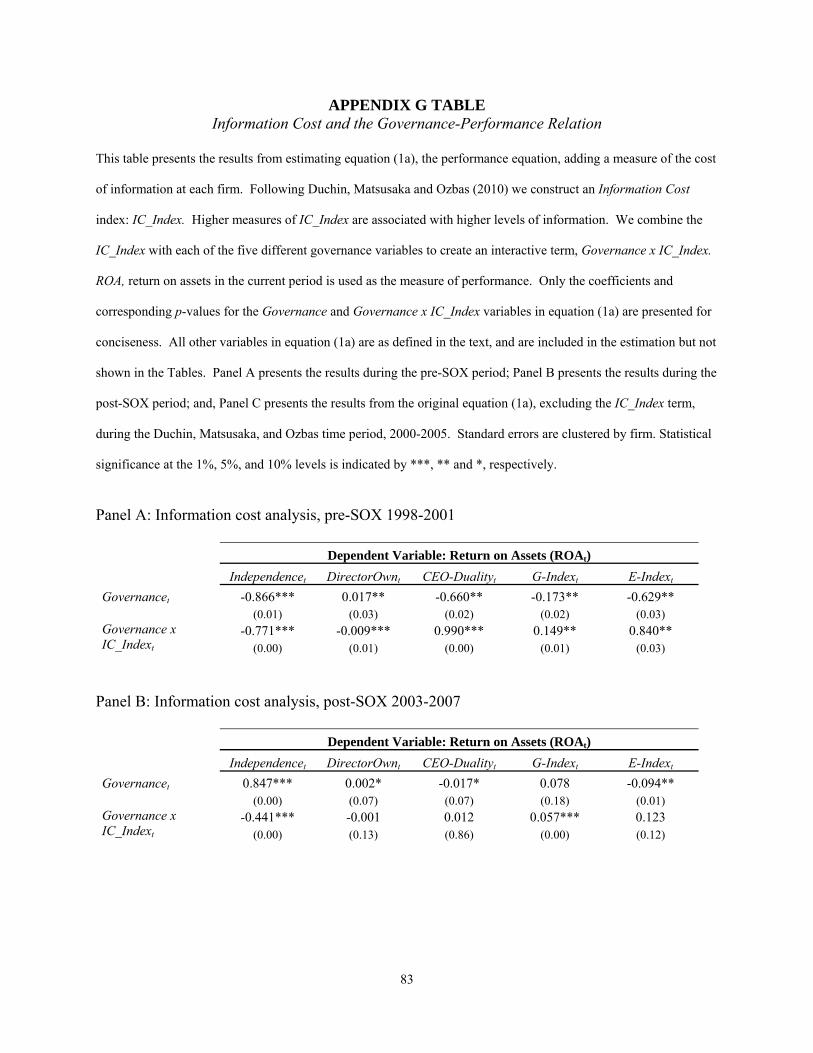
83
APPENDIX G TABLE Information Cost and the Governance-Performance Relation
This table presents the results from estimating equation (1a), the performance equation, adding a measure of the cost
of information at each firm. Following Duchin, Matsusaka and Ozbas (2010) we construct an Information Cost
index: IC_Index. Higher measures of IC_Index are associated with higher levels of information. We combine the
IC_Index with each of the five different governance variables to create an interactive term, Governance x IC_Index.
ROA, return on assets in the current period is used as the measure of performance. Only the coefficients and
corresponding p-values for the Governance and Governance x IC_Index variables in equation (1a) are presented for
conciseness. All other variables in equation (1a) are as defined in the text, and are included in the estimation but not
shown in the Tables. Panel A presents the results during the pre-SOX period; Panel B presents the results during the
post-SOX period; and, Panel C presents the results from the original equation (1a), excluding the IC_Index term,
during the Duchin, Matsusaka, and Ozbas time period, 2000-2005. Standard errors are clustered by firm. Statistical
significance at the 1%, 5%, and 10% levels is indicated by ***, ** and *, respectively.
Panel A: Information cost analysis, pre-SOX 1998-2001
Dependent Variable: Return on Assets (ROAt)
Independencet DirectorOwnt CEO-Dualityt G-Indext E-Indext
Governancet -0.866*** 0.017** -0.660** -0.173** -0.629** (0.01) (0.03) (0.02) (0.02) (0.03)
Governance x IC_Indext
-0.771*** -0.009*** 0.990*** 0.149** 0.840** (0.00) (0.01) (0.00) (0.01) (0.03)
Panel B: Information cost analysis, post-SOX 2003-2007
Dependent Variable: Return on Assets (ROAt)
Independencet DirectorOwnt CEO-Dualityt G-Indext E-Indext
Governancet 0.847*** 0.002* -0.017* 0.078 -0.094** (0.00) (0.07) (0.07) (0.18) (0.01)
Governance x IC_Indext
-0.441*** -0.001 0.012 0.057*** 0.123 (0.00) (0.13) (0.86) (0.00) (0.12)

84
Panel C: Equation (1a), Duchin, Matsusaka and Ozbas (2010) period 2000-2005
Dependent Variable: Return on Assets (ROAt)
Independencet DirectorOwnt CEO-Dualityt G-Indext E-Indext
Governancet 0.3164 0.024*** -0.519*** -0.022 -0.673*** (0.28) (0.00) (0.00) (0.36) (0.00)
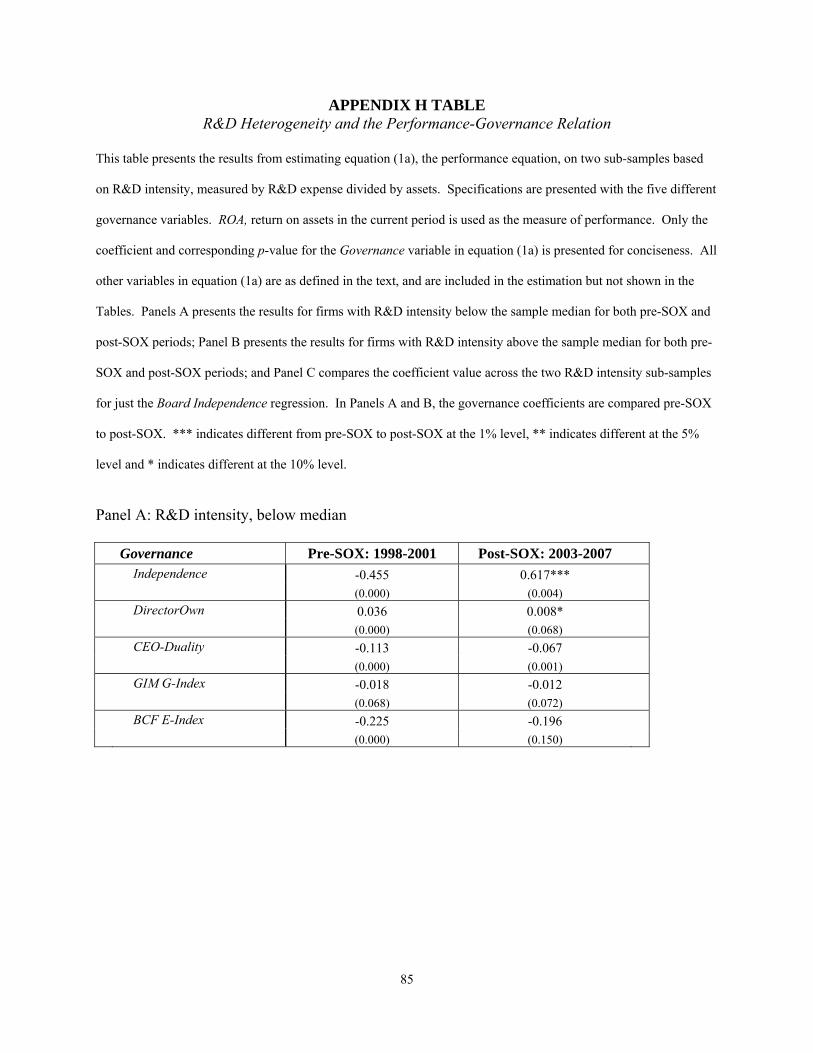
85
APPENDIX H TABLE R&D Heterogeneity and the Performance-Governance Relation
This table presents the results from estimating equation (1a), the performance equation, on two sub-samples based
on R&D intensity, measured by R&D expense divided by assets. Specifications are presented with the five different
governance variables. ROA, return on assets in the current period is used as the measure of performance. Only the
coefficient and corresponding p-value for the Governance variable in equation (1a) is presented for conciseness. All
other variables in equation (1a) are as defined in the text, and are included in the estimation but not shown in the
Tables. Panels A presents the results for firms with R&D intensity below the sample median for both pre-SOX and
post-SOX periods; Panel B presents the results for firms with R&D intensity above the sample median for both pre-
SOX and post-SOX periods; and Panel C compares the coefficient value across the two R&D intensity sub-samples
for just the Board Independence regression. In Panels A and B, the governance coefficients are compared pre-SOX
to post-SOX. *** indicates different from pre-SOX to post-SOX at the 1% level, ** indicates different at the 5%
level and * indicates different at the 10% level.
Panel A: R&D intensity, below median Governance Pre-SOX: 1998-2001 Post-SOX: 2003-2007
Independence -0.455 0.617*** (0.000) (0.004)
DirectorOwn 0.036 0.008* (0.000) (0.068)
CEO-Duality -0.113 -0.067 (0.000) (0.001)
GIM G-Index -0.018 -0.012 (0.068) (0.072)
BCF E-Index -0.225 -0.196 (0.000) (0.150)

86
Panel B: R&D intensity, above median Governance Pre-SOX: 1998-2001 Post-SOX: 2003-2007
Independence -0.516 0.179*** (0.064) (0.114)
DirectorOwn 0.038 0.007 (0.011) (0.039)
CEO-Duality -0.147 -0.104 (0.071) (0.215)
GIM G-Index -0.020 0.015*** (0.506) (0.355)
BCF E-Index -0.130 0.039*** (0.247) (0.303)
Panel C: Comparison of Board Independence coefficients, below median vs. above median Board Independence Pre-SOX: 1998-2001 Post-SOX: 2003-2007
Below Median -0.455 0.617 (0.000) (0.004)
Above Median -0.516* 0.179*** (0.064) (0.114)