1 financial benefits through pump optimization · contribute to inefficient pump operations ......
TRANSCRIPT

1
Sponsored by
2
6
8
11
12
18
Financial Benefits through Pump Optimization
Sponsor Profile
Life-Cycle Costing Strategy Delivering
Financial Benefit
Delivering Savings Through Energy
Monitoring
End-to-End Energy
ITT White Paper
Don’t Generate Energy Before You Generate
A Plan

2
Sponsored by
What Separates The Top Performers Is A Focus On The Factors They Can Control - Including Maintaining Efficient Operations And Analyzing The Total Life-Cycle Costs Of Their Equipment
Tom Dabbs, Plant Performance Services Group, ITT03/21/2011
We can all hope that 2011 is the year that the Great Recession comes to an end. The global economic downturn has challenged companies in almost every industry, as market factors beyond their control have made it hard to sustain sales and revenues.
As the storm ends and economic growth returns, it’s likely that top-performing manufacturers will be in even stronger market positions, because many poorly performing companies can’t survive an extended recession or will emerge significantly weaker. Bad economic times are partic-ularly punishing to plants that already are spending wastefully or otherwise behaving inefficiently. Worse yet, many organizations in this category don’t even know what’s happening to them until it’s too late.
Stressed manufacturing facilities can show common signs of a breakdown
in best practices: equipment that’s operated and maintained improperly; atrocious housekeeping and poor equipment condition; excessive steam, air, and water leaks; and storerooms that appear to have suffered a recent detonation of a small nuclear device.
What separates the top performers is a focus on the factors they can control – including maintaining effi-cient operations and analyzing the total life-cycle costs of their equip-ment. While implementing a life-cycle costing methodology throughout an enterprise is a major undertaking, there are some industry benchmarks and relatively simple calculations to identify the potential areas for greatest cost reductions. This article will share some examples and show how plants can achieve a relatively quick return on investment by reducing costs in these priority areas.
Analyzing Total Cost of Ownership
Life-Cycle Costing is the fundamental accounting process that provides a running tally of the critical measure, Total Cost of Ownership (TCO). Here is a simple formula to capture Total Cost of Ownership:
TCO=Ca+Cc+Co+Cm+Cp+Cd
Where: Ca=Cost of Acquisition—includes the cost of engineering, procurement, equipment cost, auxiliary equipment cost, inspections, and documentation.
Cc=Cost of Commissioning—includes the cost of construction, testing, training and technical support.
Co=Cost of Operation—includes energy, operating personnel, facility costs, support and handling for raw materials.
Cm=Cost of Maintenance—includes maintenance personnel, maintenance facility cost, test equipment, maintenance support and handling cost, maintenance spares and repair parts.
Cp=Cost of Production—includes production losses, quality cost, environ-mental cost and cost of redundancy.
Cd=Removal and Disposal—cost minus any reclamation value.
Pumps: A prime opportunity to optimize
Because they represent such a large portion of a plant’s operation and main-tenance costs (Pumps consume more energy than any other industrial equip-ment), pumps should be a main focus in any effort to improve overall cost efficiency. In fact, companies spend an average of 50% more on operating and maintaining centrifugal pumps than they do on any other rotating machine, and
Life-Cycle Costing Strategy Delivering Financial Benefit
Sponsor Profile
Life-Cycle Costing Strategy Delivering
Financial Benefit
Delivering Savings Through Energy
Monitoring
End-to-End Energy
ITT White Paper
Don’t Generate Energy Before You Generate
A Plan

3
Sponsored by
centrifugal pumps generally consume 20% to 60% of a given plant’s motor energy.
There’s definitely room for improve-ment. A survey revealed that more than 1,500 pumps at 20 plants had an average pumping efficiency of below 40%, and more than 10% of the pumps ran below 10% efficiency. Two major factors that contribute to inefficient pump operations include throttled valves and pump over-sizing. Seal leakage is the most consistent cause for pump downtime and mainte-nance spending.
Implementing a TCO approach
For pumps or any other equipment, it requires a lot of hard work and some upfront thinking to assess TCO as a matter of routine. First, managers must determine the most efficient way of collecting, organizing and maintaining data using life-cycle costing method-ology. Then they must configure the systems and processes to capture the cost of the elements of TCO. To keep the data current, one needs to embed the methodology in daily work processes and systems. That is, once a company decides which TCO elements it wants to measure, managers must configure their systems and processes to routinely deliver that data with a minimum of extra work.
One of the best ways to manage this process is by using a fully functional Enterprise Resource Planning system (ERP) to collect and manage this data. The key elements of this method are making sure the systems are config-ured properly, sound work processes that fully enable the ERP are in place, ensuring that the process is always
followed, and that an individual or group of individuals is responsible to review, analyze and act on the results. This may sound simple, but this is where the job becomes difficult, because it’s about behaviors – asking people to behave the same way and consistently follow the same work processes.
Cost of acquisition and commis-sioning (Ca and Cc) can be captured during the engineering and construction phases. By developing an equipment hierarchy and assigning each piece of equipment a unique number, we can create a record in the maintenance management module of the ERP that itemizes the cost of each element of acquisition and commissioning, and links it to that equipment number. Consider using some factoring for some of the sub-elements, e.g., procure-ment cost, inspection testing, training, documentation, etc. Pinpoint accuracy is not critical, so reasonably accurate estimates using factors will get the job done.
The energy consumption portion of Cost of Operations (Co) can be measured by proper configuration of some ERP systems or by utilizing data from more elaborate systems like Enterprise Energy Management (EEM) systems – on-board multi-functional condition monitors that track energy consumption – or other commercially available energy monitoring systems. Since energy represents the largest opportunity for savings, significant effort should be dedicated to selecting the most effective approach. Operating labor can be extracted from the human resource module of the ERP by equip-ment item, area, or system, if labor is properly charged in the work order system. Factors for facility and support, and material handling costs, can be assigned for this element.
Cost of Maintenance (Cm) should come directly from the work order system. Maintenance, labor and mate-rials costs are automatically charged to the equipment if we consistently follow the proper work process. Again, the use
of factors can be employed to cover facility, support and handling, and test equipment.
Cost of Production (Cp) can be expressed by tracking Overall Equipment Effectiveness (OEE), used to measure production losses. Commercially available systems can automate the measurement and reporting of OEE, or it can be measured manually in each area of the plant by operating supervisors using shift reports. By examining losses from speed, down time and quality, organi-zations can calculate their equipment productivity and express it in a single number that provides a complete measure of manufacturing efficiency and effectiveness:
Rate or speed percentage
x Operating time percentage
x Quality percentage
= OEE
It’s important to calculate what each percentage of OEE is worth in a given operation. Also, while the OEE formula uses only scheduled time, organizations can use a formula for asset utilization to consider a 24-hour day.
Cost of Disposal (Cd) can be performed using a work order that will tie the cost directly to the equip-ment item or system. Any reclamation amounts can be applied to the work order when the items have been sold.
Industry benchmarksWith the TCO equation in hand,
organizations can take a look at how their processes measure up to industry standards. Even without implementing
Sponsor Profile
Life-Cycle Costing Strategy Delivering
Financial Benefit
Delivering Savings Through Energy
Monitoring
End-to-End Energy
ITT White Paper
Don’t Generate Energy Before You Generate
A Plan

4
Sponsored by
an Enterprise Resource Planning system, organizations that are willing to gather readily available data can analyze how their costs and produc-tivity compare to generally accepted benchmarks.
• These four benchmarks are worth using and tracking:
• Maintenance spending – should be 2% to 4% of Replacement Asset Value (RAV), which is the value of your plant after it’s been depreci-ated. You can also use the insured value.
• Inventory value – should be between .5% and .75% of RAV.
• Inventory carrying cost – should range from 17% to 23% of inventory value.
• Overtime – should be 5% to 10% of straight-time labor cost.
Data Requirements and Definitions
The components needed to calcu-late potential savings include these measures:
• Replacement Asset Value (RAV) – the replacement value or insured value of the plant
• Total maintenance spending – includes direct and indirect labor, contractor cost, materials usage cost and overtime cost
• Maintenance overtime percentage – total overtime hours divided by total labor hours
• Hourly overtime cost – straight-time labor cost plus overtime premium
• Maintenance, repair, and operations (MRO) inventory value – value of inventory minus carrying costs
• MRO carrying cost – cost of overhead and taxes for MRO inventory
• Target or best-demonstrated production rate – design rate or best demonstrated rate, such as tons per day, tons per hour, feet per minute, etc.
• Revenue or margin per unit of production
• Average availability percentage – actual run time divided by the scheduled time
• Average production rate percentage – the actual production rate divided by the target rate
• Average quality rate percentage – actual first-pass quality product produced divided by total product produced
The Cost of Doing NothingFaltering manufacturers often say that
they can’t afford to improve. What’s inter-esting about this response is that so little consideration is given to the fact that the money is already being spent as a result of their situations – sometimes at an alarming rate and many times under the radar. This article provides some illustra-tions of companies that are performing poorly and don’t think they have the cash flow to improve.
In reality, they have the money, but they are simply spending it in the wrong ways. As the noted Quality guru Dr. W. Edwards Deming said, ”Your system is perfectly designed to give you the results you are getting.”
Life-cycle costing – An effort worth making
Taking the time and effort to measure TCO as part of life-cycle costing is not done for passive record-keeping purposes. It is a rigorous process aimed at optimizing the costs to operate a business. It requires unwavering support by senior managers, and subject-matter exper-tise to perform the analysis and ensure that conclusions and recommendations are feasible.
Some may want to deny that poor operation and maintenance practices caused these companies’ unpleasant outcomes, rather than viewing these simply as symptoms of inevitable death spirals. Either way, any company with similar symptoms is going down the wrong path. Resolving these types of issues makes more profit in good market conditions, and posi-tions companies to survive economic
Sponsor Profile
Life-Cycle Costing Strategy Delivering
Financial Benefit
Delivering Savings Through Energy
Monitoring
End-to-End Energy
ITT White Paper
Don’t Generate Energy Before You Generate
A Plan

5
Sponsored by
recessions. Organizations that use life-cycle costing and Total Cost of Ownership can make their manufac-turing plants significantly more effi-cient, so that when the next economic downturn comes – and another one will come – they will be better prepared – to ride out the storm.
The ROI Of TCOThese four examples illustrate how
some plants have improved efficiency
and saved money by using life-cycle costing methods.
• A multibillion-dollar chemical manu-facturer improved the mean time between failure rate for its pumps by 71%, resulting in a savings of $1.5 million in operations and mainte-nance. This was accomplished by embedding a pump specialist in the facility to work with the local maintenance and operations team to identify and resolve issues on a daily basis. Root cause analysis was
performed on bad actors and causes were eliminated. Inefficient pumping systems were identified and either replaced or reconfigured with a more efficient control system. The embedded engineer has been on site at this location for more than seven years and his existence is evaluated and justified annually.
• A paper company using more than 4,000 centrifugal pumps saved more than $500,000 by reducing its pump-parts inventory. The company now uses the former spare-parts storage area for paper stock. This was accomplished by an in-depth evaluation of the existing spare parts inventories at four locations. Excessive quantities, obsolete parts and duplications were identified and eliminated at all four locations.
• After implementing life-cycle costing measures on just 23 pumps, Appleton Coated, a paper manu-facturer with more than 1,000 centrifugal pumps, saved more than $1 million on a capital invest-ment of $591,000. This was accom-plished with modifications to the control systems on these pumps to move the pumping systems to BEP (Best Efficiency Point) on the pump curves and replacement of over-sized pumps with proper sizes. The savings came from avoided energy costs on these systems.
• Pasadena Refining Systems processes up to 120,000 barrels of oil per day. Within two years after conducting a root-cause analysis on 30 bad-actor pumps, the company has reduced repair costs by 75% and emissions by 95%. Findings from Root Cause Failure Analysis on these pumps were implemented as
soon as possible, and performance of the pumps was monitored and reported to management to track improvements.
Tom Dabbs is a reliability specialist for the Plant Performance Services Group of ITT. This article is based on a Plant Engineering webcast presented by Mr. Dabbs in late 2010. Readers can find the presentation slides and audio under the media resources section of www.plantengineering.com.
Applying the FormulaIn this fictitious example of a troubled plant, we assume a set of operational statistics that reflect actual conditions ITT engineers have observed at customer sites.
Replacement value $90 million
Total maintenance spending $6.56 million
Maintenance overtime % age 22%
MRO inventory value $3 million
MRO carrying cost (approx. 20% of inventory value) $600 thousand
Target or best demonstrated production rate 32,000 gallons per day
Actual production rate 27,500 gallons per day
Revenue/margin per unit of production $10 per gallon
Average availability percentage 84%
Average quality percentage 88%
Average production rate (27,500÷32,000) 86%
Overall Equipment Effectiveness (.84x.88x.86) 64%
Each 1% of OEE $1.168 million
Using values, we can calculate savings in five areas using these equations:Savings Potential Savings
Maintenance Spending = (Your spending – 4% RAV) = $2,960,000
Inventory Value = (Your inventory value - .75% RAV) = $2,325,000
Inventory carrying cost = (current cost) – (20%x inventory value) = $465,000
Overtime = (Your OT cost – 10% (maintenance labor cost) = $300,000
OEE (85% OEE – Your OEE)(value of each 1% OEE) = $24,528,000
Total Savings Potential = = $30,578,000
Sponsor Profile
Life-Cycle Costing Strategy Delivering
Financial Benefit
Delivering Savings Through Energy
Monitoring
End-to-End Energy
ITT White Paper
Don’t Generate Energy Before You Generate
A Plan

6
Sponsored by
Sponsor Profile
Life-Cycle Costing Strategy Delivering
Financial Benefit
Delivering Savings Through Energy
Monitoring
End-to-End Energy
ITT White Paper
Don’t Generate Energy Before You Generate
A Plan
Energy Efficiency Is A Critical Issue For Plant Managers, So Suppliers Are Working Hard To Come Up With New Ways To Deliver Solutions And Strategies That Are Easy To Implement And Deliver A Return On Investment.05/25/2011
In an interview with CFE Media, Opto 22’s marketing communications manager David Crump said the chal-lenges of energy monitoring extend beyond the devices:
CFE: In what industries have you seen the greatest inter-est in energy monitoring? What’s driving that interest?
Several industries, including commer-cial buildings, cold storage (such as for food and beverage), and government. But interest is growing in all industries as facility owners and managers realize that energy use can be managed just the same as their other costs.
As for what’s driving the interest in energy monitoring, it’s the same thing that drives manufacturing plants and other large facilities to deploy any technology—an opportunity to improve
efficiency and increase profitably, in this case, through cost cutting. As it stands now, energy represents one of the single largest opportunities for businesses (in all industries) to reduce costs.
CFE: What should manufac-turers reasonably expect in terms of savings and ROI?
It’s a tricky question. You’re asking, ”How much can I save if I purchase an energy monitoring system and start measuring?” And the answer is, ”You’ll never know your potential for energy savings until you actually begin moni-toring and measuring.” I’ve seen it range from hundreds, all the way up to hundreds of thousands of dollars. One statistic I can share is that the recent study Efficiency and Innovation in U.S. Manufacturing Energy Use (prepared in part by the U.S. Department of Energy) noted that many manufacturing plants can easily reduce their energy consumption by 10% to 20%.
CFE: It’s one thing to mea-sure energy usage; it’s an-other to change manufac-turing processes to reduce energy usage.
True. But is it prudent to change any manufacturing process without first understanding what’s going on? The first step has to be information
gathering. You need the data first because (as we are fond of saying around here) ”you can only intel-ligently control what you can ably measure.” Once plant personnel, energy managers, and facility operators begin aggregating the real-time data they need to correlate their energy use with specific business operations, it’s then that they can begin effectively iden-tifying specific problems, designing energy management initiatives that reduce costs, and exercising control over their processes, machinery, systems, and equipment.
CFE: When your custom-ers have had success at changing, what’s been the common element in that change?
It varies. Many customers make adjustments to processes and systems in their plant to reduce energy usage. Heating processes (like those taking place during curing or autoclave or industrial furnaces operations) immediately come to mind. If they can be made more efficient, there’s a huge potential for cost savings.
Some customers have gathered data revealing maintenance issues that were causing huge wastes of energy. And after the appropriate changes were made, a significant waste of energy was elimi-nated. For example, there was a refrig-eration system (at an old meat packing
plant) that had an automatic defrosting system for its freezer coils. The way it was supposed to work was that periodi-cally, hot refrigerant would blow through the cold coils so ice buildup on the surface would melt and evaporate. The hot gas for this procedure came through piping, and old automatic valves at each coil regulated the defrosting process.
This plant implemented Opto 22 energy monitoring hardware and found that the cooling coils in the freezers weren’t working properly and the hot gas was continuously leaking to the coils in the freezers. So too much heat was being introduced, and to counteract this, the refrigeration system was running a lot more (using much of its capacity just to support itself) and costing literally thousands of dollars per month. So in this case, changes involving maintenance issues produced ROI for the monitoring system.
And sometimes change comes in the form of simple, common sense business practices. There was a manufacturer in the automation industry that began energy monitoring and quickly discovered that a lighting system in one area of its factory areas was continuing to operate two hours past the time when all the employees that worked in that area had punched out and gone home for the day. In this case, it’s easy to see the simple change that was made to cut costs.
So my point is, there may be no common element in terms of what the change is. The common element is that gaining access to energy data almost
Delivering Savings Through Energy Monitoring

7
Sponsored by
always reveals things that were previ-ously unknown. This, in turn, leads to a variety of changes, both in corporate philosophy and policies, as well as to manufacturing processes and other business operations. Each of these can save money and make a real difference.
CFE: Are these devices re-ally just a means to an end of having a sound energy strategy?
Yes. Energy monitoring devices are the means to an end. They are what enable personnel in plants and other
facilities to acquire the data they need to make competent decisions. That’s the key—decision making. The fresher and more comprehensive the energy data you’re gathering is, the better decisions you’ll be able to make, and the better energy management strategies you’ll be able to devise.
END
Sponsor Profile
Life-Cycle Costing Strategy Delivering
Financial Benefit
Delivering Savings Through Energy
Monitoring
End-to-End Energy
ITT White Paper
Don’t Generate Energy Before You Generate
A Plan

8
Sponsored by
Sponsor Profile
Life-Cycle Costing Strategy Delivering
Financial Benefit
Delivering Savings Through Energy
Monitoring
End-to-End Energy
ITT White Paper
Don’t Generate Energy Before You Generate
A Plan
Pay Attention To Every Step In Your Process To Gain Maximum Efficiency; Awareness Of The Cost Of Energy Is A Critical Step For A Manufacturing Company.By Mark Wylie, Cisco Systems03/14/2011
Many experts believe that close to 50% of the energy produced globally is consumed by the manufacturing segment. Some of the consumption is in lighting and environmental controls; the bulk of it is in powering the machinery and controls that run the plants and/or processes that produce product that eventually gets sold to consumers. Sometimes machines and processes cannot be shut down, or if they are, there is huge cost to clean up and restart, so in many cases it is cost efficient to just let them run
So, think of this. We have machines that take something and heat it, cool it, move it, machine it, transfer it for more machining, package it, store it, find it, ship it. Then we have equipment that handles the order intake, purchasing, tracking, expediting, shipping, tracking and potentially registration. Then we have a customer service organization that gets phone inquiries, requests for information, and requests for support. Additionally, we may send a technician out to troubleshoot an
issue and the customer has to call. So somewhere there are people on phones. Within Cisco we think of this as Smart+Connected Manufacturing. But let’s explore more.
There are expenses to the manufac-turer all along the value chain – from R&D to supply chain, to actual produc-tion and operations all the way to sales and service. All of this takes energy. For any manufacturing companies, this all shows up as one monthly bill. It gets treated as a cost of doing business. It is an expense to the company. One HUGE bucket. No control.
Awareness of the cost of energy is a critical step for a manufac-turing company. Monitoring energy
consumption and cost can help the manufacturing operations group make more informed decisions about what production line or process to use, when to run it, when to schedule maintenance, and a good view into overall efficiency. If you are not worrying about your energy cost beyond that big bucket, you should start.
Initial energy conservationTypically the first response to higher
energy costs is: turn off the lights when we don’t need them. Simple, easy to do, basic, and it results in a good first level response. But the lights are the smallest part of the equation.
They result in a good first level reduc-tion in the office, so they do help the manufacturer.
Then, turn off the plant when we aren’t running. That isn’t so easy. Some processes have material that is being heated or cooled on a continuous basis. Some machines cannot be shut down at will. So they stay in a ready state. Sometimes we have 3-phase motors running continuously in a ”spinning reserve” mode. Once you get into the factory or process plant you cannot just turn these machines on or off. Think for a moment of how long it takes your computer to start up once you get to the office. It is even longer in the plant to start up the control systems.
End-To-End Energy

9
Sponsored by
Imagine, if you will, coming up to a machine that is turning out parts at the rate of 1,000 per minute. The operator walks by to see how the process is going and the machine shuts down while waiting for the operator to a) authenticate and b) resume what the machine was doing after seeing the data he/she wanted.
Efficiency of the plant is a huge concern; likely in the eyes of the operators more important than energy costs. Management wants to reduce energy cost, plant operations wants to make the machines more efficient. What a dichotomy! We have a huge gap between plant asset utilization and efficiency, and indeed, energy cost is just one of the critical parameters. The overall mantra of ”keep that plant running” can have serious implications to energy costs.
So: we cannot turn off the plant via on/off switch. In many cases there will be machines in idle, but other machines being used. There are sequences to be followed and some things that need to remain on. What becomes critical now is knowing the energy footprint is as low in the manufacturing plant as we can get.
You cannot control what you don’t know.
Demand/response, your ability to influence
Your energy supplier or public utility can measure what you consume pretty easily. There is a meter at the fence or at the building, and that meter reports back to the utility how many kilowatts or cubic feet of gas were used in any given
period. That data becomes the monthly or quarterly bill for you, the manufacturing account. The true challenge comes down to how do you measure it inside the fence or inside the building.
So now the challenge comes down to measurement for the manu-facturing account. You can put a meter on every device. That will get pretty expensive, produce a ton of data, increase the number of physical devices you have to worry about, increase the complexity and space required for your production and other manufacturing assets. It isn’t an ideal answer. You could alternatively put metering equip-ment into key areas of the opera-tion and measure those elements. Perhaps it is more efficient in terms of cost, space, etc., but it is still not ideal. Besides, what do you do with isolated data points from a few more locations?
A better solution is to IP enable as many devices as possible and acquire energy data from them along with operating data.
Software applicationsThe key becomes acceptance of
standard Ethernet as a communica-tion media from the automation and plant floor devices. This truly is the good news as we are making signifi-cant strides to IP enabling the manu-facturing operations. Control vendors are building the energy control appli-cations to utilize the data from end devices. The benefit now will be to accumulate actual energy usage data from a machine, from a line, from a cell, from a plant.
With that data you can now take advantage of potential incentives from your utility supplier where they may give you a reduced rate at various times of the day. So if you know that starting up that smelter at noon will cost you $x but starting it up at 3 PM it will only cost you $0.6x, you can decide if it makes sense to stagger your operations.
Sustainable asset management
Another significant advantage is the ability to set up an asset management program. Any equip-ment that moves is going to wear out over time. Imagine that you have a bank of 3-phase motors in your plant and you can see that the motor that controls the conveying line feeding your paint booth is gradually using more and more energy every day or week.
It may be that the bearings are wearing out, that preventive mainte-nance needs to be performed. It may mean that the motor is 20 years old and needs to be replaced. Without tracking the energy consumption to the device you may have a situa-tion where you don’t realize there is a problem until the motor burns out and shuts down your plant.
With the data from your plant and a good asset management program you can better predict where there are growing issues, heading off shut-downs and loss of product or machine availability, or panic service calls. So your operations can be more efficient, you can perform mainte-nance when you need to (not when the machine decides it needs it), plus
you can potentially be seeing reduced cost for the energy.
The key is, figure out where you can measure and make use of the data, then go control it.
What we’re talking about now is far more than an energy manage-ment program. Start with a sustain-able asset management program that allows you real time visibility to the assets in your plant. Now build in some control and predic-tion capability. Many of the control system vendors have applications as part of their HMI systems that can track multiple points of data, build a model, run a schedule for machine usage and from all of this build up a maintenance schedule. The result is lower life cycle cost for you the manufacturer.
Couple this with an energy management approach and you will find a new ability to optimize your plant, take advantage of lower energy costs, or make more informed decisions on where to build that new widget. Perhaps due to the energy costs in Russia it makes more sense to shift production there temporarily.
Coupled with an asset manage-ment program you will find an increased life span of your plant, lower downtime, lower maintenance costs and a lower operating expense overall. You will find an increase in your ability to achieve customer satisfaction as well.
OEM/machine builder implications
It would be easy to assume that energy management is the purview
Sponsor Profile
Life-Cycle Costing Strategy Delivering
Financial Benefit
Delivering Savings Through Energy
Monitoring
End-to-End Energy
ITT White Paper
Don’t Generate Energy Before You Generate
A Plan

10
Sponsored by
of the end user. But machine builders (defined as those that build machines that go into a production line or automation system) should become aware of their ability to influence end designs. You should learn how to differentiate your product – you do have competition, right?
So play up your ability to provide data. Exploit your ability to provide remote services, or to provide a machine that operates at 90% of the cost of your competitor. Reduced energy can be a saving grace to your business, and you can help your customer become more efficient, saving cost throughout. Just as your end user customer appreciates longer life cycles, you will to: you have a longer time to maintain, to refur-bish, to ”control” what you have sold. Energy management can be yet a different differentiator.
Industrial intelligenceAt the end of the day, what is
important is to have the data you need, when you need it, and where you need it. Also to make sure that data doesn’t get in the wrong hands. So make the steps you need to first, secure your data. Then use it: analyze it, make some decisions based on the data AND your priorities.
Think about it, save some energy. Measure it, then start to control it.
Manufacturing Blog
www.cisco.com/web/strategy/manufacturing
Cisco Manufacturing
Mark Wylie leads Cisco’s industry marketing efforts into the manu-facturing space. His current efforts center on Industrial Energy Management solutions for manufac-turing accounts, as well as specific programs to solidify relevance of the machine builder/OEM space. He is well known as a primary contributor to Cisco’s Ethernet to the Factory solution as well as his partnering efforts with major automation suppliers. Most recently he was involved in a number of collabora-tion technology efforts designed for manufacturing accounts.
END
Sponsor Profile
Life-Cycle Costing Strategy Delivering
Financial Benefit
Delivering Savings Through Energy
Monitoring
End-to-End Energy
ITT White Paper
Don’t Generate Energy Before You Generate
A Plan

11
Sponsored by
The Matter Of Generating Energy Is Well-Engineered And Well-Understood. How We Use Energy, And How Much Of It We Use, On The Other Hand, Is Still Mostly A Mystery For Most End Users.Bob Vavra, Content Manager08/11/2011
They built a solar farm in Smyrna, TN this year. That’s not extraordinary news, although it doesn’t happen every day, and certainly not over six acres of otherwise prime real estate in the growing hub that the greater Nashville areas has become. Its look is almost artistic – gleaming rows of solar panels angles to catch the Tennessee sun starting at about 8 a.m. most days – just about the same time workers at Schneider Electric’s Smyrna plant head inside to use some of that solar energy to build medium-voltage switchgear and motor starters.
There were many reasons Schneider Electric put this solar farm into the land at Smyrna. There are tax credits involved, and a chance to do some
onsite R+D for its own product line that will deliver solar inverter technology to more plants and buildings and institu-tions that want to choose solar-gener-ated energy for part of their energy equation. They want to cut their own utility bill for the operation at Smyrna, and by generating and selling energy back to the Tennessee Valley Authority they can create a small cash flow for themselves.
Any manufacturer looking at this story might be tempted to start putting pencil to paper and figuring how much capital it might take to build its own solar farm, whether there were any tax credits or co-generation opportunities in such a venture. Perhaps a group of small manufacturers in an industrial park might be of a mind to pool their resources to create a sort of co-op solar farm that could serve the power needs for the group – organic energy farming, if you will.
And these are all good ideas, worthy of further examination and contempla-tion. There’s one aspect of the Smyrna experiment, however, that bares review: The solar farm was not the beginning of the plants’ energy management efforts. Not even close.
Energy management has been a core principle at Smyrna for years. They actively measure power usage
by machine, by shift and by process. They’ve empowered the workers to be a player in the energy management effort. They’ve received corporate direc-tion and corporate support for treating energy as a managed cost rather than a monthly bill.
Building a solar farm is an event – and Schneider Electric celebrated that event on July 25, 2011, with all the usual speeches, ribbon-cutting, and tours that accompany such an announce-ment. Energy management goes far beyond building a solar farm. It’s not an event. It’s a process plant manager Michael DiNapoli and his team at Smyrna practice every day.
Generating energy is a relatively simple process in this day and age. You can burn coal or refine oil or build windmills or solar farms. The matter of generating energy is well-engineered and well-understood. How we use energy, and how much of it we use, on the other hand, is still mostly a mystery for most end users.
We cannot afford to operate like that any longer. Those looking for a quick fix, like a new solar farm, are starting in the middle of a long, tedious and absolutely necessary journey toward energy management. It begins with knowing how much energy you are consuming, and more important, where
in your facility you consume it. It takes an energy audit to start, and then constant measurement and monitoring of energy to understand where the problems are. That audit should extend beyond electrical energy to areas including oil and gas consumption and compressed air usage.
It takes a change in our energy attitude, and it takes a willingness to spend capital funds today to preserve capital tomorrow. We have to manage energy for the right reasons. There was a time when being green meant environmentally driven to the exclusion of all other factors. That’s no longer practical, or necessary.
Green is the color of the energy movement (and Schneider Electric’s corporate color as well) but it’s also the color of money. If your motivation is environmentally green, great. Just don’t lose sight of that other green. And if your motivation is monetary green, that’s great too. Just don’t lose sight of the other green.
The most important driver in all of this is to start with an understanding of what your energy usage is and where the opportunities are for savings. The issue is not in generating more energy. First, you need to generate a plan.
Don’t Generate Energy Before You Generate A Plan
END
Sponsor Profile
Life-Cycle Costing Strategy Delivering
Financial Benefit
Delivering Savings Through Energy
Monitoring
End-to-End Energy
ITT White Paper
Don’t Generate Energy Before You Generate
A Plan
12
Sponsored by
Sponsor Profile
Life-Cycle Costing Strategy Delivering
Financial Benefit
Delivering Savings Through Energy
Monitoring
End-to-End Energy
ITT White Paper
Don’t Generate Energy Before You Generate
A Plan
Mike Pemberton, ManagerEnergy Performance Services, ITT Plant Performance Services
Executive SummaryPumps typically consume more
energy than any other equipment category in continuous process indus-tries. What’s more, according to a recent study by the FiveTwelve Group, the average annual expense for pump system maintenance and operations is approximately 50 percent greater than for any other rotating machine. Companies that operate large numbers of pumps also need to focus on their energy costs. But too many organiza-tions consider these costs separately, when in fact they are closely linked. Every watt of excess energy ”pumped” into a motor system converts to vibration or heat that creates exces-sive wear on a pump or the rotating machine. Focusing on pump efficiency can deliver three benefits at once, and a comprehensive program for managing pump operating costs, through system optimization techniques, will identify and eliminate inefficiencies in pump reliability, energy and maintenance.
Pump Efficiency: A Single Strategy for Saving Energy, Boosting Reliability and Improving Process Control
ContentsSize of the energy savings opportunity . . . . . . . . . . . . . . . . . . . . . . . . . . . . . . . . . . . . . . . . . . . . 13
Energy-reliability-process control nexus . . . . . . . . . . . . . . . . . . . . . . . . . . . . . . . . . . . . . . . . . . . 13
Proper sizing of pumps . . . . . . . . . . . . . . . . . . . . . . . . . . . . . . . . . . . . . . . . . . . . . . . . . . . . . . . . . 14
Process control . . . . . . . . . . . . . . . . . . . . . . . . . . . . . . . . . . . . . . . . . . . . . . . . . . . . . . . . . . . . . . . . . 14
Mechanical options for optimization . . . . . . . . . . . . . . . . . . . . . . . . . . . . . . . . . . . . . . . . . . . . . . 14
Digital options. . . . . . . . . . . . . . . . . . . . . . . . . . . . . . . . . . . . . . . . . . . . . . . . . . . . . . . . . . . . . . . . . . 15
Hysteresis and harmonics . . . . . . . . . . . . . . . . . . . . . . . . . . . . . . . . . . . . . . . . . . . . . . . . . . . . . . . 15
Case study 1: Pump system failure plagues pulp mill bleach plant . . . . . . . . . . . . . . . . . . . . . 16
Case study 2: Performance assessment helps paper mill cut energy costs . . . . . . . . . . . . . 16
Case study 3: Analysis enables Texas company to trim repair costs 75 percent . . . . . . . . . . 17
Getting your organization on board . . . . . . . . . . . . . . . . . . . . . . . . . . . . . . . . . . . . . . . . . . . . . . . 17
Conclusion . . . . . . . . . . . . . . . . . . . . . . . . . . . . . . . . . . . . . . . . . . . . . . . . . . . . . . . . . . . . . . . . . . . . 17
About ITT . . . . . . . . . . . . . . . . . . . . . . . . . . . . . . . . . . . . . . . . . . . . . . . . . . . . . . . . . . . . . . . . . . . . . . 17
13
Sponsored by
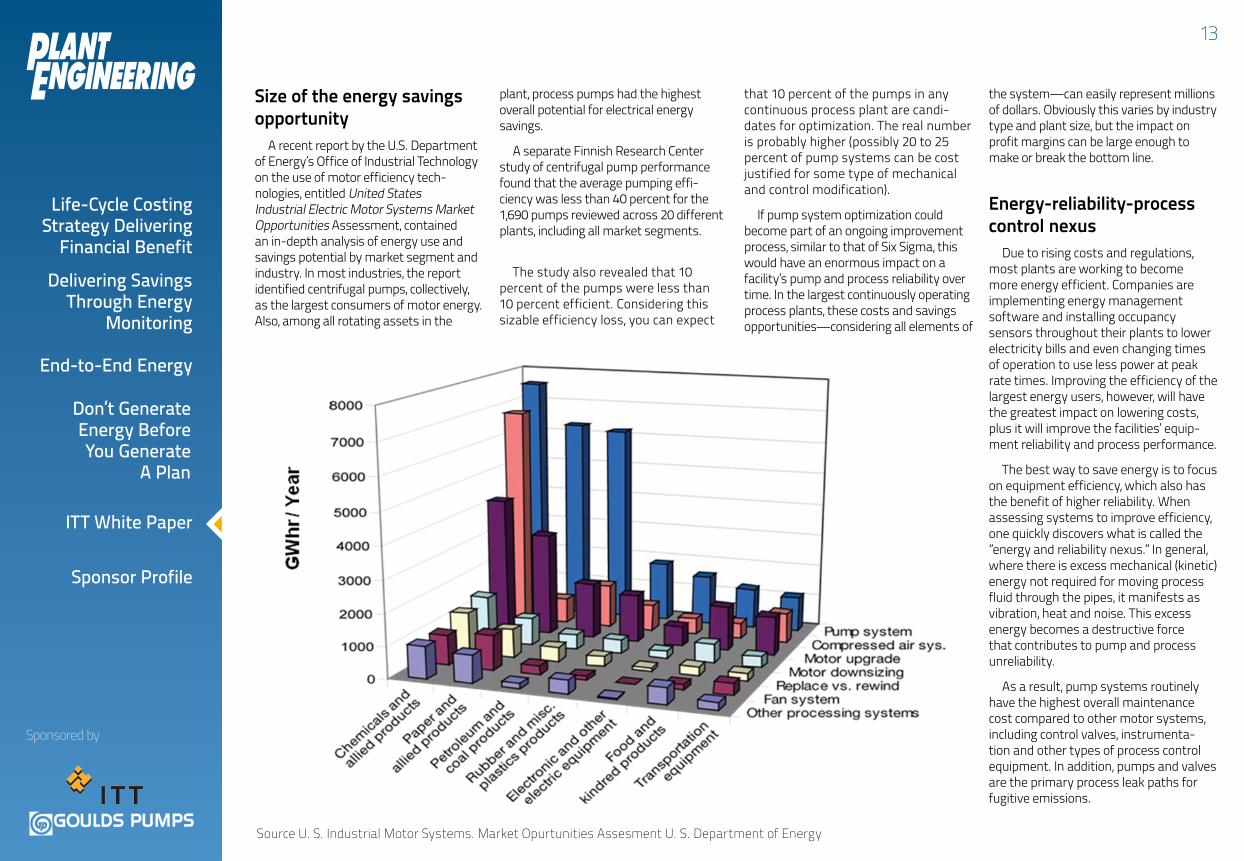
Size of the energy savings opportunity
A recent report by the U.S. Department of Energy’s Office of Industrial Technology on the use of motor efficiency tech-nologies, entitled United States Industrial Electric Motor Systems Market Opportunities Assessment, contained an in-depth analysis of energy use and savings potential by market segment and industry. In most industries, the report identified centrifugal pumps, collectively, as the largest consumers of motor energy. Also, among all rotating assets in the
plant, process pumps had the highest overall potential for electrical energy savings.
A separate Finnish Research Center study of centrifugal pump performance found that the average pumping effi-ciency was less than 40 percent for the 1,690 pumps reviewed across 20 different plants, including all market segments.
The study also revealed that 10 percent of the pumps were less than 10 percent efficient. Considering this sizable efficiency loss, you can expect
that 10 percent of the pumps in any continuous process plant are candi-dates for optimization. The real number is probably higher (possibly 20 to 25 percent of pump systems can be cost justified for some type of mechanical and control modification).
If pump system optimization could become part of an ongoing improvement process, similar to that of Six Sigma, this would have an enormous impact on a facility’s pump and process reliability over time. In the largest continuously operating process plants, these costs and savings opportunities—considering all elements of
the system—can easily represent millions of dollars. Obviously this varies by industry type and plant size, but the impact on profit margins can be large enough to make or break the bottom line.
Energy-reliability-process control nexus
Due to rising costs and regulations, most plants are working to become more energy efficient. Companies are implementing energy management software and installing occupancy sensors throughout their plants to lower electricity bills and even changing times of operation to use less power at peak rate times. Improving the efficiency of the largest energy users, however, will have the greatest impact on lowering costs, plus it will improve the facilities’ equip-ment reliability and process performance.
The best way to save energy is to focus on equipment efficiency, which also has the benefit of higher reliability. When assessing systems to improve efficiency, one quickly discovers what is called the ”energy and reliability nexus.” In general, where there is excess mechanical (kinetic) energy not required for moving process fluid through the pipes, it manifests as vibration, heat and noise. This excess energy becomes a destructive force that contributes to pump and process unreliability.
As a result, pump systems routinely have the highest overall maintenance cost compared to other motor systems, including control valves, instrumenta-tion and other types of process control equipment. In addition, pumps and valves are the primary process leak paths for fugitive emissions.
Source U. S. Industrial Motor Systems. Market Opurtunities Assesment U. S. Department of Energy
Sponsor Profile
Life-Cycle Costing Strategy Delivering
Financial Benefit
Delivering Savings Through Energy
Monitoring
End-to-End Energy
ITT White Paper
Don’t Generate Energy Before You Generate
A Plan

14
Sponsored by
Proper sizing of pumpsImproperly sized pumps often are the
major culprit when it comes to pump inef-ficiency. For a variety of reasons, process pumps frequently are oversized to meet process demands. One reason is that process parameters are often not fully defined as pumps are being specified—and because no one was ever fired for having too much horsepower, engineers tend to err on the side of overestimating pump needs. It’s also possible for a pump that is perfectly suited to its first installa-tion to become oversized (or undersized) as the demands of the process change.
It’s ideal to have every pump operating near its Best Efficiency Point (BEP) at all times. But that’s not a likely scenario—and to maximize the return on an effi-ciency program, it’s important to know which pump systems are the most in need of attention and whether they are at a significantly faster or slower flow rate than optimum.
In the example below, the Brake Horsepower Formula (i.e., head x flow) equates the amount of wasted energy from an inefficient pump system that is oversized and throttled.
The difference between a 70 percent and 40 percent efficient pump system is 135 horsepower (75 percent excess energy), which is, in effect, ”beating up your pump system,” and contrib-uting to unreliability and poor process control performance that continuously degrades over time. In the underbelly of a process plant, tell tale symptoms
of excess energy moving through the system often can be seen—including a highly throttled control valve in combination with pronounced pipe movement, or even a vibrating cat walk in connection with the infrastructure used to brace the throttled pump. Cavitation that is noted inside the pump, control valve or piping itself is a clear indication that hydraulic turbu-lence or instability exist.
If the system’s capacity is too high at the pump discharge, most are designed to simply throttle the flow back using a control valve in the discharge pipe. This arrangement is a very inefficient and costly way to configure a system, however. It increases energy costs for operating the pump, reducing the operating life of the equipment and increasing downtime.
Individual pumps are designed to operate in a specific flow range. When a pump is operating optimally near its BEP, liquid flows smoothly through the pump and radial and axial forces acting on the impeller are balanced. This allows the pump to experience its highest efficiencies and lowest vibration levels. But if the pump runs off-BEP it creates an imbalance of pressure inside the pump. Any of these problems can cause shaft deflection, which increases stress on the pump’s bearings and mechanical seals—and the likelihood of pump failures.
When evaluating proper pump sizing, it’s important to look at the system holistically. You’re not just buying a
pump—you’re selecting a key compo-nent of a process control system.
Process controlAccording to the results of a study
from 300 plant energy audits by Emerson Entech consultants, the majority of basic regulatory control loops actually increase process variability. The primary reason is missizing of the pump, valve and associ-ated piping, which ultimately makes it difficult to ”tune” the control loop.
A control loop system is defined as a set of devices designed to manage, command, direct or regulate the behavior of a process. The system is designed to try to maintain a variable at its set-point or reference value. Feedback control loops require process sensors to measure and control specific parameters, allowing adaptation to varying circumstances. They are central to making sure the process is efficient and reliable.
Due to misdimensioning issues, including over- and undersized pumps plus control valves and the associated piping, industrial process control performance is degraded over time. It is not uncommon
for the majority of control loops to actually increase process variability when in automatic control mode, and as a result, these control loops are often switched into manual mode to stabilize the process.
As a result, other studies indicated a high percentage of control loops actually operate in manual mode. A benchmarking report by Honeywell LoopScout of 115 facilities throughout all market segments revealed that the worst performers expe-rienced up to 60 percent of control loops categorized as ”bad actors,” with many of those systems operating in manual mode.
Fixed-speed pump systems are more subject to reliability incidents during ”upset” issues than those operating under variable speed control. By varying the speed, the pump can adapt to process changes, including start-up/shutdown and upsets.
Mechanical options for optimization
Once you’ve picked a pump to optimize, there is a range of mechanical and digital options to consider.
BHP = Flow rate (gpm) • Head (ft) • specific gravity 3960 x Pump Efficiency (%)A pump delivering 5000 gpm of water at 100 ft. requires(5000) (100) (1.0)/3960) (0.70) = 180 HP(5000) (100) (1.0)/3960) (0.40) = 315 HP
Sponsor Profile
Life-Cycle Costing Strategy Delivering
Financial Benefit
Delivering Savings Through Energy
Monitoring
End-to-End Energy
ITT White Paper
Don’t Generate Energy Before You Generate
A Plan

15
Sponsored by
According to the Department of Energy’s Office of Industrial Technology, a number of optimization and efficiency methods can be used to achieve energy savings and help justify reliability projects.
Digital optionsIn addition to mechanical controls,
there are digital technologies that vary the speed of the pump motor to improve efficiency. The simplest of these is the soft starter, a solid-state motor starter that is used to start or stop a motor by reducing the voltage to each phase of a motor and gradually increasing the voltage until the motor gets up to full voltage/speed, all at a fixed frequency. Fixed-speed motors typically experience current inrush of 5–7x normal when turned on that can cause voltage fluctuations and affect the performance of other circuits. To counteract this issue, components can be added in series to ramp the current up or down when the motor is turned on or off. It’s also crucial today to have a climate-controlled environment, which is becoming more common as plants integrate more digital systems.
More advanced digital controls vary the pump’s speed to match the
application’s need. These are called variable frequency drives (VFDs) or variable speed drives (VSDs). VFDs offer continuous process industries tremen-dous benefits (e.g., fewer models and sizes of pumps in addition to energy savings). The U.S. Department of Energy estimates that up to 25 percent of motor systems would benefit from VFD technology.
Despite the known benefits of VFD technology, adoption has been rela-tively slow, primarily due to perceived electrical and safety issues as well as physical space limitations for installa-tion in existing motor control centers (MCC). Though these can be significant issues, they can be successfully miti-gated with proper electrical wiring prac-tices, the use of localized environmental housing and today’s more mature VFD technology.
A VFD is an electrical system (e.g., inverter) used to control AC motor speed and torque. It provides a continuous range of process speeds compared to a discrete speed control device such as multiple-speed motors or gearboxes and controls motor speed by varying the frequency supplied to the motor.
The drive also regulates the output
voltage in proportion to the output frequency to provide a relatively constant ratio of voltage to frequency (V/Hz), as required by the charac-teristics of the AC motor to produce torque. In closed-loop control, a change in process demand is compensated by a change in power and frequency supplied to the motor, and thus a change in motor speed.
Traditionally, a fixed-speed pump and control valve have been used to regulate process flow. Even though VFD technology is gaining acceptance, the technology and benefits are often poorly understood. As such, there is uncertainty surrounding its use for pump control.
Any number of reasons can be the cause for this confusion, including:• Lack of knowledge about the
hydraulic performance between fixed and variable speed pump control
• Lack of knowledge concerning control and failure modes, especially for mission critical applications
• Perception that a VFD is always more expensive than a control valve
• Concerns about the reliability of the electronics platform
Many of these concerns stem from bad experiences before VFD technology became fully mature. These legacy issues can be put into perspective by relating them to the evolution of PC technology. The cost of low-voltage VFDs continues to drop while reliability and functionality increase. As a result, VFD technology has become a highly reliable, cost-effective alternative to using fixed-speed pumping systems. They also offer diagnostic data, not only about the drive itself, but also the motor system.
There also are compound benefits through implementation. These include energy and maintenance savings, pump and process reliability improvements, better process control and less fugitive emissions. In addition, on new projects, the application of VFD technology can reduce overall capital cost by elimi-nating the need for discharge control valves, in many cases, and motor starters, plus the associated wiring and pneumatic lines. In general, smaller pumps with lower horsepower motors can be used. In terms of piping, smaller diameters often suffice, and bypass lines and their associated isolation and control valves can be eliminated.
In addition, pump optimization will increase the level of condition moni-toring through the broader use of VFDs and wireless vibration monitoring, among other digital tools that offer real-time information on pump system performance.
Hysteresis and harmonicsNew problems have arisen today that
can have a dramatic impact on pump effi-ciency. Hysteresis refers to systems that may exhibit path dependence or ”rate-independent memory.” In a deterministic system with no dynamics or hysteresis, it is possible to predict the system’s output at an instant in time given only its input at that instant in time.
This is not possible in a system with hysteresis. The output depends in part on the internal state of the system, not only on its input. There is no way to predict the system’s output without looking at the history of the input (to determine the path that the input followed before it reached its current value) or inspecting the internal state of the system.
Impact of Mechanical OptionsAction Energy SavingsReplace throttling valves with speed controls 10%–60%Reduce speed for fixed load 5%–40%Install parallel system for highly variable loads 10%–30%Equalize flow over product cycle using surge vessels 10%–20%Impeller trims 1%–8%Replace motor with more efficient model 1%–3%Replace pump with more efficient model 1%–2%
Sponsor Profile
Life-Cycle Costing Strategy Delivering
Financial Benefit
Delivering Savings Through Energy
Monitoring
End-to-End Energy
ITT White Paper
Don’t Generate Energy Before You Generate
A Plan

16
Sponsored by
Another issue is harmonics, defined as voltages or currents at frequencies that are a multiple of the fundamental frequency. Any distortion in the voltage or current wave causes harmonics. In most systems, the fundamental frequency is 60 Hz. Therefore, harmonic order is 120 Hz, 180 Hz, 240 Hz and so on. (For European countries with 50 Hz systems, the harmonic order is 100 Hz, 150 Hz, 200 Hz, etc.)
Most utilization equipment today creates harmonics. In all likelihood, if a device converts AC power to DC power (or vice versa) as part of its steady-state operation, it’s considered a harmonic current-generating device. These include uninterruptible power supplies, copiers and computers.
Harmonic currents create heat and, over a period of time, will raise the temperature of the neutral conductor causing nuisance tripping of circuit breakers, overvoltage problems, blinking of incandescent lights, computer malfunctions, etc. In some cases, it can break down the insulation between windings of a transformer. In both cases, the result is a fire hazard. You can, however, diminish or eliminate this potential damage by using known and sound electrical wiring practices.
Case study 1: Failed pump plagues pulp mill bleach plant
A vat dilution pump in a pulp mill bleach plant had an 1180 rpm, 250 hp medium voltage motor driving a double suction pump. The pump had a 14-inch discharge line that branched into three separate 10-inch lines feeding 200-degree Fahrenheit liquor to the end-user systems. Each of the three
branches had its own eight-inch control valves that were usually operating in the range of 20 percent to 40 percent open. The gaskets between the pump discharge flange and pipe frequently failed.
Looking downstream and up to the top of the bleaching towers, each branch line was ”rocking and rolling” and, as a result, experienced an inordi-nate number of cracks. Pipe cracks led to chemical losses in the sewers and unplanned downtime. Taken altogether, each layer of cost associated with the oversized pump system had the cumu-lative effect of 36 hours of downtime each month to repair some component or multiple components of the system. In this scenario, the detrimental finan-cial impact to the bottom line was substantial—in the range of high six figures annually.
The primary solution for this applica-tion was the implementation of variable speed pressure control. The pump system normally consumed around 200 horsepower, with the end-user valves highly throttled (20 to 40 percent open). In addition, the vibration levels were about 0.6 inches per second. After VFD implementation, the pump normally
consumes 75 horsepower. In effect, the excess 125 horsepower, above that required to move the fluid was ”beating up” the pump, contributing to unreli-ability. Reliability has been restored to this system, which has run for several years without experiencing past issues and no more expense than normal maintenance.
Case study 2: Performance audit helps paper mill cut energy costs
Appleton Coated, a large paper manufacturer headquartered in Kimberly, Wisconsin, offers high-quality products and services, including coated paper for both traditional and digital printing, specialty products, publishing paper, and different text and cover options.
At the company’s large manufac-turing facility in Combined Locks, Wisconsin, over 1,000 centrifugal pumps aid in the production of more than 1,100 tons of paper each day. Ninety-five percent of these pumps are manufactured by ITT Goulds Pumps.
The mill operates 24 hours day, seven days a week, with brief shutdowns twice a year for major maintenance reviews. With a booming business and a talented engineering staff focused on maintaining production, the company has limited time to research potential energy saving projects.
All of the paper machines are new or have been upgraded within the past 15 years, but many of the pumps used in processing wood pulp into coated paper stock are older. As energy prices have risen rapidly in recent years, and utili-ties provide price incentives to reduce demand, improving the energy effi-ciency of pump systems has become a priority.
A pump assessment and efficiency study for Appleton Coated recom-mended potential efficiency improve-ment for 23 pumps. To date, the mill has implemented variable frequency drive on five applications that have a 2.5 year payback, amounting to $102,000 savings per year. Other pump optimization projects are scheduled for the future. The mill also was able to take advantage of utility incentive programs for additional savings.
Like modern PC and smartphone technologies, the latest VFDs have made “smart pumping” more accessible, reliable and easy to use.
Sponsor Profile
Life-Cycle Costing Strategy Delivering
Financial Benefit
Delivering Savings Through Energy
Monitoring
End-to-End Energy
ITT White Paper
Don’t Generate Energy Before You Generate
A Plan

17
Sponsored by
Case study 3: Analysis en-ables Texas refining com-pany to trim repair costs 75 percent
Pasadena Refining Systems, Inc., refines up to 120,000 barrels of oil per day. After ITT Performance Services conducted a Cause, Cost and Correction analysis and assessment on 30 ”bad-actor” pumps, implementing hydraulic rerates, refurbishments and impeller changes/trims of existing pumps, the repair costs have been reduced by 75 percent over two years, and fugitive emissions from these systems has been cut by 95 percent.
Getting your organization on board
Today, pumps are not considered by most organizations to be an integral component of the process automation architecture. As a result, plant informa-tion systems typically lack continu-ously monitored data for trends and diagnostics.
For all practical purposes, almost all of the work orders and asset informa-tion is manually entered. The underlying assets, including compressors, blowers, fans and control valves seldom or rarely are connected to the computerized maintenance management system (CMMS); therefore, this situation becomes a missing link in an e-manu-facturing strategy and large potential cost savings are unrealized. According to the ARC Advisory Group, nearly 40 percent of manufacturing revenues are devoted to maintenance and approxi-mately 60 percent of scheduled main-tenance checks and motor systems are unnecessary.
Companies need to understand that there’s a strong link between opera-tional process control data and equip-ment performance data. In an ideal world, industrial plants would have a comprehensive, integrated process management system to operate at maximum efficiency. Even before that, however, efficiency projects on high-priority pumps can deliver significant savings. Cross-functional teams need to recognize that energy conserva-tion, equipment reliability and process
control are closely interwoven, and improving pump efficiency is one of the best ways to achieve all three.
ConclusionIn the future, fixed-speed pumps must
be sized to operate within a reason-able range of their best efficiency point, especially those operating at higher speeds. Variable speed process control can help solve many of the daunting process issues inhibiting the plant of today, both in terms of reducing raw material variability and life-cycle cost savings, which can be estimated based on current costs versus optimized costs.
Making decisions that are based solely on long-term operating costs versus having an inordinately large safety margin to make sure operations can always produce more flow that is rarely, if ever, needed, will open a window to the plant of tomorrow. Future produc-tion processes must be highly adaptable and sustainable with a healthy return on employed capital. Presumably that is what is meant when we often hear ”the future must be lean and green.” It is no easy task to get there, but the
compound benefits are too compelling not to shake off the inertia in order to create this future reality.
About ITTITT Corporation is a high-technology
engineering and manufacturing company operating on all seven conti-nents in three vital markets: water and fluids management, global defense and security, and motion and flow control. With a heritage of innovation, ITT partners with its customers to deliver extraordinary solutions that create more livable environments, provide protection and safety and connect our world. Headquartered in White Plains, N.Y., the company generated 2010 revenue of $11 billion (www.itt.com).
END
Sponsor Profile
Life-Cycle Costing Strategy Delivering
Financial Benefit
Delivering Savings Through Energy
Monitoring
End-to-End Energy
ITT White Paper
Don’t Generate Energy Before You Generate
A Plan

18
Sponsored by
Sponsor Profile
Life-Cycle Costing Strategy Delivering
Financial Benefit
Delivering Savings Through Energy
Monitoring
End-to-End Energy
ITT White Paper
Don’t Generate Energy Before You Generate
A Plan
World leader in pumpsITT Goulds Pumps is the world’s
leading manufacturer of pumps for a wide range of industrial markets—including chemical, pulp and paper, power generation, general industry, mining, and oil & gas. As the only manufacturer to make digital moni-toring standard on every process pump, ITT Goulds Pumps continues to lead the industry in both mechanical pump design and the adoption of smart technologies.
Higher reliability, lower downtime
ITT Goulds Pumps provides additional services that help its customers manage their processes more efficiently—such as pump assessments, asset manage-ment, engineered upgrades, mainte-nance outsourcing and field repairs. These services help customers to lower total cost of ownership (TCO), minimize downtime and increase equipment reliability. ITT Goulds Pumps offers customers a unique global network of service and support, with parts stocked in more than 75 locations worldwide,
delivered with 98 percent on-time perfor-mance and 99.9 percent quality rating.
ITT Goulds Pumps is part of the Industrial Process segment of ITT Corporation. Industrial Process provides solutions tailored to customers’ needs specifically to lower TCO and improve plant uptime. In addition to ITT Goulds Pumps, these solutions are provided under global brands including Fabri-Valve®, Pure-Flow, Skotch®, C’treat, PumpSmart®, ProSmart® and PRO Services®.
Need pump know-how? Visit us online
ITT Goulds Pumps is a dominant brand of pumps worldwide. In addition to making world-class equipment, we help customers use our products to improve their industrial processes. Visit our website for product specifications; technical literature on pump operation, maintenance and monitoring basics, and life cycle costing; as well as a down-loadable pump selection guide and the Industrial Process Pump Safety Manual.
Sponsor Profile