1 formation and erosion of sediment cover in an
TRANSCRIPT
1
Formation and erosion of sediment cover in an experimental bedrock-alluvial 1
channel 2
Rebecca Hodge1, Trevor Hoey2, Georgios Maniatis2,3 and Emilie Leprêtre4 3
1 Department of Geography, Durham University, Durham, UK 4
2 School of Geographical and Earth Sciences, University of Glasgow, UK 5
3 School of Computing Science, University of Glasgow, UK 6
4 Suez Environment and University of Montpellier, France 7
8
Accepted by Earth Surface Processes and Landforms 9
10
2
Abstract 11
Sediment grains in a bedrock-alluvial river will be deposited within or adjacent to a 12
sediment patch, or as isolated grains on the bedrock surface. Previous analysis of 13
grain geometry has demonstrated that these arrangements produce significant 14
differences in grain entrainment shear stress. However, this analysis neglected 15
potential interactions between the sediment patches, local hydraulics and grain 16
entrainment. We present a series of flume experiments that measure the influence of 17
sediment patches on grain entrainment. The flume had a planar bed with roughness 18
that was much smaller than the diameters of the mobile grains. In each experiment 19
sediment was added either as individual grains or as a single sediment pulse. Flow 20
was then increased until the sediment was entrained. Analysis of the experiments 21
demonstrates that: 1) for individual grains, coarse grains are entrained at a higher 22
discharge than fine grains; 2) once sediment patches are present, the different in 23
entrainment discharge between coarse and fine grains is greatly reduced; 3) the 24
sheltering effect of patches also increases the entrainment discharge of isolated 25
grains; 4) entire sediment patches break-up and are eroded quickly, rather than 26
through progressive grain-by-grain erosion, and 5) as discharge increases there is 27
some tendency for patches to become more elongate and flow-aligned, and more 28
randomly distributed across the bed. One implication of this research is that the 29
critical shear stress in bedrock-alluvial channels will be a function of the extent of the 30
sediment cover. Another is that the influence of sediment patches equalises critical 31
shear stresses between different grain sizes and grain locations, meaning that these 32
factors may not need to be accounted for. Further research is needed to quantify 33
interactions between sediment patches, grain entrainment and local hydraulics on 34
rougher bedrock surfaces, and under different types of sediment supply. 35
3
36
1. Introduction 37
Semi-alluvial channels are identified by their predominantly bedrock channel 38
boundaries and partial alluvial cover (Turowski et al., 2008). The total extent of 39
sediment cover within a semi-alluvial channel is a function of the sediment supply 40
relative to transport capacity, although the exact form of this relationship is debated 41
(Sklar and Dietrich, 2004; Turowski et al., 2007; Chatanantavet and Parker, 2008; 42
Hodge and Hoey, 2012). The spatial arrangement of the sediment cover within the 43
channel is in turn the result of interactions between the bedrock topography, channel 44
hydraulics and sediment transport processes (Hodge et al., 2011; Nelson and 45
Seminara, 2012; Inoue et al., 2014; Johnson, 2014; Zhang et al., 2015). These two 46
factors, the total extent and spatial arrangement of sediment cover, are inter-related 47
in ways that have yet to be investigated. As with alluvial bedforms, sediment patches 48
can develop in response to boundary shape (analogous to ‘forced’ bars in alluvial 49
literature; Seminara 2010; described as externally controlled by Wohl, 2015) or as a 50
result of the interactions between flow, bedform morphology and sediment transport 51
(equivalent to ‘free’ bars). To date, emphasis has been on how forced sediment 52
accumulations, whether due to irregular bedrock topography (Turowski and 53
Rickenmann, 2009; Siddiqui and Robert, 2010; Hodge and Hoey, in revision) or large 54
immobile boulders (Carling and Tinkler, 1998; Carling et al., 2002; Chatanantavet 55
and Parker, 2008; Papanicolaou et al., 2012) affect flow and sediment cover. To 56
interpret sediment accumulation and erosion in natural channels (e.g. Hodge and 57
Hoey, in revision) which are always likely to have a component of morphological 58
forcing of sediment cover, understanding of how self-formed ‘free’ bedforms function 59
in semi-alluvial channels is required. 60
4
The location of a grain within a semi-alluvial channel can have a significant effect on 61
that grain’s critical shear stress (τc) and hence the ease with which it is entrained by 62
the flow. Isolated sediment grains on a smooth bedrock surface can have values of 63
τc that are an order of magnitude less than comparable grains in an alluvial patch 64
(Hodge et al., 2011). This difference is the result of the differing pocket geometries 65
on grain exposure and pivot angle. Differences in roughness, and hence flow profiles 66
and local shear stress, over the alluvial and bedrock surfaces are also likely to 67
exacerbate differences in grain transport potential (Inoue et al., 2014; Johnson, 68
2014). The spatial pattern of roughness elements in semi-alluvial channels is very 69
variable (Chatanantavet and Parker, 2008; Inoue et al., 2014), complicating attempts 70
to develop empirical relationships for controls over patch development. 71
Consequently, we focus here on sediment patches on planar, relatively smooth, 72
surfaces in order to isolate the effects of grain-scale interactions on patch 73
development and erosion. 74
From the perspective of grain geometry, the distribution of isolated grains and 75
sediment patches across a bedrock surface determines the distribution of τc for the 76
population of grains (Hodge et al., 2011), and hence the sediment flux at low 77
discharges. At higher discharges when the applied shear stress (τ) is much greater 78
than τc, all sediment will be fully mobile and the range of τc is no longer significant. 79
However, the typical lognormal distribution of flow events in a river combined with 80
low values of τc for isolated grains means that low flow events can have a more 81
significant impact on the total sediment flux than is the case in alluvial rivers with the 82
same sediment sizes (Lisle 1995; Hoey and Hodge, in prep). Theoretical modelling 83
has demonstrated that by distributing the same amount of sediment cover in different 84
ways (i.e. different proportions of grains in bedrock and alluvial positions) the 85
5
resulting average sediment fluxes range from less than to greater than the average 86
sediment flux in a comparable alluvial river (Hoey and Hodge, in prep). An 87
understanding of the development of sediment cover in semi-alluvial channels is 88
therefore necessary in order to predict sediment fluxes in these systems. 89
There is little empirical data with which to constrain the most likely distributions of 90
sediment cover, however, previous research has identified some first order 91
tendencies. Higher values of τc for grains in alluvial patches are likely to produce a 92
net flux of grains from bedrock surfaces to alluvial patches (Nelson and Seminara, 93
2012). Sediment is thus most likely to form alluvial patches, with only a small fraction 94
of the grains remaining isolated on bedrock surfaces. This pattern is consistent with 95
field sediment tracer data (Hodge et al., 2011). The position and form of alluvial 96
patches will be controlled by both the underlying bedrock topography and 97
interactions between the patch roughness and the local hydraulics (Finnegan et al., 98
2007; Johnson and Whipple, 2010; Hodge and Hoey, in revision). Alluvial bedforms 99
such as pebble clusters affect the local hydraulics, causing a downstream separation 100
zone and coherent flow structures with well-defined spatial characteristics (Strom 101
and Papanicolaou, 2007; Lacey and Roy, 2008). Similar processes will occur around 102
alluvial patches, amplified by the potential contrast in roughness between bedrock 103
and alluvial regions and the topographic expression of patches on a bedrock surface, 104
so affecting the growth and shape of the patches and local sediment transport. 105
Whether flow conditions are steady or varying, it is unclear how the bedforms 106
interact and whether these interactions are predominantly regenerative (maintaining 107
bedforms of a given size) or constructive (tending to merge bedforms into a smaller 108
number of larger features) (Kocurek et al., 2010). 109
6
To begin to address the issues raised above, in this paper we present results from 110
flume experiments on the development and erosion of sediment cover on a bedrock 111
surface. We simplify conditions to assess the fundamental process controls over free 112
bedforms, and use uniform channel width, slope and roughness. In each experiment, 113
a fixed volume of sediment was introduced at the upstream end of a flume with a 114
plane bed of constant low roughness, which resulted in sediment patches 115
developing. Once sediment cover had developed, flow was increased at a known 116
rate and the sediment cover was eroded. The aims of the experiments are to: 1) 117
quantify the impact of grain size and position on τc, which is recorded by the flow at 118
which different grains are entrained; and, 2) quantify patch geometry and how this 119
changes as patches are eroded. Results are reported from three sets of 120
experiments: Set 1, control experiments using single grains and no sediment 121
patches; Set 2 with a uniform coarse grain size; and Set 3 with different mixtures of 122
two uniform sediments, one coarse and one fine. 123
2. Methods 124
Three sets of experiments (Sets 1, 2 and 3; Table 1) were carried out in a 0.9 m wide 125
flume which has a working length of 8 m and maximum flow of 75 l s-1. A flat plywood 126
bed was installed in the flume, with small-scale roughness added by fixing a layer of 127
< 0.5 mm sand to this using varnish. Flume slope was 0.0067 (Sets 1 and 3) and 128
0.0050 (Set 2). Uniform flow was established throughout the operational section at 129
the start of each run by setting discharge to be close to the sediment transport 130
threshold and adjusting the elevation of the flume tail gate until water depth was 131
constant through the measuring section. Under the initial low flow conditions, flow 132
depths varied from 9 to 40 mm. As flow increased, maximum flow depths were 133
between 50 and 80 mm. Flow properties vary according to the sediment cover on the 134
7
bed. With no sediment cover, flows across the experimental range of 8.5 to 40 l s-1 135
had a Froude number between 1.27 and 1.33, and Reynolds number of 9100 to 136
40300. As sediment patches develop, flow may become subcritical. Under the 137
extreme condition of full sediment cover (which is more cover than seen in the 138
experiments), flows from 5.4 to 33 l s-1 have Froude numbers between 0.20 to 0.48 139
and Reynolds numbers from 5400 to 30300. 140
Figure 1 outlines the experimental procedure. Set 1 experiments (Table 1) were a 141
control to measure the entrainment threshold for the material used in later 142
experiments when introduced as single, isolated grains. Two very angular sediments 143
(0.2 on the Krumbein roundness scale; Krumbein, 1941) with uniform grain sizes 144
were used for the experiments. Coarse sediment (C) has D50=15 mm and fine 145
sediment (F) has D50 = 8.5 mm. In each Set 1 experiment a single, randomly 146
selected, grain was placed on the centreline of the flume ~4 m from the flume 147
entrance and flow was increased until the grain was entrained. Fifty measurements 148
were made, twenty five with each of the fine and coarse grains. 149
In Set 2 and 3 experiments, a known volume of sediment was introduced at the initial 150
discharge, and allowed to developed patches of sediment cover in the measurement 151
section which extended from 5.5 to 5.8 m along the flume and across the entire width 152
of the flume (a total area of 0.27 m2, determined by the video camera field of view). 153
Sediment cover in the measurement area was representative of that in the rest of the 154
flume. Furthermore, each experiment was repeated at least three times. The initial 155
discharge was maintained until there was little temporal variation in cover extent, 156
which typically took about 15 min to form. Sediment cover extent ranged from 13% to 157
23%. Flow was then increased at a rate of 1.2 l s-1 per minute until the maximum 158
capacity of the pump was reached to erode the sediment grains and patches. Patch 159
8
formation and erosion was recorded by vertical video photography. Set 2 consisted 160
of 21 repeat experiments each using 20 kg of coarse sediment C. Set 3 used the 161
sediments C and F mixed in the following proportions (where the numbers refer to 162
the percentage of each size fraction in the mixture): 100C, 75C/25F, 50C/50F, 163
25C/75F, 10C/90F and 100F. Each set 3 experiment used 6 kg of sediment, 164
although the proportion of this that formed sediment patches the measuring section 165
varied between runs. Up to 5 repeats were performed of each experiment in Set 3. 166
Two main approaches were used to analyse the video of the experiments in Sets 2 167
and 3. The first was watching the erosion of the sediment cover, and identifying the 168
time and hence discharge at which isolated grains, and those in patches, were 169
eroded. Isolated grains were defined as being those with contact with ≤ 2 other 170
grains in Set 2, and as one grain diameter from any other grain in Set 3. These 171
different definitions reflect differences in the typical behaviour of the coarse and fine 172
grains. In runs with both coarse and fine grains, patches were classified by grain 173
sizes within the patch (coarse, fine or mixed). The analysis noted the time (and 174
hence discharge), of the first entrainment of isolated grains (defined as three grains 175
moving a distance of one or more grain diameters), and the first break up of a stable 176
alluvial patch. In Set 3, the timing of the entrainment of all grains within the imaged 177
area was also recorded. In both sets grains entering the frame from upstream were 178
ignored. 179
The second analytical approach was to measure the sediment cover and the patch 180
geometry. Stills from the videos of the experiments were analysed using two different 181
methods. In the first, the software ImageJ (http://imagej.nih.gov/ij/index.html) was 182
used to segment automatically the grains from the background using the Trackmate 183
algorithm (Crocker and Grier, 1996). Isolated grains were manually identified, and 184
9
their areas calculated by the software. The algorithm results were visually assessed 185
to ensure that grains were being identified correctly. The segmentation algorithm 186
was applied to images of high flows over an empty bed to quantify phantom cover 187
caused by scattered light, and this amount of cover was removed from the total 188
calculated from subsequent images. In the second approach, grains were digitised 189
by manually marking the centre of every grain in the frame, and identifying whether 190
the grain was fine or coarse. Image aberration due to the water surface was not 191
explicitly accounted for because it was possible to visually identify the location of all 192
grains.. All grains within one grain diameter were identified as being members of the 193
same patch, and isolated grains were those that were more than one grain diameter 194
from any neighbouring grain (Figure 1). 195
The two techniques give comparable estimates of the proportion of sediment cover, 196
with the RMS error between estimates from 65 frames being 0.026.The similarity 197
between the two sets indicates that the automated segmentation techniques are 198
robust. In Set 2 experiments, changes in the proportion of sediment cover were 199
assessed in 142 frames using Image J. In Set 3 experiments, digitisation of grains 200
was carried out on twelve runs; two of each sediment mixture. For each run, frames 201
from one, five and every subsequent five minute interval after the onset of the flow 202
increase were analysed. 203
A number of patch statistics were calculated from the digitised Set 3 images: 204
dimensions, orientation and Ripley’s K statistic. Patch dimensions were calculated 205
using the Matlab function regionprops, which fits an ellipse with the same second 206
moments as the patch area (where the second moment of an area reflects the 207
distribution of material within the area), and provides the major and minor axis 208
lengths and major axis orientation. This method takes into account all sediment 209
10
within the patch, rather than just at the extremes as a bounding box approach would 210
do, and provides an estimate of patch size that is less sensitive to patch shape. 211
Ripley’s K statistic is a measure of how points are distributed across a surface, 212
describing whether points are more evenly distributed or more clustered than a 213
random spacing (Hajek et al., 2010; L’Amoreaux and Gibson, 2013). The K statistic 214
is calculated at a range of lags in order to identify whether the distribution changes 215
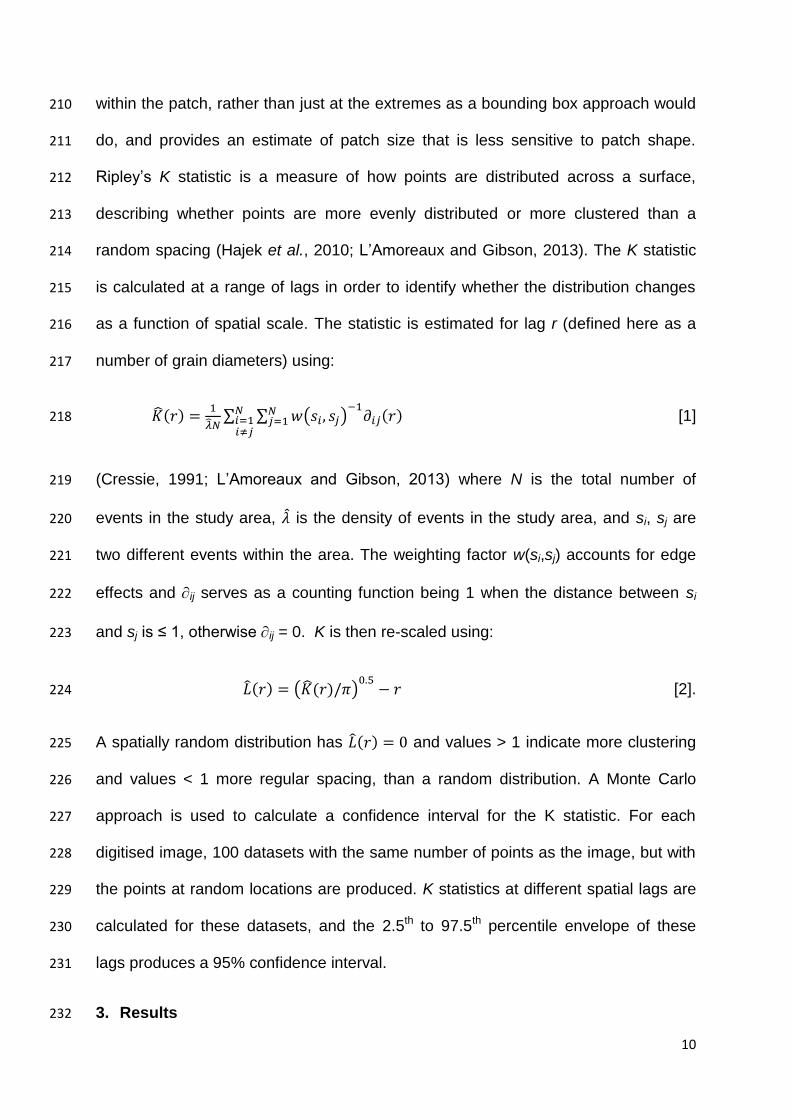
as a function of spatial scale. The statistic is estimated for lag r (defined here as a 216
number of grain diameters) using: 217
�̂�(𝑟) =1
�̂�𝑁∑ ∑ 𝑤(𝑠𝑖, 𝑠𝑗)
−1𝜕𝑖𝑗(𝑟)
𝑁𝑗=1
𝑁𝑖=1𝑖≠𝑗
[1] 218
(Cressie, 1991; L’Amoreaux and Gibson, 2013) where N is the total number of 219
events in the study area, �̂� is the density of events in the study area, and si, sj are 220
two different events within the area. The weighting factor w(si,sj) accounts for edge 221
effects and ij serves as a counting function being 1 when the distance between si 222
and sj is ≤ 1, otherwise ij = 0. K is then re-scaled using: 223
�̂�(𝑟) = (�̂�(𝑟)/𝜋)0.5
− 𝑟 [2]. 224
A spatially random distribution has �̂�(𝑟) = 0 and values > 1 indicate more clustering 225
and values < 1 more regular spacing, than a random distribution. A Monte Carlo 226
approach is used to calculate a confidence interval for the K statistic. For each 227
digitised image, 100 datasets with the same number of points as the image, but with 228
the points at random locations are produced. K statistics at different spatial lags are 229
calculated for these datasets, and the 2.5th to 97.5th percentile envelope of these 230
lags produces a 95% confidence interval. 231
3. Results 232

11
3.1. Grain entrainment shear stress 233
Results of the conditions under which grain entrainment occurred are mainly 234
reported in terms of discharge, rather than shear stress. The shallow flow depths 235
relative to the grain size produced non-uniform flow over the sediment patches, 236
meaning that du Boys’ approximation of shear stress is not applicable for Sets 2 and 237
3. However, in Set 1 the single isolated grains did not significantly disrupt the uniform 238
flow in the flume, and so du Boys’ approximation is valid. Flows were also too 239
shallow to measure local velocity profiles that could be used to calculate shear 240
stress. 241
Figure 2 shows the distributions of discharge at which isolated grains and alluvial 242
patches first began to move in experimental Sets 1 and 2. In Set 1, fine and coarse 243
isolated grains move at mean discharges of 5.8 (±0.31) l s-1 (one standard error) and 244
8.3 (±0.81) l s-1 respectively. These are equivalent to shear stresses of 0.95 (±0.02) 245
and 1.12 (±0.05) Pa, and dimensionless shear stresses of 0.007 (±0.0002) and 246
0.004 (±0.0002). These entrainment discharges for the coarse and fine grains are 247
significantly different (t-test, p = 0.007). 248
In Set 2, isolated coarse grains start to move at a discharge of 10 l s-1, with coarse 249
grains in patches beginning to move at a significantly higher discharge of 21 l s-1 (t-250
test, p <0.0001). Entrainment discharges of isolated coarse grains in Set 2 are higher 251
than for isolated coarse grains in Set 1, although this is not statistically significant (t-252
test, p = 0.057). This 20% increase in discharge between Sets 1 and 2 is equivalent 253
to approximately a 10% rise in shear stress (assuming that shear stress is 254
proportional to flow depth and that this scales with Q0.5, and remembering that du 255
Boys’ approximation cannot be applied to Set 2). 256
12
Distributions of entrainment shear stresses from Set 3 are shown in Figure 3. In 257
these boxplots, data from the different replicate runs are amalgamated. Such 258
amalgamation is supported by application of the Kruskal-Wallis test, which was used 259
to compare the entrainment discharge for grains of the same size and in the same 260
location between different replicates. In 6 out of the 23 combinations of sediment 261
mixture and grain position, there was no significant difference (p > 0.05) between 262
any of the different replicate runs. In 14 of the other combinations, application of 263
Tukey-Kramer revealed that within each set of replicates, only one distribution was 264
significantly different to the other ones. 265
In Set 3, across all sediment mixtures, fine grains in both isolated and patch 266
locations start to be entrained at a discharge of around 9 l s-1 (Figure 3). Coarse 267
grains in isolated and patch locations show a similar behaviour when there is up to 268
50% fines in the sediment mixture, and this behaviour is comparable to the 269
behaviour of the coarse grains in Set 2. However, when more than 50% of the 270
mixture is fine sediment, coarse isolated grains and coarse patches start to be 271
entrained at higher discharges. Figure 3 also shows the variation in initial 272
entrainment between replicate runs. Across all sediment mixtures, isolated fine 273
grains have initial entrainment over a range of 3.6 l s-1, whereas for coarse isolated 274
grains there is more variability and the range is 7.6 l s-1. There is most variability in 275
the initial entrainment from fine and coarse patches, with ranges of 19.7 and 19.6 l s-276
1. Initial entrainment from mixed patches has similar values and range to that of 277
course isolated grains. Such variability in initial motion is consistent with that 278
observed in the field by Richardson et al. (2003). 279
Consolidating the above interpretation (Figure 3), the Kruskal-Wallis test indicates a 280
significant difference (p < 0.05) between the minimum discharges for different grain 281
13
sizes and positions in runs 100C/0F, 10C/90F, 50C/50F and 25C/75F. Additional use 282
of the Tukey-Kramer test confirms that the main differences are between patch and 283
isolated grains. An alternative grouping of the data by grain size and location, and 284
hence comparison between sediment mixtures, showed that the only significant 285
variation in minimum discharge with sediment mixture is for coarse isolated grains. 286
In Set 3, grain size and location affects the discharge (value and variability) at initial 287
grain entrainment. In contrast, the mean discharge at which grains are entrained is 288
less variable between different grain sizes and locations. As before, there is most 289
variation in the replicate runs for grains in fine and coarse patches. Grains in these 290
patches are also the most affected by the composition of the sediment mixture; as 291
the percentage of fines increases, the mean entrainment shear stress for grains in 292
fine and coarse patches decreases and increases respectively. 293
Application of the Kruskal-Wallis test to the full distributions of entrainment 294
discharges for all mobile grains revealed that for each sediment mixture, there were 295
significant differences between grains in different locations (p ≤ 0.02). Further 296
analysis with Tukey-Kramer revealed that in all cases the significant differences were 297
between grains in isolated and patch positions. For each sediment mixture, there 298
was no significant difference between the distributions of entrainment discharge for 299
coarse and fine isolated grains if both were present. For each mixture there was also 300
no significant difference between grains in the various types of patches, with the 301
exception of the fine and mixed patches in 10C/90F. 302
The analysis of sediment entrainment has demonstrated that: 1) the impact of grain 303
size on entrainment discharge become less important once there are sediment 304
patches present; 2) the presence of sediment patches increases the entrainment 305
14
discharge for isolated grains as well as for patch grains, indicating the impact of 306
patches on hydraulics; 3) grain location has a greater impact on the minimum 307
entrainment discharge than on the mean; and 4) fine and coarse patches become 308
relatively less and more stable respectively as the proportion of fines in the sediment 309
mixture increases. 310
3.2. Erosion of sediment cover 311
The extent of sediment cover at steady state was an average of 22.4 (±0.24)% (one 312
standard error) in Set 2 experiments and 15.6 (±0.6)% in Set 3 experiments. In Set 3 313
runs, over 80% of initial sediment cover was in patches. This proportion decreased 314
as the sediment was eroded. In Set 3, the extent of sediment cover did not vary 315
systematically with the proportions of coarse and fine sediment, although the most 316
extensive covers were produced by mixtures of coarse and fine sediment. As 317
discharge increased, erosion decreased the areal extent of sediment cover. In Set 2 318
experiments, the total area occupied by patches remained approximately constant 319
until a discharge of ~ 20 l s-1, after which the area decreased approximately linearly. 320
Erosion of isolated grains commenced as soon as discharge began to increase, and 321
no isolated grains remained once discharge exceeded 25 l s-1. Set 3 experiments 322
show a similar overall pattern, although the areal extent of patches begins to 323
decrease as soon as the discharge begins to rise rather than only after a threshold 324
value as in Set 2. As in Set 2, isolated grains in Set 3 are mostly removed by a 325
discharge of 25 l s-1. In both Set 2 and Set 3, there is variability between runs, 326
reflecting specific grain arrangements that occurred as the patches developed. 327
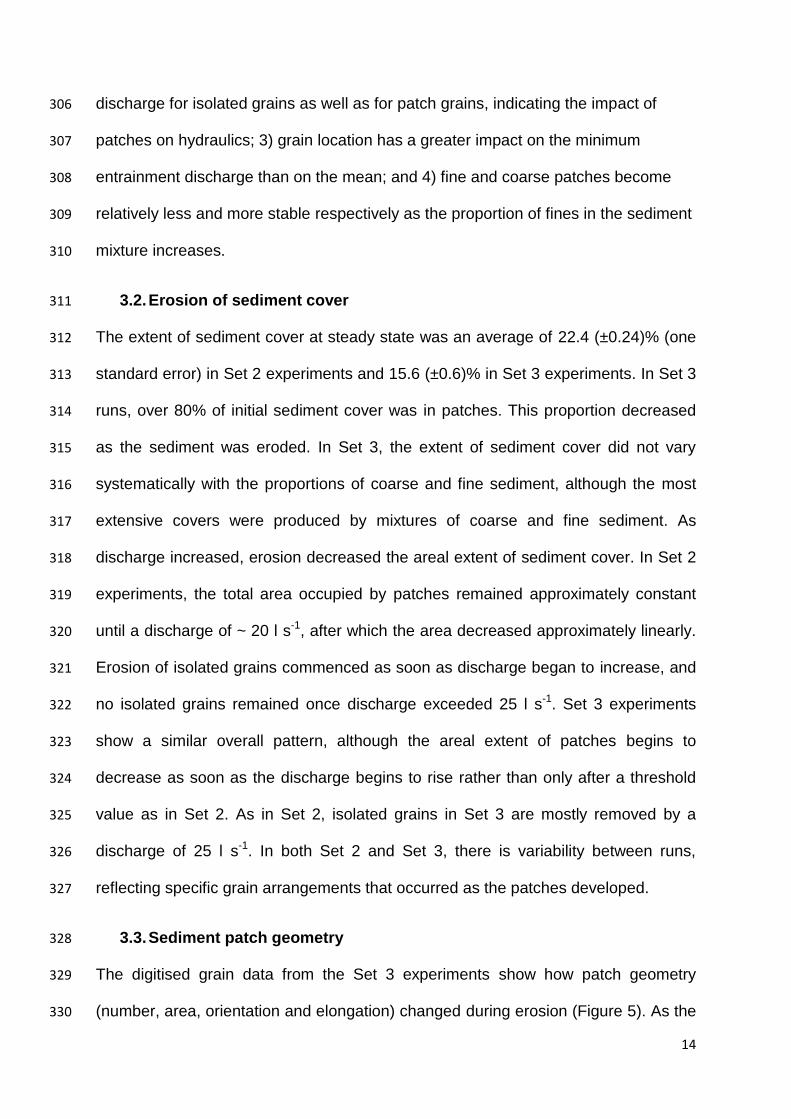
3.3. Sediment patch geometry 328
The digitised grain data from the Set 3 experiments show how patch geometry 329
(number, area, orientation and elongation) changed during erosion (Figure 5). As the 330
15
patches are eroded, there is a systematic decline in the number of patches (Figure 331
5a), and the remaining patches become more flow-aligned (Figure 5c). In most runs 332
there is a concurrent decrease in patch area (Figure 5b), but this decrease is less 333
consistent between the different runs. Finer sediment mixtures tend to have more, 334
smaller, patches. Average patch elongation (major:minor axis length, Figure 5d) has 335
an initial value of 2.4 in all runs. As erosion occurs, elongation generally remains 336
between 2 and 3, apart from a small number of runs in which significantly more 337
elongate patches develop when discharge > 20 l s-1. 338
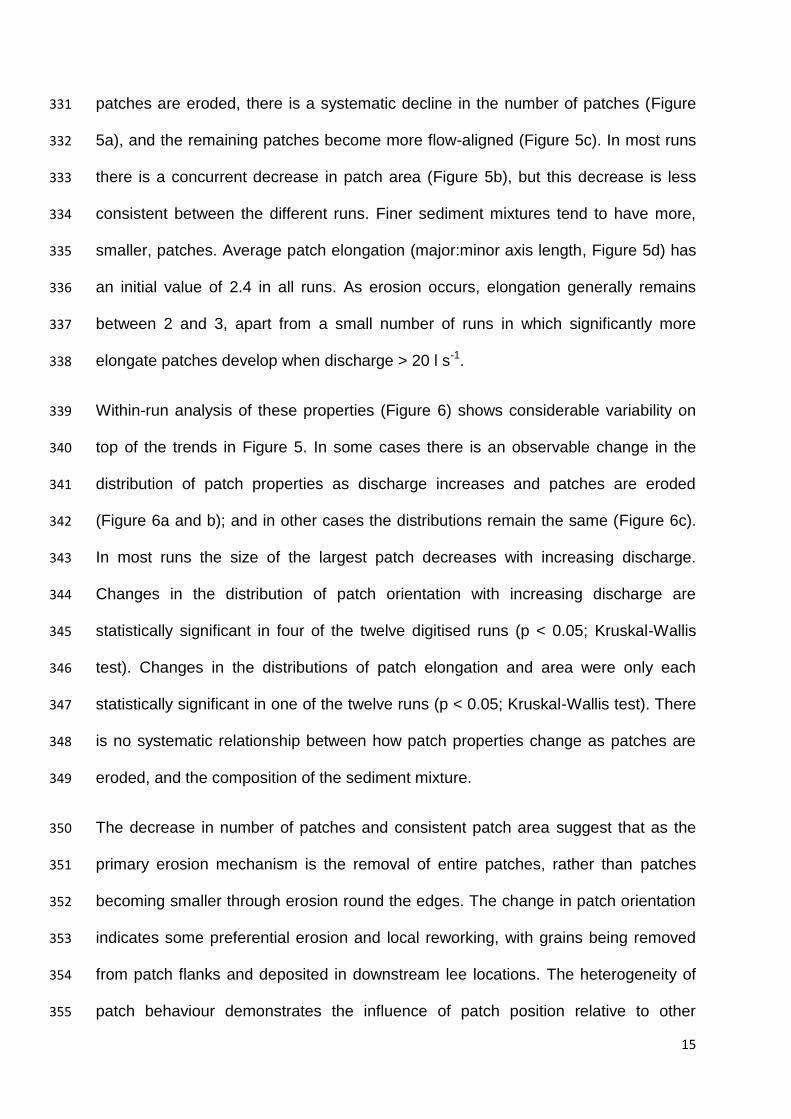
Within-run analysis of these properties (Figure 6) shows considerable variability on 339
top of the trends in Figure 5. In some cases there is an observable change in the 340
distribution of patch properties as discharge increases and patches are eroded 341
(Figure 6a and b); and in other cases the distributions remain the same (Figure 6c). 342
In most runs the size of the largest patch decreases with increasing discharge. 343
Changes in the distribution of patch orientation with increasing discharge are 344
statistically significant in four of the twelve digitised runs (p < 0.05; Kruskal-Wallis 345
test). Changes in the distributions of patch elongation and area were only each 346
statistically significant in one of the twelve runs (p < 0.05; Kruskal-Wallis test). There 347
is no systematic relationship between how patch properties change as patches are 348
eroded, and the composition of the sediment mixture. 349
The decrease in number of patches and consistent patch area suggest that as the 350
primary erosion mechanism is the removal of entire patches, rather than patches 351
becoming smaller through erosion round the edges. The change in patch orientation 352
indicates some preferential erosion and local reworking, with grains being removed 353
from patch flanks and deposited in downstream lee locations. The heterogeneity of 354
patch behaviour demonstrates the influence of patch position relative to other 355
16
patches, with sediment from upstream erosion potentially resulting in simultaneous 356
accretion and erosion. 357
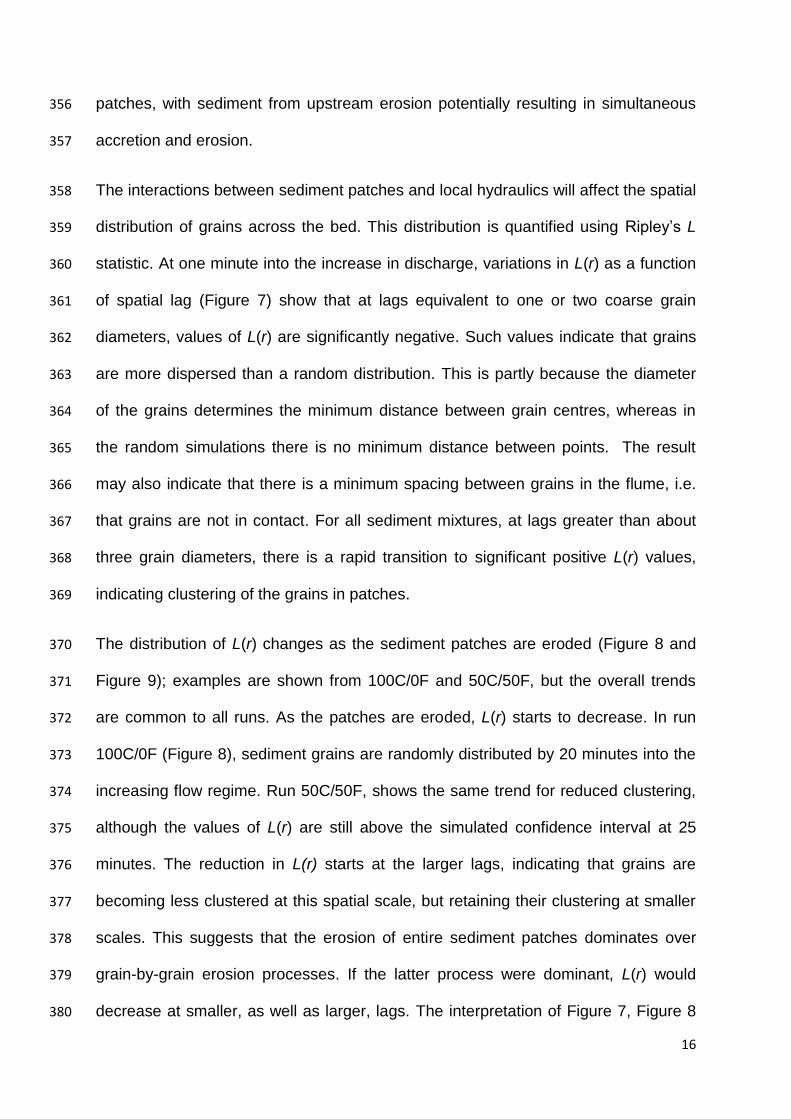
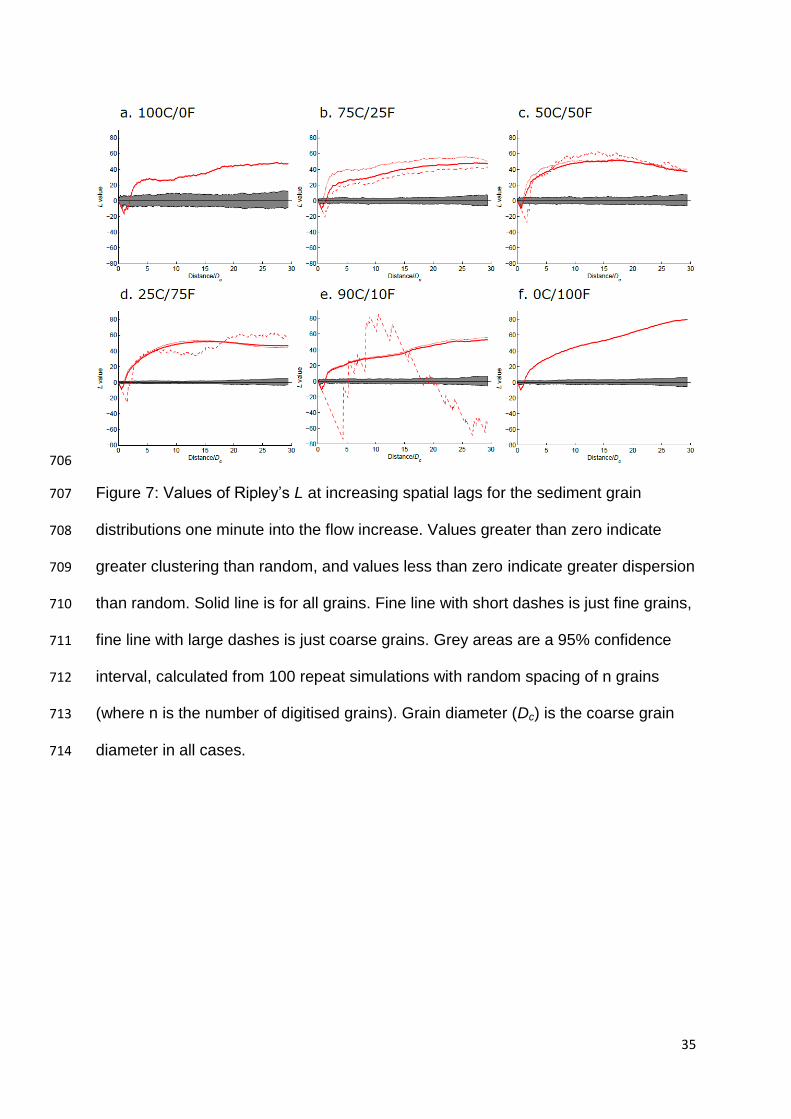
The interactions between sediment patches and local hydraulics will affect the spatial 358
distribution of grains across the bed. This distribution is quantified using Ripley’s L 359
statistic. At one minute into the increase in discharge, variations in L(r) as a function 360
of spatial lag (Figure 7) show that at lags equivalent to one or two coarse grain 361
diameters, values of L(r) are significantly negative. Such values indicate that grains 362
are more dispersed than a random distribution. This is partly because the diameter 363
of the grains determines the minimum distance between grain centres, whereas in 364
the random simulations there is no minimum distance between points. The result 365
may also indicate that there is a minimum spacing between grains in the flume, i.e. 366
that grains are not in contact. For all sediment mixtures, at lags greater than about 367
three grain diameters, there is a rapid transition to significant positive L(r) values, 368
indicating clustering of the grains in patches. 369
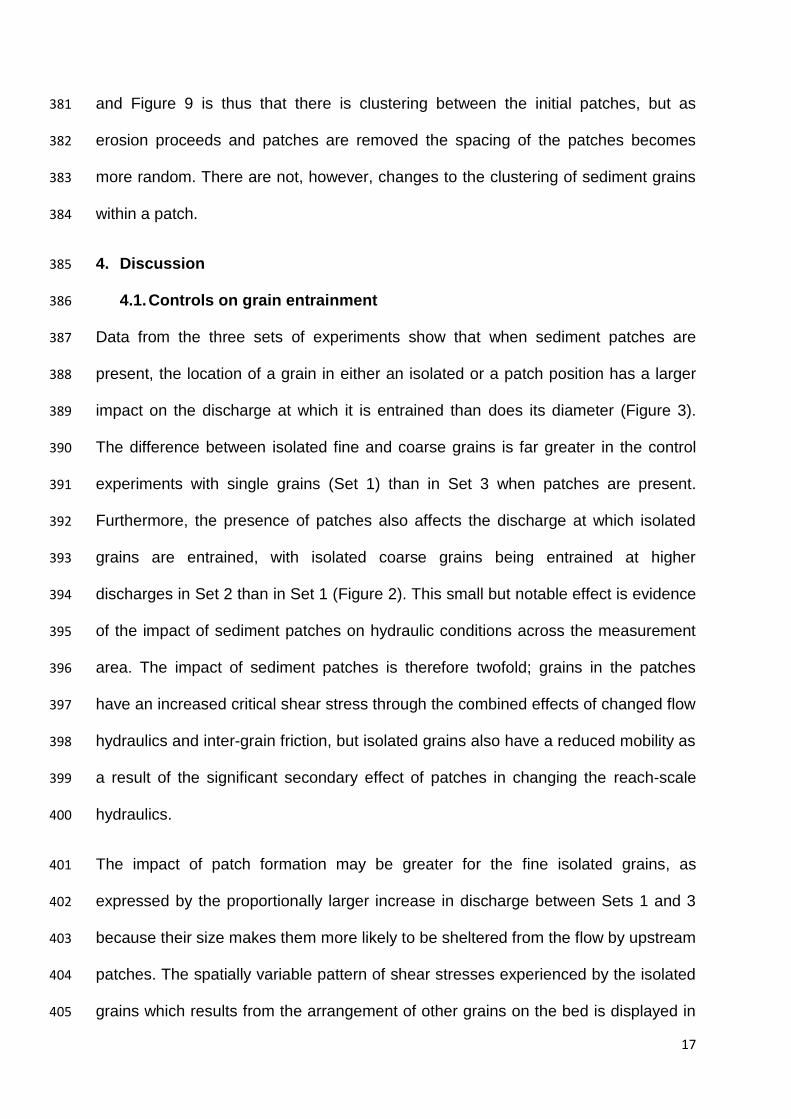
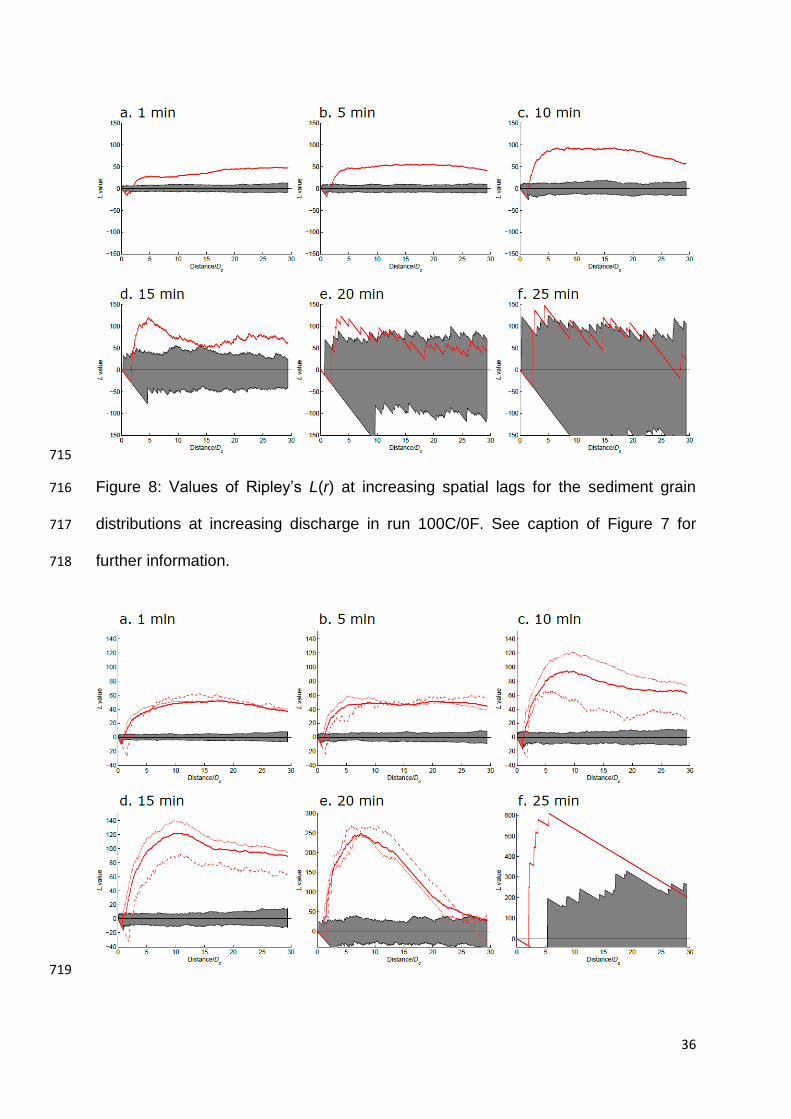
The distribution of L(r) changes as the sediment patches are eroded (Figure 8 and 370
Figure 9); examples are shown from 100C/0F and 50C/50F, but the overall trends 371
are common to all runs. As the patches are eroded, L(r) starts to decrease. In run 372
100C/0F (Figure 8), sediment grains are randomly distributed by 20 minutes into the 373
increasing flow regime. Run 50C/50F, shows the same trend for reduced clustering, 374
although the values of L(r) are still above the simulated confidence interval at 25 375
minutes. The reduction in L(r) starts at the larger lags, indicating that grains are 376
becoming less clustered at this spatial scale, but retaining their clustering at smaller 377
scales. This suggests that the erosion of entire sediment patches dominates over 378
grain-by-grain erosion processes. If the latter process were dominant, L(r) would 379
decrease at smaller, as well as larger, lags. The interpretation of Figure 7, Figure 8 380
17
and Figure 9 is thus that there is clustering between the initial patches, but as 381
erosion proceeds and patches are removed the spacing of the patches becomes 382
more random. There are not, however, changes to the clustering of sediment grains 383
within a patch. 384
4. Discussion 385
4.1. Controls on grain entrainment 386
Data from the three sets of experiments show that when sediment patches are 387
present, the location of a grain in either an isolated or a patch position has a larger 388
impact on the discharge at which it is entrained than does its diameter (Figure 3). 389
The difference between isolated fine and coarse grains is far greater in the control 390
experiments with single grains (Set 1) than in Set 3 when patches are present. 391
Furthermore, the presence of patches also affects the discharge at which isolated 392
grains are entrained, with isolated coarse grains being entrained at higher 393
discharges in Set 2 than in Set 1 (Figure 2). This small but notable effect is evidence 394
of the impact of sediment patches on hydraulic conditions across the measurement 395
area. The impact of sediment patches is therefore twofold; grains in the patches 396
have an increased critical shear stress through the combined effects of changed flow 397
hydraulics and inter-grain friction, but isolated grains also have a reduced mobility as 398
a result of the significant secondary effect of patches in changing the reach-scale 399
hydraulics. 400
The impact of patch formation may be greater for the fine isolated grains, as 401
expressed by the proportionally larger increase in discharge between Sets 1 and 3 402
because their size makes them more likely to be sheltered from the flow by upstream 403
patches. The spatially variable pattern of shear stresses experienced by the isolated 404
grains which results from the arrangement of other grains on the bed is displayed in 405
18
the difference between the minimum and mean discharges at which isolated grains 406
are entrained (Figure 3). In Set 3, isolated fine grains have the largest difference 407
between minimum and mean discharge, indicating that although many grains are 408
affected by the patches, some grains still occupy areas of the bed with similar 409
hydraulics to those in Set 1. For the coarse isolated grains and all patches, there is a 410
smaller, but notable, difference between the minimum and mean discharges, 411
indicating that there is a similar level of local shear stress variation within the patches 412
as there is in the areas surrounding them. Furthermore, the mean discharges are 413
similar in all locations, meaning that once the impact of grain geometry is accounted 414
for, the forces experienced by grains in a patch could actually be higher than those 415
experienced by isolated grains at the same discharge. This impact of the patch 416
geometry on the flow, and the overriding of grain size effects, is similar to that 417
observed in steep channels with immobile boulders by Yager et al. (2012), who also 418
found that sediment patch grain size was not always a good predictor of sediment 419
mobility. The experiments also show that the sediment composition had an impact 420
on the stability of fine and coarse patches, with patches being most stable when their 421
composition is most different to the bulk composition (e.g. fine patches are most 422
stable at 75C/25F). For fine grains, it follows that as the sediment coarsens, the 423
relative roughness of the bed will increase, and patches of fine sediment will become 424
relatively more sheltered. For coarse patches the phenomenon is harder to explain, 425
as coarse grains will become relatively more exposed as the sediment mixtures fine, 426
but may be related to the tendency of the finer sediment to form more numerous, 427
smaller, patches (Figure 5), which may more consistently increase roughness across 428
the entire measurement area. 429
4.2. Sediment cover and patch geometry 430
19
As the sediment cover is eroded, sediment patches are removed through the erosion 431
of discrete patches, and the distribution of patches across the bed becomes more 432
random. There is also some evidence that patches become more elongate and 433
aligned with the flow direction. The interaction between patches is constructive 434
(Kocurek et al., 2010), and elements of merging, cannibalization and remote transfer 435
are all seen in our experiments. However, our experiments are limited to short 436
reaches and there is no upstream feed of sediment during erosion. Should a 437
continuous feed, at a rate equal to the erosion rate from the observed reach, be 438
introduced then regeneration and self-organisation of the bedforms may occur. 439
The form of the equilibrium between patch size, flow and sediment supply is likely to 440
involve different bedform geometries under different boundary conditions (Nelson et 441
al., 2009; Dreano et al., 2010; Hodge, in press), so cannot be predicted from present 442
experiments. The process of patch removal suggests that patches may be sensitive 443
to the entrainment of key grains, either in the patch or an upstream location, which 444
change the local hydraulics and/or grain geometry. Positive feedback by which the 445
erosion of grains destabilises surrounding grains means that a patch can be rapidly 446
removed, as has been reported for particle clusters in alluvial rivers (Strom et al., 447
2004; Tan and Curran, 2012; Heays et al., 2014). Further analysis of the videos 448
could attempt to identify the size and locations of these grains. 449
4.3. Feedbacks between flow and sediment patches 450
The development and erosion of sediment patches is a function of the feedbacks 451
between flow, bed morphology and sediment transport (Werner, 2003; Kocurek et 452
al., 2010). These experiments have demonstrated that under the idealised conditions 453
in the flume, sediment patches can override the effects of grain size on grain 454
entrainment, and can influence entrainment conditions in locations beyond the patch, 455
20
as well as within the patch itself. Consequently, the patches act to equalise the 456
development and erosion of sediment cover across a range of sediment mixtures. 457
The range of entrainment discharges demonstrated by both isolated and patch 458
grains indicates that the patches induce spatial variation in flow conditions, both 459
within and between the patches. As such these results provide some insight into the 460
mechanisms by which patches self-organise, and provide physical support for rule-461
based models that have demonstrated the formation of such patches and other 462
coarse bedforms (Werner and Fink, 1993; Hodge and Hoey 2010). 463
The observed impact of sediment patches on the critical grain entrainment discharge 464
might suggest that with continual sediment supply, extensive sediment cover can 465
rapidly develop as a result of runaway feedback mechanisms (Chatanantavet and 466
Parker, 2008; Hodge and Hoey, 2010). Such cover does not occur in these 467
experiments because of the limited duration and volume of sediment input. The 468
erosion of sediment cover demonstrates the same mechanism in reverse, with rapid 469
destabilisation of sediment patches. These mechanisms suggest that bedrock-470
alluvial rivers would tend to have binary sediment cover, with either limited or 471
extensive cover, in the absence of larger-scale roughness elements that drive forced 472
patch (bar) formation. 473
However, in these experiments, the bed developed a stable sediment cover of 474
around 25% under the initial input conditions; the consistency between experiments 475
in set 2 provides evidence that this was an equilibrium configuration. The 476
development of this cover demonstrates that a relatively low spatial density of 477
sediment grains is necessary to disrupt the hydraulics and create conditions suitable 478
for the maintenance of that cover. This could suggest that under the limited and/or 479
intermittent sediment supply common to many bedrock-alluvial rivers (Lague, 2010), 480
21
partial sediment covers may be common. This is further supported by the spatially 481
variable conditions induced by the sediment cover. The observed grain entrainment 482
will reflect the conditions of areas of the bed where grains were initially deposited, 483
i.e. those with lower flow velocities. The areas between the grains may be subject to 484
local flow acceleration as a result of grain blockages in other locations, which would 485
discourage deposition in these areas and the development of complete sediment 486
cover. Such preferential pathways for bedload transport have also been observed in 487
the field and flume under conditions of reduced sediment supply (Richardson et al., 488
2003; Nelson et al., 2009). 489
4.4. Implications for bedrock-alluvial rivers 490
These experiments demonstrate that even a relatively low density of sediment grains 491
can have a significant impact on flow hydraulics and sediment patch development. 492
Consequently, relatively small inputs of sediment into a channel could have notable 493
impacts on channel roughness, flow and sediment transport. The importance of the 494
development of patches will depend on the channel topography, with patches being 495
likely to have less of an impact in channels with a rougher bedrock topography 496
(Inoue et al., 2014; Johnson, 2014). Under rough topographies, sediment patch 497
development could instead smooth the channel bed, producing a different set of 498
feedbacks. However, even within a channel with a grain-rough (sensu Inoue et al., 499
2014) topography, there will still be areas of the bed that are locally flat at a scale 500
larger than that of the sediment grains, and in these locations the relationships these 501
experiments are likely to still apply. 502
These experiments have demonstrated that a single pulse of sediment can produce 503
a partial sediment cover. There are questions as to how this behaviour upscales to a 504
bedrock river with a fluctuating discharge and sediment supply. There are also 505
22
questions about the interactions between flow, sediment cover and sediment 506
entrainment under conditions of greater partial cover. The extent to which sediment 507
patches disrupt the flow is likely to be a non-linear process, with maximum disruption 508
occurring once a large proportion of the bed is affected by the wakes from patches. 509
As cover increases further, the bed will effectively become smoother again, reducing 510
the disruption. 511
These experiments also have implications for predicting sediment transport in 512
bedrock-alluvial rivers. The limited impact of grain size on grain entrainment in the 513
experiments with patches is consistent with previous observations that in channels 514
with partial sediment cover, sediment transport is independent of grain size (Hodge 515
et al., 2011). In addition to potentially disregarding grain size, the experiments also 516
suggest that, in a mixture of isolated and patch grains, it may be appropriate to use a 517
single entrainment shear stress for both; however, this is not the case if the two 518
populations occur in distinct areas of the bed. The experiments do, however, suggest 519
that the magnitude of the critical shear stress will be a function of the extent of 520
sediment cover. 521
5. Conclusions 522
These experiments show that under idealised conditions (flat bed and maximum of 523
two grain sizes) the production and erosion of sediment patches on a flat surface is 524
affected by complex interacting processes. Isolated sediment grains away from the 525
influence of any other sediment are entrained at lower discharges than grains in 526
sediment patches. However, when sediment patches have formed in the flume, 527
isolated grains are entrained at a comparable mean discharge to grains in the 528
sediment patches. This is because of the influence of the sediment patches on the 529
local flow conditions. 530
23
The rate at which sediment patches are eroded as discharge is increased is 531
approximately linear. The main reduction in sediment cover is through removal of 532
entire patches, rather than grain-by-grain removal from patches. Sediment patches 533
are reshaped as erosion progresses, becoming more flow orientated and sometimes 534
more elongate. Grains are clustered at lags equivalent to a small number of grain 535
diameters, but over time grain spacing at larger lags becomes more random. 536
Increasing understanding of the way in which sediment cover is produced and 537
eroded on flat bedrock surfaces requires further research on the impact of sediment 538
grains on the local flow, and consequent feedbacks on sediment transport 539
processes. When there is an amount of sediment on the bed, these feedbacks 540
appear to be the dominant control on patch stability, overriding the impact of grain 541
size and whether grains are isolated or in a cluster. 542
Acknowledgements 543
Experiments in the hydraulics laboratory, University of Glasgow, had technical 544
support from Stuart McLean, Tim Montgomery and Kenny Roberts, and additional 545
help from Callum Pearson and Rebecca Smith. We thank that AE and two reviewers 546
for their useful comments. 547
548
References 549
L’Amoreaux, P., and S. Gibson (2013), Quantifying the scale of gravel-bed clusters 550
with spatial statistics, Geomorphology, 197, 56–63, 551
doi:10.1016/j.geomorph.2013.05.002. 552
Carling P. A., Hoffmann M. and A. S. Blatter (2002). Initial motion of boulders in 553
bedrock channels. In: Ancient Floods, Modern Hazards: Principles and Applications 554
24
of Paleoflood Hydrology, Water Science and Application Volume 5, pages 147-160, 555
AGU. 556
Carling P. A. and K. Tinkler (1998). Conditions for the entrainment of cuboid 557
boulders in bedrock streams: An historical review of literature with respect to recent 558
investigations. In: Rivers over Rock, AGU.Chatanantavet, P., and G. Parker (2008), 559
Experimental study of bedrock channel alluviation under varied sediment supply and 560
hydraulic conditions, Water Resour. Res., 44(12), doi:10.1029/2007WR006581. 561
Cressie, N.A.C. (1991) Statistics for Spatial Data, Wiley, New York. 562
Crocker, J.C., and D.G. Grier (1996), Methods of digital video microscopy for 563
colloidal studies, Journal of Colloid and Interface Science, 179(1) 298-310. 564
Dreano J., Valance A., Lague D. and C. Cassar (2010). Experimental study on 565
transient and steady-state dynamics of bedforms in supply limited configuration. 566
Earth Surf. Process. Landforms 35, 1730-1743, doi: 10.1002/esp.2085 567
Finnegan, N. J., L. S. Sklar, and T. K. Fuller (2007), Interplay of sediment supply, 568
river incision, and channel morphology revealed by the transient evolution of an 569
experimental bedrock channel, J. Geophys. Res., 112(F3), 570
doi:10.1029/2006JF000569. 571
Hajek, E. A., P. L. Heller, and B. A. Sheets (2010), Significance of channel-belt 572
clustering in alluvial basins, Geology, 38(6), 535–538, doi:10.1130/G30783.1. 573
Heays, K. G., H. Friedrich, and B. W. Melville (2014), Laboratory study of gravel-bed 574
cluster formation and disintegration, Water Resources Research, 50(3), 575
doi:10.1002/2013WR014208. 576
25
Hodge, R. A. (in press), Sediment processes in bedrock-alluvial rivers: Research 577
since 2010 and modelling the impact of fluctuating sediment supply on sediment 578
cover, Gravel Bed Rivers 8: Gravel Bed Rivers and Disasters, edited by J. Laronne 579
and D. Tsutsumi, Wiley. 580
Hodge, R. A., and T. B. Hoey (2012), Upscaling from grain-scale processes to 581
alluviation in bedrock channels using a cellular automaton model, Journal of 582
Geophysical Research: Earth Surface, 117, F01017, doi:10.1029/2011JF002145. 583
Hodge R. A., and T. B. Hoey (in revision), The impact of topography in a bedrock-584
alluvial channel: 2. Sediment cover, J. Geophys. Res., 585
Hodge, R. A., T. B. Hoey, and L. S. Sklar (2011), Bedload transport in bedrock 586
rivers: the role of sediment cover in grain entrainment, translation and deposition, J. 587
Geophys. Res., doi:10.1029/2011JF002032. 588
Inoue, T., N. Izumi, Y. Shimizu, and G. Parker (2014), Interaction among alluvial 589
cover, bed roughness and incision rate in purely bedrock and alluvial-bedrock 590
channel, J. Geophys. Res. Earth Surf., 2014JF003133, doi:10.1002/2014JF003133. 591
Johnson, J. P. L. (2014), A surface roughness model for predicting alluvial cover and 592
bed load transport rate in bedrock channels, J. Geophys. Res. Earth Surf., 593
2013JF003000, doi:10.1002/2013JF003000. 594
Johnson, J. P. L., and K. X. Whipple (2010), Evaluating the controls of shear stress, 595
sediment supply, alluvial cover, and channel morphology on experimental bedrock 596
incision rate, J. Geophys. Res., 115, F02018, doi:201010.1029/2009JF001335. 597
26
Kocurek, G., Ewing, R.C. and D. Mohrig (2010), How do bedform patterns arise? 598
New views on the role of bedform interactions within a set of boundary conditions, 599
Earth Surf. Process. Landforms 35, 51–63, DOI: 10.1002/esp.1913 600
Krumbein, W. C. (1941) Measurement and geological significance of shape and 601
roundness of sedimentary particles. J. Sedimentary Research 11 (2), 64-72. 602
Lacey, R. W. J., and A. G. Roy (2008), The spatial characterization of turbulence 603
around large roughness elements in a gravel-bed river, Geomorphology, 102(3–4), 604
542–553, doi:10.1016/j.geomorph.2008.05.045. 605
Lague, D. (2010), Reduction of long-term bedrock incision efficiency by short-term 606
alluvial cover intermittency, J. Geophys. Res., 115, doi:10.1029/2008JF001210. 607
Lisle, T.E. (1995) Particle-size variations between bed-load and bed material in 608
natural gravel-bed channels, Water Res. Res. 31, 1107-18, doi: 609
10.1029/94WR02526 610
Nelson P. A., Venditte J. G., Dietrich W. E., Kirchner J. W., Ikeda H., Iseya F., and 611
L.S. Sklar (2009). Response of bed surface patchiness to reductions in sediment 612
supply. J. Geophys. Res. 114, F02005, doi: 10.1029/2008JF001144 613
Nelson, P. A., and G. Seminara (2012), A theoretical framework for the 614
morphodynamics of bedrock channels, Geophys. Res. Lett., 39, L06408, 615
doi:201210.1029/2011GL050806. 616
Papanicolaou, A. N., C. M. Kramer, A. G. Tsakiris, T. Stoesser, S. Bomminayuni, 617
and Z. Chen (2012), Effects of a fully submerged boulder within a boulder array on 618
the mean and turbulent flow fields: Implications to bedload transport, Acta Geophys., 619
60(6), 1502–1546, doi:10.2478/s11600-012-0044-6. 620
27
Richardson K., Benson I. and P. A. Carling (2003). An instrument to record sediment 621
movement in bedrock channels. In: Erosion and Sediment transport measurement in 622
rivers: Technological and methodological advances (Proceedings of the Oslo 623
Workshop, June 2002). IAHS Publ. 283, 2003. 624
Seminara, G. (2010), Fluvial Sedimentary Patterns, Annual Review of Fluid 625
Mechanics, 42, 43-66. 626
Siddiqui, A and Robert, A. (2010), Thresholds of erosion and sediment movement in 627
bedrock channels, Geomorphology, 118, 301-13, doi: 628
10.1016/j.geomorph.2010.01.011 629
Sklar, L. S., and W. E. Dietrich (2004), A mechanistic model for river incision into 630
bedrock by saltating bed load, Water Resources Research, 40, W06301, 631
doi:10.1029/2003WR002496. 632
Strom, K., A. N. Papanicolaou, E. Evangelopoulos, and M. Odeh (2004), Microforms 633
in Gravel Bed Rivers: Formation, Disintegration, and Effects on Bedload Transport, 634
Journal of Hydraulic Engineering, 130(6), 554–567, doi:10.1061/(ASCE)0733-635
9429(2004)130:6(554). 636
Strom, K., and A. Papanicolaou (2007), ADV Measurements around a Cluster 637
Microform in a Shallow Mountain Stream, Journal of Hydraulic Engineering, 133(12), 638
1379–1389, doi:10.1061/(ASCE)0733-9429(2007)133:12(1379). 639
Tan, L., and J. Curran (2012) Comparison of turbulent flows over clusters of varying 640
density, Journal of Hydraulic Engineering 138 (12), 1031-1044. 641
28
Turowski, J. M., N. Hovius, A. Wilson, and M.-J. Horng (2008), Hydraulic geometry, 642
river sediment and the definition of bedrock channels, Geomorphology, 99), 26–38, 643
doi:10.1016/j.geomorph.2007.10.001. 644
Turowski, J. M., D. Lague, and N. Hovius (2007), Cover effect in bedrock abrasion: A 645
new derivation and its implications for the modeling of bedrock channel morphology, 646
J. Geophys. Res., 112(F4), doi:10.1029/2006JF000697. 647
Werner B.T. (2003), Modeling landforms as self-organized, hierarchical dynamical 648
systems. In Prediction in Geomorphology, Wilcock PR, Iverson RM (eds). 649
Geophysical Monograph 135, American Geophysical Union: Washington; 133–150 650
Werner, B. T., and T. M. Fink (1993), Beach cusps as self-organized patterns, 651
Science, 260(5110), 968–971. 652
Wohl, E.E. (2015), Particle dynamics: the continuum of alluvial to bedrock river 653
segments, Geomorphology 241, 192-208, doi:10.1016/j.geomorph.2015.04.014 654
655
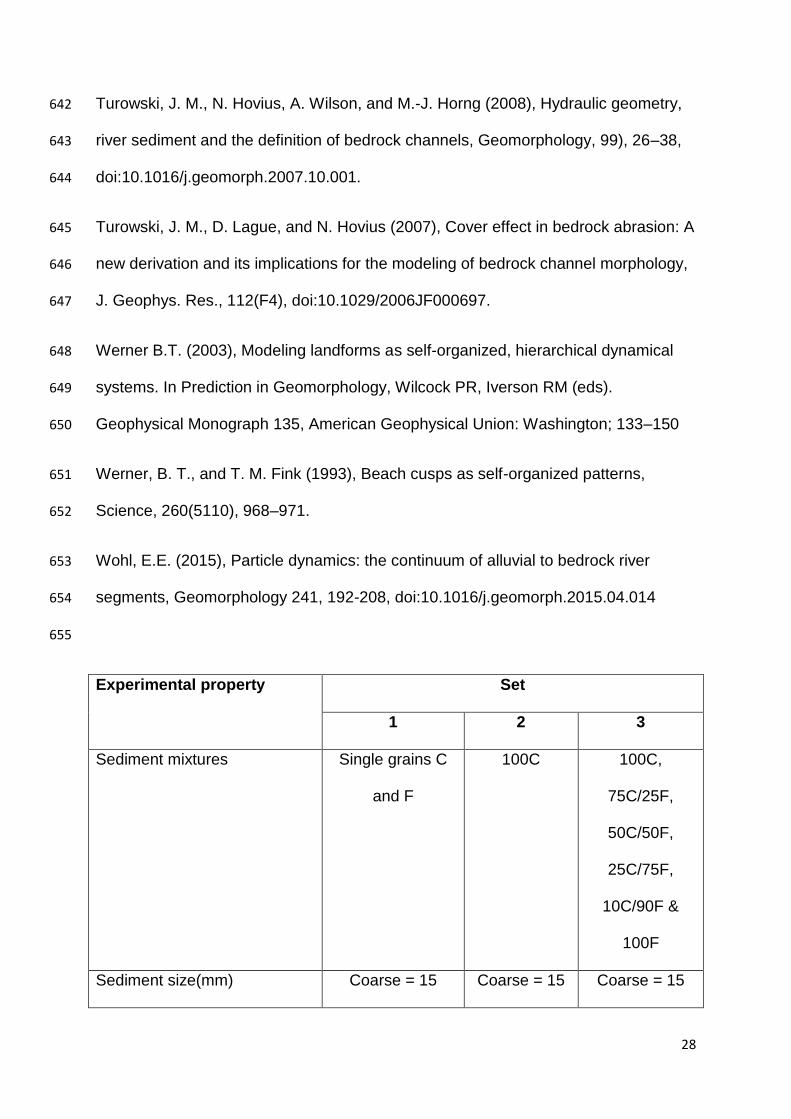
Experimental property Set
1 2 3
Sediment mixtures Single grains C
and F
100C 100C,
75C/25F,
50C/50F,
25C/75F,
10C/90F &
100F
Sediment size(mm) Coarse = 15 Coarse = 15 Coarse = 15
29
Fine = 8.5 Fine = 8.5
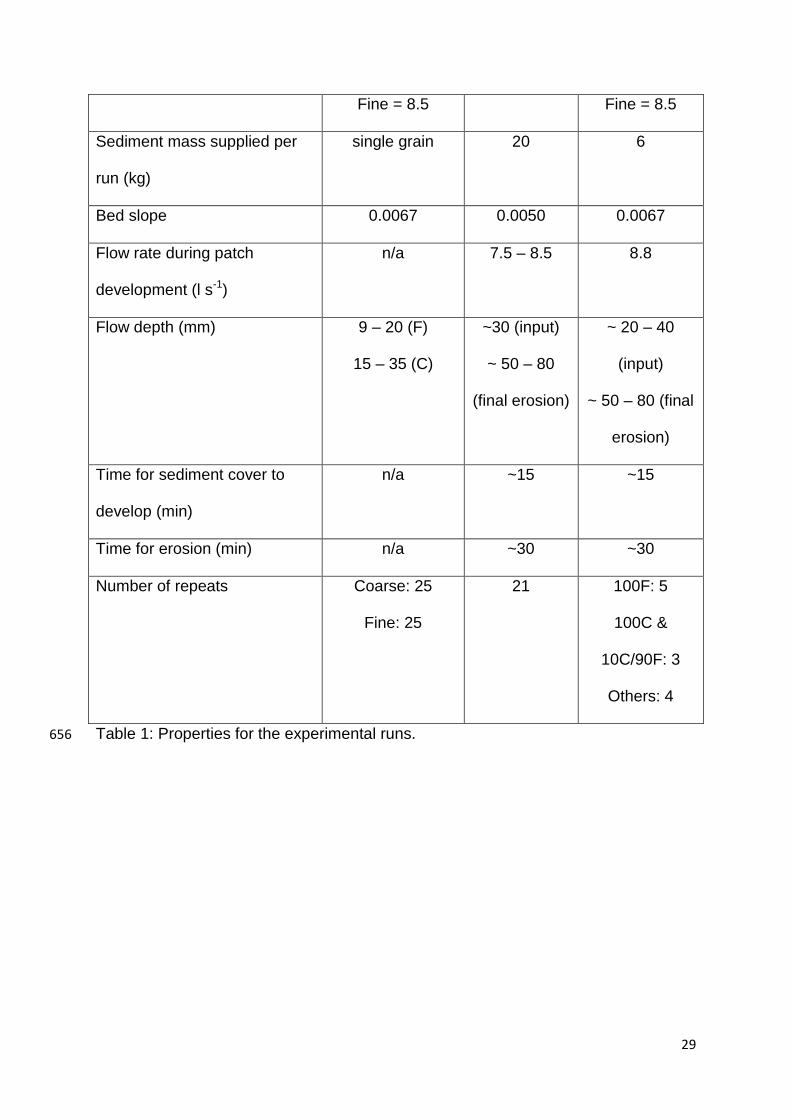
Sediment mass supplied per
run (kg)
single grain 20 6
Bed slope 0.0067 0.0050 0.0067
Flow rate during patch
development (l s-1)
n/a 7.5 – 8.5 8.8
Flow depth (mm) 9 – 20 (F)
15 – 35 (C)
~30 (input)
~ 50 – 80
(final erosion)
~ 20 – 40
(input)
~ 50 – 80 (final
erosion)
Time for sediment cover to
develop (min)
n/a ~15 ~15
Time for erosion (min) n/a ~30 ~30
Number of repeats Coarse: 25
Fine: 25
21 100F: 5
100C &
10C/90F: 3
Others: 4
Table 1: Properties for the experimental runs. 656
30
657
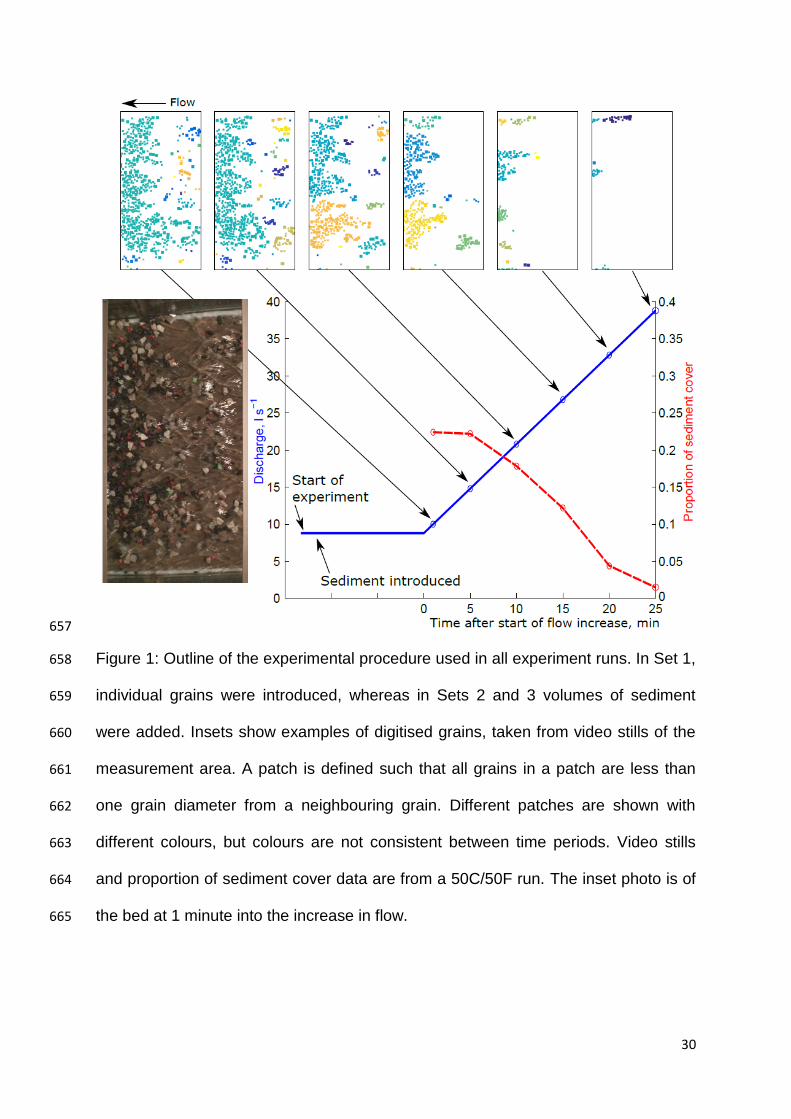
Figure 1: Outline of the experimental procedure used in all experiment runs. In Set 1, 658
individual grains were introduced, whereas in Sets 2 and 3 volumes of sediment 659
were added. Insets show examples of digitised grains, taken from video stills of the 660
measurement area. A patch is defined such that all grains in a patch are less than 661
one grain diameter from a neighbouring grain. Different patches are shown with 662
different colours, but colours are not consistent between time periods. Video stills 663
and proportion of sediment cover data are from a 50C/50F run. The inset photo is of 664
the bed at 1 minute into the increase in flow. 665
31
666
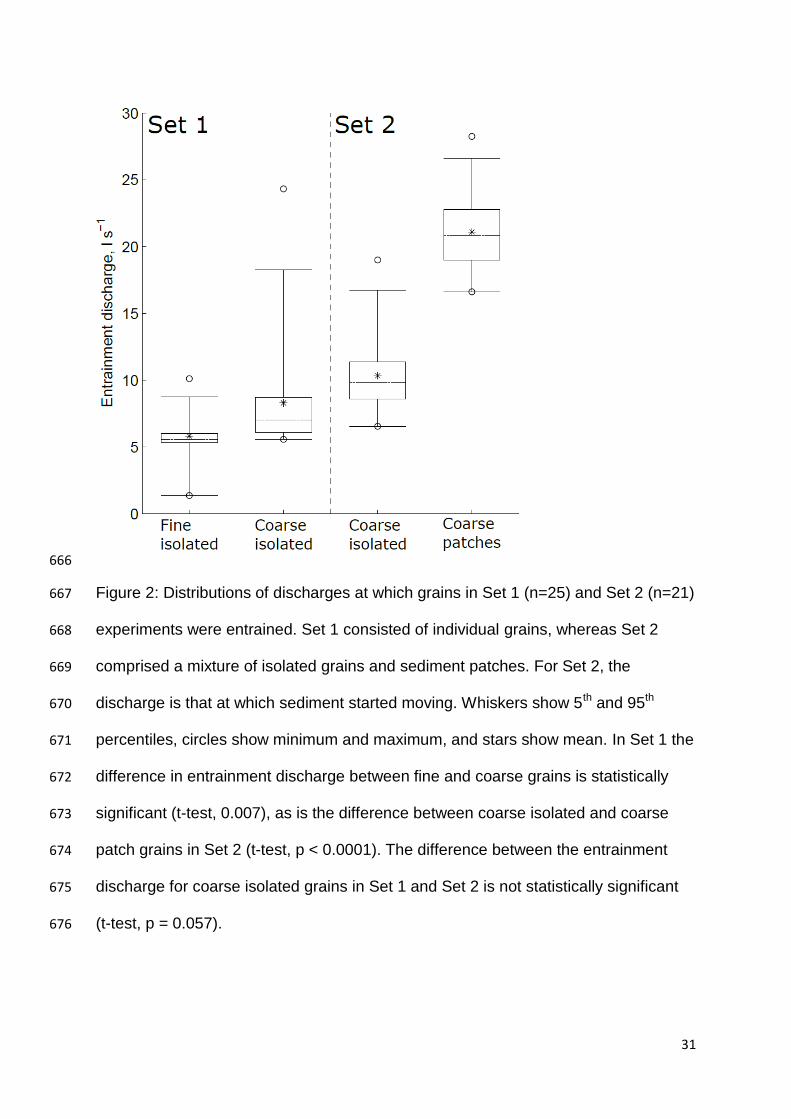
Figure 2: Distributions of discharges at which grains in Set 1 (n=25) and Set 2 (n=21) 667
experiments were entrained. Set 1 consisted of individual grains, whereas Set 2 668
comprised a mixture of isolated grains and sediment patches. For Set 2, the 669
discharge is that at which sediment started moving. Whiskers show 5th and 95th 670
percentiles, circles show minimum and maximum, and stars show mean. In Set 1 the 671
difference in entrainment discharge between fine and coarse grains is statistically 672
significant (t-test, 0.007), as is the difference between coarse isolated and coarse 673
patch grains in Set 2 (t-test, p < 0.0001). The difference between the entrainment 674
discharge for coarse isolated grains in Set 1 and Set 2 is not statistically significant 675
(t-test, p = 0.057). 676
32
677
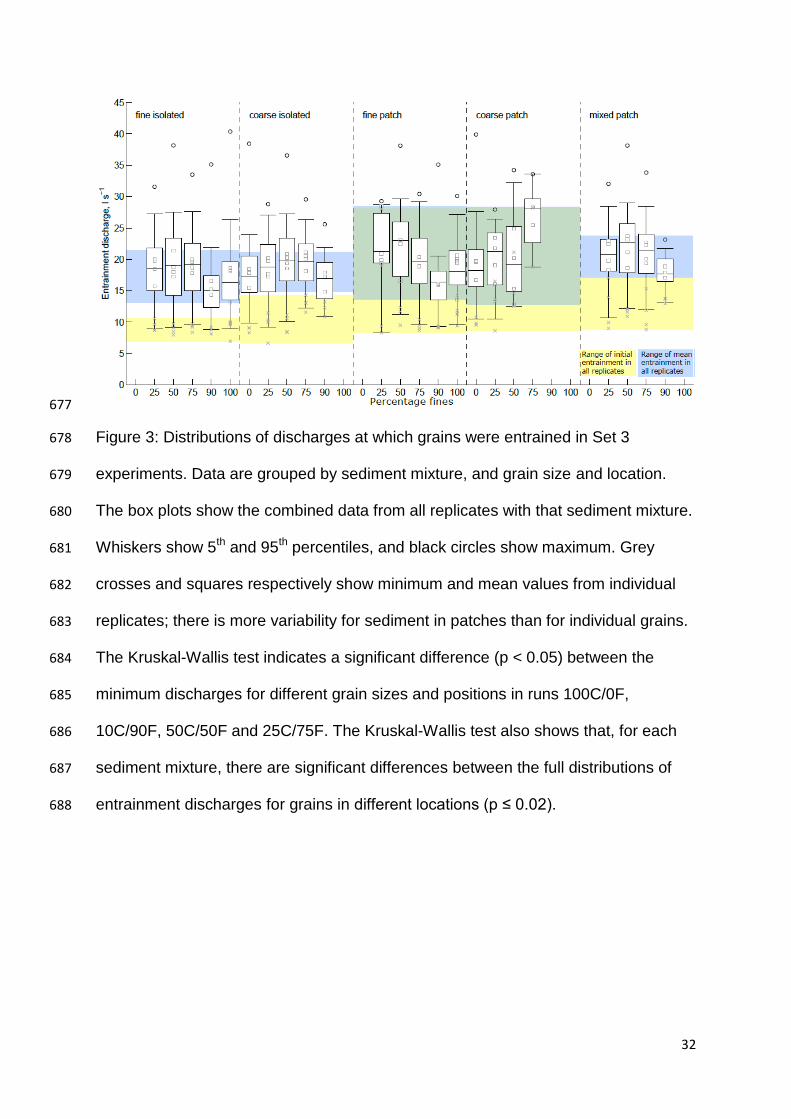
Figure 3: Distributions of discharges at which grains were entrained in Set 3 678
experiments. Data are grouped by sediment mixture, and grain size and location. 679
The box plots show the combined data from all replicates with that sediment mixture. 680
Whiskers show 5th and 95th percentiles, and black circles show maximum. Grey 681
crosses and squares respectively show minimum and mean values from individual 682
replicates; there is more variability for sediment in patches than for individual grains. 683
The Kruskal-Wallis test indicates a significant difference (p < 0.05) between the 684
minimum discharges for different grain sizes and positions in runs 100C/0F, 685
10C/90F, 50C/50F and 25C/75F. The Kruskal-Wallis test also shows that, for each 686
sediment mixture, there are significant differences between the full distributions of 687
entrainment discharges for grains in different locations (p ≤ 0.02). 688
33
689
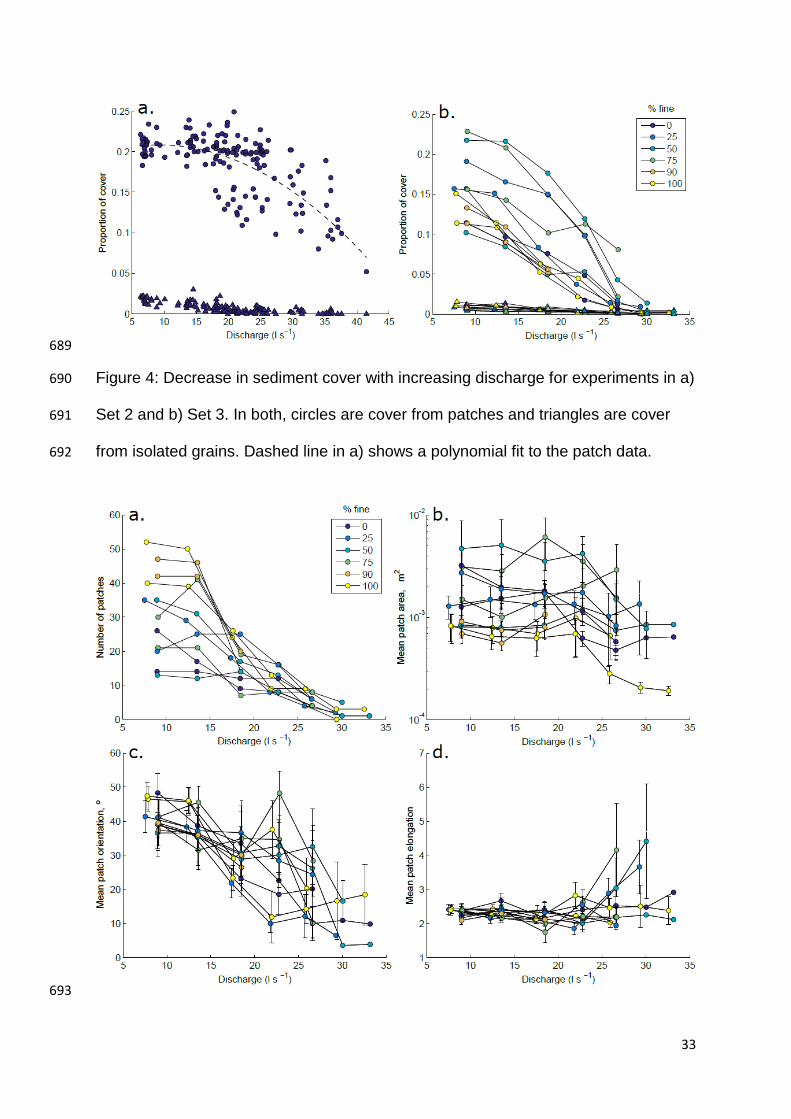
Figure 4: Decrease in sediment cover with increasing discharge for experiments in a) 690
Set 2 and b) Set 3. In both, circles are cover from patches and triangles are cover 691
from isolated grains. Dashed line in a) shows a polynomial fit to the patch data. 692
693
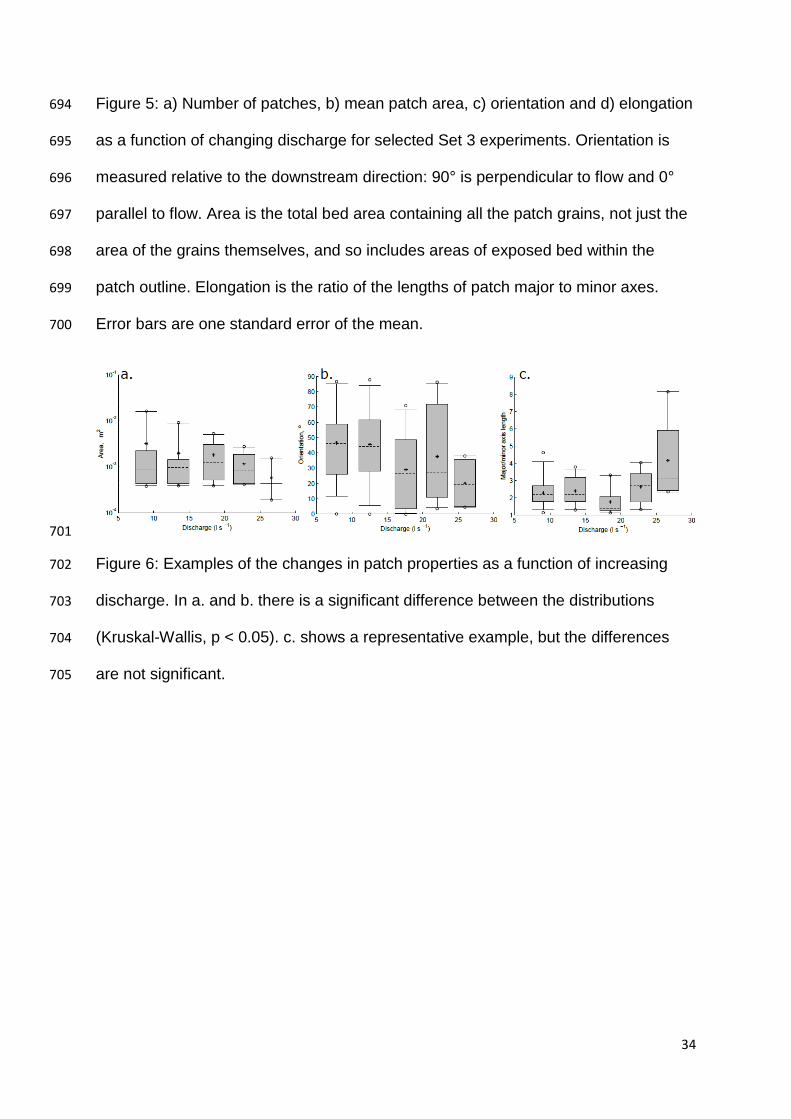
34
Figure 5: a) Number of patches, b) mean patch area, c) orientation and d) elongation 694
as a function of changing discharge for selected Set 3 experiments. Orientation is 695
measured relative to the downstream direction: 90° is perpendicular to flow and 0° 696
parallel to flow. Area is the total bed area containing all the patch grains, not just the 697
area of the grains themselves, and so includes areas of exposed bed within the 698
patch outline. Elongation is the ratio of the lengths of patch major to minor axes. 699
Error bars are one standard error of the mean. 700
701
Figure 6: Examples of the changes in patch properties as a function of increasing 702
discharge. In a. and b. there is a significant difference between the distributions 703
(Kruskal-Wallis, p < 0.05). c. shows a representative example, but the differences 704
are not significant. 705
35
706
Figure 7: Values of Ripley’s L at increasing spatial lags for the sediment grain 707
distributions one minute into the flow increase. Values greater than zero indicate 708
greater clustering than random, and values less than zero indicate greater dispersion 709
than random. Solid line is for all grains. Fine line with short dashes is just fine grains, 710
fine line with large dashes is just coarse grains. Grey areas are a 95% confidence 711
interval, calculated from 100 repeat simulations with random spacing of n grains 712
(where n is the number of digitised grains). Grain diameter (Dc) is the coarse grain 713
diameter in all cases. 714
36
715
Figure 8: Values of Ripley’s L(r) at increasing spatial lags for the sediment grain 716
distributions at increasing discharge in run 100C/0F. See caption of Figure 7 for 717
further information. 718
719
37
Figure 9: Values of Ripley’s L(r) at increasing spatial lags for the sediment grain 720
distributions at increasing discharge in run 50C/50F. See caption of Figure 7 for 721
further information. Note different vertical axis scales in e. and f. 722
723